

SUMMARY
Resident microbes in skin and gut predominantly impact local immune cell function during homeostasis. However, colitis-associated neutrophilic skin disorders suggest possible breakdown of this compartmentalization with disease. Using a model wherein neonatal skin colonization by Staphylococcus epidermidis facilitates generation of commensal-specific tolerance and CD4+ regulatory T cells (Tregs), we ask whether this response is perturbed by gut inflammation. Chemically induced colitis is accompanied by intestinal expansion of S. epidermidis and reduces gut-draining lymph node (dLN) commensal-specific Tregs. It also results in reduced commensal-specific Tregs in skin and skin-dLNs and increased skin neutrophils. Increased CD4+ circulation between gut and skin dLN suggests that the altered cutaneous response is initiated in the colon, and resistance to colitis-induced effects in Cd4creIl1r1fl/fl mice implicate interleukin (IL)-1 in mediating the altered commensal-specific response. These findings provide mechanistic insight into observed connections between inflammatory skin and intestinal diseases.
Graphical Abstract

In brief
Merana et al. show that intestinal inflammation in adult mice undermines previously established immune tolerance to skin commensal bacteria, specifically leading to increased skin neutrophils and reduced percentages of S. epidermidis-specific regulatory T cells (Tregs) in the skin and in skin-draining lymph nodes.
INTRODUCTION
Both the intestinal tract and skin house complex microbial communities and resident immune cell populations. In these tissues, adaptive immune tolerance to commensal bacteria is initiated by early life exposures that support expansion of commensal-specific regulatory T cell (Treg) populations (Kitamoto et al., 2020; Scharschmidt et al., 2015, 2017). Such tolerance is essential for immune homeostasis, as demonstrated by the inflammatory consequences of disrupting early life host-microbe interactions (Al Nabhani et al., 2019; Russell et al., 2012). While subsequent loss of adaptive immune tolerance toward microbial antigens could result in increased barrier-site inflammation and disease, factors that are predisposed to loss of commensal-specific tolerance to skin bacteria remain poorly defined.
Relationships between tissue-resident immune cells and microbes involve a delicate balance between effector CD4+ T cells (Teffs), which support antimicrobial defense, and Foxp3+ CD4+ Tregs that curb excessive inflammation. For a given antigen, the ratio between these two populations, rather than the absolute number of Tregs, appears to be critical in maintaining tolerance and preventing inflammation (Rosenblum et al., 2016; Su et al., 2016). CD4+ T cells responsive to tissue-resident bacteria span a phenotypic continuum (Kiner et al., 2021), influenced by microbial identity, colonization timing, and local inflammatory cues (Hand et al., 2012; Leech et al., 2019). In the intestinal tract and skin, commensal-specific CD4+ cells tend to be enriched for type 17 helper T (Th17) cells and Tregs (Atarashi et al., 2011; Harrison et al., 2019; Horai et al., 2015; Mazmanian et al., 2005; Round and Mazmanian, 2010; Scharschmidt et al., 2015).
Under homeostatic conditions, tissue-resident microbes are thought to have a dominant impact on local immune cell function (Belkaid and Harrison, 2017; Durack and Lynch, 2019). Prevailing dogma holds that in health, “compartmentalization” exists between the intestinal tract and skin. In a seminal mouse study, the number and function of cutaneous CD4+ T cells was substantially influenced by colonization with skin commensal Staphylococcus epidermidis (S. epidermidis) but not by oral gavage with segmented filamentous bacteria nor antibiotic-mediated depletion of gut microbes (Naik et al., 2012). Disease can weaken such compartmentalization (Akdis, 2021; Ayres, 2016). Acute intestinal infection in mice results in systemic dissemination of commensal-specific CD4+ Teffs (Hand et al., 2012). In humans, alterations in the gut microbiome are linked to extra-intestinal diseases including asthma, rheumatoid arthritis, and multiple sclerosis (Durack and Lynch, 2019). Notably, inflammatory bowel disease (IBD), wherein genetic and environmental factors predispose a person to microbiome alteration and gut inflammation, is associated with neutrophilic skin dermatoses, such as pyoderma gangrenosum. While shared genetic features may increase the risk of simultaneous skin and gut disease (Marzano et al., 2014), there is evidence that gut microbiome perturbation can be closely tied to skin inflammation (Myers et al., 2019; Song et al., 2016).
Here, we chose to explore whether intestinal inflammation affects adaptive immune tolerance to skin commensal bacteria. Utilizing our system to track S. epidermidis-specific CD4+ T cells following neonatal colonization (Scharschmidt et al., 2015) and two colitis models (Kattah et al., 2018; Wirtz et al., 2017), we tested the hypothesis that intestinal inflammation can disrupt previously established adaptive immune tolerance to skin commensals. We demonstrate that in adult mice, acute colitis (but not acute systemic inflammation) decreases the S. epidermidis-specific Treg response in skin and skin-draining lymph nodes (dLNs) and predisposes to neutrophilic skin infiltration. This is associated with an augmented gut CD4+ response to S. epidermidis that is skewed towards Teffs. We show that colitis enhances gut-to-skin LN trafficking of CD4+ T cells, that inhibition of lymphocyte circulation rescues the skin S. epidermidis-specific Treg response, and that interleukin (IL)-1R1 signaling on T cells facilitates the relative reduction in S. epidermidis-specific Tregs during colitis.
RESULTS
Colitis alters the cutaneous antigen-specific CD4+ response to S. epidermidis
We first sought to address whether acute intestinal inflammation influences immune cell populations present in skin and skin-dLNs. Adult wild-type (WT) specific-pathogen-free (SPF) mice were subjected to dextran sodium sulfate (DSS)-mediated colitis (3.5% DSS in drinking water for 5 days), resulting in acute intestinal inflammation (Wirtz et al., 2017) and decreased colon length (Figure S1A). Skin and skin-dLNs were analyzed on day 10 by flow cytometry to quantify immune populations (Figure S1B). No significant differences between DSS and control mice were seen, including IL-17A- or interferon gamma (IFNγ)-producing CD4+ T cells (Figures S1C–S1F) or neutrophils (Figures S1G and S1H). This suggests that acute murine colitis alone is insufficient to disrupt immune compartmentalization between gut and skin.
We next explored the possibility of pathergy, wherein minor skin trauma exacerbates existing or triggers new skin inflammation (Kutlubay et al., 2017), by testing the effect of an additional skin-directed signal in this same model. Adult murine back skin was tape stripped to minimally abrade the epidermis (Scharschmidt et al., 2015) on days 0, 3, and 6 concurrent with DSS or water administration before harvest on day 10. Tape stripping elicited a heightened neutrophil response in skin of SPF DSS mice but not in germ-free (GF) DSS mice (Figure S1I), despite equivalent development of colitis (Figures S1J and S1K). This suggests that the presence of skin and gut commensals and some degree of skin injury are necessary to prompt a skin inflammatory response during concurrent intestinal challenge.
We have previously shown that neonatal skin colonization with a model antigen (2W)-expressing strain S. epidermidis (S. epi)-2W results in antigen-specific tolerance characterized by a high percentage of 2W+ Tregs in skin and skin-dLNs. Upon S. epi-2W re-exposure and skin tape stripping in adult life, this tolerance supports reduced histologic skin inflammation and skin neutrophil infiltration (Scharschmidt et al., 2015). To test the hypothesis that colitis may alter skin immune response to S. epi-2W, we colonized WT SPF mice on post-natal days 7, 10, and 13 to establish a Treg-enriched S. epi-specific 2W+ CD4+ compartment (Scharschmidt et al., 2015). These mice were then re-challenged with S. epi-2W plus tape stripping as adults, with one experimental group receiving DSS and the other normal drinking water (Figure 1A). As expected, the DSS group developed fulminant colitis, with weight loss (Figure 1B) and decreased colon length at day 10 (Figure 1C). Both groups mounted comparable memory responses to S. epi-2W (Figure 1D), as reflected by equivalent percentages and numbers of 2W+CD44+CD4+ T cells in skin-dLNs (Figures 1E, 1F, and S2A) and skin (Figure S2B). However, the quality of the S. epi-2W-specific CD4+ response in DSS mice versus controls was altered (Figure 1G), with a decreased percentage and number of 2W+ Tregs in skin-dLNs (Figures 1H and S2C) and a decreased percentage of 2W+ Treg in skin (Figure 1I). In contrast, the percentages of polyclonal Tregs in skin-dLNs (Figure 1J) and skin (Figure 1K) were not reduced. The skin of DSS-treated mice also demonstrated an increase in IL-17A-producing CD4+ T cells (Figure 1L), with no changes in IFNγ- and IL-13-producing CD4+ T cells, polyclonal CD4+ and CD8+ T cells, 5-OP-5U tetramer+ MAIT cells, or dermal γδ T cells (Figures S2D–S2H). Although there was no histological difference in skin inflammation by H&E staining in DSS mice (Figure S2I), there was an increase in skin neutrophils as assessed by flow cytometry (Figure 1M), skin myeloperoxidase activity (Figure 1N), and immunohistochemical staining of skin for Ly6G+ cells (Figures S2J and S2K), corroborating the colitis-induced disruption of cutaneous tolerance to S. epidermidis. Figures S1
Figure 1. Colitis alters the cutaneous antigen-specific CD4+ response to S. epidermidis.
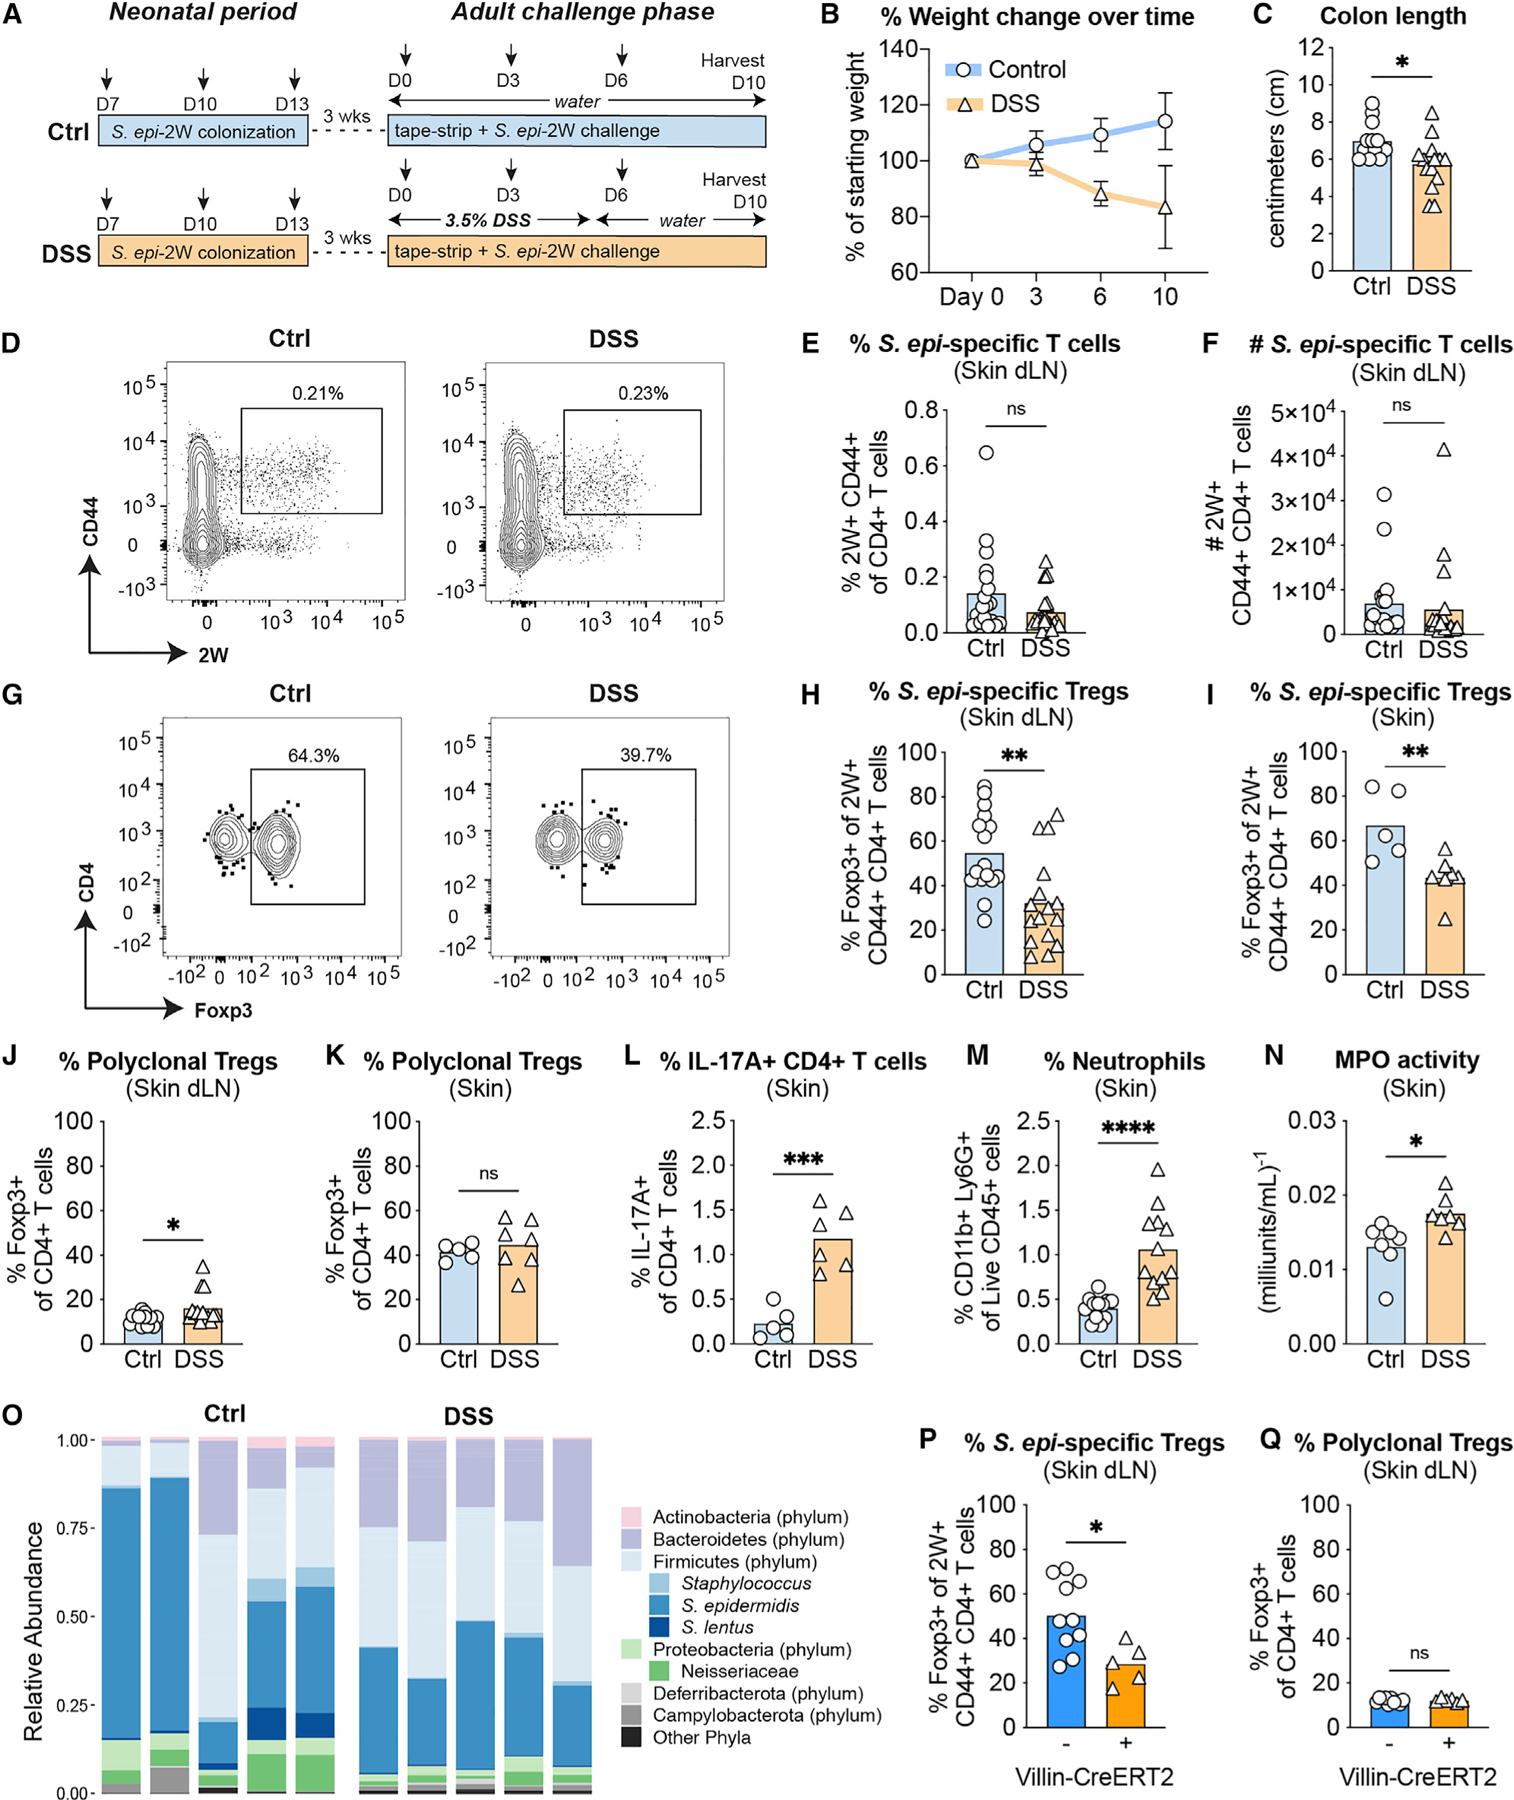
(A) WT mice were colonized with S. epi-2W on postnatal days 7, 10, and 13 before induction of DSS colitis and re-challenge with S. epi-2W plus superficial skin abrasion 3 weeks later.
(B and C) Weight loss and reduced colon length in DSS colitis.
(D) Representative flow cytometry plots of 2W+CD44+ cells gated on live CD45+DUMP−TCRβ+CD4+ from tetramer-enriched fraction in skin-dLNs from control or DSS mice on day 10 of the re-challenge phase.
(E and F) Percentage and absolute number of 2W+CD44+CD4+ T cells in skin-dLNs.
(G) Representative flow cytometry plots of Foxp3+ cells gated on 2W+CD44+ from the same tetramer-enriched fractions in (D).
(H and I) Percentage of Foxp3+2W+CD44+CD4+ T cells in skin-dLNs and skin.
(J and K) Percentage of Foxp3+CD4+ T cells in skin-dLNs and skin.
(L) Percentage of IL-17A+ cells gated on live CD45+CD3+GL3−TCRβ+CD4+Foxp3 in skin.
(M) Percentage of Ly6G+CD11b+ cells gated on live CD45+ in skin.
(N) Myeloperoxidase (MPO) enzyme activity in skin.
(O) Relative abundance of major phyla and select species from skin swabs of DSS versus control mice on day 10 of re-challenge.
(P and Q) Villin-Cre+ and Villin-Cre mice were colonized with S. epi-2W on postnatal days 7, 10, and 13 before i.p. tamoxifen injection and re-challenge with S. epi-2W 3 weeks later. Percentage of Foxp3+2W+CD44+CD4+ T cells and Foxp3+CD4+ T cells in skin-dLNs.
Each point represents an individual mouse. All data above are representative of 2–4 independent experiments with at least 3 mice per group. p values correlate with symbols as follows: ns, not significant, p > 0.05, *p ≤ 0.05, **p ≤ 0.01, ***p ≤ 0.001, ****p ≤ 0.0001.
To assess the potential impact of colitis on the diversity of skin commensals, we performed longitudinal V1-V3 16S rRNA sequencing on mouse skin during the 10-day challenge. Changes in skin microbialcommunity composition following colitis induction were apparent as early as day 3 and persisted until day 10 (Figure S2L). While overall structure of the skin microbiome community was largely preserved across both groups, DSS treatment did result in an increased proportion of bacteria belonging to the Bacteroidetes phylum (Figure 1O). To further explore differences in S. epidermidis relative abundance across groups, we performed qPCR on day-10 skin using primers specific for S. epidermidis (Mastronardi and Ramírez-Arcos, 2007). These studies revealed a decrease in the absolute abundance of S. epidermidis (Figure S2M), but not total bacteria (Figure S2N), on skin of DSS mice.
To test whether disruption of the antigen-specific response to S. epi-2W was generalizable to other models of colitis, we utilized a genetic model wherein inducible intestinal epithelial cell-specific mutations in two IBD-associated genes results in acute gut inflammation (Kattah et al., 2018). A20fl/fl Abinfl/+ Villin-CreERT2 Tg+ (Villin-Cre+) and A20fl/fl Abinfl/+ Villin-CreERT2 Tg- (Villin-Cre−) SPF mice were colonized as neonates with S. epi-2W. As adults, they were then injected intraperitoneally (i.p.) with tamoxifen to induce Cre-mediated recombination during concurrent cutaneous re-challenge with S. epi-2W plus tape stripping. The Villin-Cre+ group developed fulminant colitis, with appreciable weight loss (Figure S2O) and decreased colon length (Figure S2P). At harvest on day 10, both groups mounted comparable memory responses to S. epi-2W, as reflected by equivalent percentages (Figure S2Q) and numbers (Figure S2R) of 2W+CD44+CD4+ T cells in skin-dLNs. Similar to DSS mice, there was a decreased percentage of S. epi-2W-specific Tregs evident in skin-dLNs (Figure 1P) compared with Villin-Cre− mice, while the percentage of polyclonal Tregs in skin-dLNs was unchanged (Figure 1Q). Collectively, these studies suggest that both chemically and genetically initiated colitis in tandem with skin injury shifts the commensal-specific CD4+ T cell response in skin and skin-dLN away from a Tregs towards a Teff-dominant phenotype. While not accompanied by major shifts in skin microbiota composition, this alterated commensal-specific response is accompanied by increased skin Th17 cells and neutrophils.
Acute systemic inflammation alone is not sufficient to alter the antigen-specific response to S. epidermidis
To probe the mechanisms involved in disrupting tolerance to S. epi-2W, we utilized a modified lipopolysaccharide (LPS)-induced sepsis model (Lehner et al., 2001) in adult WT SPF mice to ask whether acute systemic inflammation alone was sufficient to alter the antigen-specific response. We selected this model, which typically involves a 10 mg/kg i.p. LPS challenge resulting in death 3–4 days later (Cao et al., 2019; Napier et al., 2019), as it recapitulates the acute increase in systemic pro-inflammatory cytokines and circulating neutrophils and monocytes seen in the DSS model but without gut-barrier breach. However, we modified this model to sustain systemic inflammation over a period of 10 days, allowing us to concurrently assess S. epi-2W-specific CD4+ T cell responses. After titrating the LPS to match DSS-induced weight loss, we injected one group of mice i.p. with 2 mg/kg LPS and another group with PBS during the S. epi-2W re-challenge period (Figure 2A). The LPS-injected mice developed fulminant inflammation, with weight loss (Figure 2B) and neutrophilic infiltration into the spleen (Figure 2C) and skin-dLNs (Figure 2D) on day 10. Levels of serum cytokines and chemokines approximated those observed in our DSS model (Figures 2E–2H). Examination of the percentange and number of 2W+CD44+CD4+ T cells in skin-dLNs on day 10 post-challenge showed S. epi-2W-specific responses of comparable magnitude in LPS- and PBS-injected mice (Figures 2I and 2J). Moreover, the quality of the S. epi-2W response in LPS-treated mice did not change, with both groups showing an equivalent percentage of 2W+ Tregs in skin-dLNs (Figure 2K) and comparable numbers of skin neutrophils (Figure 2L). To test whether repeated LPS exposure could skew the commensal-specific response, we injected mice i.p. with 1 mg/kg LPS or PBS on days 0, 3, and 6 of the re-challenge period (Figure 2M) and found that both groups showed equivalent percentages of S. epi-2W-specific Tregs in skin-dLNs (Figure 2N). As DSS colitis is accompanied by gut-barrier breach leading to free circulation of luminal antigens, we next injected mice i.p with LPS and heat-killed S. epi-2W on days 0, 3, and 6 of re-challenge. Additional circulating 2W antigen was not sufficient, however, to decrease the percentage of 2W+ Tregs in LPS-treated mice (Figure 2O), suggesting that acute systemic inflammation alone is insufficient to influence skin commensal-specific CD4+ T cell responses.
Figure 2. Acute systemic inflammation alone is not sufficient to alter the antigen-specific response to S. epidermidis.

(A) WT mice were colonized with S. epi-2W on postnatal days 7, 10, and 13 before one i.p. injection with LPS (2 mg/kg) and re-challenge with S. epi-2W 3 weeks later.
(B) Weight loss in LPS sepsis model.
(C and D) Percentage of Ly6G+CD11b+ cells gated on live CD45+ in spleen and skin-dLNs.
(E–H) Serum levels of pro-inflammatory cytokines and chemokines by multiplexed ELISA.
(I and J) Percentage and absolute number of 2W+CD44+CD4+ T cells in skin-dLNs.
(K) Percentage of Foxp3+2W+CD44+CD4+ T cells in skin dLN.
(L) Percentage of Ly6G+CD11b+ cells gated on live CD45+ in skin.
(M) Percentage of Foxp3+2W+CD44+CD4+ T cells in skin-dLNs in mice receiving 3 i.p. injections with LPS (1 mg/kg) and re-challenge with S. epi-2W.
(N) WT mice were colonized with S. epi-2W on postnatal days 7, 10, and 13 before 3 i.p. injections with LPS (1 mg/kg), with or without i.p. injection of heat-killed S. epi-2W, and cutaneous re-challenge with S. epi-2W 3 weeks later.
(O) Percentage of Foxp3+2W+CD44+CD4+ T cells in skin-dLNs.
Each point represents an individual mouse. All data above are representative of 2–4 independent experiments with at least 2 mice per group. p values correlate with symbols as follows: ns, not significant, p > 0.05, *p ≤ 0.05, **p ≤ 0.01, ***p ≤ 0.001, ****p ≤ 0.0001.
Colitis, but not acute systemic inflammation, alters the intestinal CD4+ T cell response to S. epidermidis
Although best recognized as a human skin commensal, S. epidermidis has a less widely appreciated niche in the neonatal intestine (Adlerberth et al., 2006). We found S. epi-2W present in the colon of neonatal WT mice colonized on the skin 7 days earlier, and this was accompanied by expansion of 2W+ cells in the colon lamina propria (LP) (Figures 3A, 3B, and S3A). To explore the gut microbiome composition of adult mice subjected to colitis and S. epi-2W re-challenge, we performed V4 16S rRNA sequencing of colon-sourced stool from control or DSS mice on day 10 post-challenge. We found reduced alpha and beta diversity in DSS mice (Figures 3C and 3D) and changes in relative abundance of Bacteroides and Alloprevotella (Figures 3E, S3C, and S3D), as previously reported in this model (Bloom et al., 2011; de Bruyn et al., 2018). Prevalence of Staphylococcus spp. increased in DSS mice by 16S rRNA sequencing (Figure 3F), and absolute levels of live S. epi-2W colony-forming units (CFUs) were elevated in the colon-sourced stool of DSS mice compared with controls (Figure 3G).
Figure 3. Colitis, but not acute systemic inflammation, alters the intestinal CD4+ T cell response S. epidermidis.
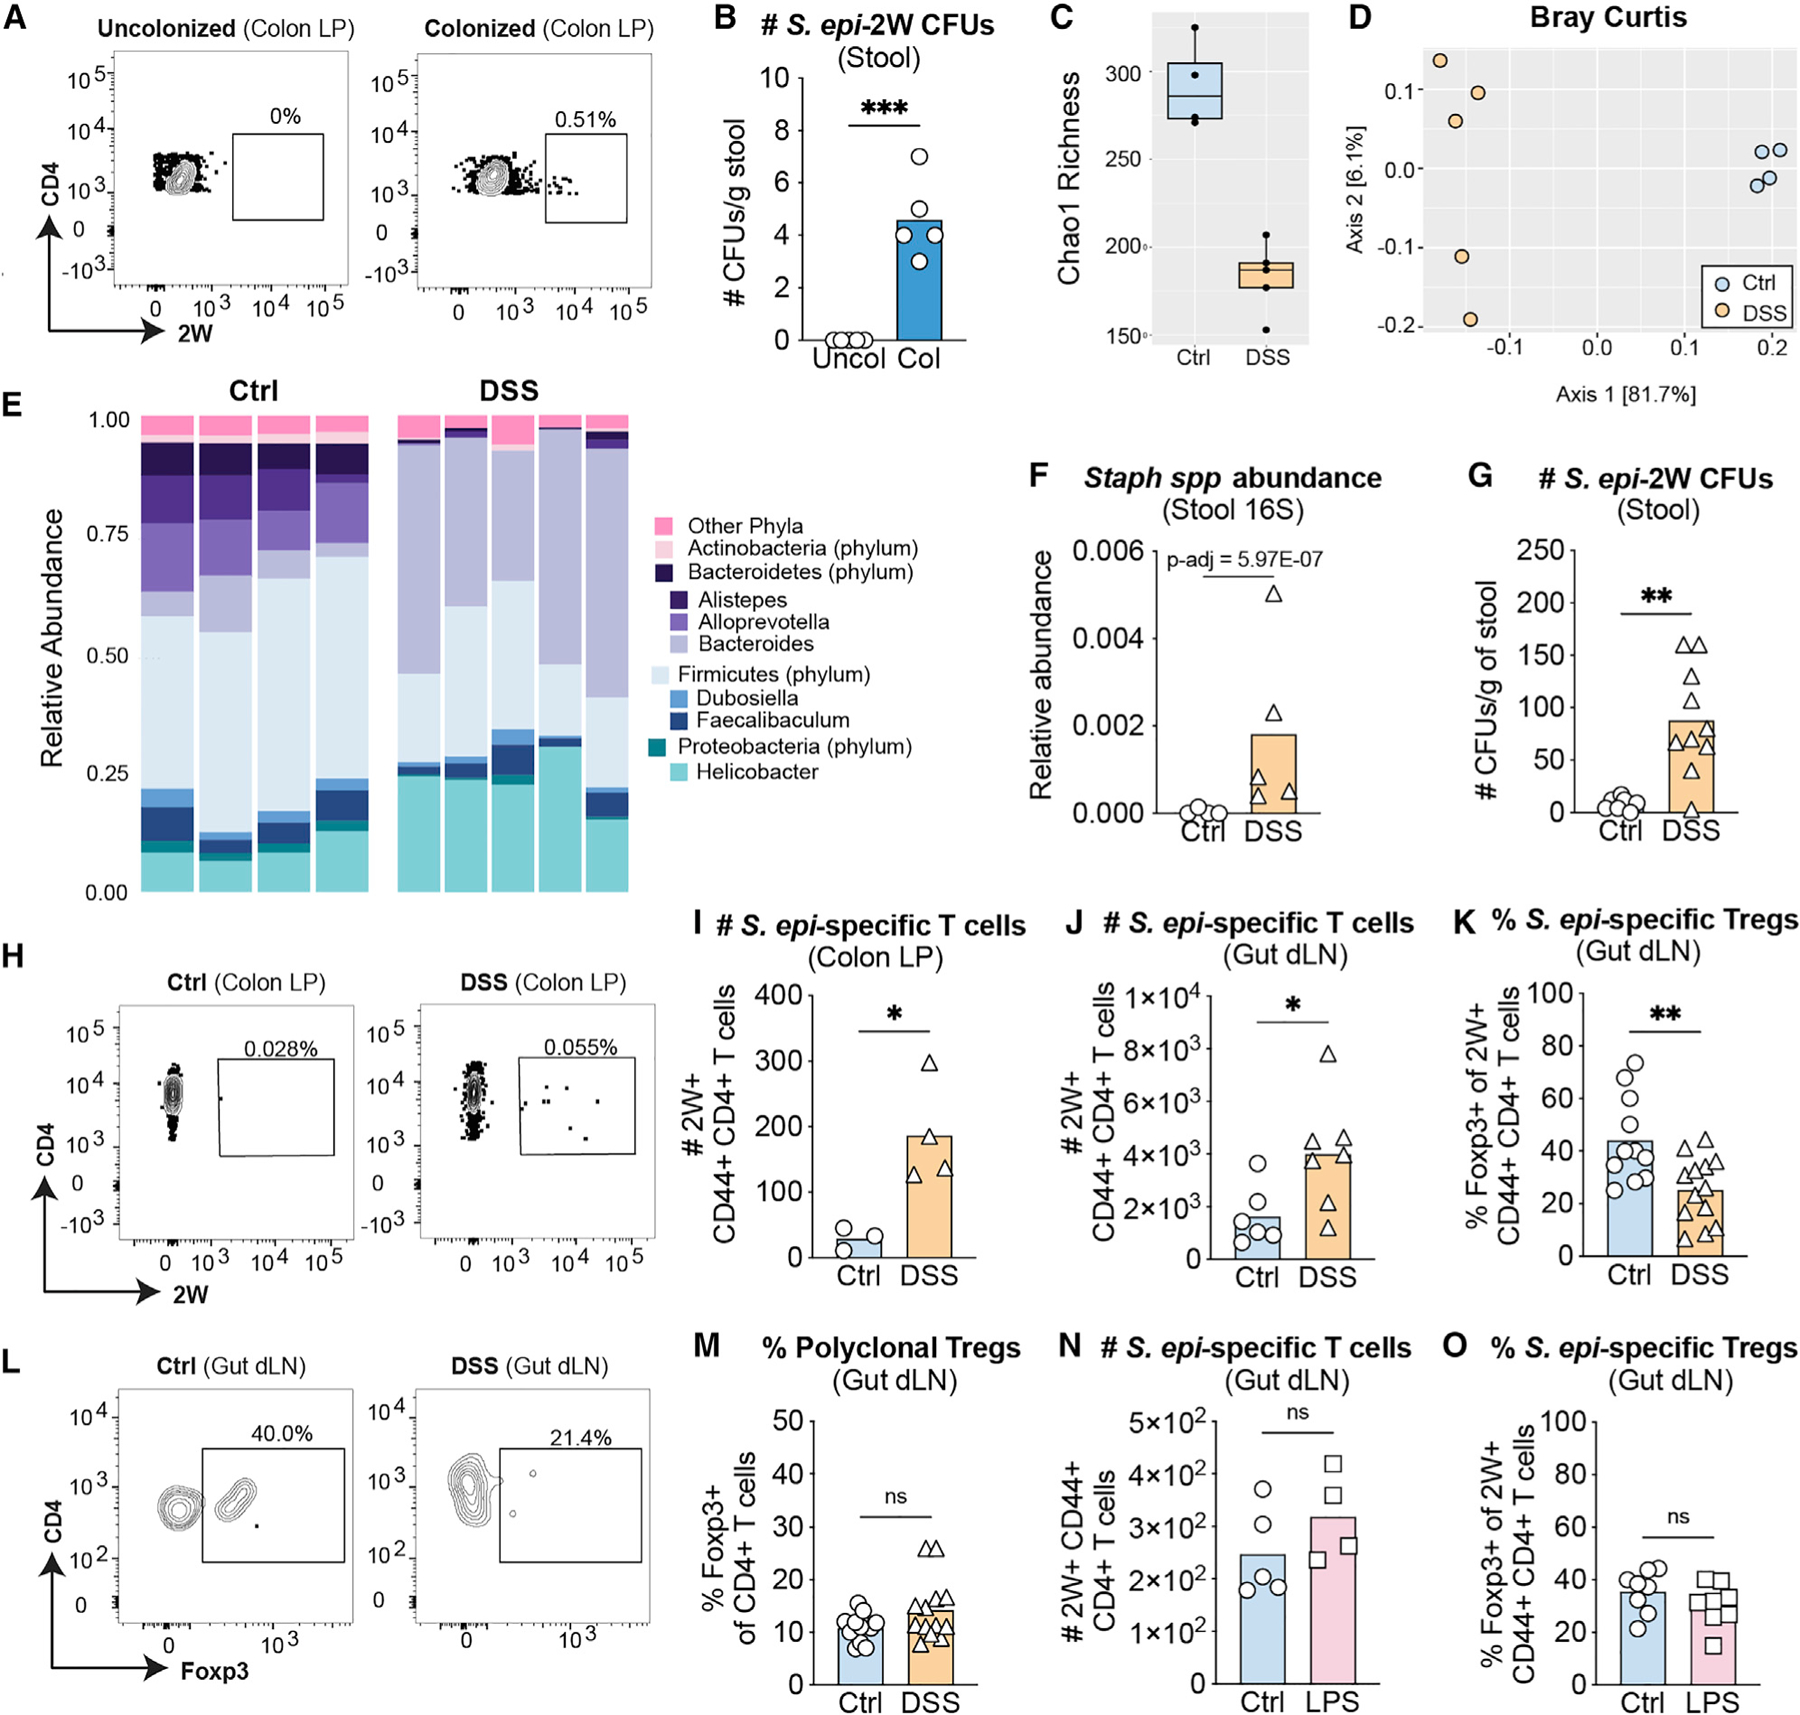
(A) Representative flow-cytometry plots of 2W+CD44+ cells gated on live CD45+DUMP−TCRβ+CD4+ from colon lamina propria (LP) from 24-day-old mice with or without prior S. epi-2W colonization on postnatal days 7, 10, and 13.
(B) Absolute number of colony forming units (CFUs) from stool obtained directly from the colon of 24-day-old mice colonized with S. epi-2W on postnatal days 7, 10, and 13.
(C) Alpha diversity in stool of control (Ctl) or DSS mice measured by Chao1 richness index.
(D) Beta diversity in stool of Ctl or DSS mice measured by Bray-Curtis index.
(E) Relative abundance of major phyla and selected genera in stool from colon of Ctl versus DSS mice on day 10 of re-challenge.
(F) Relative abundance of Staphylococcus spp. at this same time point. Adjusted p value derived from DESeq2 analysis as described in methods.
(G) S. epidermidis CFUs in stool obtained directly from the colon of adult Ctl or DSS mice.
(H) Representative flow-cytometry plots of 2W+CD44+ cells gated on live CD45+DUMP−TCRβ+CD4+ from colon LP of adult mice at day 10 of re-challenge.
(I and J) Absolute number of CD4+ T cells and 2W+CD44+CD4+ T cells gated on live CD45+CD3+GL3−TCRβ+ in colon LP and gut-dLNs.
(K) Percentage of Foxp3+2W+CD44+CD4+ T cells in gut-dLNs from Ctl or DSS groups.
(L) Representative flow-cytometry plots of 2W+CD44+ cells gated on live CD45+DUMP−TCRβ+CD4+ from tetramer-enriched fraction in gut-dLNs of adult mice at day 10 of re-challenge.
(M) Percentage of Foxp3+CD4+ T cells in gut-dLNs.
(N) Absolute number of 2W+CD44+CD4+ T cells gated on live CD45+CD3+GL3−TCRβ+ in gut-dLNs from Ctl or LPS-injected groups.
(O) Percentage of Foxp3+2W+CD44+CD4+ T cells in gut-dLNs.
Each point represents an individual mouse. All data above are representative of 3 independent experiments with 2–3 mice per group. p values correlate with symbols as follows: ns, not significant, p > 0.05, *p ≤ 0.05, **p ≤ 0.01, ***p ≤ 0.001, ****p ≤ 0.0001.
We then asked whether antigen-specific CD4+ responses to S. epidermidis occur in the gut concurrently with those in skin. Using the same experimental approach (Figure 1A), we examined T cell responses in the colon LP and gut-dLNs of DSS versus control mice. Development of disease in the acute DSS model is not T cell dependent (Wirtz et al., 2017), but we found expansion of polyclonal- (Figures S3D and S3E) and 2W- (Figures 3I and 3J) CD4+ T cells in the colon LP and gut-dLNs of DSS mice on day 10. There was also a colitis-associated decrease in the percentage of S. epi-2W-specific Tregs in gut-dLNs (Figures 3K and 3L) but not in the polyclonal Treg population (Figure 3M). To understand the specificity of this response to colitis, we examined the gut S. epi-2W-specific CD4+ T cell response in our modified LPS sepsis model (Figure 2A). This revealed no differences in the number of polyclonal (Figure S3F) or 2W+CD44+ CD4+ T cells (Figure 3N) nor in the quality of the response to S. epi-2W in gut-dLNs of LPS-injected mice (Figure 3O and S3G). These results suggest that DSS-induced colitis, but not LPS-induced sepsis, results in differential local responses to gut S. epi-2W.
To define the specific contribution of gut S. epidermidis to antigen-specific immune responses in the skin, we performed DSS experiments in which mice were orally gavaged with chloramphenicol to selectively deplete S. epi-2W in the gut (Figures S3H and S3I), while maintaining colitis intensity (data not shown). This did not lead to a recovery in S. epi-2W-specific Tregs in skin-dLNs (Figure S3J). qPCR results revealed equivalent levels of S. epidermidis DNA in both groups, suggesting that the presence of 2W antigen from dead S. epi-2W (Figure S3K) could be driving gut-centric 2W-specific responses during DSS treatment in antibiotic-gavaged mice.
Colitis augments trafficking of intestinal T cells to the skin-dLNs during skin re-challenge with S. epidermidis
The increase in gut S. epi-2W-specific CD4+ T cells in DSS mice and their parallel skewing toward an Teff versus Treg response prompted us to examine the possibility that trafficking of CD4+ cells from gut to skin contributes to the altered cutaneous S. epi-2W-specific response. We employed an in vitro antigen-presenting cell (APC)-T cell co-culture assay to determine whether colitis led to accumulation of gut-bacteria-reactive CD4+ T cells in skin dLN. CD4+ T cells isolated from skin-dLNs of DSS or control mice were labelled with cell trace dye, co-cultured with splenic APCs pulsed with stool from DSS-treated WT SPF mice (Figure 4A), and their proliferation after 48 h in response to these gut microbial antigens was assessed using flow cytometry. Skin-dLN CD4+ T cells from DSS mice showed strikingly increased proliferation in response to stool antigen compared with donor cells from controls (Figure 4B). This difference was not elicited in the absence of stool or in response to gnotobiotic stool or the irrelevant antigen ovalbumin (OVA) (Figure S4A), suggesting enhanced reactivity specifically to gut microbes.
Figure 4. Colitis augments trafficking of intestinal T cells to skin-dLNs during skin re-challenge with S. epidermidis.

(A) Splenic antigen-presenting cells (APCs) were pulsed with stool and co-cultured with CellTrace Violet-labelled CD4+ T cells from skin-dLNs of DSS or Ctl mice.
(B) Relative CD4+ T cell proliferation in these co-cultures.
(C) Total CD4+ T cells were obtained from gut-dLNs of DSS or Ctl Thy1.2 mice at day 7 of re-challenge then adoptively transferred (i.p.) into Thy1.1+ recipients undergoing the same re-challenge.
(D) Ratio of Thy1.2+ cells among live CD45+CD3+GL3−TCRβ+CD4+ in skin-dLNs versus spleen.
(E) Total CD4+ T cells were isolated from gut-dLNs of Ctl or DSS-treated CD45.1+ OT-II mice at day 7 of re-challenge then adoptively transferred (i.p.) into CD45.2+ WT recipients undergoing primary skin challenge with S. epi-2W.
(F) Ratio of CD45.1+ cells among live CD45+CD3+GL3−TCRβ+CD4+ cells in skin-dLNs versus spleen. Each point represents an individual mouse. (A–F) Representative of 2 independent experiments with 2–3 mice per group.
(G) KikGr mice were colonized with S. epi-2W on postnatal days 7, 10, and 13 before induction of DSS colitis and re-challenge with S. epi-2W plus superficial skin abrasion 3 weeks later. At day 7 of re-challenge, laparotomy and photoconversion of intestinal tissue was performed and tissues were collected 24 h later.
(H) Ratio of CD45+ cell subsets among KikRed+ cells in skin-dLNs versus gut-dLNs.
(I) Ratio of CD4+ cells among KikRed+ cells in spleen versus gut-dLNs. Each point represents an individual mouse. (G–I) Representative of 2 independent experiments with 2–3 mice per group.
(J) WT mice were colonized with S. epi-2W on postnatal days 7, 10, and 13 before DSS colitis and S. epi-2W plus skin abrasion re-challenge 3 weeks later. One group of DSS mice received i.p. FTY720 (DSS + FTY720) and the other i.p. PBS (DSS + PBS) every other day during re-challenge.
(K and L) Percentage of Foxp3+2W+CD44+CD4+ T cells (K) and Foxp3+CD4+ T cells (L) in skin-dLNs from Ctl, DSS + PBS, and DSS + FTY720 groups. Each point represents an individual mouse. All data are representative of at least 2 independent experiments with 3 or more mice per group.
As DSS-induced colitis is known to result in increased systemically circulating gut microbial antigens (Eichele and Kharbanda, 2017), the enrichment of gut-microbe-responsive CD4+ T cells in skin-dLNs could result from direct migration of these cells from gut- to skin-dLNs, their local expansion in skin-dLNs due to circulating antigens, or both. We utilized an adoptive transfer model to measure the trafficking properties of gut CD4+ T cells from DSS versus control mice. To generate and re-expand the gut S. epi-2W-specific CD4+ T cell compartment, WT donor mice were colonized as neonates with skin S. epi-2W and re-challenged as adults with skin tape stripping with or without DSS. Total CD4+ T cells were then isolated from gut-dLNs at day 7 post-DSS initiation and adoptively transferred i.p. into congenic Thy1.1 recipient mice that received S. epi-2W colonization in conjunction with tape stripping (Figure 4C). To account for variable efficiency of each adoptive transfer, skin-dLNs and spleen were harvested 48 h post-transfer, and the relative accumulation of gut CD4+ T cells at these sites was measured by flow cytometry. Consistent with colitis inducing increased skin-homing capacity among gut-dLN T cells, donor CD4+ T cells from DSS mice showed increased accumulation in skin-dLNs over spleen compared with cells from healthy control donors (Figure 4D).
Because the small numbers of S. epi-2W-specific CD4+ T cells in our transferred polyclonal populations precluded us from assessing antigen specificity, we performed complementary adoptive transfer experiments using a newly engineered strain of S. epidermidis expressing the OVA antigen (S. epi-OVA) and OT-II TCR-transgenic OVA-specific CD4+ T cells. CD45.1+ OT-II mice were pre-colonized with S. epi-OVA during the neonatal period and re-colonized as adults with skin tape stripping. On day 7, total OT-II CD4+ T cells were isolated from gut-dLNs of DSS-treated or control OT-II mice and transferred via i.p. injection into S. epi-OVA-naïve CD45.2+ WT recipients. Recipients received S. epi-OVA skin colonization and tape stripping in tandem with DSS colitis to recapitulate the inflammatory environment in which these T cells would reside. We harvested skin-dLNs and spleen from recipients 1 week after transfer to allow for maximal antigen exposure (Figure 4E), which again confirmed increased recruitment of cells from DSS versus control OT-II mice to skin-dLNs (Figure 4F). These results suggest that colitis can induce differential trafficking properties among CD4+ T cells in the presence of persisting colitis-driven signals.
To more directly assess possible trafficking from gut to skin, we monitored the movement of endogenous immune cells in vivo using transgenic mice that express the green-to-red photoconvertible protein Kikume Green (KikGr). Upon exposure to near-UV light (436 nm), the fluorescence of photoconverted KikGr cells changes from green to red. No immunomodulatory effects have been reported in the KikGr photoconversion model (Nowotschin and Hadjantonakis, 2009), allowing us to use this technique on mice during DSS-induced colitis and skin bacterial challenge. To track movement of gut CD4+ T cells to skin-dLNs, we performed laparotomy and photoconversion of the externalized intestines and gut-dLNs in DSS or control SPF mice on day 6 of S. epi-2W skin re-challenge. We confirmed that photoconversion of CD45+ cells in this set-up was indeed limited to the gut by verifying the presence of KikRed+ cells in gut-dLNs but not spleen or skin-dLNs 30 min post-light exposure (Figure S4B). Skin-dLNs, skin, gut-dLNs, colonic and small intestinal LP (Figure S3C), and spleen were harvested 24 h later, and the number of photoconverted cells was enumerated at each site (Figure 4E). Absolute numbers of trafficked KikRed+ CD45+ cells in skin-dLNs of DSS versus control mice were not increased, and were possibly reduced, at this early time point (Figure S4C). However, when we measured the propensity for gut to skin cell trafficking among individual cell subsets by calculating the ratio of KikRed+ cells in skin-dLNs compared with those in gut-dLNs, we found enrichment of gut-derived T cells, especially CD4+ T cells, but not CD11c+MHC-II+ antigen-presenting cells in skin-dLNs of DSS mice (Figure 4H). This enrichment of gut-derived CD4+ T cells was not seen in the spleen (Figure 4I), supporting the notion that colitis preferentially induces trafficking of CD4+ T cells from gut- to skin-dLNs during concurrent skin challenge with commensal bacteria.
To understand whether migration was dependent on T cell memory status, we sorted CD44+ or CD44neg CD4+ T cells from gut-dLNs of DSS versus control donors and transferred them i.p. into recipient mice that were tape stripped and colonized with S. epi-2W. Although equivalent numbers of sorted cells were transferred, we recovered fewer transferred cells at 24 h compared with the experiments above. Examination of skin-dLNs versus splenic populations of transferred cells at 24 h revealed a non-significant trend toward more homing capacity in both naïve and memory compartments (Figure S4D). To determine the contribution of skin-microbial-antigen-driven migration of gut CD4+ T cells, we performed similar experiments in our OT-II system, transferring only sorted memory CD4+ T cells from gut-dLNs of DSS versus control donors into DSS-treated recipient mice that were tape stripped, either with or without S. epi-OVA colonization. This revealed no significant difference in the propensity of memory OT-II CD4+ T cells to home to skin-dLNs versus spleen 7 days post-transfer based on the presence of OVA-expressing bacteria on skin (Figure S4E). This raised the possibility that much of the trafficking observed was independent of antigen recognition and instead may be due to changes in homing-receptor expression. Chemokine-receptor staining of gut-dLNs showed a significant increase in the frequency of CCR6+ but not CCR4+ CD4+ T cells in DSS versus control mice (Figures S4F and S4G). CCR6 has previously been implicated in skin homing of T cells in the context of IL-17-dominant cutaneous inflammation (Hedrick et al., 2009; Mabuchi et al., 2013).
As these results supported increased trafficking of CD4+ T cells during colitis, we asked whether blocking lymphocyte circulation during the challenge phase of our model would alter the S. epi-2W response in skin-dLNs. We transiently blocked lymphocyte egress from secondary lymphoid organs in our model by using the sphingosine-1-phosphate receptor antagonist FTY720 (Xie et al., 2003). WT mice were pre-colonized with S. epi-2W during the neonatal period then split into three groups. One group of mice was given water and injected i.p. with PBS, another group was given DSS and injected with PBS, and a third group was given DSS and injected with FTY720 (Figure 4J). As in previous experiments (Figure 1), DSS mice had a decreased percentage of Tregs among S. epi-2W-specific cells in skin-dLNs compared with controls. However, FTY720 treatment during the 10-day re-challenge period reverted this phenotype to a 2W+ Treg percentage comparable to controls (Figure 4K), while the polyclonal Treg population remained unaffected (Figure 4L). Collectively, these experiments support a role for colitis-induced gut-to-skin-dLN trafficking of CD4+ T cells in the altered response to skin commensal bacteria.
Colitis-driven IL-1R1 signaling on CD4+ T cells alters the antigen-specific response to S. epidermidis
Having shown that colitis alters the S. epi-2W-specific CD4+ response in both gut and skin, we sought to understand the possible signaling mechanisms, independent from T cell trafficking, responsible for skewing the commensal-specific response toward CD4+ Teffs. Although a complex range of cytokine signatures underlie gut inflammation, we chose to focus on IL-1α and IL-1β, as these have been implicated in pathogenesis of DSS colitis and human IBD (Ligumsky et al., 1990) and in neutrophilic dermatoses (Marzano et al., 2019).
Levels of IL-1β were increased significantly in the serum and modestly in skin of DSS mice during active colitis and concurrent skin challenge (Figure 5A), whereas there was only a modest increase in serum and tissue levels of IL-1α in DSS versus control mice (Figures S5A and S5B). This result, in conjunction with our prior work showing that topical IL-1β reduces the percentage of S. epi-2W-specific Tregs generated by neonatal skin colonization (Leech et al., 2019), led us to postulate that these colitis-induced cytokines were involved in skewing the response to S. epi-2W in the gut and, by extension, the skin. Due to the importance of IL-1 signaling in initiating gut inflammation via myeloid cell activation, we opted to forgo experiments in Il1r1−/− mice, which have been shown to demonstrate altered disease severity during DSS colitis (González-Navajas et al., 2010). Instead, we focused our investigation on Il1r1fl/fl CD4-CreTg+ mice in which IL-1 signaling is deleted specifically in αβ T cells, which are not required for development of acute DSS colitis.
Figure 5. Colitis-driven IL-1R1 signaling on CD4+ T cells alters the antigen-specific response to S. epidermidis.

(A) On day 4 of re-challenge phase, serum and skin were collected from Ctl or DSS WT mice and IL-1β was measured via multiplexed ELISA.
(B) CD4−Cre− and CD4−Cre+ mice were colonized with S. epi-2W on postnatal days 7, 10, and 13 before DSS treatment and re-challenge with S. epi-2W 3 weeks later.
(C and D) Percentage of Foxp3+2W+CD44+CD4+ and Foxp3+CD4+ T cells in skin-dLNs.
(E and F) Absolute number of Foxp3−2W+CD44+CD4+ and Foxp3−CD4+ T cells in skin-dLNs.
(G) Percentage of IL-17A+ cells gated on live CD45+CD3+GL3−TCRβ+CD4+Foxp3 in skin.
(H) Percentage of Ly6G+CD11b+ cells gated on live CD45+ in skin.
(I and J) IL-1R1 fl/fl Foxp3−Cre− and Foxp3−Cre+ (I) or IL-6R fl/fl CD4−Cre− and CD4−Cre+ (J) mice were colonized with S. epi-2W on postnatal days 7, 10, and 13 before DSS treatment and re-challenge with S. epi-2W 3 weeks later. Percentage of Foxp3+2W+CD44+CD4+ in skin-dLNs on day 10.
Each point represents an individual mouse. All data above are representative of 2–4 independent experiments with at least three mice per group. p values correlate with symbols as follows: ns, not significant, p > 0.05, *p ≤ 0.05, **p ≤ 0.01, ***p ≤ 0.001, ****p ≤ 0.0001.
Previous work showed a T cell-intrinsic role for IL-1 signaling in CD4+ T cell expansion, Th17 differentiation (Basu et al., 2015; Chung et al., 2009), and “licensing” of effector function (Ben-Sasson et al., 2009; Jain et al., 2018). We hypothesized that excess IL-1α and IL-1β during colitis was skewing the commensal-specific CD4+ response toward an effector rather than Tre, phenotype. To test this, we colonized Il1r1fl/fl Cd4-CreTg+ (Cre+) and Il1r1fl/fl Cd4-CreTg- (Cre−) littermates with S. epi-2W during neonatal life before re-challenging them as adults with S. epi-2W plus tape stripping either with or without concurrent DSS colitis (Figure 5B). In the absence of colitis, where IL-1α and IL-1β levels were low, Cre+ and Cre− mice demonstrated equivalent percentages of commensal-specific Tregs in skin-dLNs, which were comparable to that seen in WT control mice. In contrast, during DSS colitis, the percentage of S. epi-2W Tregs was rescued in Cre+ mice but remained low in Cre− controls (Figure 5C). This restoration in the percentage of commensal-specific Tregs in Cre+ mice was accompanied by reduced absolute numbers of 2W+ CD4+ Teffs in skin-dLNs (Figure 5E), whereas numbers of 2W+ Tregs were equivalent between the two groups (Figure S5D). These differences in Treg percentages and Teffs did not extend to the polyclonal CD4+ population in skin-dLNs (Figures 5D, 5F, and S5D). Recovery in 2W+ Treg percentages in the Cre+ mice was accompanied by reductions in percentages of IL-17A+ CD4+ T cells and neutrophils (Figures 5G and 5H). Because IL-1 signaling has been implicated in both stimulation of Th17 differentiation but also destabilization of Tregs, we performed the same experiments in Il1r1fl/fl Foxp3-CreTg+ and Il1r1fl/fl Foxp3-CreTg- littermates, which did not reveal effects on the 2W+ Treg frequencies in skin-dLNs (Figure 5I). As systemic IL-6 levels were also elevated in the context of DSS treatment (Figure S5E), we tested the effects of IL-6 receptor signaling in Il6rfl/fl CD4-CreTg+ versus Il6rfl/fl CD4-CreTg- mice, which again did not show an effect on 2W+ Treg frequencies (Figure 5J). These results suggest that IL-1 signaling in CD4+ T cells, stimulated by colitis-precipitated elevations in circulating IL-1α and/or IL-1β levels, plays a role in expanding commensal-specific Teffs that then alters gut and skin immune responses to S. epi-2W during colitis.
DISCUSSION
This work indicates that intestinal inflammation can impact the quality of the adaptive immune responses to commensal bacteria in skin. For mice in which adaptive immune tolerance to S. epi-2W had been established during infancy, DSS colitis, but not LPS-triggered sepsis, resulted in reduced S. epi-2W-specific Tregs and increased skin neutrophils during adulthood skin re-challenge. This phenomenon was accompanied and possibly amplified by the increased intestinal numbers of S. epidermidis and S. epi-2W-specific CD4+ T cells during colitis, in tandem with colitis-induced extra-intestinal lymphocyte trafficking. IL-1 signaling in T cells appears necessary for reducing the frequency of S. epi-2W-specific Tregs, providing evidence into how established immune responses to resident microbes can be disrupted in adulthood. Our findings establish a context in which there is breakdown in the normal homeostatic compartmentalization of skin and gut host-microbe interactions and provide potential mechanistic insight into the relationship between inflammatory skin and intestinal disease.
Host-microbe interactions in the gut can generate T cell pools that contribute to inflammation in distal tissues without an endogenous microbial community. For example, increased Th17 responses to gut microbes have been shown to facilitate pathology in models of uveitis, nephritis, and arthritis (Horai et al., 2015; Krebs et al., 2016; Wu et al., 2010). The skin, like the gut, harbors its own large and diverse microbial community. While hypotheses have been proposed regarding the pathogenesis of linked gut and skin dysbiosis (De Pessemier et al., 2021), prior studies addressing the mechanistic connection between immunity at these two barrier sites have largely focused on anaphylaxis and allergy (Leyva-Castillo et al., 2019; Oyoshi et al., 2011; Rigoni et al., 2020). Our studies, by contrast, demonstrate that gut inflammation can trigger altered antigen-specific responses to skin bacteria and explore the responsible mechanisms.
Gut colonization by S. epidermidis and generation of a S. epi-2W-specific CD4+ response in the colon were notable features of our model. S. epidermidis is predominantly a commensal skin microbe in humans but can also colonize the infant gut as a founding member (Adlerberth et al., 2006) in part through breast-milk seeding (Jiménez et al., 2008). Though S. epidermidis tends to disappear from the gut with age, its presence during early immune education may facilitate establishment of a largely tolerogenic intestinal memory CD4+ T cell pool (Knoop et al., 2017), matching that seen in skin (Scharschmidt et al., 2015). We found that gut S. epidermidis levels increased during colitis, consistent with reports that it can bloom under inflammatory conditions (Garcia-Gutierrez et al., 2020). The total burden of gut S. epidermidis was likely augmented in our model by the skin re-colonization we performed in parallel with DSS administration, and this may have intensified the degree of CD4+ clonal sharing between the two barrier sites. Attempts to selectively target and deplete gut S. epi-2W did not remove luminal bacterial 2W antigen, therby limiting conclusions regarding the importance of gut-skin sharing of specific bacterial antigens. Nonetheless, the lack of an augmented neutrophilic response to skin tape stripping during colitis in GF mice suggests that the presence of gut and skin bacteria is important to this phenomenon. These studies demonstrate that overlap in microbial species or immune epitopes across barrier tissues in early life can support later immune cross-reactivity and, in the right context, inter-connected pathology.
The role for T cell trafficking in our model builds on other work demonstrating that systemic dissemination of gut T cells can augment immune-mediated disease at distant sites (Krebs et al., 2016; Morton et al., 2014). Based on our adoptive-transfer studies, we found that increased circulation between gut and skin in the setting of colitis and induced skin injury via tape stripping is a more general phenomenon that is neither specifically applicable to memory T cells nor dependent on the presence of cognate antigen in skin. Although more work is required to fully understand these observations, modest increases in CCR6 expression among gut-dLN T cells from DSS mice may have contributed to chemokine-dependent skin trafficking. Whereas CCR4 has been previously implicated in skin-to-gut homing in a mouse model of food allergy and skin inflammation (Oyoshi et al., 2011), CCR6 has been shown to contribute to other Th17-dominant models of murine skin inflammation (Mabuchi et al., 2013).
Our findings also support the concept of contextual pathogenicity, i.e., that a combination of host and microbial factors impact the immunomodulatory properties of a given skin bacteria, such as S. epidermidis (Chen et al., 2018; Flowers and Grice, 2020). While normally viewed as a skin mutualist (Harrison et al., 2019; Lai et al., 2010), S. epidermidis can turn pathologic when it becomes bloodborne in an at-risk host. In specific situations, commensal bacteria can also elicit excessive inflammation, even in their preferred body niche. This has been well demonstrated for gut bacteria, including Bacteroides thetaiotaomicron (Bloom et al., 2011), Helicobacter hepaticus (Chow et al., 2011; Xu et al., 2018), and Prevotellaceae spp. (Elinav et al., 2011), as well as, to a lesser extent, for skin strains (Hand et al., 2012; Kobayashi et al., 2015). In our model, several factors likely contributed to the altered, pro-inflammatory CD4+ response to S. epi-2W, including breach of the gut barrier, S. epi-2W intestinal abundance during colitis, increased circulation of T cells between inflamed LN basins, and local disruption of skin homeostasis through tape stripping. While studies examining the skin microbiome tend to focus on shifts in bacterial community composition that accompany disease flares (Byrd et al., 2018), our data suggest that a change in the host immune response to a given microbe can play an equally important pathophysiological role.
Elucidating the factors that “flip” the immune response “switch” to resident skin bacteria will be important for understanding microbiome-driven skin diseases. Specific areas of immediate interest include IL-1β and related inflammasome pathways, which are already implicated in human IBD (Ligumsky et al., 1990), models of murine colitis (Arai et al., 1998; Elinav et al., 2011; McEntee et al., 2019; Seo et al., 2015), neutrophilic dermatoses (Lukens et al., 2013; Marzano et al., 2019), and other skin disorders (Sá et al., 2016). In this study, we found that IL-1β and to a lesser extent IL-1α increased in skin and serum of DSS mice. The reduction in the percentage of S. epi-2W-specific Tregs in tandem with an increase in IL-1β is reminiscent of our prior work demonstrating that IL-1β helps shape differential responses to skin bacterial “friend” versus “foe” during neonatal priming (Leech et al., 2019). Here, we illustrate that IL-1R1, but not IL-6R, signaling specifically on T cells is important for the altered commensal-specific response and that this pathway can play a role in tuning the quality of memory as well as the primary CD4+ response. Like others (Harrison et al., 2019), we observed that S. epi-2W-specific CD4+ Teffs are enriched for IL-17A production. As deletion of IL-1R1 in Tregs did not recapitulate results of the CD4-Cre model, we postulate that T cell-intrinsic IL-1R1 signaling during colitis in our model tipped the balance away from Tregs in favor of Th17 by promoting Th17 re-expansion rather than by contributing to Treg instability or conversion.
Our results collectively have implications for understanding the etiology of neutrophilic dermatoses, especially those associated with IBD. Although the role of innate immunity is well established in these diseases, isolated targeting of IL-1R1 is only intermittently effective and usually T cell-directed therapies, such as oral steroids, tumor-necrosis-factor inhibitors, or IL-12/IL-23 blockade, are required for disease control (Menghini et al., 2019). As we show here, this may reflect the involvement of commensal-specific T cells that contribute to skin pathology. While skin biopsy of neutrophilic dermatoses is challenging due to concern for pathergy, any opportunity to examine shared clonality of skin and gut T cells in patients with IBD-driven disease would be of interest moving forward. Likewise, therapies aimed at specifically correcting commensal-specific T cell responses at either barrier site represent an avenue for future therapeutic research and development.
Limitations of the study
There are many advantages to in vivo models and tetramer-based tracking of bacteria-specific immune cells but also limitations applicable to this work. While we were able to detect S. epi-2W in neonatal and adult stool and 2W-specific CD4+ in the colonic LP at both ages, with the tools available, we could not specifically confirm if priming of 2W-specific CD4+ T cells occurred in the intestine and gut-dLN. We attempted antibiotic-mediated depletion of colonic S. epi-2W, but residual dead bacteria and accompanying gut 2W antigen precluded definitive conclusions as to the necessity of gut-directed T cell priming. Another limitation of measuring commensal-specific Tregs with the 2W tetramer system is the inability to distinguish contributions of peripheral Treg induction versus proliferation of pre-existing thymically derived Tregs. Our results in Foxp3Cre Il1r1fl/fl mice, however, would argue against IL-1R1 mediated conversation or destabilization of Tregs as a primary mechanism. Our studies in Cd4CreIl1r1fl/fl mice confirmed that IL-1R1 signaling on T cells is important for colitis-associated reductions in 2W+ Tregs but did not allow us to parse the role of IL-1α versus IL-1β. Both cytokines can also be elevated in response to i.p. LPS but with different intensity and timing than after DSS. As such, why LPS treatment could not replicate colitis-induced effects on 2W+ Tregs remains incompletely understood.
STAR*METHODS
RESOURCE AVAILABILITY
Lead contact
Further information and requests for resources and reagents should be directed to and will be fulfilled by the Lead Contact, Tiffany Scharschmidt (Tiffany.Scharschmidt@ucsf.edu).
Materials availability
Sequence for plasmid pJL74–2W-gpmCherry was previously reported and is available in GenBank (ID MK928252). Sequence for plasmid pJL74-OVA-zsgreen has been deposited in GenBank (ID ON351528). Plasmids and strains are available upon request under a universal MTA.
Data and code availability
Skin and stool 16S rRNA sequencing data has been deposited in the NCBI Biosample database Bioproject: PRJNA828627; Bio-sample ID: SAMN27680022-SAMN27680065 (https://www.ncbi.nlm.nih.gov/biosample/). This paper does not report original code. Any additional information required to reanalyze the data reported in this paper is available from the Lead contact upon request.
EXPERIMENTAL MODEL AND SUBJECT DETAILS
Experimental animals
Wild-type C57BL/6 mice were originally purchased from Jackson Laboratories (Bar Harbor, ME), then bred and maintained in the UCSF specific pathogen-free (SPF) facility on the Parnassus campus for use in experiments. Il1rfl/fl, Il6r l/fl, Cd4-Cre, CAG::KikGr33 and Foxp3YFP-cre mice were purchased from Jackson and bred in-house. A20fl/fl, Abinfl/fl, and Villin-CreERT2 mice (Kattah et al., 2018) were a gift from A. Ma. All animals were 7 days–10 weeks old at the time of experiments. Littermates of the same sex were socially housed under a 12 h light/dark cycle and randomly assigned to experimental groups whenever possible. Animals of both sexes were used and this variable was balanced as a variable across experimental groups. Animal work was performed in accordance with the NIH Guide for the Care and Use of Laboratory Animals and the guidelines of the Laboratory Animal Resource Center and Institutional Animal Care and Use Committee of the University of California, San Francisco.
Bacterial strains and culture conditions
Staphylococcus epidermidis (S. epi) strain Tü3298 (Augustin and Götz, 1990) was used in this study and grown in tryptic soy broth at 37°C. Bacterial media was supplemented with 5 mg/mL erythromycin for plasmid selection. In current and published work, S. epi has been engineered to express the 2W model antigen linked to the fluorophore mCherry under control of the agr promoter via plasmid pJL74–2W-gpmCherry (Leech et al., 2019). In this work, the same Tü3298 strain was engineered to express the OVA peptide antigen via modification of the original pJL74–2W-gpmCherry plasmid.
METHOD DETAILS
Colitis models
5 to 6-week old wild-type C57BL/6 mice were given 2.5–3.5% DSS (w/v) (Alfa Aesar, Catalog No. 9011–18-1) ad libitum in their drinking water for 5–6 days, with one round of replacement on days 3 or 4. 5 to 6-week old A20fl/fl Abinfl/+ Villin-CreERT2 Tg+ or Tg- mice were given daily intraperitoneal injections of 1 mg tamoxifen (1 mg/day, Catalog No. T5648; Sigma Aldrich) for 5 consecutive days. In both models, colon length was measured from end of the cecum to beginning of the rectum. Weight loss was calculated as a percentage of daily weight over starting weight.
FTY720 administration
FTY720 (Selleck Chemicals, Catalog No. S5002) was dissolved in phosphate buffered saline (PBS) and administered to 5 to 6-week old wild-type C57BL/6 mice via intraperitoneal injection at a dose of 10 mg/kg per mouse. For experiments depicted in Figure 4, FTY720 was administered every 48 h on re-challenge days 0–10. Control mice (littermates) were treated with equal volumes of PBS according to the same schedule.
Antibiotic treatment
Chloramphenicol (Sigma-Aldrich, Catalog No. C3175–100MG) is typically dissolved in drinking water at a concentration of 0.5 g/L and mice typically drink 5 mL of water per day. For our experiments, we adjusted this concentration accordingly and administered a total of 100–200 µL chloramphenicol to 5 to 6-week old wild-type C57BL/6 mice via oral gavage per day, once every three days, of the re-challenge period. Control mice (littermates) were orally gavaged with water according to the same dosing and schedule.
LPS-induced sepsis model and preparation of heat-killed S. epidermidis
Purified lipopolysaccharides (LPS) from Salmonella enterica serotype minnesota (Sigma, Catalog No. L6261) was dissolved in phosphate buffered saline (PBS) and administered to 5 to 6 week-old wild-type C57BL/6 mice via intraperitoneal injection at a dose of 2 mg/kg on day 0 or 1 mg/kg or on days 0, 3, and 6 of the re-challenge period. Heat-killed S. epidermidis was prepared by incubating 108–109 colony-forming units (CFUs) of S. epi-2W pelleted from 48 hour-cultures and re-suspended in PBS for 20 min at 85°C.
Bacterial skin colonization and light skin abrasion models
S. epi-2W was cultured for 48 h to achieve high 2W-mCherry expression as measured by flow cytometry, then washed and re-suspended in PBS to obtain 108–109 colony-forming units (CFUs) at a volume of 100 µL per mouse. S. epi-2W was then applied via a plastic pipette and a sterile PBS-soaked cotton-tipped swab to the back skin of mice on days 7, 10, and 13 for neonatal colonization. To mimic physiologic exposure of mice to skin S. epi-2W in the context of light skin abrasion during adulthood, back hair was first removed using small animal clippers and depilatory cream (Nair™ Hair Remover Body Cream) on day 0, followed by repeated application and removal of adhesive tape on days 0, 3, and 6 (Shurtape HP-500). Tissues were harvested 10 days after initiation of the challenge.
APC-T cell in vitro assay
The APC-T cell assay using fecal samples was informed by previous work21, with modifications specific to our model. APCs: Spleens were harvested and processed over sterile 100 µM cell strainers in 1 mL of T cell media (RPMI supplemented with HyClone Characterized Fetal Bovine Serum (FBS), 1% penicillin-streptomycin, β-mercaptoethanol, HEPES and GlutaMAX™) before ACK lysis. Samples were then stained with Biotin anti-mouse CD3ε Antibody (BioLegend, clone 145–2C11, Catalog No. 100303) and Biotin anti-mouse/human CD45R/B220 Antibody (BioLegend, clone RA3–6B2, Catalog No. 103203) and APCs were isolated using the EasySep™ Mouse Streptavidin RapidSpheres™ Isolation Kit (Catalog No. 19860). Antigen: Stool contents obtained directly from harvested colon were homogenized in pre-warmed PBS and used as antigen to pulse the APCs for 2 h at 37°C in a 96-well V-shaped-bottom microplate at a concentration of 2 × 10⁴ cells per well. Antigen-pulsed APCs were pelleted, then incubated with T cell media with 100 µg/mL Gentamicin sulfate salt (Sigma, Catalog No. G1264) for 1 h at 37°C before washing and re-suspending in T cell media. T cells: CD4+ T cells were isolated from LN via EasySep™ Mouse CD4+ T Cell Isolation Kit (Catalog No. 19852) and isolation efficiency was verified via flow cytometry. CD4+ T cells were then labeled with the CellTrace™ Violet Cell Proliferation Kit (Invitrogen™, Catalog No. C34557) before co-culturing at 37°C with antigen-pulsed, Gentamicin-washed APCs at a ratio of 10:1. After 48 h of incubation, cells were harvested and stained for flow cytometry.
Photoconversion of intestinal cells
Photoconversion of intestinal tissue was performed in SPF CAG::KikGr33 mice as previously described33.53. Mice were anesthetized with isoflurane delivered in O2 and body temperature was maintained at 37°C via heating pad throughout the procedure. Abdominal area was shaved prior to making an incision in the abdominal wall to externalize the intestinal tissues (SI, colon, caecum, and gut-draining LN). The rest of the body was covered with aluminum foil to prevent non-specific labeling while only the intestinal tract was exposed to a violet laser source (405 nm, peak power) for 1 min. The intestinal tissues were returned back to the abdomen and the incision sutured. Mice were given post-operative pain medication. Twenty-four hours after surgery, cells from various tissues were analyzed via flow cytometry for presence of photoconverted RFP + cells.
Adoptive transfer of CD4+ T cells
Donor CD4+ T cells from either WT or OT-II transgenic mice were isolated from gut-draining LN via EasySep™ Mouse CD4+ T cell Isolation Kit (Catalog No. 19852) or sorted from either CD45 + CD3+TCRβ+GL3-CD8-CD4+CD44 + or CD45 + CD3+TCRβ+GL3-CD8-CD4+CD44-populations. Cell isolation efficiency was verified via flow cytometry. A total of 1 × 10⁵ CD4+ T cells were injected intraperitoneally (i.p.) into recipient mice. Either twenty-four hours or 7 days after adoptive transfer, various tissues of recipient mice were harvested and stained cell suspensions were analyzed via flow cytometry for presence of donor CD4+ T cells.
Tissue processing and flow cytometry
Secondary lymphoid organs:
Lymph nodes (skin-draining and colon-draining) and spleen were harvested and then processed over sterile wire mesh in 2 mL of complete RPMI media before cell isolation and tetramer staining in PBS. Red blood cells in spleen were lysed with ACK lysing buffer prior to isolation.
Skin:
Back skin was harvested, lightly defatted, then minced with scissors to a fine consistency before tissue digestion in 4 mL complete RPMI (RPMI plus 10% fetal calf serum, 1% penicillin-streptomycin, β-mercaptoethanol, glutamate, sodium pyruvate, HEPES and non-essential amino acids) then supplemented with 2 mg/mL collagenase XI, 0.5 mg/mL hyaluronidase, 0.1 mg/mL DNase. Digested skin samples were then incubated, with shaking, at 37°C for 45 min before quenching with 15 mL of complete RPMI media and shaking by hand for 30 s. Skin cell suspensions were filtered through sterile cell strainers (100 µM followed by 40 µM).
Colon LP:
Lamina propria lymphocytes were isolated with minimal modifications to previous published work55. In brief, colons were harvested and fileted, then washed with 1 mL PBS to remove stool before resting in complete RPMI media. After rinsing with 1X HBSS (without Ca2+ and Mg2+), colons were then each incubated, with shaking, in 15 mL 1X HBSS (without Ca2+ and Mg2+) supplemented with 5 mM EDTA (Promega) and 1 mM DL-Dithiothreitol (DTT) (Bioplus chemicals) for 45 min at 37°C in order to remove mucus. Samples were then filtered with a 100 µM sterile cell strainer to discard supernatant before tissue digestion for 45 min at 37°C in 15 mL each of 1X HBSS (with Ca2+ and Mg2+) supplemented with 5% (v/v) fetal bovine serum (GIBCO heat inactivated), 1 U/mL Dispase (Sigma), 0.5 mg/mL Collagenase VIII (Sigma), and 20 µg/mL DNaseI (Sigma). After quenching with 15 mL of complete RPMI media, the supernatant was filtered over a 40 µM sterile cell strainer and collected in a new tube. Cell suspensions were pelleted 1,000 g for 10 min at 4°C, then subjected to a Percoll (VWR) gradient (40%/80% [v/v]) before pelleting at 1,000 g for 20 min with no brake and no acceleration. Cells at the interface were collected and washed with PBS.
Cell counting:
All tissues were re-suspended in 1 mL PBS and 25 µL of cell suspension was mixed with 25 µL of AccuCheck counting beads (Invitrogen, Catalog No. PCB100) for calculating absolute numbers of cells.
Antibody staining:
Remaining cells were stained in PBS for 30 min at 4°C with surface antibodies and a Live/Dead marker (Ghost Dye Violet 510, Tonbo Biosciences, Catalog No. 13–0870-T100). For intracellular staining, cells were fixed and permeabilized using the Foxp3 staining kit (eBioscience, Catalog No. 00–5523-00) buffer for 30 min at 4°C then stained in permeabilization buffer for 30 min at 4°C. Stained cells were run on a Fortessa (BD Biosciences) in the UCSF Flow Cytometry Core. Flow cytometry data was analyzed using FlowJo software (FlowJo, LLC). For detection of homing markers, cells were incubated for 30 min at 37°C with CCR6 and CCR4 surface antibodies before proceeding to the rest of the extracellular staining for 30 min at 4°C.
Tetramer staining and enrichment:
To identify 2W-specific cells, cell suspensions were pelleted and then stained for 1 h at room temperature (15–25°C), while protected from light, with a 2W1S:I-Ab–streptavidin-phycoerythrin (PE) tetramer at a concentration of 10 nM. Skin and colon LP were then directly stained for other surface and intracellular markers as described above. For LN samples, the tetramer-bound fraction was enriched via an adapted protocol of the EasySep PE Selection Kit II (StemCell Technologies, Inc.) developed by Marc Jenkins’ lab. In brief, 6.25 µL of EasySep PE selection cocktail was added to each sample in a total volume of 500 mL and then incubated, while protected from light, at room temperature for 15 min. Cells were incubated for an additional 10 min after addition of 12.5 µL of EasySep magnetic particles. Finally, cell suspensions were brought up to a total volume of 2.5 mL with PBS and placed into the EasySep magnet for 5 min at room temperature. Supernatants (unbound fractions) were poured off into another collection tube. This process of washing with PBS and enriching for magnetically-bound cells was repeated twice until the positively-selected cells (bound fraction) and pooled unbound fraction for each sample were taken for cell counting and staining. To identify Mr1-specific cells, cell suspensions were incubated with 5-OP-RU and 6-FP-loaded mMR1 and hMR1 tetramers (generously provided by the NIH Tetramer Core Facility) for 1 h at room temperature (15–25°C), while protected from light and analyzed as previously described73.
Myeloperoxidase assay
Cell suspensions from murine back skin were obtained according to the tissue processing protocol noted above. A total of 50 µL of cell suspension was set aside per sample and the assay was performed using a Myeloperoxidase (MPO) Activity Assay Kit (Colorimetric) (Abcam, Catalog No. ab105136).
Luminex assay
Serum samples were obtained from fresh murine blood. Approximately 2 cm2 of murine back skin was collected into chilled GentleMACS M Tubes and placed on ice. Skin was then homogenized via GentleMACS in 10 mL of RIPA buffer (10 mL NaCl 1.5M, 1 mL EDTA 0.5M pH = 8, 5 mL Tris-HCL 1 M pH = 8 (60g Tris-HCL in 500 mL dH2O, 1mL NP-40, 0.5g Sodium deoxycholate, 20mL 50% Glycerol solution) supplemented with Pierce Protease Inhibitor Mini (Thermo Scientific™, Catalog No. A32953). Total protein concentration was determined and normalized between skin homogenates and serum. Cytokine and chemokine levels were determined using the Mouse High Sensitivity T cell 18-Plex Discovery Assay® Array (MDHSTC18) (Eve Technologies, Catalog No. MDHSTC18).
Bacterial enumeration
For CFU enumeration in Figures 3A, 100 mg of stool was directly obtained from harvested mouse colons and homogenized in 1 mL of sterile PBS via vortex. Bacterial suspensions were then plated on erythromycin-containing TSA to select for S. epi-2W mCherry and colonies were enumerated to quantify total CFUs.
Quantitative PCR
An 8-mm biopsy of murine back skin was collected and flash-frozen in 1.5 mL Eppendorf tubes prior to DNA extraction. DNA extraction was performed using the DNeasy PowerSoil Pro Kit (Qiagen, Catalog No. 47016) and qPCR was performed using the Power SYBR™ Green PCR Master Mix (Applied Biosystems™, Catalog No. 4367659). The following DivIA gene primer sequences were used—F: TTCCGCTCTCGTTTCCGT; R: ATTGCACGTTCTTCAGGTGT (Mastronardi and Ramírez-Arcos, 2007).
16S sequencing and analysis
Skin DNA extraction
Procedures for DNA extraction, library generation, and sequencing were done as previously described for skin samples (Oh et al., 2014). Briefly, samples were incubated in yeast cell lysis buffer (MasterPure Yeast DNA Purification Kit, Lucigen) and Ready-Lyse (Lucigen) for 1 h at 37°C, then mechanically disrupted using 5 mm stainless steel beads (Qiagen, Hilden, Germany) in a Tissuelyser (Qiagen) for 2 min, 30Hz. Samples were incubated for 30 min at 65°C, placed on ice for 5 min, and debris spun down after treatment with MPC protein precipitation reagent. Supernatants were combined with 400µL of 100% ethanol and column purified using the Invitrogen PureLink Genomic DNA. Last, samples were eluted in 35µL of DNA-free PCR water (Qiagen, Hilden, Germany). The V1-V3 hypervariable regions of the 16S ribosomal RNA gene were amplified from purified genomic DNA using primers 8F(5′-AGAGTTTGATCCTGGCTCAG-3′) and 534R (5′-ATTACCGCGGCTGCTGG). The following PCR conditions were used; 2ul PCR buffer, 0.15ul AccuPrime Taq (Invitrogen, Carlsbad, CA), 4pmol of each primer, 2ul sample DNA and DNAFree PCR water to 20ul. Reactions were performed in 30 cycles of 95′C (20sec), 56′C (30sec), and 72′C (5min) thermal cycling, purified using Agencourt AmpureXP (Beckman Coulter, Brea, CA), and quantified using the Quant-iT dsDNA Kit (Invitrogen, Carlsbad, CA). Pooled amplicons were purified with MinElute PCR purification kit (Qiagen, Hilden, Germany). All amplicon products were pooled in equal concentrations for sequencing. Next-generation sequencing using the Illumina MiSeq (Illumina, San Diego, CA) platform was performed at National Institutes of Health Intramural Sequencing Center. Control swabs also underwent the same DNA extraction processes and sequencing along with experimental samples, and no apparent contamination from either reagents or experimental procedures was observed.
Skin 16S analysis pipeline
For 16S rRNA V1–V3 sequence analysis, demultiplexed sequences were processed to remove primers and barcodes, filter and trim, dereplicate, model errors, merge paired reads, and remove chimeras using R package DADA2 version 1.16 following the guidelines at benjjneb.github.io/dada2/tutorial (https://benjjneb.github.io/dada2/tutorial.html) with the following filtering parameters: maxN = 0, truncQ = 2, rm.phix = TRUE, and maxEE = (2,5). The forward and reverse reads were truncated at 275 bp and 260 bp, respectively. Exact amplicon sequence variants were inferred as described previously (Callahan et al., 2016). Taxonomic classifications were as-signed down to the species level using DADA2 with references of Silva Project database (Silva Project version 138.1) (McLaren and Callahan, 2021). All Staphylococcus sequences were manually interrogated against the National Center for Biotechnology Information nucleotide database with Basic Local Alignment Search Tool on the basis of uniquely best hit at identity threshold ≥99.0% and alignment coverage ≥97.0%. The curated species information was merged into DADA2-compatible taxonomy file. The 16S rRNA V1–V3 reads assigned to chloroplasts were removed before downstream analyses. The data were formatted as a phyloseq object (McMurdie and Holmes, 2013) to generate figures in RStudio version 1.4.1717.
Stool DNA extraction
DNA was extracted using a modified cetyltrimethylammonium bromide (CTAB) method (Fujimura et al., 2016). Stool samples were added to Lysing Matrix E tubes (MP Biomedicals, Santa Ana, CA) containing 500 µL CTAB extraction buffer (5% CTAB in 0.25M phosphate buffer and 1M sodium chloride), followed by incubation for 15 min on a shaker at 65°C. 500 µL phenol:chlorofor-m:isoamyl alcohol (25:24:1) was added and the mixture underwent bead beating at 5.5 m/s for 30 s in the Fastprep24 homogenizer (MP Biomedicals, Santa Ana, CA) and centrifugation for 5 min at 16,000g at 4°C. To improve extraction efficiency, the aqueous phase was collected, and an additional volume of CTAB was added to the sample and bead beating was repeated. Supernatant from both rounds of bead beating were pooled, mixed with equal-volume chloroform, and centrifuged for 20 min at 3,000g at 4°C. The aqueous phase was transferred to a new tube, combined with twice-volume polyethylene glycol (PEG) solution (30% PEG in 1.6M sodium chloride) and stored overnight at 4°C to precipitate DNA. Samples were then centrifuged for 1 h at 3,000g at 4°C, and the resulting DNA pellets were washed with 300 µL of 70% ethanol twice, air-dried for 10 min, and resuspended in 100 µL sterile TE buffer.
Stool 16S analysis pipeline
The V4 region of the 16S rRNA gene was amplified with primers designed by (Caporaso et al., 2011) using PCR conditions and protocol as previously described (Rackaityte et al., 2020). Amplicons were pooled at equimolar amounts to create the sequencing library, except for negative controls, which did not yield enough amplicon and were pooled at the average volume. Libraries were sequenced on the Illumina MiSeq instrument and 2 × 150 bp sequences were obtained as previously described (Rackaityte et al., 2020). Sequence analyses were conducted using the R statistical programming environment version 3.5.2. Demultiplexed sequences were quality filtered based on a previously described workflow (Horton et al., 2021). Briefly, sequences were processed using DADA2 v1.9.0 (Callahan et al., 2016). Sequences with three or more consecutive bases with a Q-score less than 30 were truncated and discarded if their length was less than 75% of the original 150 bp read length. Error rates of the filtered dereplicated reads were estimated using 100,000 sequences. Paired reads with a minimum overlap of 25 bases were merged to obtain the full denoised sequences, followed by the detection and removal of chimeras. Amplicon sequence variants (ASVs) were inferred, and the resultant variants differ by as little as one nucleotide. Taxonomy was assigned utilizing the SILVA v138 reference database (Quast et al., 2013). Using the decontam package v1.14.0 (Davis et al., 2018), ASVs observed in greater than 50% of negative controls were regarded as potential contaminants and discarded. ASVs containing less than 1/1000th of a percent of total reads were also removed. Sequences were then representatively rarefied to the same depth (60,000 reads/sample) 100 times. Alpha diversity measures (Chao1, Pielou’s Evenness, Faith’s Phylogenetic Diversity), beta diversity distance matrices (Bray Curtis, Weighted UniFrac, Canberra, and Unweighted UniFrac) and relative abundance of taxa were determined using the package phyloseq v1.38.0 (McMurdie and Holmes, 2013). Permutational multivariate analysis of variance was performed using vegan (Oksanen et al., 2013) to determine factors that significantly explained variation in beta diversity. Differential ASVs between treatment groups were determined using DE-Seq2 v1.8 (Love et al., 2014), where raw counts were normalized prior to differential abundance calculations based on the negative binomial Wald test. p values were adjusted by using the Benjamini-Hochberg method for false discovery rate.
QUANTIFICATION AND STATISTICAL ANALYSIS
The number of mice per group and experimental repeats are annotated in each of the corresponding figure legends. Data followed a Gaussian distribution and variation was similar between groups for the conditions analyzed. Significance was assessed using the unpaired Student’s t test or one-way ANOVA with a Tukey post-test in GraphPad Prism software (GraphPad). In all figures, the mean value is visually depicted. p values correlate with symbols as follows: ns = not significant, p > 0.05, * p ≤ 0.05, ** p ≤ 0.01, *** p ≤ 0.001, **** p ≤ 0.0001. Mice were allocated randomly into experimental groups after matching for age and gender.
Supplementary Material
KEY RESOURCES TABLE.
| REAGENT or RESOURCE | SOURCE | IDENTIFIER |
|---|---|---|
| Antibodies | ||
| Per-Cp-Cy5.5 anti-mouse TCR-beta (clone H57–597) | Biolegend | Cat# 109228; RRID: AB_1575173 |
| Per-Cp-Cy5.5 anti-mouse Ly6G (clone 1A8) | Biolegend | Cat# 127616; RRID: AB_1877271 |
| FITC anti-mouse/Rat ICOS (clone C398.4A) | Thermo Fisher Scientific | Cat# 11–9949-82; RRID: AB_465458 |
| FITC anti-mouse CD3 (clone 17A2) | BD Biosciences | Cat# 555274; RRID: AB_395698 |
| FITC anti-mouse GL3 (clone eBioGL3) | Thermo Fisher Scientific | Cat# 11–5711-82; RRID: AB_465238 |
| Pe-Cy7 anti-mouse CD8 (clone 53–6.7) | BD Biosciences | Cat# 552877; RRID: AB_394506 |
| Pe-Cy7 anti-mouse CD11c (clone HL3) | BD Biosciences | Cat# 558079; RRID: AB_647251 |
| PE anti-mouse CD4 (clone GK1.5) | Biolegend | Cat# 100407; RRID: AB_312692 |
| APC-efluor 780 anti-mouse B220 (clone RA3–6B2) | Thermo Fisher Scientific | Cat# 47–0452-80; RRID: AB_1518811 |
| APC-efluor 780 anti-mouse CD3 (clone 145–2C11) | Thermo Fisher Scientific | Cat# 47–0031-82; RRID: AB_11149861 |
| APC-efluor 780 anti-mouse CD11b (clone M1/70) | Thermo Fisher Scientific | Cat# 47–0112-82; RRID: AB_1603193 |
| APC-efluor 780 anti-mouse CD11c (clone N4818) | Thermo Fisher Scientific | Cat# 47–0114-82; RRID: AB_1548652 |
| APC-efluor 780 anti-mouse F4/80 (clone BM8) | Invitrogen | Cat# 47–4801-82; RRID: AB_2735036 |
| AlexaFluor700 anti-mouse CD45 (clone 30-F11) | Invitrogen | Cat# 56–0451-82; RRID:AB_891454 |
| APC anti-mouse CD44 (clone IM7) | Thermo Fisher Scientific | Cat# 17–0441-82; RRID: AB_469390 |
| APC anti-mouse MHCII (clone M5/114.15.2) | Thermo Fisher Scientific | Cat# 17–5321-82; RRID: AB_469455 |
| APC anti-mouse CD4 (clone GK1.5) | Thermo Fisher Scientific | Cat# 47–0041-82; RRID:AB_11218896 |
| e450 anti-mouse MHCII (clone M5/114.15.2) | Thermo Fisher Scientific | Cat#48–5321-82; RRID: AB_1272204 |
| e450 anti-mouse Foxp3 (clone FJK-16S) | Thermo Fisher Scientific | Cat#48–5773-82; RRID: AB_1518812 |
| BV480 anti-mouse CD44 (clone IM7) | BD Biosciences | Cat# 566116; RRID:AB_655116 |
| BV605 anti-mouse CD8 (clone 53–6.7) | Biolegend | Cat# 100744; RRID: AB_2562609 |
| BV605 anti-mouse TCR-beta (clone H57–597) | BD Biosciences | Cat# 562840; RRID: AB_2687544 |
| BV650 anti-mouse CD11c (clone N418) | Biolegend | Cat# 117339; RRID:AB_2562414 |
| BV650 anti-mouse CD4 (clone RM4–5) | BD Biosciences | Cat#563747; RRID: AB_2716859 |
| BV711 anti-mouse CD11b (clone M1/70) | Biolegend | Cat#101241; RRID:AB_11218791 |
| BV711 anti-mouse CD3 (clone 145–2C11) | BD Biosciences | Cat#563123; RRID: AB_2687954 |
|
Bacterial and virus strains | ||
| Staphylococcus epidermidis Tü3298 | Provided by Michael Otto (Augustin and Gotz, 1990) | N/A |
|
Chemicals, peptides, and recombinant proteins | ||
| Collagenase from Clostridiumhistolyticum, Type XI | Sigma-Aldrich | Cat#C9407 |
| Collagenase from Clostridiumhistolyticum, Type I | Sigma-Aldrich | Cat#SCR103 |
| Collagenase from Clostridiumhistolyticum, Type IV | Sigma-Aldrich | Cat#lS00418 |
| DNase | Sigma-Aldrich | Cat#DN25 |
| Hyaluronidase from bovine testes | Sigma-Aldrich | Cat#H3506 |
| Tryptic Soy Medium | BD-Bacto | Cat#211825 |
| PE-conjugated 2w-loaded I-A(b) Tetramer | Provided by James Moon | N/A |
| PE-conjugated and APC-conjugated Mr1-loaded Tetramer | Provided by NIH Tetramer Core | N/A |
| Fetal bovine serum | Fisher scientific | Cat#SH3054103 |
| Fetal calf serum | Fisher scientific | Cat#SH3007303 |
|
Critical commercial assays | ||
| Myeloperoxidase (MPO) Activity Assay Kit (Colorimetric) | Abcam | Cat#ab105136 |
| Mouse High Sensitivity T-Cell 18-Plex Discovery Assay® Array (MDHSTC18) | Eve Technologies | Cat#MDHSTC18 |
| Power SYBR™ Green PCR Master Mix | Applied Biosystems™ | Cat#4367659 |
| CellTrace™ Violet Cell Proliferation Kit, for flow cytometry | Invitrogen | Cat#C34557 |
| Yeast Lysis Buffer | GoldBio | Cat#GB-178 |
| DNeasy PowerSoil Pro Kit | Qiagen | Cat#47016 |
| GentleMACS M Tubes | Miltenyi Biotec | Cat#130–093-236 |
| Pierce Protease Inhibitor Mini | Thermo Scientific™ | Cat#A32953 |
| Pierce™ BCA Protein Assay Kit | Thermo Scientific™ | Cat#23225 |
| Chloramphenicol, Water-Soluble | Sigma-Aldrich | Cat#C3175–100MG |
| EasySep™ Mouse PE Positive Selection Kit | StemCell Technologies | Cat#18554 |
| EasySep™ Mouse APC Positive Selection Kit II | StemCell Technologies | Cat#17667 |
| Mouse FoxP3 Buffer Set | eBiosciences | Cat#00–5523-00 Ghost |
| Ghost Dye™ Violet 510 Live/Dead Stain | Tonbo Biosciences | Cat#13–0870-T100 |
| Ghost Dye Violet 780 Live/Dead Stain | Tonbo | Cat#13–0865-T100 |
|
Deposited data | ||
| Skin 16S rRNA sequencing data | This paper | Bioproject: PRJNA828627 Biosample ID: SAMN27680022- SAMN27680055 https://www.ncbi.nlm.nih.gov/biosample/ |
| Stool 16S rRNA sequencing data | This paper | Bioproject: PRJNA828627 Biosample ID: SAMN27680056- SAMN27680065 https://www.ncbi.nlm.nih.gov/biosample/ |
|
Experimental models: Organisms/strains | ||
| SPF B6 mice | Jackson Laboratory | B6.129(Cg)-Foxp3tm4(YFP/icre)Ayr/J Cat#016959 |
| Cd4cre mice | Jackson Laboratory | Tg(Cd4-cre)1Cwi/BfluJ Cat#017336 |
| Foxp3YFP-cre mice | Jackson Laboratory | B6.129(Cg)-Foxp3tm4(YFP/icre)Ayr/J Cat#016959 |
| IL1rloxP/loxP mice | Jackson Laboratory | B6.129(Cg)-Il1r1tm1.1Rbl/J Cat#028398 |
| Il6rafl/fl mice | Jackson Laboratory | B6; SJL-Il6ratm1.1Drew/J Cat#012944 |
| CAG:KikGr mice | Jackson Laboratory | Tg(CAG-KikGR33Hadj/J Cat#013753 |
| Villin-CreERT2 mice | El Marjou et al., 2004 & Kattah et al., (2018) (Gift from Averil Ma) | N/A |
| Abinfl/fl mice | Kattah et al., (2018) (Gift from Averil Ma) | N/A |
| A20fl/fl mice | Kattah et al., (2018) (Gift from Averil Ma) | N/A |
|
Oligonucleotides | ||
|
S. epidermidis DivIA gene primer F:TTCCGCTCTCGTTTCCGT; |
Mastronardi and Ramírez-Arcos (2007) | N/A |
|
S. epidermidis DivIA gene primer R:ATTGCACGTTCTTCAGGTGT |
Mastronardi and Ramírez-Arcos (2007) | N/A |
| Universal 16S primers for qPCR F:TCCTACGGG AGGCAGCAGT |
Gollwitzer et al., (2014) | N/A |
| Universal 16S primers for qPCR R:GGACTACCAGGGTATCTAATCTT |
Gollwitzer et al., (2014) | N/A |
| V1-V3 primers for skin 16S rRNA sequencing amplification F:AGAGTTTGATCCTGGCTCAG |
Oh et al., (2014) | N/A |
| V1-V3 primers for skin 16S rRNA sequencing amplification R:ATTACCGCGGCTGCTGG |
Oh et al., (2014) | N/A |
| V4 primers for stool 16S rRNA sequencing amplification F:GTGCCAGCMGCCGCGGTAA |
Caporaso et al., (2011) | N/A |
| V4 primers for stool 16S rRNA sequencing amplification R:GGACTACHVGGGTWTCTAAT |
Caporaso et al., (2011) | N/A |
|
Recombinant DNA | ||
| pJL74–2W-gpmCherry | Scharschmidt et al., (2015) | GenBank ID: MK928252 |
| pJL74-OVA-zsgreen | This paper | GenBank ID: ON351528 |
|
Software and algorithms | ||
| GraphPad Prism | GraphPad Software, Inc | http://www.graphpad.com/scientificsoftware/prism/ |
| FlowJo v10.5–10.7.1 | FlowJo, LLC | https://www.flowjo.com/solutions/flowjo |
| R Statistical Computing Software | The R Foundation | https://www.r-project.org/ |
Highlights.
Intestinal inflammation undermines established tolerance to skin commensal bacteria
Murine models of colitis reverse the Treg-rich CD4+ response to S. epidermidis (S. epi)
Colitis promotes CD4+ T cell circulation between gut and skin-draining lymph nodes
T cell sensing of IL-1 shifts towards colitis-induced S. epi-specific effector T cells
ACKNOWLEDGMENTS
We thank James Moon for 2W tetramer reagents and expertise; Clifford Lowell, Michael Rosenblum, Ari Molofsky, John Leech, and Joshua Moreau for helpful discussions; Jun Ma for training on DSS colitis; Feng Chun Liu (with support from Mark Looney and UCSF Bakar ImmunoX Initiative) for training on mouse surgery; Marcela Taruselli for assistance with surgeries and Ari Molofsky for providing the light source for the KikGr model; Margaret Alexander and Renuka Nayak for training on gut tissue preparation; Michelle Chu for cloning the S. epi-OVA strain; Yongmei Hu for mouse husbandry; Sepideh Nozzari and Oluwasunmisola Ojewumi for genotyping; Jessie Turnbaugh and Kimberly Ly (UCSF Gnotobiotics Core Facility) for help with GF experiments; Sean Conlan for help with skin 16S sequencing; and the UCSF Microbial Genomics Co-Lab Plug-in (http://microbiome.ucsf.edu/) for stool 16S sequencing and analysis. Analysis of skin 16S sequencing used the NIH High Performance Computing Biowulf cluster (http://hpc.nih.gov/). We acknowledge UCSF’s PFCC (RRID: SCR_018206) for assistance in flow cytometry and cell sorting, supported by NIH grants P30 DK063720 and 1S10OD021822–01. This work was supported in part by the Intramural Research Programs of the National Institute of Arthritis and Musculoskeletal and Skin Diseases (J.H. and H.H.K.) and the National Human Genome Research Institute (J.A.S.). G.R.M. was supported by UCSF BMS T32GM008568, NIGMS, and National Science Foundation GRFP 1650113. This work was primarily funded by grants NIH DP2AI144968 and Burroughs Wellcome Fund CAMS-1015631 to T.C.S.
Footnotes
SUPPLEMENTAL INFORMATION
Supplemental information can be found online at https://doi.org/10.1016/j.celrep.2022.110891.
DECLARATION OF INTERESTS
T.C.S. is on the Scientific Advisory Board of Concerto Biosciences. S.V.L. is co-founder and shareholder of Siolta Therapeutics, Inc. and serves on its board of directors. J.N.C. is a consultant for Trex Bio. All other authors have no competing interests.
INCLUSION AND DIVERSITY
One or more of the authors of this paper self-identifies as an underrepresented ethnic minority in science. One or more of the authors of this paper received support from a program designed to increase minority representation in science. While citing references scientifically relevant for this work, we also actively worked to promote gender balance in our reference list.
REFERENCES
- Adlerberth I, Lindberg E, Aberg N, Hesselmar B, Saalman R, Strannegård IL, and Wold AE (2006). Reduced enterobacterial and increased staphylococcal colonization of the infantile bowel: an effect of hygienic life-style? Pediatr. Res 59, 96–101. 10.1203/01.pdr.0000191137.12774.b2. [DOI] [PubMed] [Google Scholar]
- Akdis CA (2021). Does the epithelial barrier hypothesis explain the increase in allergy, autoimmunity and other chronic conditions? Nat. Rev. Immunol 21, 739–751, Advance online publication. 10.1038/s41577-021-00538-7. [DOI] [PubMed] [Google Scholar]
- Al Nabhani Z, Dulauroy S, Marques R, Cousu C, Al Bounny S, Déjardin F, Sparwasser T, Bérard M, Cerf-Bensussan N, and Eberl G (2019). A weaning reaction to microbiota is required for resistance to immunopathologies in the adult. Immunity 50, 1276–1288.e5. 10.1016/j.immuni.2019.02.014. [DOI] [PubMed] [Google Scholar]
- Arai Y, Takanashi H, Kitagawa H, and Okayasu I (1998). Involvement of interleukin-1 in the development of ulcerative colitis induced by dextran sulfate sodium in mice. Cytokine 10, 890–896. 10.1006/cyto.1998.0355. [DOI] [PubMed] [Google Scholar]
- Atarashi K, Tanoue T, Shima T, Imaoka A, Kuwahara T, Momose Y, Cheng G, Yamasaki S, Saito T, Ohba Y, et al. (2011). Induction of colonic regulatory T cells by indigenous Clostridium species. Science 331, 337–341. 10.1126/science.1198469. [DOI] [PMC free article] [PubMed] [Google Scholar]
- Augustin J, and Gotz F (1990). Transformation of Staphylococcus epidermidis and other staphylococcal species with plasmid DNA by electroporation. FEMS Microbiology Letters 54, 203–207. 10.1016/0378-1097(90)90283-v. [DOI] [PubMed] [Google Scholar]
- Ayres JS (2016). Cooperative microbial tolerance behaviors in host-microbiota mutualism. Cell 165, 1323–1331. 10.1016/j.cell.2016.05.049. [DOI] [PMC free article] [PubMed] [Google Scholar]
- Basu R, Whitley SK, Bhaumik S, Zindl CL, Schoeb TR, Benveniste EN, Pear WS, Hatton RD, and Weaver CT (2015). IL-1 signaling modulates activation of STAT transcription factors to antagonize retinoic acid signaling and control the TH17 cell-iTreg cell balance. Nat. Immunol 16, 286–295. 10.1038/ni.3099. [DOI] [PMC free article] [PubMed] [Google Scholar]
- Belkaid Y, and Harrison OJ (2017). Homeostatic immunity and the microbiota. Immunity 46, 562–576. 10.1016/j.immuni.2017.04.008. [DOI] [PMC free article] [PubMed] [Google Scholar]
- Ben-Sasson SZ, Hu-Li J, Quiel J, Cauchetaux S, Ratner M, Shapira I, Dinarello CA, and Paul WE (2009). IL-1 acts directly on CD4 T cells to enhance their antigen-driven expansion and differentiation. Proc. Natl. Acad. Sci. U S A 106, 7119–7124. 10.1073/pnas.0902745106. [DOI] [PMC free article] [PubMed] [Google Scholar]
- Bloom SM, Bijanki VN, Nava GM, Sun L, Malvin NP, Donermeyer DL, Dunne WM Jr., Allen PM, and Stappenbeck TS (2011). Commensal Bacteroides species induce colitis in host-genotype-specific fashion in a mouse model of inflammatory bowel disease. Cell host & microbe 9, 390–403. 10.1016/j.chom.2011.04.009. [DOI] [PMC free article] [PubMed] [Google Scholar]
- Byrd AL, Belkaid Y, and Segre JA (2018). The human skin microbiome. Nat. Rev. Microbiol 16, 143–155. 10.1038/nrmicro.2017.157. [DOI] [PubMed] [Google Scholar]
- Callahan BJ, McMurdie PJ, Rosen MJ, Han AW, Johnson AJA, and Holmes SP (2016). DADA2: high-resolution sample inference from Illumina amplicon data. Nat. Methods 13, 581–583. 10.1038/nmeth.3869. [DOI] [PMC free article] [PubMed] [Google Scholar]
- Cao C, Yu M, and Chai Y (2019). Pathological alteration and therapeutic implications of sepsis-induced immune cell apoptosis. Cell Death Dis 10, 782. 10.1038/s41419-019-2015-1. [DOI] [PMC free article] [PubMed] [Google Scholar]
- Caporaso JG, Lauber CL, Walters WA, Berg-Lyons D, Lozupone CA, Turnbaugh PJ, Fierer N, and Knight R (2011). Global patterns of 16S rRNA diversity at a depth of millions of sequences per sample. Proc. Natl. Acad. Sci. U S A 108, 4516–4522. 10.1073/pnas.1000080107. [DOI] [PMC free article] [PubMed] [Google Scholar]
- Chen YE, Fischbach MA, and Belkaid Y (2018). Skin microbiota–host interactions. Nature 553, 427–436. 10.1038/nature25177. [DOI] [PMC free article] [PubMed] [Google Scholar]
- Chow J, Tang H, and Mazmanian SK (2011). Pathobionts of the gastrointestinal microbiota and inflammatory disease. Curr. Opin. Immunol 23, 473–480. 10.1016/j.coi.2011.07.010. [DOI] [PMC free article] [PubMed] [Google Scholar]
- Chung Y, Chang SH, Martinez GJ, Yang XO, Nurieva R, Kang HS, Ma L, Watowich SS, Jetten AM, Tian Q, and Dong C (2009). Critical regulation of early Th17 cell differentiation by interleukin-1 signaling. Immunity 30, 576–587. 10.1016/j.immuni.2009.02.007. [DOI] [PMC free article] [PubMed] [Google Scholar]
- Davis NM, Proctor DM, Holmes SP, Relman DA, and Callahan BJ (2018). Simple statistical identification and removal of contaminant sequences in marker-gene and metagenomics data. Microbiome 6, 226. 10.1186/s40168-018-0605-2. [DOI] [PMC free article] [PubMed] [Google Scholar]
- de Bruyn M, Sabino J, Vandeputte D, Vermeire S, Raes J, and Opdenakker G (2018). Comparisons of gut microbiota profiles in wild-type and gelatinase B/matrix metalloproteinase-9-deficient mice in acute DSS-induced colitis. NPJ Biofilms Microbiomes 4, 18. 10.1038/s41522-018-0059-0. [DOI] [PMC free article] [PubMed] [Google Scholar]
- De Pessemier B, Grine L, Debaere M, Maes A, Paetzold B, and Callewaert C (2021). Gut-skin Axis: current knowledge of the interrelationship between microbial dysbiosis and skin conditions. Microorganisms 9, 353. 10.3390/microorganisms9020353. [DOI] [PMC free article] [PubMed] [Google Scholar]
- Durack J, and Lynch SV (2019). The gut microbiome: relationships with disease and opportunities for therapy. J. Exp. Med 216, 20–40. 10.1084/jem.20180448. [DOI] [PMC free article] [PubMed] [Google Scholar]
- Eichele DD, and Kharbanda KK (2017). Dextran sodium sulfate colitis murine model: an indispensable tool for advancing our understanding of inflammatory bowel diseases pathogenesis. World J. Gastroenterol 23, 6016–6029. 10.3748/wjg.v23.i33.6016. [DOI] [PMC free article] [PubMed] [Google Scholar]
- Elinav E, Strowig T, Kau AL, Henao-Mejia J, Thaiss CA, Booth CJ, Peaper DR, Bertin J, Eisenbarth SC, Gordon JI, and Flavell RA (2011). NLRP6 inflammasome regulates colonic microbial ecology and risk for colitis. Cell 145, 745–757. 10.1016/j.cell.2011.04.022. [DOI] [PMC free article] [PubMed] [Google Scholar]
- Flowers L, and Grice EA (2020). The skin microbiota: balancing risk and reward. Cell host & microbe 28, 190–200. 10.1016/j.chom.2020.06.017. [DOI] [PMC free article] [PubMed] [Google Scholar]
- Fujimura KE, Sitarik AR, Havstad S, Lin DL, Levan S, Fadrosh D, Panzer AR, LaMere B, Rackaityte E, Lukacs NW, et al. (2016). Neonatal gut microbiota associates with childhood multisensitized atopy and T cell differentiation. Nat. Med 22, 1187–1191. 10.1038/nm.4176. [DOI] [PMC free article] [PubMed] [Google Scholar]
- Garcia-Gutierrez E, Walsh CJ, Sayavedra L, Diaz-Calvo T, Thapa D, Ruas-Madiedo P, Mayer MJ, Cotter PD, and Narbad A (2020). Genotypic and phenotypic characterization of fecal Staphylococcus epidermidis isolates suggests plasticity to adapt to different human body sites. Front. Microbiol 11, 688. 10.3389/fmicb.2020.00688. [DOI] [PMC free article] [PubMed] [Google Scholar]
- Gollwitzer ES, Saglani S, Trompette A, Yadava K, Sherburn R, McCoy KD, Nicod LP, Lloyd CM, and Marsland BJ (2014). Lung microbiota promotes tolerance to allergens in neonates via PD-L1. Nat. Med 20, 642–647. 10.1038/nm.3568. [DOI] [PubMed] [Google Scholar]
- González-Navajas JM, Law J, Nguyen KP, Bhargava M, Corr MP, Varki N, Eckmann L, Hoffman HM, Lee J, and Raz E (2010). Interleukin 1 receptor signaling regulates DUBA expression and facilitates Toll-like receptor 9-driven antiinflammatory cytokine production. J. Exp. Med 207, 2799–2807. 10.1084/jem.20101326. [DOI] [PMC free article] [PubMed] [Google Scholar]
- Hand TW, Dos Santos LM, Bouladoux N, Molloy MJ, Pagán AJ, Pepper M, Maynard CL, Elson CO 3rd, and Belkaid Y (2012). Acute gastrointestinal infection induces long-lived microbiota-specific T cell responses. Science 337, 1553–1556. 10.1126/science.1220961. [DOI] [PMC free article] [PubMed] [Google Scholar]
- Harrison OJ, Linehan JL, Shih HY, Bouladoux N, Han SJ, Smelkinson M, Sen SK, Byrd AL, Enamorado M, Yao C, et al. (2019). Commensal-specific T cell plasticity promotes rapid tissue adaptation to injury. Science 363, eaat6280. 10.1126/science.aat6280. [DOI] [PMC free article] [PubMed] [Google Scholar]
- Hedrick MN, Lonsdorf AS, Shirakawa AK, Lee CCR, Liao F, Singh SP, Zhang HH, Grinberg A, Love PE, Hwang ST, and Farber JM (2009). CCR6 is required for IL-23-induced psoriasis-like inflammation in mice. J. Clin. Invest 119, 2317–2329. 10.1172/jci37378. [DOI] [PMC free article] [PubMed] [Google Scholar]
- Horai R, Zárate-Bladés CR, Dillenburg-Pilla P, Chen J, Kielczewski JL, Silver PB, Jittayasothorn Y, Chan C-C, Yamane H, Honda K, and Caspi RR (2015). Microbiota-dependent activation of an autoreactive T cell receptor provokes autoimmunity in an immunologically privileged site. Immunity 43, 343–353. 10.1016/j.immuni.2015.07.014. [DOI] [PMC free article] [PubMed] [Google Scholar]
- Horton MK, McCauley K, Fadrosh D, Fujimura K, Graves J, Ness J, Wheeler Y, Gorman MP, Benson LA, Weinstock-Guttman B, et al. (2021). Gut microbiome is associated with multiple sclerosis activity in children. Ann. Clin. translational Neurol 8, 1867–1883. 10.1002/acn3.51441. [DOI] [PMC free article] [PubMed] [Google Scholar]
- Jain A, Song R, Wakeland EK, and Pasare C (2018). T cell-intrinsic IL-1R signaling licenses effector cytokine production by memory CD4 T cells. Nat. Commun 9, 3185. 10.1038/s41467-018-05489-7. [DOI] [PMC free article] [PubMed] [Google Scholar]
- Jiménez E, Delgado S, Maldonado A, Arroyo R, Albuújar M, García N, Jariod M, Fernaández L, Gómez A, and Rodríguez JM (2008). Staphylococcus epidermidis: a differential trait of the fecal microbiota of breast-fed infants. BMC Microbiol 8, 143. 10.1186/1471-2180-8-143. [DOI] [PMC free article] [PubMed] [Google Scholar]
- Kattah MG, Shao L, Rosli YY, Shimizu H, Whang MI, Advincula R, Achacoso P, Shah S, Duong BH, Onizawa M, et al. (2018). A20 and ABIN-1 synergistically preserve intestinal epithelial cell survival. J. Exp. Med 215, 1839–1852. 10.1084/jem.20180198. [DOI] [PMC free article] [PubMed] [Google Scholar]
- Kiner E, Willie E, Vijaykumar B, Chowdhary K, Schmutz H, Chandler J, Schnell A, Thakore PI, LeGros G, Mostafavi S, et al. (2021). Gut CD4+ T cell phenotypes are a continuum molded by microbes, not by TH archetypes. Nat. Immunol 22, 216–228. 10.1038/s41590-020-00836-7. [DOI] [PMC free article] [PubMed] [Google Scholar]
- Kitamoto S, Nagao-Kitamoto H, Jiao Y, Gillilland MG 3rd, Hayashi A, Imai J, Sugihara K, Miyoshi M, Brazil JC, Kuffa P, et al. (2020). The intermucosal connection between the mouth and gut in commensal pathobiont-driven colitis. Cell 182, 447–462.e14. 10.1016/j.cell.2020.05.048. [DOI] [PMC free article] [PubMed] [Google Scholar]
- Knoop KA, Gustafsson JK, McDonald KG, Kulkarni DH, Coughlin PE, McCrate S, Kim D, Hsieh CS, Hogan SP, Elson CO, et al. (2017). Microbial antigen encounter during a preweaning interval is critical for tolerance to gut bacteria. Sci. Immunol 2, eaao1314. 10.1126/sciimmunol.aao1314. [DOI] [PMC free article] [PubMed] [Google Scholar]
- Kobayashi T, Glatz M, Horiuchi K, Kawasaki H, Akiyama H, Kaplan DH, Kong HH, Amagai M, and Nagao K (2015). Dysbiosis and Staphylococcus aureus colonization drives inflammation in atopic dermatitis. Immunity 42, 756–766. 10.1016/j.immuni.2015.03.014. [DOI] [PMC free article] [PubMed] [Google Scholar]
- Krebs CF, Paust H-J, Krohn S, Koyro T, Brix SR, Riedel J-H, Bartsch P, Wiech T, Meyer-Schwesinger C, Huang J, et al. (2016). Autoimmune renal disease is exacerbated by S1P-Receptor-1-Dependent intestinal Th17 cell migration to the kidney. Immunity 45, 1078–1092. 10.1016/j.immuni.2016.10.020. [DOI] [PMC free article] [PubMed] [Google Scholar]
- Kutlubay Z, Tüzün Y, and Wolf R (2017). The pathergy test as a diagnostic tool. Skinmed 15, 97–104. [PubMed] [Google Scholar]
- Lai Y, Cogen AL, Radek KA, Park HJ, Macleod DT, Leichtle A, Ryan AF, Di Nardo A, and Gallo RL (2010). Activation of TLR2 by a small molecule produced by Staphylococcus epidermidis increases antimicrobial defense against bacterial skin infections. J. Invest. Dermatol 130, 2211–2221. 10.1038/jid.2010.123. [DOI] [PMC free article] [PubMed] [Google Scholar]
- Leech JM, Dhariwala MO, Lowe MM, Chu K, Merana GR, Cornuot C, Weckel A, Ma JM, Leitner EG, Gonzalez JR, et al. (2019). Toxin-triggered interleukin-1 receptor signaling enables early-life discrimination of pathogenic versus commensal skin bacteria. Cell host & microbe 26, 795–809.e5. 10.1016/j.chom.2019.10.007. [DOI] [PMC free article] [PubMed] [Google Scholar]
- Lehner MD, Ittner J, Bundschuh DS, van Rooijen N, Wendel A, and Hartung T (2001). Improved innate immunity of endotoxin-tolerant mice increases resistance to Salmonella enterica serovar typhimurium infection despite attenuated cytokine response. Infect. Immun 69, 463–471. 10.1128/IAI.69.1.463-471.2001. [DOI] [PMC free article] [PubMed] [Google Scholar]
- Leyva-Castillo JM, Galand C, Kam C, Burton O, Gurish M, Musser MA, Goldsmith JD, Hait E, Nurko S, Brombacher F, et al. (2019). Mechanical skin injury promotes food anaphylaxis by driving intestinal mast cell expansion. Immunity 50, 1262–1275.e4. 10.1016/j.immuni.2019.03.023. [DOI] [PMC free article] [PubMed] [Google Scholar]
- Ligumsky M, Simon PL, Karmeli F, and Rachmilewitz D (1990). Role of interleukin 1 in inflammatory bowel disease–enhanced production during active disease. Gut 31, 686–689. 10.1136/gut.31.6.686. [DOI] [PMC free article] [PubMed] [Google Scholar]
- Love MI, Huber W, and Anders S (2014). Moderated estimation of fold change and dispersion for RNA-seq data with DESeq2. Genome Biol 15, 550. 10.1186/s13059-014-0550-8. [DOI] [PMC free article] [PubMed] [Google Scholar]
- Lukens JR, Vogel P, Johnson GR, Kelliher MA, Iwakura Y, Lamkanfi M, and Kanneganti TD (2013). RIP1-driven autoinflammation targets IL-1α independently of inflammasomes and RIP3. Nature 498, 224–227. 10.1038/nature12174. [DOI] [PMC free article] [PubMed] [Google Scholar]
- Mabuchi T, Singh TP, Takekoshi T, Jia GF, Wu X, Kao MC, Weiss I, Farber JM, and Hwang ST (2013). CCR6 is required for epidermal trafficking of γδ-T cells in an IL-23-induced model of psoriasiform dermatitis. J. Invest. Dermatol 133, 164–171. 10.1038/jid.2012.260. [DOI] [PMC free article] [PubMed] [Google Scholar]
- Marzano AV, Borghi A, Stadnicki A, Crosti C, and Cugno M (2014). Cutaneous manifestations in patients with inflammatory bowel diseases: pathophysiology, clinical features, and therapy. I nflamm. Bowel Dis 20, 213–227. 10.1097/01.MIB.0000436959.62286.f9. [DOI] [PubMed] [Google Scholar]
- Marzano AV, Ortega-Loayza AG, Heath M, Morse D, Genovese G, and Cugno M (2019). Mechanisms of inflammation in neutrophil-mediated skin diseases. Front. Immunol 10, 1059. 10.3389/fimmu.2019.01059. [DOI] [PMC free article] [PubMed] [Google Scholar]
- Mastronardi CC, and Ramírez-Arcos S (2007). Quantitative PCR for detection and discrimination of the bloodborne pathogen Staphylococcus epidermidis in platelet preparations using divIVA and icaA as target genes. Can. J. Microbiol 53, 1222–1231. 10.1139/w07-091. [DOI] [PubMed] [Google Scholar]
- Mazmanian SK, Liu CH, Tzianabos AO, and Kasper DL (2005). An immunomodulatory molecule of symbiotic bacteria directs maturation of the host immune system. Cell 122, 107–118. 10.1016/j.cell.2005.05.007. [DOI] [PubMed] [Google Scholar]
- McEntee CP, Finlay CM, and Lavelle EC (2019). Divergent roles for the IL-1 family in gastrointestinal homeostasis and inflammation. Front. Immunol 10, 1266. 10.3389/fimmu.2019.01266. [DOI] [PMC free article] [PubMed] [Google Scholar]
- McLaren Michael R., and Callahan Benjamin J. (2021). Silva 138.1 Prokaryotic SSU Taxonomic Training Data Formatted for DADA2 [Data Set] (Zenodo) 10.5281/zenodo.4587955. [DOI]
- McMurdie PJ, and Holmes S (2013). phyloseq: an R package for reproducible interactive analysis and graphics of microbiome census data. PLoS one 8, e61217. 10.1371/journal.pone.0061217. [DOI] [PMC free article] [PubMed] [Google Scholar]
- Menghini P, Corridoni D, Buttó LF, Osme A, Shivaswamy S, Lam M, Bamias G, Pizarro TT, Rodriguez-Palacios A, Dinarello CA, and Cominelli F (2019). Neutralization of IL-1α ameliorates Crohn’s disease-like ileitis by functional alterations of the gut microbiome. Proc. Natl. Acad. Sci. U S A 116, 26717–26726. 10.1073/pnas.1915043116. [DOI] [PMC free article] [PubMed] [Google Scholar]
- Morton AM, Sefik E, Upadhyay R, Weissleder R, Benoist C, and Mathis D (2014). Endoscopic photoconversion reveals unexpectedly broad leukocyte trafficking to and from the gut. Proc. Natl. Acad. Sci. U S A 111, 6696–6701. 10.1073/pnas.1405634111. [DOI] [PMC free article] [PubMed] [Google Scholar]
- Myers B, Brownstone N, Reddy V, Chan S, Thibodeaux Q, Truong A, Bhutani T, Chang HW, and Liao W (2019). The gut microbiome in psoriasis and psoriatic arthritis. Best Pract. Res. Clin. Rheumatol 33, 101494. 10.1016/j.berh.2020.101494. [DOI] [PubMed] [Google Scholar]
- Naik S, Bouladoux N, Wilhelm C, Molloy MJ, Salcedo R, Kastenmuller W, Deming C, Quinones M, Koo L, Conlan S, et al. (2012). Compartmentalized control of skin immunity by resident commensals. Science 337, 1115–1119. 10.1126/science.1225152. [DOI] [PMC free article] [PubMed] [Google Scholar]
- Napier BA, Andres-Terre M, Massis LM, Hryckowian AJ, Higginbottom SK, Cumnock K, Casey KM, Haileselassie B, Lugo KA, Schneider DS, et al. (2019). Western diet regulates immune status and the response to LPS-driven sepsis independent of diet-associated microbiome. Proc. Natl. Acad. Sci. U S A 116, 3688–3694. 10.1073/pnas.1814273116. [DOI] [PMC free article] [PubMed] [Google Scholar]
- Nowotschin S, and Hadjantonakis AK (2009). Use of KikGR a photoconvertible green-to-red fluorescent protein for cell labeling and lineage analysis in ES cells and mouse embryos. BMC Dev. Biol 9, 49. 10.1186/1471-213X-9-49. [DOI] [PMC free article] [PubMed] [Google Scholar]
- Oh J, Byrd AL, Deming C, Conlan S, Kong HH, and Segre JA; NISC Comparative Sequencing Program (2014). Biogeography and individuality shape function in the human skin metagenome. Nature 514, 59–64. 10.1038/nature13786. [DOI] [PMC free article] [PubMed] [Google Scholar]
- Oksanen J, Blanchet FG, Kindt R, Legendre P, Minchin PR, O’Hara RB, Simpson GL, Solymos P, Stevens MHH, and Wagner HH (2013). Vegan: Community Ecology Package. R Package Version. 2.0–10 (CRAN)
- Oyoshi MK, Elkhal A, Scott JE, Wurbel MA, Hornick JL, Campbell JJ, and Geha RS (2011). Epicutaneous challenge of orally immunized mice redirects antigen-specific gut-homing T cells to the skin. J. Clin. Invest 121, 2210–2220. 10.1172/JCI43586. [DOI] [PMC free article] [PubMed] [Google Scholar]
- Quast C, Pruesse E, Yilmaz P, Gerken J, Schweer T, Yarza P, Peplies J, and Glöckner FO (2013). The SILVA ribosomal RNA gene database project: improved data processing and web-based tools. Nucleic Acids Res 41, D590–D596. 10.1093/nar/gks1219. [DOI] [PMC free article] [PubMed] [Google Scholar]
- Rackaityte E, Halkias J, Fukui EM, Mendoza VF, Hayzelden C, Crawford ED, Fujimura KE, Burt TD, and Lynch SV (2020). Viable bacterial colonization is highly limited in the human intestine in utero. Nat. Med 26, 599–607. 10.1038/s41591-020-0761-3. [DOI] [PMC free article] [PubMed] [Google Scholar]
- Rigoni R, Fontana E, Dobbs K, Marrella V, Taverniti V, Maina V, Facoetti A, D’Amico G, Al-Herz W, Cruz-Munoz ME, et al. (2020). Cutaneous barrier leakage and gut inflammation drive skin disease in Omenn syndrome. J. Allergy Clin. Immunol 146, 1165–1179.e11. 10.1016/j.jaci.2020.04.005. [DOI] [PMC free article] [PubMed] [Google Scholar]
- Rosenblum MD, Way SS, and Abbas AK (2016). Regulatory T cell memory. Nat. Rev. Immunol 16, 90–101. 10.1038/nri.2015.1. [DOI] [PMC free article] [PubMed] [Google Scholar]
- Round JL, and Mazmanian SK (2010). Inducible Foxp3+ regulatory T-cell development by a commensal bacterium of the intestinal microbiota. Proc. Natl. Acad. Sci. U S A 107, 12204–12209. 10.1073/pnas.0909122107. [DOI] [PMC free article] [PubMed] [Google Scholar]
- Russell SL, Gold MJ, Hartmann M, Willing BP, Thorson L, Wlodarska M, Gill N, Blanchet MR, Mohn WW, McNagny KM, and Finlay BB (2012). Early life antibiotic-driven changes in microbiota enhance susceptibility to allergic asthma. EMBO Rep 13, 440–447. 10.1038/embor.2012.32. [DOI] [PMC free article] [PubMed] [Google Scholar]
- de Sá DC, and Neto CF (2016). Inflammasomes and dermatology. An. Bras. Dermatol 91, 566–578. 10.1590/abd1806-4841.20165577. [DOI] [PMC free article] [PubMed] [Google Scholar]
- Scharschmidt TC, Vasquez KS, Pauli ML, Leitner EG, Chu K, Truong HA, Lowe MM, Sanchez Rodriguez R, Ali N, Laszik ZG, et al. (2017). Commensal microbes and hair follicle morphogenesis coordinately drive Treg migration into neonatal skin. Cell host & microbe 21, 467–477.e5. 10.1016/j.chom.2017.03.001. [DOI] [PMC free article] [PubMed] [Google Scholar]
- Scharschmidt TC, Vasquez KS, Truong HA, Gearty SV, Pauli ML, Nosbaum A, Gratz IK, Otto M, Moon JJ, Liese J, et al. (2015). A wave of regulatory T cells into neonatal skin mediates tolerance to commensal microbes. Immunity 43, 1011–1021. 10.1016/j.immuni.2015.10.016. [DOI] [PMC free article] [PubMed] [Google Scholar]
- Seo SU, Kamada N, Muñoz-Planillo R, Kim YG, Kim D, Koizumi Y, Hasegawa M, Himpsl SD, Browne HP, Lawley TD, et al. (2015). Distinct commensals induce interleukin-1b via NLRP3 inflammasome in inflammatory monocytes to promote intestinal inflammation in response to injury. Immunity 42, 744–755. 10.1016/j.immuni.2015.03.004. [DOI] [PMC free article] [PubMed] [Google Scholar]
- Song H, Yoo Y, Hwang J, Na YC, and Kim HS (2016). Faecalibacterium prausnitzii subspecies-level dysbiosis in the human gut microbiome underlying atopic dermatitis. J. Allergy Clin. Immunol 137, 852–860. 10.1016/j.jaci.2015.08.021. [DOI] [PubMed] [Google Scholar]
- Su LF, Del Alcazar D, Stelekati E, Wherry EJ, and Davis MM (2016). Antigen exposure shapes the ratio between antigen-specific Tregs and conventional T cells in human peripheral blood. Proc. Natl. Acad. Sci. U S A 113, E6192–E6198. 10.1073/pnas.1611723113. [DOI] [PMC free article] [PubMed] [Google Scholar]
- Wirtz S, Popp V, Kindermann M, Gerlach K, Weigmann B, Fichtner-Feigl S, and Neurath MF (2017). Chemically induced mouse models of acute and chronic intestinal inflammation. Nat. Protoc 12, 1295–1309. 10.1038/nprot.2017.044. [DOI] [PubMed] [Google Scholar]
- Wu HJ, Ivanov II, Darce J, Hattori K, Shima T, Umesaki Y, Littman DR, Benoist C, and Mathis D (2010). Gut-residing segmented filamentous bacteria drive autoimmune arthritis via T helper 17 cells. Immunity 32, 815–827. 10.1016/j.immuni.2010.06.001. [DOI] [PMC free article] [PubMed] [Google Scholar]
- Xie JH, Nomura N, Koprak SL, Quackenbush EJ, Forrest MJ, and Rosen H (2003). Sphingosine-1-phosphate receptor agonism impairs the efficiency of the local immune response by altering trafficking of naive and antigen-activated CD4+ T cells. J. Immunol 170, 3662–3670. 10.4049/jimmunol.170.7.3662. [DOI] [PubMed] [Google Scholar]
- Xu M, Pokrovskii M, Ding Y, Yi R, Au C, Harrison OJ, Galan C, Belkaid Y, Bonneau R, and Littman DR (2018). c-MAF-dependent regulatory T cells mediate immunological tolerance to a gut pathobiont. Nature 554, 373–377. 10.1038/nature25500. [DOI] [PMC free article] [PubMed] [Google Scholar]
Associated Data
This section collects any data citations, data availability statements, or supplementary materials included in this article.
Supplementary Materials
Data Availability Statement
Skin and stool 16S rRNA sequencing data has been deposited in the NCBI Biosample database Bioproject: PRJNA828627; Bio-sample ID: SAMN27680022-SAMN27680065 (https://www.ncbi.nlm.nih.gov/biosample/). This paper does not report original code. Any additional information required to reanalyze the data reported in this paper is available from the Lead contact upon request.