

Abstract
The clinical benefits of pan-mTOR active-site inhibitors are limited by toxicity and relief of feedback inhibition of receptor expression. To address these limitations, we designed a series of compounds that selectively inhibit mTORC1 and not mTORC2. These `bi-steric inhibitors’ comprise a rapamycin-like core moiety covalently linked to an mTOR active-site inhibitor. Structural modification of these components modulated their affinities for their binding sites on mTOR and the selectivity of the bi-steric compound. mTORC1-selective compounds potently inhibited 4EBP1 phosphorylation and caused regressions of breast cancer xenografts. Inhibition of 4EBP1 phosphorylation was sufficient to block cancer cell growth and was necessary for maximal antitumor activity. At mTORC1-selective doses, these compounds do not alter glucose tolerance, nor do they relieve AKT-dependent feedback inhibition of HER3. Thus, in preclinical models, selective inhibitors of mTORC1 potently inhibit tumor growth while causing less toxicity and receptor reactivation as compared to pan-mTOR inhibitors.
Introduction
Dysregulation of PI3K/mTOR signaling occurs frequently in cancers1,2. mTOR kinase forms the core of two distinct complexes, mTORC1 and mTORC2, which support the growth and proliferation of normal and tumor cells3,4. In response to nutrients and growth factors, mTORC1 regulates mRNA translation and cell size by multiple mechanisms, including phosphorylation of ribosomal S6 kinase (S6K) and eukaryotic initiation factor 4E-binding proteins (4EBPs), whereas mTORC2 regulates cell metabolism, proliferation, and survival by phosphorylating AGC family kinases such as AKT4–7. Activated mTORC1 activates protein synthesis by phosphorylating 4EBP proteins and relieving their inhibition of cap-dependent translation.8,9. The importance of the PI3K/mTOR pathway has led to the development of PI3K, AKT, and mTOR inhibitors as anticancer agents10,11.
Rapamycin (1) and its analogs (rapalogs) bind to the immunophilin FKBP1212. This complex binds to the FKBP-rapamycin binding (FRB) domain of mTOR and allosterically inhibits phosphorylation of the substrate S6K, but only weakly inhibits 4EBP1 phosphorylation and has negligible effects on mTORC213,14. Rapalogs have only modest antitumor activity in patients15–17. To address these issues, ATP-competitive inhibitors of mTOR kinase, which potently inhibit both mTORC1 and mTORC2 (pan-mTOR active-site inhibitors), were generated, but their clinical activity remains marginal18,19.
Suppression of mTORC2 activity by pan-mTOR inhibitors reduces AKT activation, which has two potential drawbacks: induction of hyperglycemia20 and relief of AKT-dependent feedback inhibition of receptor tyrosine kinase (RTK) expression21–24. Thus, we sought to develop an mTORC1-selective inhibitor. A third-generation mTOR inhibitor in which rapamycin and a pan-mTOR active-site inhibitor are joined covalently via a linker was recently described25. We term this inhibitor “bi-steric” due to its concurrent engagement of the FRB (allosteric) and catalytic (orthosteric) domains of mTOR. The prototype of this class, RapaLink-1 (2), inhibits mTOR activity more potently than other mTOR kinase inhibitors do, and with modest selectivity for mTORC1 (three- to four-fold)25,26. We now describe a series of such bi-steric compounds and identify potent inhibitors that are more than 30-fold selective for mTORC1. Unlike rapalogs, they effectively suppress 4EBP1 phosphorylation and, unlike pan-mTOR inhibitors, do not inhibit mTORC2 phosphorylation of AKT. They inhibit tumor growth in xenograft models at doses that do not cause glucose intolerance in vivo and induce RTKs to a limited extent compared to pan-mTOR inhibitors. These preclinical data suggest that bi-steric mTORC1-selective inhibitors may have significant anticancer activity with less toxicity and induction of adaptive resistance than pan-mTOR active-site inhibitors.
Results
Generation of bi-steric mTORC1 inhibitors
RapaLink-1 is composed of linked orthosteric and allosteric mTOR inhibitors. Similar linked arrangements have been exploited to engineer subtype-selective inhibitors of G protein-coupled receptors27,28, where high affinity binding and receptor subtype specificity were provided by the orthosteric and allosteric components, respectively. We speculated that the analogous components of RapaLink-1 might be exploited similarly. Active-site inhibitors bind with similar affinity to both mTORC1 and mTORC210,11,29. The rapamycin-FKBP12 binary complex, in contrast, selectively binds to the FRB domain in mTORC1, because the RICTOR subunit of mTORC2 occludes this domain4,12,30 (Fig. 1a). This suggests that mTORC2 inhibition by RapaLink-1 is driven largely by the active-site binding moiety, whereas mTORC1 inhibition is driven by both moieties. Thus, reducing the affinity of the active-site binding component may have a greater impact on mTORC2 inhibition than mTORC1 inhibition. To test this hypothesis, we employed a modular synthetic approach that divided bi-steric molecules into four components: i) rapamycin core; ii) attachment site of a terminal-alkyne chemical handle to the rapamycin core; iii) linker with an azide terminus; and iv) active-site inhibitor analog (Fig. 1b, c, d). To modulate the affinity of the rapamycin core for FKBP12 and FRB, we modified at C16 (methyl carbamate) and C32 (O-methoxy). We coupled a terminal alkyne functional group to C26 as well as C40 to provide two alternate geometries of bi-steric inhibitor (Fig. 1c, d). These modified rapamycin cores were coupled to azide-containing, linker-connected active-site inhibitors via copper-catalyzed cycloaddition (click reaction) (Supplementary Table 1). mTORC1/2 selectivity of compounds was assessed by comparing the potencies for inhibition of 4EBP1 T37/T46 phosphorylation (mTORC1) and AKT S473 phosphorylation (mTORC2) in MDA-MB-468 (ER-, PR-, HER2-/PTEN deletion, EGFR amplification) breast cancer cells. In these cells, rapamycin inhibited phosphorylation of the mTORC1 substrate S6K (pS6K T389), but not of 4EBP1 (p4EBP1 T37/T46), and increased mTORC2-dependent AKT S473 phosphorylation due to relief of negative feedback31–33 (Fig. 1f). In contrast, pan-mTOR inhibitors MLN0128 (3) and PP242 (4), as well as RMC-6121 (5), an MLN0128 derivative with a portion of the bi-steric linker, inhibited both p4EBP1 T37/T46 and pAKT S473 (Fig. 1f, Supplementary Table 2, Supplementary Dataset 1).
Figure 1. Generation of mTOR bi-steric inhibitors with distinct mTORC1/2 selectivity profiles.

a) Representation of binding sites for FKBP12-rapamycin and active-site inhibitors in mTORC1 and mTORC2. Rapamycin has reduced affinity for mTORC2 due to partial occlusion of the FKBP12-rapamycin binding (FRB) domain, while active-site inhibitors have similar affinity for both complexes. b) Schematic representation of components of the bi-steric mTORC inhibitors: the rapamycin core (R), with sites of chemical modification shown as colored marks; the linker, with sites of attachment indicated by geometry of components and green and red color; and the active-site inhibitor analog (ASI). c) Structure of the rapamycin core, showing the linker attachment sites at C40 (green) and C26 (red), and the core modification sites at C32 (pink) and C16 (orange). d) Structures of the bi-steric molecules. The C40-linked bi-steric inhibitor RMC-4627 (BiS-13x) is shown in full, with modifications resulting in the inhibitors RMC-4287 (BiS-NS; replacement of the PP242 active-site inhibitor with MLN0128) and RMC-4745 (Bi-35x; methylcarbamate modification at C16) indicated. The C26-linked bi-steric inhibitor RMC-4529 (BiS-31x) is shown in full, with the C32 (R)-methoxy modification indicated in pink and the C26 oxime linker attachment indicated in red. e) Schematic representation of the design approach combining different linkers, active-site inhibitors, and core modifications to increase selectivity for mTORC1 over mTORC2 while maintaining potency. f) Levels of p4EBP1 T37/T46, pS6K T389, and pAKT S473 determined by MesoScale Discovery (MSD) or AlphaLISA platforms for whole cell lysates from MDA-MB-468 cells incubated with increasing concentrations of indicated compounds for two hours. These are graphs of representative experiments in which each data point is the mean of technical duplicates and normalized to vehicle control, with error bars representing SD. Independent replicate experiments: Rapamycin, n=5; MLN0128, n=7; RMC-4287, n=10; RMC-4627, n=11; RMC-4529, n=5; RMC-4745; n=5.
We first describe RMC-4287 (6) and RMC-4627 (7). RMC-4287 is an analog of RapaLink-1 with a rapamycin monomer modified with a functionally equivalent, but more efficiently incorporated, chemical handle (Supplementary Table 1). RMC-4287 and RapaLink-1 are only three- to four-fold selective for mTORC1 over mTORC2 in MDA-MB-468, and we term them ‘pan-mTOR’ bi-steric inhibitors (Supplementary Table 2, Supplementary Dataset 1). RMC-4627 is identical to RMC-4287 except that the active-site binding moiety MLN0128 is replaced with the 45–90-fold less potent inhibitor PP242 (Fig. 1d, e; Supplementary Table 2, Supplementary Dataset 1). The selectivity of RMC-4627 for mTORC1 over mTORC2 in MDA-MB-468 is four times greater (to 13-fold) than that of RMC-4287 or RapaLink-1, whereas all three are equipotent inhibitors of p4EBP1 and pS6K (Fig. 1f, Supplementary Table 2, Supplementary Dataset 1). The enhanced selectivity of RMC-4627 is consistent with our hypothesis that selectivity for mTORC1 can be increased by reducing affinity for the mTOR active site.
Inhibition of both mTORC1 and mTORC2 by RapaLink-1 require its binding to FKBP12/FRB25. We asked whether inhibition of mTORC2 could be reduced further by lowering the affinity of the rapamycin core for FKBP12/FRB. We introduced a C16-methylcarbamate modification to the rapamycin core, which reduced potency for inhibition of mTORC1 (pS6K) in MDA-MB-468 cells 97-fold (RMC-4451 (8), Supplementary Table 2, Supplementary Dataset 1)34,35. RMC-4745 (9) is a bi-steric compound with this rapamycin core modification linked to a PP242 active-site inhibitor, so that its binding affinities to both mTOR sites are reduced relative to those of RMC-4287 and RapaLink-1 (Fig 1d, e). RMC-4745 is a 35-fold more potent inhibitor of mTORC1 than mTORC2, a 2.5-fold increase in selectivity compared to RMC-4627. This increase is, however, accompanied by a 17-fold loss in potency for mTORC1 (4EBP1) (Fig. 1f, Supplementary Table 2, Supplementary Dataset 1). Its reduced potency and poor solubility made it impractical to formulate RMC-4745 for doses required for in vivo evaluation.
We asked whether selectivity could be achieved with the more potent MLN0128 active-site inhibitor if binding to the allosteric site was reduced further (Fig 1e). We introduced a methoxy group at C32 and a propargyl oxime at C26 to generate RMC-4329 (10), a rapalog that inhibits mTORC1 (pS6K) 350-fold less potently than does rapamycin (Supplementary Table 2, Supplementary Dataset 1). RMC-4529 (11) is a bi-steric compound comprised of RMC-4329 linked to MLN0128 (Fig 1d). It inhibits mTORC1 31-fold more potently than mTORC2, and is a low nanomolar inhibitor of the former (4EBP1 T37/T46 (IC50 6.37 nM) and S6K (IC50 0.98 nM)) (Fig. 1f, Supplementary Table 2, Supplementary Dataset 1).
For clarity, the bi-steric mTOR inhibitors will hereafter be referred to by their selectivity for mTORC1 over mTORC2 in MDA-MB-468 cells. The non-selective bi-steric inhibitor RMC-4287 is called BiS-NS, and the selective inhibitors (RMC-4627, RMC-4529, and RMC-4745) are designated by their degree of selectivity BiS-13x, BiS-31x, and BiS-35x, respectively.
The relative selectivity of the compounds in MDA-MB-468 was reproduced in additional breast cancer cells lines chosen for their activation of the PI3K/mTOR pathway1. In MCF-7 (ER+/PIK3CAE545K) breast cancer cells, we observed 18-, 13- and >44-fold mTORC1/mTORC2 selectivity, respectively (Supplementary Table 2, Supplementary Dataset 1). Selectivity for mTORC1 over mTORC2 was also observed in other breast cancer cell lines, ZR-75–1 (ER+/PTENL108R) and HCC1954 (HER2+/PIK3CAH1047R) (Extended Data Fig. 1a).
Rapamycin has been reported to inhibit AKT phosphorylation in a time-dependent manner in some cell lines14. We investigated the effects of exposing three cell lines, A375 (melanoma, BRAF V600E), MCF-7, and PC3 (prostate cancer, TP53 deletion), to rapamycin, RapaLink-1, BiS-31x, or BiS-35x for 4 or 24 hours. (Extended Data Fig. 1b). In A375 and MCF-7, there was no change in the mTORC1 selectivity at 24 hours for any compound. In PC3 cells, rapamycin caused significant inhibition of AKT S473 phosphorylation at 24 hours whereas the mTORC1-selective bi-steric inhibitors caused only minor inhibition.
In order to rule out whether the apparent mTORC1 selectivity of these inhibitors is an artifact of the release of feedback inhibition of AKT S473, we overexpressed a myristoylated form of AKT (Myr-AKT) in MCF-7 cells (Extended Data Fig. 2). Phosphorylation of Myr-AKT at S473 is insensitive to feedback reactivation but remains sensitive to mTORC2 inhibition. RapaLink-1 inhibited pAKT S473 in both parental and Myr-AKT cells, whereas BiS-31x caused an increase in pAKT in parental cells but not Myr-AKT cells. BiS-31x up to a concentration of 100 nM did not inhibit pAKT S473 in Myr-AKT cells.
Mechanism of bi-steric mTORC1-inhibitors
In the absence of an atomic resolution structure of a bi-steric inhibitor in complex with mTORC1, we sought to validate the proposed mechanism of binding biochemically. The affinity of the bi-steric compounds for FKBP12 was determined with a TR-FRET competitive binding assay. The affinities of BiS-NS, BiS-13x, and BiS-35x for FKBP12 were all approximately 3-fold lower than that of rapamycin. BiS-31x has much lower affinity, with only 24.8% binding at 10 µM (Supplementary Table 3). This modest affinity for FKBP12 is nonetheless sufficient to induce ternary complex formation with FKBP12 and mTOR kinase in a cell-free TR-FRET ternary complex formation assay36. All four inhibitors induced a ternary complex with potencies at or below the assay limit of 2 nM (Extended Data Fig. 3a). Consistent with the formation of an FKBP12/mTOR/inhibitor ternary complex in cells, knockout of FKBP12 reduced the sensitivity of NCI-H358 lung cancer cells to inhibition of mTORC1 signaling (10–30 fold) and proliferation (more than 100-fold) by all four inhibitors (Extended Data Fig. 3b, c, d). Moreover, in MDA-MB-468 cells, 10 µM FK506, which competes with rapamycin for binding to FKBP1225,26, reduced the potency of the bi-steric inhibitors more than 100-fold (Extended Data Fig. 3e). These data suggest that formation of the ternary complex is required for the cellular activity of the bi-steric compounds. This conclusion is also supported by the 10-fold reduction in potency of BiS-31x in MCF-7 cells with an mTOR FRB mutation (F2108L) consistent with the reduced affinity of the compound for the FRB domain (Extended Data Fig. 3f). Neither FKBP12 knockout nor addition of FK506 had an impact on the inhibitory activity of the active-site inhibitor MLN0128.
We assessed the effects of the bi-steric compounds and of their component active-site binding moieties on a broad panel of kinases in a mass spectrometry-based kinome screen37 (Supplementary Dataset 2). Kinase interactions were monitored with the commercial KiNativ™ platform37 in lysates of Ramos cells. All bi-steric inhibitors were tested at 1 µM, more than 50-fold greater than the IC50 for inhibition of 4EBP1 phosphorylation. All tested compounds interacted with mTOR kinase (>95% blockade of covalent probe). No interactions with kinases other than mTOR were observed for BiS-NS and Bis-31x. BiS-13x inhibited PIK3CD by 49% in comparison to 69% and 94% for MLN0128 and PP242, respectively. BiS-35x inhibited MAP3K1 by 49% and in the same study, PP242 caused 71% inhibition; however, some variability was observed between experiments. Inhibition of DNA-PK and ATR was not observed with bi-steric inhibitors, but was seen with MLN0128 and PP242. These results suggest that the bi-steric inhibitors would not significantly inhibit other kinases at the concentrations at which they inhibit mTORC1 signaling and cell proliferation.
Cellular effects of bi-steric mTORC1 inhibitors
We used the bi-steric inhibitors to determine whether selective inhibition of mTORC1 had antitumor activity in preclinical models. MCF-7 cells were treated for 72 hours with pan-mTOR active-site (MLN0128) and bi-steric (BiS-NS) inhibitors, mTORC1-selective (BiS-13x, BiS-31x, BiS-35x) bi-steric inhibitors, or rapamycin. All compounds except rapamycin reduced cell number below baseline (Fig. 2a). The GI50s of BiS-NS and BiS-13x were approximately 0.5 nM, whereas MLN0128 and BiS-31x were 10-fold less potent (Fig. 2a). The GI50 of the most selective mTORC1 inhibitor, BiS-35x, was 28 nM, consistent with its lower potency (Fig. 2a), and comparable to the concentration required to inhibit mTORC1 (phosphorylation of AKT S473 was unaffected by 30-fold higher concentrations) (Extended Data Fig. 1a). In MCF-7, 10 nM BiS-NS or BiS-13x caused a five-fold increase in caspase activity after 72 hours of exposure, consistent with their reduction of MCF-7 cell number over that time. BiS-35x, the most selective but least potent compound, caused a 3-fold increase in caspase activity at an mTORC1-selective concentration (100 nM). Rapamycin caused a two-fold increase in caspase activity over control at 1 µM (Fig. 2b).
Figure 2. TORC1-selective bi-steric inhibitors induce apoptosis and do not induce HER3 expression in vitro.

m a, Cell viability (CTG assay) of MCF-7 cells incubated with increasing concentrations of indicated compounds for 72 hours. Cell viability data are expressed as percent of CTG signal normalized to signal at time zero (T0) (i.e. before compound addition). Data are the mean of n=4 experiments, with error bars representing SEM. b, IncuCyte® quantification of caspase 3/7 activity in MCF-7 cells treated with increasing concentrations of indicated inhibitors for 24 hours. Data are an average of n=5 experiments each done in technical duplicates, with error bars representing SEM. c, Immunoblot analysis of whole cell lysates from MCF-7 cells incubated with indicated compounds (representative of at least n=2 independent experiments). d, Immunoblot analysis of whole cell lysates from BT474 cells incubated with indicated compounds (representative of at least n=2 independent experiments).
The effects of pharmacologic inhibition of PI3K signaling are attenuated by relief of feedback inhibition of RTK expression and signaling21–24. mTORC1 inhibition reactivates signaling by a variety of mechanisms, including induction of IRS-proteins and GRB10, and inhibition of PTEN expression, whereas inhibition of AKT directly or through mTORC2 inhibition activates FOXO-dependent RTK expression21–23. Thus, mTORC2 inhibition by pan-mTOR inhibitors blocks AKT S473 phosphorylation, resulting in initial inhibition of AKT, followed by a delayed induction of receptor expression and restoration of phosphorylation of AKT at T308 but not S473.
To compare the effects of pan-mTOR and mTORC1-selective bi-steric inhibitors, we used MCF-7 and BT474 cells, two models in which both mTORC1- and mTORC2-dependent feedback has been characterized. Cells were treated with increasing concentrations of the pan-mTOR bi-steric inhibitor RapaLink-1, or mTORC1-selective inhibitor BiS-35x for 4 and 24 hours. 10 nM RapaLink-1 abolished pAKT S473 in both cell lines by 4 hours (Fig. 2c, d) and increased HER3 expression and phosphorylation by 24 hours. All concentrations of RapaLink-1 that inhibited pAKT S473 at 24 hours also induced HER3 expression at that time. In contrast, in both cell lines, 100 nM BiS-35x inhibited phosphorylation of S6K, S6, and 4EBP1, but not AKT S473, and had little effect on HER3 expression at 24 hours. Thus, induction of HER3 by pan-mTOR inhibitors is due to inhibition of mTORC2 and not mTORC1. In fact, the mTORC1 inhibitor (10 nM BiS-35x) increased AKT S473 phosphorylation, consistent with inhibition of S6K phosphorylation and the rapid activation of PI3K that follows mTORC1 inhibition31–33 (Fig. 2c, d).
Similar results were obtained both in vitro and in vivo with the T47D (PIK3CAH1047R) hormone-dependent breast cancer model. (Extended Data Fig. 4a, b). To evaluate the in vivo effects of pan-mTOR and mTORC1-selective inhibitors, mTOR substrate phosphorylation and HER3 expression in tumors were assessed following a single dose of inhibitors. An inverse relationship between AKT S473 phosphorylation and induction of HER3 protein was observed. BiS-NS suppressed AKT phosphorylation 16 and 24 hours after inhibitor administration with a concurrent increase in HER3 protein. BiS-13x moderately inhibited pAKT and showed some increase in HER3. In contrast, BiS-31x caused minimal pAKT inhibition and HER3 induction.
Activation of 4EBP1 blocks cancer cell growth in vitro
Our data demonstrate that both pan-mTOR and mTORC1-selective inhibitors can effectively inhibit cancer cell growth in preclinical settings (Fig. 2a). Previous work suggests that inhibition of 4EBP1 phosphorylation is necessary for suppression of tumor cell proliferation by inhibitors of PI3K signaling13,38. To determine whether inhibition of 4EBP1 phosphorylation is sufficient, we used a doxycycline-inducible 4EBP1 mutant protein in which all four mTORC1-phosphorylated residues (T37, T46, S65, and T70) were mutated to alanine5,38–40. This variant (4EBP1–4A) is insensitive to regulation by mTOR and represents a constitutively active form of 4EBP1 that mimicks the hypo-phosphorylated 4EBP1 generated upon mTOR kinase inhibition. In MDA-MB-468 and MCF-7 cells, significant induction of 4EBP1–4A expression 16 hours after doxycycline treatment was associated with a marked reduction in levels of cyclin D1, a protein that is translated in an eIF4F and cap-dependent manner (Fig. 3a, b). To determine whether 4EBP1 activation is sufficient to block cell proliferation, we induced 4EBP1–4A expression for three (MCF-7) or seven (MDA-MB-468) days. Cell proliferation was inhibited in a doxycycline concentration-dependent manner, with complete arrest at 1 µg/ml (Fig. 3c, d). Thus, effective inhibition of 4EBP1 phosphorylation by mTORC1 inhibitors is sufficient to inhibit cell proliferation.
Figure 3. Inhibition of 4EBP1 phosphorylation is sufficient to block cell growth in vitro.

Immunoblot analysis of lysates from (a) MDA-MB-468 and (b) MCF-7 cells transduced by lentivirus with rtTA3–4EBP1–4A and treated with vehicle or doxycycline (1 μg/ml) for indicated times. c, Cell viability of MDA-MB-468 rtTA3–4EBP1–4A cells treated with indicated concentrations of doxycycline for seven days. Data are the mean of technical duplicates. d, Cell viability of MCF-7 rtTA3–4EBP1–4A cells treated with indicated concentrations of doxycycline for three days, with error bars representing SD (representative of at least n=2 independent experiments). Each data point represents the mean cell viability of technical duplicates.
To determine whether 4EBP1 activation is necessary for suppression of cancer cell proliferation by mTOR inhibitors, CRISPR/Cas9 editing was used to delete 4EBP1 from MDA-MB-468 and MCF-7 cells (sg4EBP1). The pan-mTOR bi-steric inhibitor Rapalink-1 suppressed pS6K T389 and pAKT S473 effectively and equivalently in both control (sgGFP) and sg4EBP1cells, and reduced cyclin D1 levels in sgGFP cells (Extended Data Fig. 5a). However, cyclin D1 levels were unaffected in sg4EBP1 cells, consistent with a lack of 4EBP1 regulation of eIF4F-sensitive translation. This was confirmed by assessing the effects of mTORC1 inhibition on eIF4F complex formation. In MDA-MB-468 sgGFP cells, 3 nM RapaLink-1 caused significant displacement of eIF4G by 4EBP1 in the cap-binding complexes at 4 and 24 hours, but not in sg4EBP1 cells (Extended Data Fig. 5b). MDA-MB-468 sgGFP and sg4EBP1 cells were then exposed to increasing concentrations of RapaLink-1 for five days. sg4EBP1 cells were only three-fold less sensitive to RapaLink-1 compared to sgGFP cells, with RapaLink-1 suppressing proliferation at 0.3 and 0.1 nM in sg4EBP1 and sgGFP cells, respectively, despite the inability of the inhibitor to suppress eIF4F-sensitive translation or reduce cyclin D1 in the sg4EBP1 cells (Extended Data Fig. 5c). Depletion of 4EBP1 by shRNA also attenuated the effects of mTORC1-selective inhibitors BiS-13x and BiS-35x on eIF4F complex assembly in MCF-7 cells, yet produced only a modest reduction in the inhibitory effects on cell proliferation (Extended Data Fig. 5d, e). Sensitivity of E1A/Ras-transformed mouse embryonic fibroblasts (MEFs) to cell growth inhibition by both bi-steric compounds was also modestly reduced in MEFs lacking both 4EBP1 and 4EBP2 (4EBP1/2 DKO MEFs)41 compared to 4EBP1/2 wild-type (WT) MEFs (Extended Data Fig. 5f), and a similar pattern was observed for MLN0128.
RapaLink-1 and the mTORC1-selective bi-steric inhibitors suppressed global protein synthesis in MCF-7 cells, but siRNA depletion of 4EBP1 only partially rescued this effect (Extended Data Fig. 6a, b). Thus, the cell inhibitory effects of these compounds in the absence of 4EBP1 might be attributed to inhibition of other mTORC1 targets controlling anabolism and cell proliferation. Taken together, these results show that activation of 4EBP1 is sufficient for maximal inhibition of proliferation by both pan-mTOR and mTORC1-selective bi-steric inhibitors, but is not necessary for significant antiproliferative activity, suggesting that other targets of mTORC1 may play a role.
Modulation of mTOR activity selectively perturbs the translatome of tumor cells9. mTOR inhibitors suppress translation of a subset of mRNAs encoding proteins that promote proliferation and survival42,43. Polysome profiling was quantified with RNA sequencing and used to compare the effects of mTORC1-selective and mTOR active-site inhibitors on the translatome of MCF-7 cells. Four hours of exposure to MLN0128, BiS-13x, or BiS-35x caused almost identical effects of the translatome. Only one gene (LRFN4) was found to be differentially regulated when comparing BiS-13x to MLN0128, whereas no differences were observed between BiS-35x- and MLN0128-treated cells (Extended Data Fig. 7; Supplementary Dataset 3). Consistent with previous reports for mTOR inhibitors43,44, effects of BiS-13x and BiS-35x on the translatome of MCF-7 cells included suppression of translation of both mRNAs with 5’ TOP motifs and those without (Supplementary Dataset 3). A key role for inhibition of 4EBP1 phosphorylation by mTOR inhibitors is consistent with data showing that the effects of rapamycin on the translatome are weaker and, in part, distinct from those of pan-mTOR inhibitors45. Our data that mTORC1-selective and pan-mTOR inhibitors have almost identical effects on the translatome suggest that inhibition of mTORC1, and not mTORC2, is responsible for the translational reprogramming associated with the antitumorigenic effects of mTOR inhibition.
Activation of 4EBP1 reduces tumor growth in vivo
The in vivo effects of the mTORC1-selective and pan-mTOR inhibitors were compared in an MCF-7 subcutaneous xenograft model. Mice were administered BiS-NS or BiS-13x at the maximum tolerated doses or BiS-31x at the maximum formulatable dose once weekly by intraperitoneal injection, a schedule previously used for RapaLink-125. MLN0128 was given daily by oral administration.
All bi-steric inhibitors caused plasma concentration-dependent inhibition of p4EBP1 T37/T46 and ribosomal protein S6 (rpS6 S240/S244) in tumors isolated 4, 24, 48, and 72 hours after the final dose of a repeat dosing schedule (Fig. 4a, b, Extended Data Fig. 8a). MLN0128 caused near-maximal inhibition of p4EBP1 in four hours and levels returned to baseline by 24 hours, consistent with the half-life of the inhibitor. In contrast, all bi-steric inhibitors caused marked inhibition of 4EBP1 phosphorylation that rebounded 72 hours after dosing (Fig. 4c). In mice treated with the selective mTORC1 inhibitors BiS-13x and BiS-31x, pAKT S473 increased four hours after administration and was sustained for at least 72 hours. Thus, BiS-13x and BiS-31x retain mTORC1 selectivity in vivo, inhibiting p4EBP1 and inducing pAKT S473. In contrast, the pan-mTOR inhibitors, MLN0128 and BiS-NS, inhibited both pAKT S473 and p4EBP1.
Figure 4. mTORC1-selective bi-steric inhibitors suppress 4EBP1 phosphorylation in tumors and inhibit tumor growth in MCF-7 xenografts.

a, Levels of p4EBP1 T37/T46 as percent of control determined for lysates from MCF-7 tumors at end of study over a period of 72 hours following the final dose of a repeat dosing schedule. Data points are the mean signal of each group (n=3) and error bars represent SD. b, Unbound plasma concentration of inhibitors over time (dotted lines). Data points are the mean signal of each group (n=3 animals) and error bars represent SD. c, Immunoblot analysis of lysates from MCF-7 tumors at end of study. d, Waterfall plot of individual tumor responses at end of study, with tumor volume expressed as a percentage of initial tumor volume at time of study start. Each animal is represented as a separate bar. e, Mean percent body weight change of MCF-7 xenografts (n=12 animals per group), with error bars representing SEM. Similar results for each agent were observed in at least n=2 independent experiments.
Once weekly administration of bi-steric inhibitors caused inhibition of tumor growth, and regressions were achieved in 11/12, 8/12 and 5/12 mice treated with BiS-NS, BiS-13x, and BiS-31x, respectively (Fig. 4d, Extended Data Fig. 8b, c). In comparison, MLN0128 caused regressions in 4/12 animals. These data suggest that, in this model, the antitumor activities of the most mTORC1-selective compounds are similar to those of a pan-mTOR active-site inhibitor. The antitumor effects of each compound correlated with their cumulative inhibition of p4EBP1, but not pAKT S473, over 72 hours. Therefore BiS-NS produced the most tumor regressions, and mice treated with this compound exhibited cyclical weight loss peaking at 20% (Fig. 4e). Similarly, MLN0128 caused up to 15% loss in body weight. Compounds with higher selectivity for mTORC1, while also causing cyclical weight loss, were better tolerated, with maximum weight loss caused by BiS-13x and BiS-31x of 10% and 5%, respectively. The profiles for inhibition of 4EBP1 phosphorylation, antitumor activity and tolerability in HCC1954 breast cancer xenografts administered single and repeat doses of BiS-NS and BiS-13x were similar to those observed in MCF-7 xenografts (Extended Data Fig. 9).
mTORC1 kinase inhibitors do not cause glucose intolerance
Inhibition of PI3K signaling is complicated by glucose intolerance that has been attributed to AKT inhibition and, in particular, inhibition of AKT S473 phosphorylation in the liver20. We compared the effects of pan-mTOR and mTORC1-selective inhibitors on glucose tolerance in mice. After administration of inhibitor, glucose challenges were administered 24 and 48 hours later. Blood glucose levels were monitored for six hours after each challenge (Fig. 5a). A two-day glucose tolerance test (GTT) was chosen to capture both immediate and delayed effects of the compounds. MLN0128 delayed the return of glucose levels to baseline after the first glucose challenge (one hour after inhibitor administration), whereas the bi-steric mTORC1-selective inhibitors had no effect (Fig. 5b). A second glucose challenge was administered 25 hours after inhibitor administration. In mice dosed with the pan-mTOR bi-steric inhibitor BiS-NS, the return of glucose to baseline was delayed for six hours whereas, in mice treated with the mTORC1-selective inhibitors BiS-13x and BiS-31x, glucose levels returned to baseline within one or two hours after the challenge. Together, these results suggest that mTORC1-selective inhibitors do not impact glucose tolerance, whereas pan-mTOR bi-steric inhibitors cause glucose intolerance through inhibition of mTORC2.
Figure 5. mTORC1-selective bi-steric inhibitors do not cause glucose intolerance in vivo.
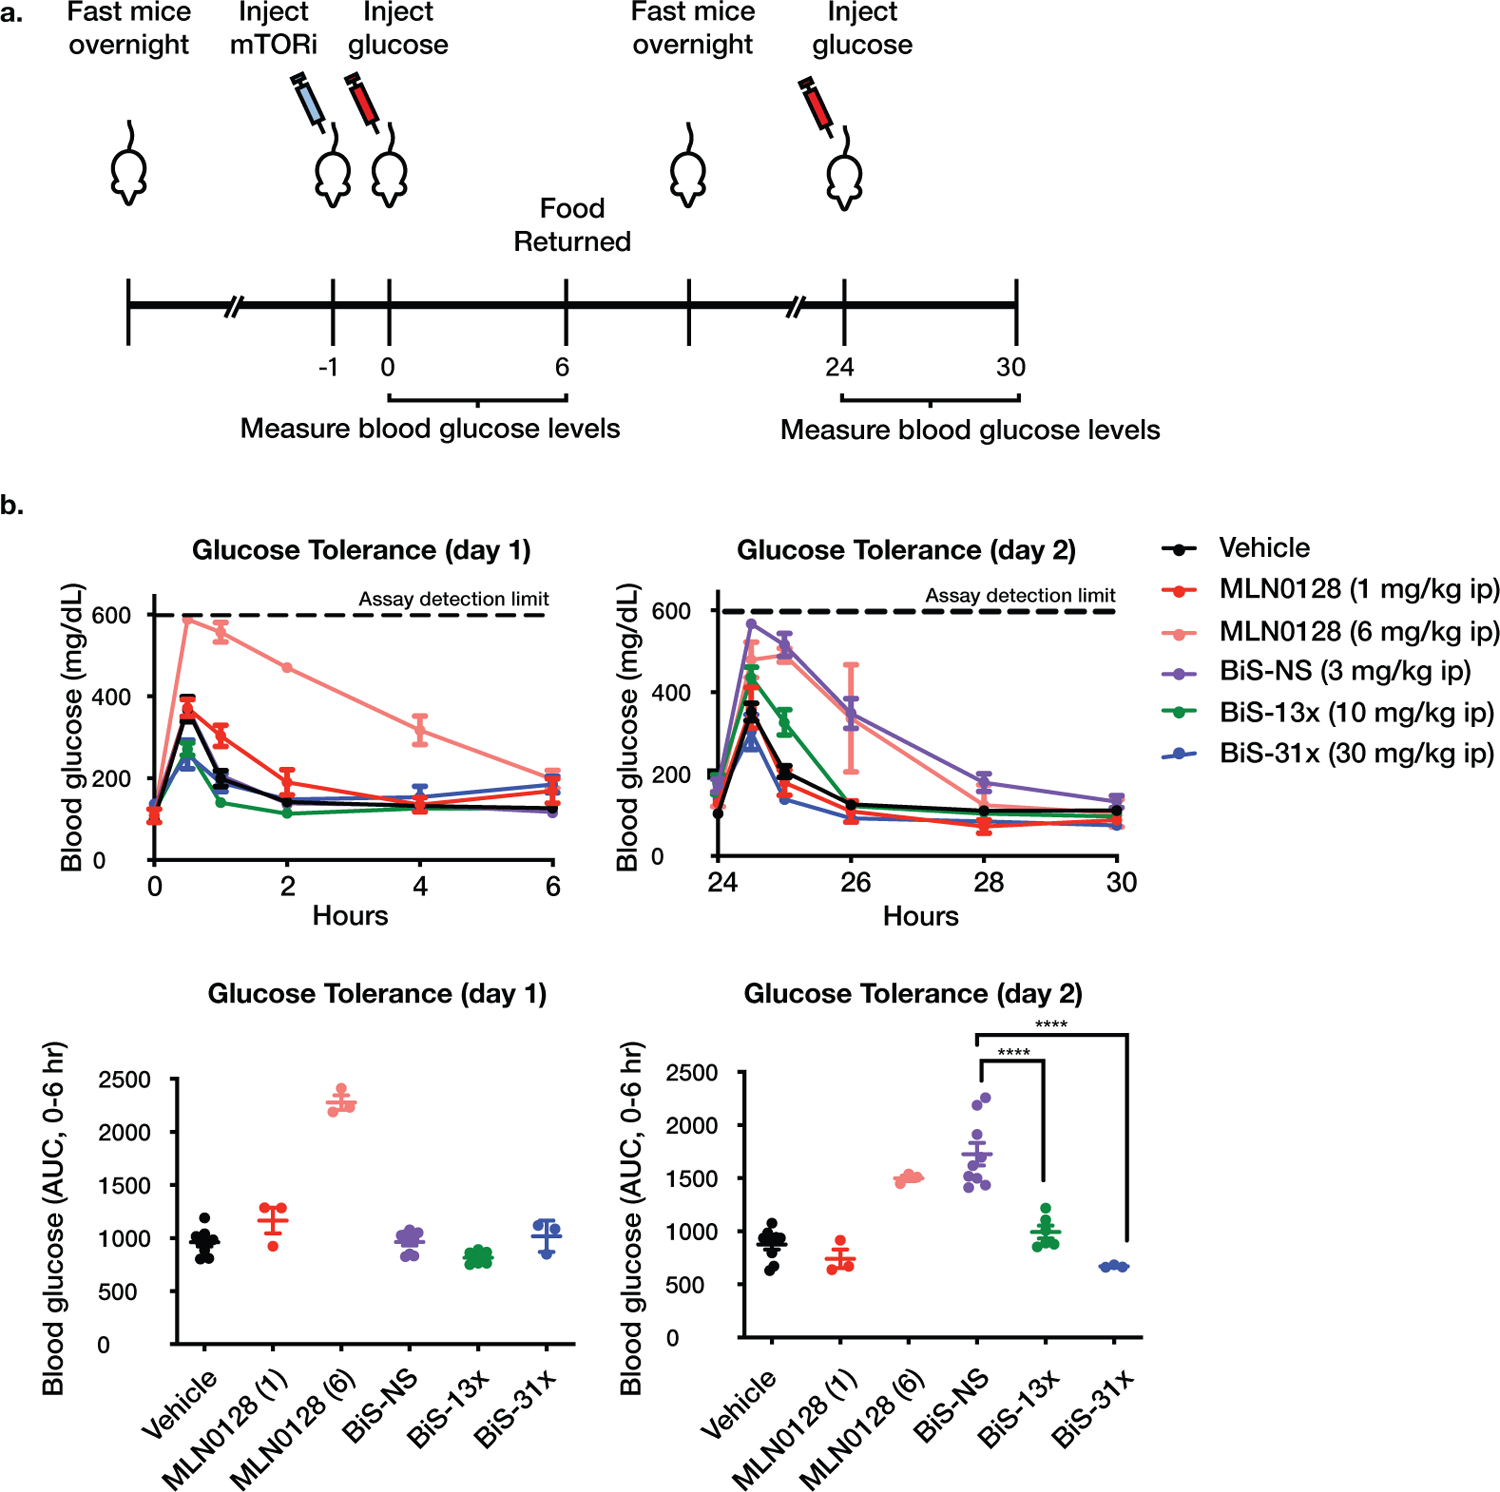
a, Schematic of glucose tolerance test (GTT). Naïve mice were fasted overnight, given a single dose of compound or vehicle 1 hour prior to initial glucose challenge, fasted overnight a second time, and given a second glucose challenge 24 hours after the first challenge (n=3 animals per group). Blood glucose was monitored for a period of 6 hours after each glucose challenge. b, Blood glucose measured over time after each glucose challenge for mice dosed with indicated compounds, plotted as mg/dL (upper panel) or area under the curve (AUC, 0–6 hours) (lower panel), with center bar representing mean and error bars representing SEM. Glucometer detection of glucose has an upper limit quantification of 600 mg/dL. Data are a compilation of three studies (n=3 animals per group per study): Vehicle (n=9 animals), MLN0128 1 mg/kg (n=3 animals), MLN0128 6 mg/kg (n= 3 animals), BiS-NS (n=9 animals), BiS-13x (n=6 animals), and BiS-31x (n=3 animals) (**** P = 4.3x10⁻⁶ between BiS-NS and BiS-13x, **** P = 4.2x10⁻⁷ between BiS-NS and BiS-31x, one-way ANOVA with post-hoc Tukey’s test).
Discussion
Despite evidence that hyperactive PI3K/mTOR signaling can drive tumor growth, current mTOR inhibitors have had only modest success in the clinic. We hypothesize that the limited clinical benefit of pan-mTOR active-site inhibitors reflects toxicity incurred by inhibiting mTORC2 and the induction of adaptive resistance due to the relief of feedback inhibition of RTK expression and signaling21–24. In contrast, although rapamycin and its analogs do not inhibit mTORC2, they potently inhibit the phosphorylation of only some substrates of mTORC1 (e.g. S6K1) and are poor inhibitors of 4EBP phosphorylation, which our data suggest is important for suppressing tumor growth46. The prototypic bi-steric compound RapaLink-1 effectively inhibits phosphorylation of a broad spectrum of mTORC1 substrates, including S6K and 4EBP1, and exhibits modest selectivity (approximately four-fold) over mTORC2 in vitro. We applied a rational drug design strategy to improve on this selectivity by systematically tuning the affinities of the rapamycin core and active-site binding moieties in the bi-steric molecule. We developed a range of synthetic chemistry approaches to manipulate the rapamycin core and access unique growth vectors, including the C16-methylcarbamate and C26-oxime moieties, and coupled these derivatives with various ATP-competitive scaffolds. This modular approach is applicable to diverse targets with pharmacologically tractable allosteric and orthosteric sites in sufficiently close physical proximity47. This approach led to the first compounds, to our knowledge, that achieve significant inhibition of mTORC1 in vitro and in vivo at concentrations that do not inhibit mTORC2 or other kinases. Biochemical and pharmacological data suggest that this selectivity was achieved by optimizing affinities of the orthosteric and allosteric components for their respective binding sites, although this proposal requires confirmation by a high-resolution structure of a complex between mTOR and a bi-steric inhibitor. These compounds durably inhibit 4EBP1 phosphorylation and, unlike pan-mTOR active-site inhibitors, do not inhibit the mTORC2-dependent phosphorylation of AKT. The generation of tool compounds with varying mTORC1/2 selectivity provides an opportunity to identify mTORC1- and mTORC2-specific contributions to the biologic effects of mTOR inhibitors. We confirm here that expression of a non-phosphorylatable 4EBP1 is sufficient, and that activation of 4EBP1 through inhibition of phosphorylation is necessary, for maximal inhibition of cancer cell growth in vitro. Moreover, we show that concurrent inhibition of mTORC2 is unlikely to enhance the antitumor effects significantly, as pan-mTOR and mTORC1-selective inhibitors have similar consequences in preclinical xenograft models. To establish the generality of these observations, the effects of pan- and mTORC1-selective inhibitors must be studied in greater detail and in more models. Cancer cells in which 4EBP1 was knocked out were only moderately less sensitive to mTORC1-selective inhibitors, likely due to inhibition of other mTORC1 targets that may play a role in supporting tumor proliferation and survival4.
mTORC2-mediated inhibition of AKT S473 phosphorylation by PI3K pathway and pan-mTOR inhibitors plays a role in mediating adaptive resistance by activating RTK expression and in inducing hyperglycemia, whereas mTORC1-selective inhibitors do not have these effects. Our preclinical data suggest that mTORC1-selective bi-steric inhibitors can drive tumor regression as effectively as pan-mTOR active-site inhibitors, while minimizing undesirable toxicity (weight loss), glucose intolerance, and adaptive resistance and may be useful for treating tumors that are, at least in part, driven by activated mTORC1.
Methods
Synthesis of bi-steric compounds
Cell culture and reagents
Cells were obtained from ATCC, grown in appropriate medium supplemented with 10% fetal bovine serum and 1% penicillin/streptomycin, and maintained at 37°C in a humidified incubator at 5% CO2.
AlphaLISA and MSD analysis of 4EBP1, S6K, and AKT phosphorylation
mTOR substrate phosphorylation in MDA-MB-468 and MCF-7 cells was assayed using AlphaLISA SureFire Ultra kits for p-4EBP1 Thr37/46, p-P70S6K Thr389, and p-AKT1/2/3 Ser473 (PerkinElmer); and MesoScale Discovery Multi-Array Assay Systems for Phospho-4E-BP1 (Thr37/46) and Phospho-AKT (Ser473) (MSD). Cells were seeded at 25,000 cells/well, and exposed the next day to serial 3-fold dilutions of compounds in complete medium with 0.1% DMSO. The following day, cells were exposed to serial 3-fold dilutions of compounds in complete medium with a final DMSO concentration of 0.1%. To assess FK506 competition with FKBP12 binding, compounds were concurrently prepared in fresh medium or medium containing 1 µM FK506. After indicated incubation times, cells were lysed, and AlphaLISA or MSD performed according to the manufacturers’ protocols. Samples were read using an EnVision Multilabel Plate Reader (PerkinElmer) using standard AlphaLISA settings or using an MSD plate reader. Data were plotted as a function of log M [compound] with a sigmoidal concentration response (variable slope) model fitted to the data to estimate the inhibitor EC50 in Prism 7 (GraphPad). Alternatively, results were analyzed as percent of control in which 0% was set as signal from 1 µM Torin1 and 100% was set as the mean of DMSO wells on each plate, and inhibitor EC50 was estimated as described above. Both analyses produced consistent EC50 values. Cells exposed to mTORC1 bi-steric inhibitors exhibited biphasic curves of AKT phosphorylation; inhibitor EC50 was estimated by fitting the response model after excluding normalized mean values > 130%, and setting the hill slope > −5. Data are presented as mean values with 95% confidence intervals (Supplementary Table 2, Supplementary Dataset 1). The graphs in Figure 1f are of representative experiments in which each data point is the mean of technical duplicates and normalized to vehicle control, with error bars representing SD. Independent replicate experiments: Rapamycin, n=5; MLN0128, n=7; RMC-4287, n=10; RMC-4627, n=11; RMC-4529, n=5; RMC-4745; n=5.
Determination of FKBP12 binding affinity
FKBP12 binding affinity was determined by Eurofins Discovery (Selcia) using a 384 well plate-based TR-FRET competitive binding assay. Polyhistidine-tagged FKBP12 forms a complex with an anti-6xHis antibody labelled with a fluorescent donor, F(d), and the enzyme ligand FK506 tagged with a fluorescent acceptor, F(a). An 8-point compound dilution series was performed over a final concentration range of 0.001 nM-10 µM. Compound was added to the master mix in the assay plate containing the enzyme/antibody/ligand complex, incubated for 30 mins at room temperature and the plate read on a SpectraMax iD5 (Molecular Devices) at 2 wavelengths (A and B) to detect emission from F(d) and F(a), respectively. The ratio B/A was calculated, and the blank-subtracted values were plotted against the inhibitor concentration in Log10 Molar and fitted using one site Ki nonlinear regression to determine the Kd. Compound Kds or % inhibition were determined from duplicate data points.
TR-FRET ternary complex assay
Assay was performed by ThermoFisher Scientific, using a modification of a previously described protocol36. A homogeneous assay mixture was prepared using 150 nM recombinant human FKBP12 fused to Emerald Green Fluorescent Protein (EmGFP), 2 nM GST-tagged human mTOR (residues 1360–2549), and 1 nM LanthaScreen Tb-anti-GST antibody (Rabbit, Thermo Fisher Scientific Cat # A15112) in 50 mM HEPES pH 7.5, 0.01% Polysorbate 20, 1 mM EGTA, and 10 mM MnCl2. Compounds were diluted in DMSO, and assay was initiated by mixing 160 nL compound with 16 µl assay mixture, resulting in a final DMSO concentration of 1%. Reactions were mixed for 30 seconds on an orbital shaker and incubated for 1 hour at room temperature. The ratio of fluorescence emission at 520 nm and 495 nm was determined and all signals were normalized to 1 µM rapamycin (100% complex formation) and no compound (0% complex formation) controls.
In vitro kinase selectivity panel
Kinase selectivity and off-target profile were determined using the KiNativ™ platform and performed at ActivX Biosciences. Briefly, Ramos cells were exposed to compounds (final concentration 1 µM) for two hours, lysed, labeled with biotinylated acyl phosphates of ATP and ADP, and analyzed by LC-MS/MS using the standard KiNativ protocol as previously described37.
Cell proliferation analysis
Cells were seeded in 96-well plates, and exposed the next day to serial 3-fold dilutions of compounds in medium with 0.1% DMSO. At indicated time points, cell viability was determined either by CellTiter-Glo (Promega) or ATPGlo (Promega). Luminescence was measured on a SpectraMax M5 plate reader (Molecular Devices). Data were normalized to the T0 mean and plotted as a function of log M [compound], and EC50 was estimated using a four-parameter concentration response model in Prism 7 (GraphPad). MCF-7 shScr and sh4EBP1 cells and MEF WT and 4EBP1/2 KO cells were seeded in 6-well plates and exposed the next day to compounds for 72 hours, trypsinized, stained with trypan blue, and counted by hematocytometer. Viable cell count values were normalized to DMSO control values. Data are presented as mean values ± standard error of mean or standard deviation of replicate experiments.
IncuCyte® proliferation and apoptosis assays
Long-term proliferation of MDA-MB-468 cells (4,000 cells/well) exposed to compounds was assessed by collecting phase-contrast images every two hours (IncuCyte, Essen BioScience). IncuCyte imaging software (S3 2018B) was used to calculate percent confluency per well. For detection of caspase-3/7 activity, MCF-7 cells (5,000 cells/well) were exposed to compounds in growth medium containing IncuCyte Caspase-3/7 Green Apoptosis Assay Reagent (1:1000). Phase-contrast and fluorescence images were collected every four hours and quantified using the IncuCyte imaging software to determine number of stain counts. Assay data were normalized to DMSO control values and plotted as a function of log M [compound], and EC50 was estimated using a four-parameter concentration response model in Prism 7 (GraphPad). Data are presented as mean values ± standard error of mean of replicate experiments.
Immunoblot analysis
Cells were lysed with RIPA buffer or HEPES lysis buffer (50 mM HEPES pH7.4, 10% glycerol, 150 mM NaCl, 1% Triton X-100, 1 mM EDTA, 1 mM EGTA) supplemented with protease and phosphatase inhibitors (Pierce Chemical, Thermo Fisher Scientific). Xenograft tumors were ground into a fine powder by mortar and pestle before lysing with TPER lysis buffer (Life Technologies). Alternatively, tumors were homogenized in lysis buffer (2% SDS, 50mM Tris-HCL pH 7.4, 10% glycerol). Lysates were briefly sonicated and cleared by centrifugation. Equal amounts of protein (20–50 μg) in normalized whole cell lysates were resolved by SDS-PAGE, transferred to nitrocellulose or PVDF membranes (Bio-Rad, Thermo Fisher Scientific), probed with specific primary (1:1000 dilution) and secondary antibodies, and detected by chemiluminescence with ECL detection reagents (Thermo Fisher Scientific, Millipore) or an Odyssey Infrared Imaging System (LI-COR Biosciences).
The following primary antibodies were used at 1:1000 dilution: anti-4E-BP1(53H11) #9644, anti-p-4EBP1 (Thr37/Thr46) (236B4) #2855, anti-p-4E-BP1 (Ser65) (174A9) #9456, anti-p-4E-BP1 (Ser65) (D9G1Q) #13443, anti-p-4E-BP1 (Thr70) (D756I) #13396, anti-4EBP2 #2845, anti-p-S6 Ribosomal Protein (Ser240/244) #2215, anti-p-S6 Ribosomal Protein (Ser240/244) (D68F8) #5364, anti-p-S6 Ribosomal Protein (Ser235/236) (D57.2.2E) #4858, anti-p-p70 S6 Kinase (Thr389) #9205, anti-p70 S6 Kinase (49D7) #2708, anti-p70 S6 Kinase #9202, anti-p70 S6 Kinase 2 #14130, anti-p-AKT (Ser473) (D9E) #4060, anti-p-AKT (Ser473) #9271, anti-p-AKT (Thr308) (244F9) #4056, anti-AKT (11E7) #4685, anti-AKT (C67E7) #4691, anti-p-HER3 (Tyr1197) (C56E4) #4561, anti-HER3 (D22C5) #12708, anti-eIF4G1 #2858, anti-AKT #4691, anti-p-AKT (Ser473) #9271, anti-mTOR #2972, anti-β-actin (8H10D10) #3700, anti-HATag (C29F4) #3724, anti-FKBP51 (FKBP5) (D5G2) #12210 all from Cell Signaling Technologies (Danvers, MA, USA); anti-rpS6 (C-8) #sc-74459 from Santa Cruz Biotechnologies (Dallas, Texas, USA); anti-eIF4E #610269 from BD Biosciences (San Jose, CA, USA); anti-Cyclin D1 (17H3L3) #701421 from Thermo Fisher Scientific (Waltham, MA, USA); anti-FKBP12 #ab2918 (Abcam, Cambridge, UK); anti-β-actin (Clone AC-15) #A1978 from Sigma (Saint Louis, Missouri, USA); anti-puromycin (Clone 3RH11) #EQ0001 from Kerafast (Boston, MA, USA).
In vitro cap-binding affinity assay
Experiments were carried out as previously described for Supplementary Fig. S5b48. Cells were seeded in 3-cm dishes, then exposed to compounds in full medium for the indicated time points the next day. Cells were collected and lysed in cold buffer containing 50 mM HEPES/KOH (pH 7.4), 2 mM EDTA, 40 mM NaCl, and 1% Triton X-100. 200 μg of cell lysate was incubated with 50 μl of 50% m7-GTP sepharose beads for two hours (Jena Biosciences), followed by washing. Bound proteins were eluted by boiling the beads in loading buffer, and eIF4F complex formation was assessed by immunoblotting using indicated antibodies.
Experiments were carried out as previously described for Supplementary Fig. S5d5. Cells were seeded in 150-mm plates, serum-starved (0% FBS) for 18 hours, then exposed to compounds in full medium for two hours. Cells were collected and lysed in cold buffer containing 50 mM MOPS/KOH (pH 7.4), 100 mM NaCl, 50 mM NaF, 2 mM EDTA, 2 mM EGTA, 1% NP40, 1% sodium deoxycholate, 7 mM β-mercaptoethanol, 1X complete protease EDTA-free inhibitors (4693132001; Roche), and 1X PhosSTOP (4906845001; Sigma-Aldrich). Lysates were incubated with m7-GDP-agarose beads (Immobilized γ-Aminophenyl-m7GTP (C10-spacer)- AC-155L; Jena Biosciences) for 20 minutes at 4°C, washed 4 times with the washing buffer containing 50 mM MOPS/KOH (7.4), 100 mM NaCl, 50 mM NaF, 0.5 mM EDTA, 0.5 mM EGTA, 7 mM β-mercaptoethanol, 0.5 mM PMSF, 1 mM Na3VO4 and 0.1 mM GTP, and eluted using 0.2 mM m7GTP (M6133; Sigma). Eluate was analyzed by immunoblotting using indicated antibodies.
CRISPR/Cas9 4EBP1 knockout cell lines
4EBP1 knockout cell lines were generated by CRISPR/Cas9 editing. Small guide RNA (sgRNA) sequences were ordered as duplexes (IDT) and cloned into V2-Lentiviral CRISPR (Addgene plasmid #52961). The sgRNA sequences are as follows:
sgGFP-F: CACCGGGGCGAGGAGCTGTTCACCG
sgGFP-R: AAACCGGTGAACAGCTCCTCGCCCC
sg4EBP1 guide 1-F: CACCGTGTGACCAAAACACCCCCAA
sg4EBP1 guide 1-R: AAACTTGGGGGTGTTTTGGTCACAC
sg4EBP1 guide 2-F: CACCGGTACCAGGATCATCTATGAC
sg4EBP1 guide 2-R: AAACGTCATAGATGATCCTGGTACC
sg4EBP1 guide 3-F: CACCGGGAAATTCCTGATGGAGTGT
sg4EBP1 guide 3-R: AAACACACTCCATCAGGAATTTCCC
Lentivirus were packaged in 293T cells, and viral supernatant was filtered with 0.45-µm PVDF filters and incubated with target cells for six hours. Cells were then maintained in virus-free media for 48 hours. Cells were selected for resistance to puromycin (2 μg/ml) for three days. Single-cell clones expressing sgGFP and sg4EBP1 guide 3 were sorted into 96-well plates containing complete medium and 0.5 μg/ml puromycin, and expanded for immunoblot validation of abrogated 4EBP1 protein levels. A lower molecular weight protein was unexpectedly detected by antibodies against 4EBP1 and phosphorylated 4EBP1 (p4EBP1) in sg4EBP1 cells, but its inability to disrupt the eIF4E-eIF4G interaction upon mTOR inhibition suggests it is a non-functional artifact of CRISPR-induced genomic deletion.
shRNA 4EBP1 knockdown cell lines
MCF-7 cells with silenced 4EBP1 (sh4EBP1 cells) were generated by transducing MCF-7 cells with pLKO.1 shRNA for human 4E-BP1 (Sigma; TRCN0000040203). Control (shScr) cells were transduced with Non-Target shRNA Control (Sigma: SHC002 or Addgene: plasmid 1864). Lentiviral shRNA infections were carried out as previously described5.
Puromycin incorporation
To track global translation, cells were incubated with indicated inhibitors for 4 hours and pulsed with 1 µM puromycin for the last 30 minutes, followed by cell lysis and immunoblot analysis to detect puromycin incorporation into nascent protein.
siRNA knockdown of 4EBP1
MCF-7 cells were transfected with Dharmacon SMARTpool non-targeting siRNA or siRNA designed against human 4EBP1. Transfection was aided by pre-incubation with lipofectamine RNAiMAX (Thermo Fisher Scientific) and used according to the manufacturer’s instructions. Cells were harvested 48 hours after transfection.
Gene overexpression cell lines
MCF-7 cells overexpressing a myristoylated form of AKT (Myr-AKT) were generated by transfection with 1 µg of pcDNA3-Myr-HA-AKT1 (Addgene plasmid #9008). Transfection was aided by pre-incubation with lipofectamine 2000 and used according to the manufacturer’s instructions. Media was changed 6 hours after transfection, and cells were harvested after an additional 24 hours. MDA-MB-468 and MCF-7 cells expressing inducible 4EBP1 T37A/T46A/S65A/T70A (4EBP1–4A) were generated by lentiviral transduction with pCW57.1–4EBP1_4xAla (Addgene plasmid #38240)48. Lentivirus were packaged in 293T cells, and viral supernatant was filtered with 0.45-µm PVDF filters and incubated with target cells for six hours. Cells were cultured in virus-free media for two days, and infected cells were selected using Puromycin (2 μg/ml) for 3 days.
Mouse embryonic fibroblasts
E1A/Ras-transformed 4EBP1/2 wild-type (WT) and 4EBP1/2 double knockout (DKO) p53 null (p53−/−) mouse embryonic fibroblasts (MEFs) were previously described5,41. For proliferation assays, E1A/Ras-transformed 4EBP1/2 WT (p53−/−) and 4EBP1/2 DKO (p53−/−) MEFs were seeded in 6-well plates at 10,000 cells/well, and exposed the next day to compounds for 72 hours. Cell proliferation was determined by direct counting, where dead cells were excluded by Trypan Blue staining. Assay data were normalized to DMSO control values and presented as mean values ± standard deviation of two or three biological replicates each consisting of technical triplicate.
Polysome profiling
Cell treatment
MCF-7 shScr cells were seeded in 15-cm plates. On day 2, cells were washed three times in PBS and starved in RPMI with 0.1% FBS media for 16 hours. This was followed by a 4-hour stimulation with complete media in the presence of vehicle (DMSO), RMC-4627 (3 nM), RMC-4745 (35 nM) or MLN0128 (40 nM). Cell confluence was at 80% upon harvest. Four biological replicates were generated and polysome-profiling was performed as previously described49, but resulting data were analyzed using anota2seq50.
RNA extraction and library preparation
Polysome-associated mRNA was extracted from fractions corresponding to mRNA associated with more than 3 ribosomes. RNA extraction was performed in parallel for polysome-associated and cytoplasmic RNA using Tri-reagent followed by purification using the RNAeasy MinElute Cleanup Kit (Qiagen). RNA quantity and quality were assessed using Qubit and Bioanalyzer technologies, respectively. Sequencing libraries were constructed using the smartSeq2 protocol51. The final pool was sequenced using the Illumina Novaseq6000 instrument.
RNAseq data analysis
Alignment (with HISAT2 v2.1.0) and quantification (default parameters) of the resulting RNAseq reads were performed using the nf-core/rnaseq v1.2 pipeline available at https://github.com/nf-core/rnaseq52. Genes with multiple loci were excluded from the analysis and only protein-coding genes were further analyzed. For downstream transformation, filtering and normalization, the default methods of the anota2seq R package50 were used53,54. As a quality control for data from polysome-associated RNA and cytoplasmic RNA samples, a centered principal component analysis was computed after variance filtering (only the first quartile most varying genes were included; results are presented in Extended Data Fig. 7). Analysis of changes in mRNA abundance and changes in translational efficiencies leading to altered protein levels or buffering was carried out in anota2seq v1.4.2 using default parameters (biological replicate was used as a batch effect in anota2seq) of the anota2seqRun function50,55,56. This was implemented for the following contrasts: DMSO (full serum media) vs. starvation; MLN0128 vs. DMSO (full serum media); RMC-4627 vs. MLN0128 and RMC-4745 vs. MLN0128. For each contrast, the results were visualized in scatter plots of polysome-associated mRNA log2 fold change vs. cytoplasmic mRNA log2 fold change. These data have been deposited at the Gene Expression Omnibus with the accession number GSE138417.
Xenograft studies
All procedures related to animal handling, care and treatment were performed according to the guidelines by the Institutional Animal Care and Use Committee (IACUC) following the guidance of the Association for Assessment and Accreditation of Laboratory Animal Care (AAALAC). Animals were housed per institutional guidelines as determine by the affiliated IACUC, consisting of a typical 12/12 dark/light cycle, ambient temperatures of 65–75°F (~18–23°C) with 40–60% humidity.
Female Balb/c athymic nude mice (6–8 weeks of age) (Shanghai Lingchang Biotechnology Co., LTD) were inoculated subcutaneously in the right flank with HCC1954 (ATCC-CRL-2338) or MCF-7 (ECACC-86012803) cells in 0.2 ml of PBS supplemented with BD Matrigel (1:1) at 5x10⁶ cells and 10x106 cells per injection, respectively. MCF-7-inoculated mice were fed drinking water containing β-estradiol (40 μg/ml) changed twice weekly. Upon reaching a mean tumor volume of ~200 mm3, mice were randomized into treatment arms (n=10), and tumor volume assessed twice weekly by caliper measurements for the duration of the study. MLN0128 was administered by oral gavage (po), daily (qd). RMC-4287, RMC-4627, and RMC-4529 were administered by intraperitoneal (ip) injections, once weekly (qw). All compounds were formulated in v/w/v, 5/5/90 Transcutol/Solutol HS 15/water. Tumor and plasma samples were collected for PK/PD analysis at indicated time points after final dosing. Similarly, for detection of mTOR phosphorylation substrates and HER3 following a single dose, female NOD scid gamma (NSG) mice (6–8 weeks of age) were inoculated subcutaneously with T47D cells (ATCC-HTB-133) with BD Matrigel at 10x106 cells per injection. 17β-Oestradiol pellets (0.72 mg/90 days release) (Innovative Research of America) were implanted subcutaneously three days before tumor cell inoculation. Once tumors reached a mean tumor volume of ~300 mm3, mice were randomized to receive vehicle (5%Transcutol/5%Solutol HS 15 in water), RMC-4287 (3 mg/kg ip), RMC-4627 (10 mg/kg ip) or RMC-4529 (30 mg/kg ip). Each compound was dosed (n=4 mice per compound per time point) for 4, 16 or 24 hours. Tumor and plasma samples were collected for PK/PD analysis.
Pharmacokinetic analysis by LC-MS/MS
Quantification of RMC-4287, RMC-4627, and RMC-4529 in mouse plasma was conducted using an AB Sciex Triple Quad 6500+ mass spectrometer coupled with an ACQUITY UPLC system (WuXi AppTec, China). Briefly, an aliquot of mouse plasma (15 µL) was mixed with 75 uL of acetonitrile/methanol (v/v, 50/50; 0.1% formic acid) containing 50 ng/mL glyburide as the internal standard, and centrifuged for 15 min at 4000 rpm, 4°C. Supernatant was isolated and injected for LC-MS/MS analysis (5–10 µL). Analytes were separated using an ACQUITY UPLC Protein BEH C4 300Å (1.7 μm 2.1 × 50 mm) column. The LC mobile phase (A: water, 0.1% formic acid; B: acetonitrile/methanol 50/50, 0.1% formic acid) gradient was initiated as follows: 0 – 0.30 min, 15% B; 1.60 – 1.80 min, 95% B; 1.81 – 2.00 min, 15% B. The flow rate was 0.8 mL/min. The main MS parameters were set as follows: source temperature, 450°C; IS, 5500; CUR, 40; gas flow (GS1 & GS2), 55. The MRM channels were: RMC-4287, 891.6 -> 866.4; RMC-4627, 891.1 -> 866.1; RMC-4529, 886.0 -> 842.2, and glyburide (IS), 494.2 -> 169. Quantification of MLN0128 in mouse plasma was conducted using an API 4000 mass spectrometer coupled with an ACQUITY UPLC system. Following the same extraction procedure, MLN0128 analyte was injected to the ACQUITY UPLC Protein BEH C4 column, with a mobile phase gradient as follows: 0–0.20 min, 2% B; 1.0–1.3 min, 95% B; 1.31–1.50 min, 2% B. The MRM channels were: MLN0128, 310.1 -> 267.9; Verapamil (IS), 455.2 -> 164.9.
Plasma protein binding
To determine the unbound plasma concentration of each inhibitor, plasma protein binding (PPB) was determined by ultracentrifugation (Charles River Laboratories. Briefly, the CD-1 mouse plasma matrix was thawed and centrifuged to remove any particulates. The plasma was pre-warmed and pH was adjusted to approximately 7.4. Compounds were prepared at 1 mM in DMSO, and diluted 1:500 in plasma, giving a final concentration of 2 μM. Aliquots (0.5 mL) of compound-spiked matrix were transferred to polycarbonate ultracentrifuge tubes and centrifuged at 100,000 rpm (~ 500,000 g) for 2.5 hours at 37°C. Concurrently, the remaining spiked matrix was incubated at 37°C for stability control. After centrifugation, supernatants were transferred to a microtiter plate for matrix-matching. The mixtures were then quenched with cold acetonitrile containing IS (250 ng/mL carbutamide, chrysin and glyburide), and centrifuged. Supernatants were transferred and diluted with water (v/v, 1/2), and injected for LC-MS/MS analysis. The peak area ratios for free compound (supernatant) and total compound (non-spun sample) were used to calculate the % bound to plasma proteins according to the following equations: % Free = (concentration in supernatant) / (total concentration); % Bound = 100% - % Free
Glucose tolerance test
Male Balb/c mice (8–10 weeks of age) were fasted overnight for at least 12 hours. On Day 1, compound groups were dosed with compounds. One hour later, mice were administered an ip dose of glucose in saline solution (2 mg/g in a volume of 10 mL/g of body weight). Tail snip blood samples were collected and used for glucometer at the following time-points post IP glucose dosing (pre-dose, 0.5, 1, 2, 4 and 6 hours). On Day 2 (with a 12-hour overnight fast), a second GTT assay was performed using the same time-points collected as on Day 1. Data are a compilation of three studies, with n=3 animals per group.
Statistical analysis
Quantitative data are presented as mean ± standard deviation (SD) or standard error of the mean (SEM), as specified in the figure legend. Statistical tests were performed using Prism 7 (GraphPad). For comparisons among multiple independent groups, one-way ANOVA with post-hoc Tukey’s test was used. For animal studies, animals were randomized before treatments, and all animals treated were included for the analyses.
Code availability
Computational code used in this study is available from the corresponding authors on reasonable request.
Data availability
Source data for Extended Data Fig. 7 have been provided as Supplementary Dataset 3. Source data for Extended Data Fig. 7 have been deposited at the Gene Expression Omnibus with the accession number GSE138417. All other data supporting the findings of this study are available from the corresponding authors on reasonable request.
Material availability
Requests for materials should be addressed to N.R. and J.A.M.S.
Extended Data
Extended Data Fig. 1. Bi-steric inhibitors are selective for mTORC1 in multiple cell lines.

a) Immunoblot analysis of whole cell lysates from MDA-MB-468 (ER-, PR-, HER2-/PTEN null, EGFR amplified), MCF-7 (ER+/PIK3CA E545K), ZR-75–1 (ER+/PTEN PL108R), and HCC1954 (HER2+/PIK3CA H1047R) breast cancer cell lines incubated with indicated compounds for 4 hours. Data are representative at least n=2 independent experiments. b) Immunoblot analysis of whole cell lysates from A375 (melanoma, BRAF V600E), MCF-7, and PC3 (prostate cancer, TP53 deletion) cells incubated with indicated compounds for 4 and 24 hours. Data are representative of at least n=2 independent experiments.
Extended Data Fig. 2. Selectivity of bi-steric inhibitors for mTORC1 is independent of feedback activation of AKT.

Immunoblot analysis of whole cell lysates from MCF-7 cells transfected with HA-Myr-AKT or vector control for 24 hours followed by exposure to indicated compounds for 4 hours. Data are representative of at least n=2 independent experiments.
Extended Data Fig. 3. Cellular activity of mTOR bi-steric inhibitors is dependent on formation of an FKBP12-mTOR-inhibitor FRB ternary complex.

a) Concentration-dependent formation of a ternary complex with emGFP-FKBP12, GST-mTOR (residues 1360–2549), and inhibitor detected by TR-FRET signal from LanthaScreen TB-anti-GST antibody. 100% ternary complex formation is defined by signal with 1 µM rapamycin. Data are the mean of technical duplicates from n=1 experiment. b) Immunoblot analysis for FKBP12 protein in parental and FKBP12 knockout NCI-H358 cells (analysis performed in n=1 experiment to verify FKBP12 knockout). c) Concentration responses of p4EBP1 T37/T46 determined from whole cell lysates of parental (filled circles) and FKBP12 knockout (open circles) NCI-H358 cells treated with increasing concentrations of indicated compounds for four hours. Data are the mean of n=2 experiments each done in technical duplicates, with error bars representing SD. d) Concentration responses of cellular proliferation determined for parental (filled circles) and FKBP12 knockout (open circles) NCI-H358 cells treated with increasing concentrations of indicated compounds for 72 hours. Data are the mean of n=2 experiments each done in technical duplicates, with error bars representing SD. e) Concentration responses of p4EBP1 T37/T46 determined from whole cell lysates of MDA-MB-468 cells treated with increasing concentrations of indicated compounds in the presence, or absence, of FK506 (10 μM) for four hours. Data are the mean of n=3 experiments each done in technical duplicates, with error bars representing SD. f) Immunoblot analysis of whole cell lysates from parental MCF-7 cells and MCF-7 cells harboring mTOR F2108L treated with increasing concentrations of indicated compounds for four hours. Data are representative of at least n=2 independent experiments.
Extended Data Fig. 4. mTORC1 bi-steric inhibitors cause reduced induction of HER3 in vitro and in vivo.

a) Immunoblot analysis of whole cell lysates from T47D cells treated with indicated compounds for 16 hours. Data are representative of at least n=2 independent experiments. b) Immunoblot analysis of lysates from T47D xenografts over a period of 24 hours following in vivo administration of a single dose of the indicated compounds. Data are representative of at least n=2 independent experiments.
Extended Data Fig. 5. Inhibition of 4EBP1 phosphorylation is important for maximal activity of mTOR bi-steric inhibitors.

a) Immunoblot analysis of whole cell lysates from MDA-MB-468 and MCF-7 sgGFP and sg4EBP1 cells incubated with increasing concentrations of RapaLink-1 for 4 hours. Data are representative of at least n=2 independent experiments. b) In vitro cap-binding affinity assay and immunoblot analysis of whole cell lysates from MDA-MB-468 sgGFP and sg4EBP1 cells. Data are representative of at least n=2 independent experiments. c) Cell viability of MDA-MB-468 sgGFP and sg4EBP1 cells incubated with increasing concentrations of RapaLink-1 for up to 5 days. Data are a mean of technical duplicates, and representative of at least n=2 independent experiments. d) In vitro cap-binding affinity assay and immunoblot analysis of MCF-7 shScr and sh4EBP1 KD cells serum-starved (0% FBS) for 18 hours, then serum-stimulated (10% FBS) and incubated for two hours with compounds at EC80 concentrations: BiS-13x (3 nM), BiS-35x (35 nM), and MLN0128 (40 nM). Serum-starved cells served as a control. Data are representative of two independent experiments with similar results. e) Cell viability of MCF-7 shScr and sh4EBP1 cells (knockdown by scrambled shRNA and shRNA against 4EBP1, respectively) exposed to the indicated compounds for 72 hours. Viability was measured as viable cell counts normalized to DMSO-treated cells, with center bars representing the mean of n=2 or 3 technical replicates and error bars representing SD of n=3 technical replicates. Data are a representative experiment of at least n=2 independent experiments. f) Cell viability of 4EBP1/2 WT and 4EBP1/2 DKO MEFs exposed to indicated compounds for 72 hours. Viability was measured as viable cell counts normalized to DMSO-treated cells, with center bars representing mean of n=2 or 3 experiments with error bars representing SD of n=3 experiments.
Extended Data Fig. 6. Inhibition of global protein synthesis by mTOR bi-steric inhibitors is partially dependent on 4EBP1.

a) Immunoblot analysis of whole cell lysates from MCF-7 cells incubated with indicated inhibitors for 4 hours and pulsed with 1 µM puromycin for the last 30 minutes. Data are representative of at least n=2 independent experiments. b) Immunoblot analysis of whole cell lysates from MCF-7 control (siScr) and 4EBP1-depleted (si4EBP1) cells incubated with increasing concentrations of RapaLink-1 for 4 hours and pulsed with 1 µM puromycin for the last 30 minutes. Data are representative of at least n=2 independent experiments.
Extended Data Fig. 7. Translational reprogramming by bi-steric and active-site inhibitors of mTOR is modulated by inhibition of mTORC1.

a) Scatter plots of polysome-associated RNA vs. cytosolic RNA log2 fold changes for the four comparisons: DMSO (complete media) vs. starvation [top left], MLN0128 vs. DMSO [top right], BiS-13x vs. MLN0128 [bottom left] and BiS-35x vs. MLN0128 [bottom right]. For each comparison, genes are colored according to their mode for regulation of gene expression derived from analysis using anota2seq50 and the number of such regulated transcripts is indicated: “translation“ denotes transcripts whose change in polysome-association (up or down) could not be explained by a corresponding change in total mRNA level (i.e. changes in translational efficiency leading to altered protein level); “buffering” denotes transcripts whose change in the total mRNA pool (up or down) was offset at the level of translation such that the association with polysomes remained largely unaltered (i.e. a change in total mRNA level opposed by a change in translational efficiency, which is expected to lead to unaltered protein levels despite changes in mRNA levels [as recently described]55,56; “abundance” denotes transcript which show a similar change in the total mRNA pool and association with polysomes (i.e. a change in transcription or mRNA stability leading to altered protein level). b) Samples from the polysome-profiling experiment (normalized data) were projected on the 2 first components of a centered principal component analysis (the proportion of the variance explained by each component is indicated). Data points are colored according to their RNA source (total mRNA or polysome-associated mRNA), shapes denote treatments (DMSO, MLN0128, BiS-13, BiS-35x, or starvation) and the numbers indicate biological replicates (1–4). The library preparation was performed twice on biological replicate 1 providing 2 technical replicates labeled 1A and 1B. Replicate 1A was excluded from the downstream analysis.
Extended Data Fig. 8. mTORC1-selective bi-steric inhibitors suppress S6 phosphorylation in tumors and inhibit tumor growth in MCF-7 xenografts.

a) Levels of pS6 S240/S244 as percent of control determined for lysates from MCF-7 tumors at end of study over a period of 72 hours following the final dose of a repeat dosing schedule. Data are the mean signal of each group (n=3) and error bars represent SD. b) Mean tumor volume of MCF-7 xenografts following daily oral administration (po qd) of MLN0128, and once weekly intraperitoneal (ip qw) administration of bi-steric inhibitors (n=12 animals per group), with error bars representing SEM. c) Percent tumor volume change of individual MCF-7 xenografts with daily oral administration (po qd) of MLN0128, and once weekly intraperitoneal (ip qw) administration of bi-steric inhibitors. Gray zone represents 10% margin of error for tumor growth and shrinkage. Similar results for each agent were observed in at least n=2 independent experiments.
Extended Data Fig. 9. mTORC1-selective bi-steric inhibitors suppress 4EBP1 phosphorylation in tumors and inhibit tumor growth in HCC1954 xenografts.

a) Level of p4EBP1 T37/T46 as percent of control determined for lysates from HCC1954 tumors at end of study over a period of 72 hours following the final dose of a repeat dosing schedule (left), and unbound plasma concentration of inhibitors over time (right). Data are the mean signal of each group (n=3) and error bars represent SD. b) Level of p4EBP1 T37/T46 as percent of control determined for lysates from HCC1954 tumors after a single dose of inhibitors (left), and unbound plasma concentration of inhibitors over time (right). Data are the mean signal of each group (n=3) and error bars represent SD. c) Waterfall plot of individual end of study tumor responses, with tumor volume expressed as a percentage of initial tumor volume at time of study. Each animal is represented as a separate bar. d) Mean tumor volume of HCC1954 xenografts following once weekly intraperitoneal (ip qw) administration of bi-steric inhibitors (n=12 animals per group), with error bars representing SEM. e) Percent tumor volume change of individual HCC1954 xenografts with once weekly intraperitoneal (ip qw) administration of bi-steric inhibitors. Gray zone represents 10% margin of error for tumor growth and shrinkage. f) Mean percent body weight change of HCC1954 xenografts (n=12 animals per group), with error bars representing SEM. Similar results for each agent were observed in at least n=2 independent experiments.
Supplementary Material
Acknowledgments
We would like to thank Stephen Kelsey and Mark A. Goldsmith for scientific guidance and critical review of the manuscript, and Abraham I. Bassan for invaluable discussions leading to this work. We gratefully acknowledge the contributions of Micah J. Gliedt, Jennifer Pitzen, Chris Semko, Gang Wang, and Walter Won for the syntheses of the bi-steric mTORC1 inhibitors. IT is supported by Senior Scholar Award from Le Fonds de recherche du Québec – Santé (FRQS) and acknowledges support from Cancer Research Society grant #102585. LH is supported by Junior 1 Scholar Award from Le Fonds de recherche du Québec – Santé (FRQS). O.L. is a Wallenberg Academy Fellow. We also thank the researchers at WuXi Apptec who supported our in vivo pharmacology efforts.
Footnotes
Competing interests
N.R. is on the scientific advisory board for BeiGene, MapKure, Ribon Therapeutics, Tarveda Therapeutics, Zai Lab, and Concarlo Holdings; is a consultant at Pfizer Array, Eli Lilly, AstraZeneca, and Chugai Pharmaceuticals; has received research support from Revolution Medicines, Pfizer Array, and Boehringer Ingelheim; and has equity at BeiGene, Zai Labs, Fortress, and Kura Oncology. I.T. and O.L. have consulted at and are recipients of research grants from Revolution Medicines. B.J.L., G.L.B., A.P.T., N.T., S.L.W., T.H., A.M., E.G.L., J.W.E., G.K., D.L., Z.W., Z.W., Y.Z., D.W., J.B.A., M.S., A.L.G., and J.A.M.S. are current or former employees of Revolution Medicines, Inc. The other authors declare no competing interests.
Main Text References
- 1.Chalhoub N & Baker SJ PTEN and the PI3-kinase pathway in cancer. Annu Rev Pathol 4, 127–150, doi: 10.1146/annurev.pathol.4.110807.092311 (2009). [DOI] [PMC free article] [PubMed] [Google Scholar]
- 2.Vivanco I & Sawyers CL The phosphatidylinositol 3-Kinase AKT pathway in human cancer. Nat Rev Cancer 2, 489–501, doi: 10.1038/nrc839 (2002). [DOI] [PubMed] [Google Scholar]
- 3.Sarbassov DD et al. Rictor, a novel binding partner of mTOR, defines a rapamycin-insensitive and raptor-independent pathway that regulates the cytoskeleton. Curr Biol 14, 1296–1302, doi: 10.1016/j.cub.2004.06.054 (2004). [DOI] [PubMed] [Google Scholar]
- 4.Sengupta S, Peterson TR & Sabatini DM Regulation of the mTOR complex 1 pathway by nutrients, growth factors, and stress. Mol Cell 40, 310–322, doi: 10.1016/j.molcel.2010.09.026 (2010). [DOI] [PMC free article] [PubMed] [Google Scholar]
- 5.Dowling RJ et al. mTORC1-mediated cell proliferation, but not cell growth, controlled by the 4E-BPs. Science 328, 1172–1176, doi: 10.1126/science.1187532 (2010). [DOI] [PMC free article] [PubMed] [Google Scholar]
- 6.Fingar DC et al. mTOR controls cell cycle progression through its cell growth effectors S6K1 and 4E-BP1/eukaryotic translation initiation factor 4E. Mol Cell Biol 24, 200–216, doi: 10.1128/mcb.24.1.200-216.2004 (2004). [DOI] [PMC free article] [PubMed] [Google Scholar]
- 7.Sarbassov DD, Guertin DA, Ali SM & Sabatini DM Phosphorylation and regulation of Akt/PKB by the rictor-mTOR complex. Science 307, 1098–1101, doi: 10.1126/science.1106148 (2005). [DOI] [PubMed] [Google Scholar]
- 8.Avdulov S et al. Activation of translation complex eIF4F is essential for the genesis and maintenance of the malignant phenotype in human mammary epithelial cells. Cancer Cell 5, 553–563, doi: 10.1016/j.ccr.2004.05.024 (2004). [DOI] [PubMed] [Google Scholar]
- 9.Roux PP & Topisirovic I Signaling Pathways Involved in the Regulation of mRNA Translation. Mol Cell Biol 38, doi: 10.1128/MCB.00070-18 (2018). [DOI] [PMC free article] [PubMed] [Google Scholar]
- 10.Feldman ME et al. Active-site inhibitors of mTOR target rapamycin-resistant outputs of mTORC1 and mTORC2. PLoS Biol 7, e38, doi: 10.1371/journal.pbio.1000038 (2009). [DOI] [PMC free article] [PubMed] [Google Scholar]
- 11.Thoreen CC et al. An ATP-competitive mammalian target of rapamycin inhibitor reveals rapamycin-resistant functions of mTORC1. J Biol Chem 284, 8023–8032, doi: 10.1074/jbc.M900301200 (2009). [DOI] [PMC free article] [PubMed] [Google Scholar]
- 12.Choi J, Chen J, Schreiber SL & Clardy J Structure of the FKBP12-rapamycin complex interacting with the binding domain of human FRAP. Science 273, 239–242, doi: 10.1126/science.273.5272.239 (1996). [DOI] [PubMed] [Google Scholar]
- 13.Choo AY, Yoon SO, Kim SG, Roux PP & Blenis J Rapamycin differentially inhibits S6Ks and 4E-BP1 to mediate cell-type-specific repression of mRNA translation. Proc Natl Acad Sci U S A 105, 17414–17419, doi: 10.1073/pnas.0809136105 (2008). [DOI] [PMC free article] [PubMed] [Google Scholar]
- 14.Sarbassov DD et al. Prolonged rapamycin treatment inhibits mTORC2 assembly and Akt/PKB. Mol Cell 22, 159–168, doi: 10.1016/j.molcel.2006.03.029 (2006). [DOI] [PubMed] [Google Scholar]
- 15.Bissler JJ et al. Sirolimus for angiomyolipoma in tuberous sclerosis complex or lymphangioleiomyomatosis. N Engl J Med 358, 140–151, doi: 10.1056/NEJMoa063564 (2008). [DOI] [PMC free article] [PubMed] [Google Scholar]
- 16.Buti S, Leonetti A, Dallatomasina A & Bersanelli M Everolimus in the management of metastatic renal cell carcinoma: an evidence-based review of its place in therapy. Core Evid 11, 23–36, doi: 10.2147/CE.S98687 (2016). [DOI] [PMC free article] [PubMed] [Google Scholar]
- 17.Vinayak S & Carlson RW mTOR inhibitors in the treatment of breast cancer. Oncology (Williston Park) 27, 38–44, 46, 48 passim (2013). [PubMed] [Google Scholar]
- 18.Graham L et al. A phase II study of the dual mTOR inhibitor MLN0128 in patients with metastatic castration resistant prostate cancer. Invest New Drugs 36, 458–467, doi: 10.1007/s10637-018-0578-9 (2018). [DOI] [PMC free article] [PubMed] [Google Scholar]
- 19.Powles T et al. A Randomised Phase 2 Study of AZD2014 Versus Everolimus in Patients with VEGF-Refractory Metastatic Clear Cell Renal Cancer. Eur Urol 69, 450–456, doi: 10.1016/j.eururo.2015.08.035 (2016). [DOI] [PubMed] [Google Scholar]
- 20.Hagiwara A et al. Hepatic mTORC2 activates glycolysis and lipogenesis through Akt, glucokinase, and SREBP1c. Cell Metab 15, 725–738, doi: 10.1016/j.cmet.2012.03.015 (2012). [DOI] [PubMed] [Google Scholar]
- 21.Chandarlapaty S et al. AKT inhibition relieves feedback suppression of receptor tyrosine kinase expression and activity. Cancer Cell 19, 58–71, doi: 10.1016/j.ccr.2010.10.031 (2011). [DOI] [PMC free article] [PubMed] [Google Scholar]
- 22.Muranen T et al. Inhibition of PI3K/mTOR leads to adaptive resistance in matrix-attached cancer cells. Cancer Cell 21, 227–239, doi: 10.1016/j.ccr.2011.12.024 (2012). [DOI] [PMC free article] [PubMed] [Google Scholar]
- 23.Rodrik-Outmezguine VS et al. mTOR kinase inhibition causes feedback-dependent biphasic regulation of AKT signaling. Cancer Discov 1, 248–259, doi: 10.1158/2159-8290.CD-11-0085 (2011). [DOI] [PMC free article] [PubMed] [Google Scholar]
- 24.Serra V et al. PI3K inhibition results in enhanced HER signaling and acquired ERK dependency in HER2-overexpressing breast cancer. Oncogene 30, 2547–2557, doi: 10.1038/onc.2010.626 (2011). [DOI] [PMC free article] [PubMed] [Google Scholar]
- 25.Rodrik-Outmezguine VS et al. Overcoming mTOR resistance mutations with a new-generation mTOR inhibitor. Nature 534, 272–276, doi: 10.1038/nature17963 (2016). [DOI] [PMC free article] [PubMed] [Google Scholar]
- 26.Fan Q et al. A Kinase Inhibitor Targeted to mTORC1 Drives Regression in Glioblastoma. Cancer Cell 31, 424–435, doi: 10.1016/j.ccell.2017.01.014 (2017). [DOI] [PMC free article] [PubMed] [Google Scholar]
- 27.Mohr K et al. Rational design of dualsteric GPCR ligands: quests and promise. Br J Pharmacol 159, 997–1008, doi: 10.1111/j.1476-5381.2009.00601.x (2010). [DOI] [PMC free article] [PubMed] [Google Scholar]
- 28.Valant C, Robert Lane J, Sexton PM & Christopoulos A The best of both worlds? Bitopic orthosteric/allosteric ligands of g protein-coupled receptors. Annu Rev Pharmacol Toxicol 52, 153–178, doi: 10.1146/annurev-pharmtox-010611-134514 (2012). [DOI] [PubMed] [Google Scholar]
- 29.Yu K et al. Biochemical, cellular, and in vivo activity of novel ATP-competitive and selective inhibitors of the mammalian target of rapamycin. Cancer Res 69, 6232–6240, doi: 10.1158/0008-5472.CAN-09-0299 (2009). [DOI] [PubMed] [Google Scholar]
- 30.Chen X et al. Cryo-EM structure of human mTOR complex 2. Cell Res 28, 518–528, doi: 10.1038/s41422-018-0029-3 (2018). [DOI] [PMC free article] [PubMed] [Google Scholar]
- 31.O’Reilly KE et al. mTOR inhibition induces upstream receptor tyrosine kinase signaling and activates Akt. Cancer Res 66, 1500–1508, doi: 10.1158/0008-5472.CAN-05-2925 (2006). [DOI] [PMC free article] [PubMed] [Google Scholar]
- 32.Shi Y, Yan H, Frost P, Gera J & Lichtenstein A Mammalian target of rapamycin inhibitors activate the AKT kinase in multiple myeloma cells by up-regulating the insulin-like growth factor receptor/insulin receptor substrate-1/phosphatidylinositol 3-kinase cascade. Mol Cancer Ther 4, 1533–1540, doi: 10.1158/1535-7163.MCT-05-0068 (2005). [DOI] [PubMed] [Google Scholar]
- 33.Sun SY et al. Activation of Akt and eIF4E survival pathways by rapamycin-mediated mammalian target of rapamycin inhibition. Cancer Res 65, 7052–7058, doi: 10.1158/0008-5472.CAN-05-0917 (2005). [DOI] [PubMed] [Google Scholar]
- 34.Bayle JH et al. Rapamycin analogs with differential binding specificity permit orthogonal control of protein activity. Chem Biol 13, 99–107, doi: 10.1016/j.chembiol.2005.10.017 (2006). [DOI] [PubMed] [Google Scholar]
- 35.Luengo JI et al. Structure-activity studies of rapamycin analogs: evidence that the C-7 methoxy group is part of the effector domain and positioned at the FKBP12-FRAP interface. Chem Biol 2, 471–481 (1995). [DOI] [PubMed] [Google Scholar]
- 36.Reichling LJ et al. Pharmacological characterization of purified recombinant mTOR FRB-kinase domain using fluorescence-based assays. J Biomol Screen 13, 238–244, doi: 10.1177/1087057108314609 (2008). [DOI] [PubMed] [Google Scholar]
- 37.Patricelli MP et al. Functional interrogation of the kinome using nucleotide acyl phosphates. Biochemistry 46, 350–358, doi: 10.1021/bi062142x (2007). [DOI] [PubMed] [Google Scholar]
- 38.She QB et al. 4E-BP1 is a key effector of the oncogenic activation of the AKT and ERK signaling pathways that integrates their function in tumors. Cancer Cell 18, 39–51, doi: 10.1016/j.ccr.2010.05.023 (2010). [DOI] [PMC free article] [PubMed] [Google Scholar]
- 39.Hsieh AC et al. Genetic dissection of the oncogenic mTOR pathway reveals druggable addiction to translational control via 4EBP-eIF4E. Cancer Cell 17, 249–261, doi: 10.1016/j.ccr.2010.01.021 (2010). [DOI] [PMC free article] [PubMed] [Google Scholar]
- 40.Rong L et al. Control of eIF4E cellular localization by eIF4E-binding proteins, 4E-BPs. RNA 14, 1318–1327, doi: 10.1261/rna.950608 (2008). [DOI] [PMC free article] [PubMed] [Google Scholar]
- 41.Petroulakis E et al. p53-dependent translational control of senescence and transformation via 4E-BPs. Cancer Cell 16, 439–446, doi: 10.1016/j.ccr.2009.09.025 (2009). [DOI] [PubMed] [Google Scholar]
- 42.Bhat M et al. Targeting the translation machinery in cancer. Nat Rev Drug Discov 14, 261–278, doi: 10.1038/nrd4505 (2015). [DOI] [PubMed] [Google Scholar]
- 43.Masvidal L, Hulea L, Furic L, Topisirovic I & Larsson O mTOR-sensitive translation: Cleared fog reveals more trees. RNA Biol 14, 1299–1305, doi: 10.1080/15476286.2017.1290041 (2017). [DOI] [PMC free article] [PubMed] [Google Scholar]
- 44.Gandin V et al. nanoCAGE reveals 5’ UTR features that define specific modes of translation of functionally related MTOR-sensitive mRNAs. Genome Res 26, 636–648, doi: 10.1101/gr.197566.115 (2016). [DOI] [PMC free article] [PubMed] [Google Scholar]
- 45.Larsson O et al. Distinct perturbation of the translatome by the antidiabetic drug metformin. Proc Natl Acad Sci U S A 109, 8977–8982, doi: 10.1073/pnas.1201689109 (2012). [DOI] [PMC free article] [PubMed] [Google Scholar]
- 46.Basu B et al. First-in-Human Pharmacokinetic and Pharmacodynamic Study of the Dual m-TORC 1/2 Inhibitor AZD2014. Clin Cancer Res 21, 3412–3419, doi: 10.1158/1078-0432.CCR-14-2422 (2015). [DOI] [PMC free article] [PubMed] [Google Scholar]
- 47.Steinfeld T, Mammen M, Smith JA, Wilson RD & Jasper JR A novel multivalent ligand that bridges the allosteric and orthosteric binding sites of the M2 muscarinic receptor. Mol Pharmacol 72, 291–302, doi: 10.1124/mol.106.033746 (2007). [DOI] [PubMed] [Google Scholar]
Methods References
- 48.Thoreen CC et al. A unifying model for mTORC1-mediated regulation of mRNA translation. Nature 485, 109–113, doi: 10.1038/nature11083 (2012). [DOI] [PMC free article] [PubMed] [Google Scholar]
- 49.Gandin V et al. Polysome fractionation and analysis of mammalian translatomes on a genome-wide scale. J Vis Exp, doi: 10.3791/51455 (2014). [DOI] [PMC free article] [PubMed] [Google Scholar]
- 50.Oertlin C et al. Generally applicable transcriptome-wide analysis of translation using anota2seq. Nucleic Acids Res 47, e70, doi: 10.1093/nar/gkz223 (2019). [DOI] [PMC free article] [PubMed] [Google Scholar]
- 51.Picelli S et al. Full-length RNA-seq from single cells using Smart-seq2. Nat Protoc 9, 171–181, doi: 10.1038/nprot.2014.006 (2014). [DOI] [PubMed] [Google Scholar]
- 52.Ewels PA et al. nf-core: Community curated bioinformatics pipelines. bioRxiv, 610741, doi: 10.1101/610741 (2019). [DOI] [PubMed] [Google Scholar]
- 53.Ritchie ME et al. limma powers differential expression analyses for RNA-sequencing and microarray studies. Nucleic Acids Res 43, e47, doi: 10.1093/nar/gkv007 (2015). [DOI] [PMC free article] [PubMed] [Google Scholar]
- 54.Robinson MD & Oshlack A A scaling normalization method for differential expression analysis of RNA-seq data. Genome Biol 11, R25, doi: 10.1186/gb-2010-11-3-r25 (2010). [DOI] [PMC free article] [PubMed] [Google Scholar]
- 55.Cenik C et al. Integrative analysis of RNA, translation, and protein levels reveals distinct regulatory variation across humans. Genome Res 25, 1610–1621, doi: 10.1101/gr.193342.115 (2015). [DOI] [PMC free article] [PubMed] [Google Scholar]
- 56.Lorent J et al. Translational offsetting as a mode of estrogen receptor alpha-dependent regulation of gene expression. EMBO J, e101323, doi: 10.15252/embj.2018101323 (2019). [DOI] [PMC free article] [PubMed] [Google Scholar]
Associated Data
This section collects any data citations, data availability statements, or supplementary materials included in this article.
Supplementary Materials
Data Availability Statement
Source data for Extended Data Fig. 7 have been provided as Supplementary Dataset 3. Source data for Extended Data Fig. 7 have been deposited at the Gene Expression Omnibus with the accession number GSE138417. All other data supporting the findings of this study are available from the corresponding authors on reasonable request.