

Abstract
Decades of research into the topic of oral nanoparticle (NP) delivery has still not provided a clear consensus regarding which properties produce an effective oral drug delivery system. The surface properties—charge and bioadhesiveness— as well as in vitro and in vivo correlation, seem to generate the greatest number of disagreements within the field. Herein we propose a mechanism underlying the in vivo behavior of NPs, which bridges the gaps between these disagreements. The mechanism relies on the idea of biocoating – the coating of NPs with mucus – which alters their surface properties, and ultimately their systemic uptake. Utilizing this mechanism, several coated NPs were tested in-vitro, ex-vivo and in-vivo, and biocoating was found to affect NPs size, zeta-potential, mucosal diffusion coefficient, the extent of aggregation, and in-vivo/in-vitro/ex-vivo correlation. Based on these results, low molecular weight (MW) poly-lactic acid (PLA) exhibited a 21-fold increase in mucosal diffusion coefficient after precoating as compared to un-coated particles, as well as 20% less aggregation, and about 30% uptake to the blood in-vivo. These discoveries suggest that biocoating reduces negative NP charge which results in an enhanced mucosal diffusion rate, increased gastrointestinal retention time and high systemic uptake.
Graphical abstract
1. Introduction
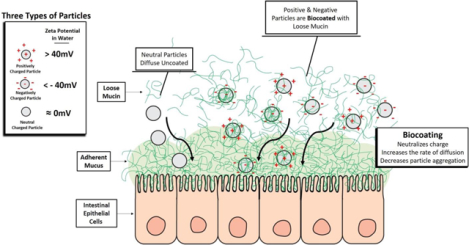
Oral drug delivery is the most convenient and preferred route of administration. However, this route of administration is not feasible for many biologics due to their high molecular weight (MW) and susceptibility to enzymatic degradation in the stomach and gastrointestinal (GI) tract. In addition, many biologics often display low penetration through the GI tissue. The GI tract is the main absorbent of materials into the body and its mucus is considered the main barrier for penetration. It creates a hydrophobic adhesive barrier, which is mainly attributed to its structure and lipid content, specifically phospholipids [1–3] and glycoproteins [4]. The GI mucus is comprised of two layers: a firmly adherent unstirred mucus layer adjacent to the epithelial lining, and a layer contiguous with-it containing a less viscous, loosely adherent mucus right above. The loosely adherent layer is >90% of the full thickness of the GI mucosal layer [5]. Scanning electron microscopy (SEM) imaging of mucus revealed a fibrous mesh structure with pores of up to 500 nm in diameter (while others claim 200 nm [6]) posing a physical barrier hindering and/or entrapping materials [7].
One way our group and others have tried to overcome the low bioavailability of pharmaceutical agents is to use polymer nanoparticles (NPs) as drug delivery vehicles [8–13]. The hydrophilicity/hydrophobicity, charge, size, stiffness, and degree of bioadhesion of polymeric NPs are key factors in defining their interaction with the mucus barrier and subsequently their ability to penetrate it [13, 14]. Other scientists reported that polymeric NPs can be found in the blood post oral administration, which suggest that these NPs can diffuse through the mucosal layers at a faster rate than the GI mucosal rate of clearance [15, 16]. However, knowing which properties affect the ability of NPs to penetrate mucus does not always translate into knowing how those properties affect the uptake. For instance, some studies have shown that NPs coated with polyethylene-glycol (PEG - a charge neutralizing non-bioadhesive polymer) have significantly higher diffusion rates in mucin than non-coated NPs [17, 18]. Additionally, they also report that uncoated bioadhesive NPs can become entrapped in the mucin [19]. This can indicate that non-bioadhesive neutral charge is important for mucosal penetration and delivery. However, this group did not investigate the cellular or systemic uptake of the two types of particles. Interestingly, other groups have found that while mucin precoated PEG NPs have a slower mucin diffusion rate they also result in much higher cellular endocytosis [20]. Several models (in vitro and in vivo) have been developed to predict the GI penetrative efficacy of polymeric NPs [14, 19, 21–25].
From a broad literature review into this issue, we have found contradicting results when looking into the effects that surface charge and bioadhesion force have on the efficacy of NPs as drug delivery systems. Studies have shown that NPs whose charges have been neutralized with PEG coatings exhibit significantly higher diffusion rates through mucin than uncoated NPs [17, 18]. Conversely, Griffiths et al. [26] use DLS measurements to investigate mucins interaction with NPs and show that “negatively charged and hydrophilic nanoparticles do not exhibit interactions with mucins whereas positively charged and hydrophobic nanoparticles show strong interactions”. Even negatively charged gold NPs (initial ZP −40 mV) have demonstrated cellular uptake, and coating them with mucins increased their endocytosis by 250% [20]. Moreover, various papers have reported the enhanced uptake of positively charged NPs (e.g., chitosan) [27–29] as well as negatively charged NPs [6, 30, 31].
Our own research has demonstrated that the highest uptake was achieved with negatively charged hydrophobic NPs. This was first demonstrated with negatively charged polyanhydride NPs through in vivo studies which measured the systemic bioavailability of delivered drugs [8]. Additionally, we determined that negatively charged polystyrene (PS) particles’ main mechanism of cellular uptake was endocytosis with about 45% uptake post oral or isolated loop administration [13]. These results add to the contradictions in the field, especially in relation to NP charge and bioadhesion. For example, studies have shown that bioadhesive NPs become entrapped in mucus [19] which would seem to indicate poor bioavalibility. However, these studies do not investigate the in vivo effects of bioadhesion, whereas our group demonstrated the beneficial results of utilizing bioadhesive materials for oral drug delivery. For example, when polymethylmethacrylate (PMMA, negatively charged) NPs were coated with the bioadhesive polymer poly-butadiene-maleic anhydride-co-L-DOPA (PBMAD also negatively charged), its total systemic uptake increased from 6% to 66% [12]. Additional experiments were conducted with negatively charged bioadhesive polymers where direct bioavailability measurements were reported [32–39].
There could be several reasons why there is not a clear consensus regarding the optimal charge and bioadhesiveness required for NPs used for oral drug delivery. The reasons could be different experimental designs, different models used to simulate in vivo environments, and different methods used to verify uptake. In this paper, we try to provide an explanation for some of the mentioned contradictions. Specifically, our aim is to utilize a theory of charge neutralizing mucin biocoating to address the following controversies:
What charge is beneficial for oral drug delivery? Some say NPs need to be near neutral, others claim NPs need to have a net positive charge (e.g. chitosan NPs, positive bioadhesive polymers), while others claim they need to be negative (e.g., gold NPs, negative bioadhesive polymers). Another topic we aim to address regarding the surface properties of NPs is bioadhesion. Is bioadhesion beneficial or not? Some have claimed that bioadhesive NPs “get stuck” in the mucosa and can’t diffuse further, while others claim that bioadhesive NPs reach systemic circulation.
2. Materials and Methods
Polylactic acid (PLA, 8 kDa), poly lactic-co-glycolic acid (PLGA) (50:50) 6 and 10 kDa, PLGA (65:35) 6 kDa, and PLGA- ester end group (75:25, 8 kDa) were donated by Takeda Pharmaceuticals. Polystyrene (PS) 2.5, 45, and 125–250 kDa, PMMA (75 kDa), PLA 18 kDa, polychromatic red PS (PCRPS, 540 nm diameter), and polyethylene glycol (PEG)-PLGA were purchased from Polysciences Inc. Poly fumaric acid sebacic acid (P(FA:SA) 20:80) 20:80 14.5 kDa and PBMAD (15–18 kDa) were synthesized as described previously [8, 40, 41]. Dichloromethane (DCM), petroleum ether (PE), ethanol, polytetrafluoroethylene (PTFE) membrane (0.22 μm pore size, by Flouropore™), Drierite (regular 8 mesh), heparin, KBr, span-80, polyvinyl alcohol (PVA), polydimethylsiloxane (PDMS), phosphate-buffered saline (PBS) were purchased from Fisher-Scientific. Mucin from porcine stomach Type II was purchased from Sigma-Aldrich and simulated intestinal fluid (SIF) without pancreatin, USP XXII formulation from RICCA chemical company (Arlington TX, USA).
2.1. Preparation of Polymeric NPs
Polymeric NPs were prepared via the Phase Inversion Nano-encapsulation (PIN) method [42] to produce small NPs (<400 nm) and the solvent evaporation (SE) method [43] to produce bigger NPs (>1000 nm). Briefly, in the PIN method, polymers were dissolved in DCM with or without colloidal gold (except for PBMAD where ethanol was used), at a concentration of 1.5% weight per volume (w/v). Next, the DCM solution was added to an excess of PE at a ratio of 1:100, respectively. NPs were collected using a hydrophobic PTFE filter (average yield >75%). In the SE method, 3 g of PS was dissolved in 15 mL of DCM with 0.1% span-80. Then it was added drop-wisely to a 250 mL solution of 1% PVA and 0.75 mL of 1-Octanol while mixed at 10,000 RPM for 1 min. The mixture was then added to an additional 250 mL of 0.5% (w/v) PVA while stirred at 2000 RPM for 60 min. Finally, PS particles were collected via centrifugation (three washing cycles using DI water).
2.2. Ex Vivo Detection and Quantification of Polymeric NPs Absorbed Rats’ GI
Albino, Sprague-Dawley (SD) rats fasted for 24 h before sacrifice. Once sacrificed, the anterior abdomen was shaved, and an incision was made along the sternum followed by harvesting of the small intestine. The small intestine was divided into the duodenum, jejunum, and ileum sections (1:2:2 ratios respectively). To ensure proper removal of fecal matter residues, each section was rinsed gently with approximately 3–4 mL of PBS. Then each section was bisected, splayed, and cut into 4 cm sections. To investigate the effect of the loose mucus on polymeric NPs absorption, half of the sections (2 cm each) had their loose mucus removed gently before exposure while the other half was intact. Next, the 2 cm tissue sections were pinned to PDMS blocks and exposed for 1 h to 15 mg of polymeric NPs dispersed in 200 μL of 0.01 M PBS (while covered to minimize water loss) or just PBS solution (for control). After exposure, sections were rinsed with 3 mL of PBS solution to flush unabsorbed NPs and their mucous layer was collected. Then, samples were placed in scintillation vials, flash-frozen, and lyophilized for FTIR analysis. The polymer concentration in the collected mucus was determined by diluting the dry mucus with water and centrifuging at 10000 g for 8 min. Next, the supernatant was analyzed showing no traces of the polymers. The pellet portion was flash frozen and lyophilized, then weighed and analyzed by FTIR.
2.3. In Vivo Detection and Quantification of Polymeric NPs Absorbed in Rats’ GI and Internal Organs
In vivo isolated loop (IL) experiments were performed as described by Reineke et al. [12]. Briefly, SD rats have first fasted for 24h before surgery. Then, rats were anesthetized, and their anterior abdomen was shaved and opened through an incision along the sternum. While under anesthesia, a region of approximately 40 cm proximally from the cecum (jejunum-ileum region) was selected for an IL. A knot was tightly placed at one end followed by a second knot (≈10 cm proximally from the first knot) which was placed loosely. Then, 100 mg/mL of polymeric NPs in PBS were injected gently into the IL and the upper knot was tightened. After 5 h, rats were euthanized, and their ILs and other organs (liver, kidney, heart) were harvested. The ILs were rinsed with 3 mL of PBS. In addition, near the IL, another section was harvested to serve as control tissue. ILs were cut open through an axial incision and the loose mucus was removed and collected. The loose mucus and samples were collected in pre-weighed vials, flash-frozen, and lyophilized. After lyophilization, each sample’s dry mass was recorded. The loose mucus was analyzed as described above for the ex vivo experiments.
2.4. In Vivo Detection and Quantification of Polymeric NPs in Rats’ Blood using FTIR
These experiments were conducted as described in supplemental section S2, the detection and quantification section, with the following additions. First, zero-time point blood samples were withdrawn via the tail vein to serve as the control. Blood samples were also taken 1, 2, 3, 4, and 5 h post-exposure to the NPs, and were left at room temperature for 20 min before being centrifuged at 4°C, 2000g for 18 min. The supernatant (serum) was carefully separated from the erythrocyte pellet, flash-frozen, and lyophilized. Note that the ILs showed no visible polymeric particles, and they were deflated. In all repetitions (n=8), PLA 8 kDa (PLA8) was not detected in the collected washouts, nor in any of the blood sample time points except for the 5 h time point. Thus, all blood sample results presented herein are of the 5 h time points. A control experiment was performed to further validate the FTIR method. Here, instead of using polymeric NPs, 1 mL of PBS was injected into the rats’ IL. Samples were then taken after 1 and 5 hours to test whether any changes showed up in the spectrographs due to the IL experiment. The two spectrographs were identical indicating that changes in the spectrograph are attributed to polymers’ presence. It should be noted that in preliminary experiments where we analyzed whole blood or erythrocyte only samples, PLA8 wasn’t detected. This was attributed to erythrocytes masking effect on other biomolecules [44, 45].
Lastly, since the ratio of dry serum mass to whole blood volume of rats was not available from the literature, it was measured in the following manner. The whole rat’s blood was collected and divided into 5 vials, each containing 1 mL of whole blood. The serum was separated (using a centrifuge as described above), flash-frozen, and lyophilized in pre-weighed vials. After lyophilization, the dry serum mass was weighed. It was found that the ratio of dry serum mass per 1 mL of whole blood for SD rats is 42±7 mg.
2.5. FTIR sample preparation and Analysis
Following lyophilization (GI tissue or serum samples), samples were kept in a desiccator. A similar FTIR approach to the one described above for the GI tissue was applied for the detection of NPs in serum. More specifically, the peak at 1650 cm−1 was used as the serum-specific peak as it is unique to the serum while for PLA8, three peaks were assessed at 1750 cm−1, 1188 cm−1, and 1084 cm−1. Calibration curves were constructed for each peak ratio by two methods (see Figure S14). Next, 5h in vivo IL experiments were performed using PLA8 NPs. Figure 12 presents the spectra obtained for pure PLA8, pure serum, and a 5h serum of a rat administered with 91 mg PLA8 NPs (see all rats’ spectra in Figure S15, n=8). For the full explanation of the methodology used to develop the FTIR detection and quantification methods, refer to section S2, specifically Figures S1–S9 and Figures S12–14.
As can be seen in the magnified area of Figure 12 (and in Figure S12 for the other rats), PLA8 was detected by the increase in the peak/shoulder at 1750 cm−1 (as well as the other two peaks). It is important to note that the Isolated Loop experiment did not alter the FTIR spectrums taken from control animals. Drierite is used to limit exposure to moisture until analyzed. Using an agate mortar and pestle, samples were ground to a fine homogeneous powder. Then, 1.0±0.05 mg of the ground sample was combined with 99.0±0.05 mg of FTIR-grade KBr and pressed into a pellet (10 metric Tons for 15 min). Before the pellet scans, a background scan was conducted. Absorption spectra were recorded over 32 scans from 400–4000 cm−1 in 1 cm−1 steps. Using Spectrum 10™ software, each spectrum was rubber-band baseline corrected and normalized for blood analysis using the amide peak at 1650 cm−1 (as it was always the highest peak both in GI and blood spectra). The calibration curve samples (0.5–50% mass), control unexposed GI tissue, control unexposed serum and pure polymer spectra were also obtained in the same manner.
2.6. Size and Zeta Potential Measurements
Polymeric NPs diameter and zeta potential (ZP) were determined using Zetaview® Nano Particle Tracking Analyzer (NTA, model PMX110, ParticleMetrix). Briefly, the instrument was first calibrated using ParticleMetrix 102 nm diameter NPs standard. Then, the NPs were suspended in DI water or 0.1% mucus solution, injected, and analyzed with ZetaView® software.
2.7. NPs characterization in mucous – Diffusion and clusters measurements
For both measurements, time-lapse confocal images were performed on PC red PS (PCR-PS) NPs (540 nm) with and without mucin coating. Briefly, 0.02% of PCR-PS NPs were dispersed in DI water or 0.1% mucin solution for 5 min before use. Then, 20 μL of PCR-PS dispersion was added to 200 μL of 5% mucous solution (similar to GI mucosal layer) on a microscope slide and covered with micro cover glass and sealed with nail polish to avoid dehydration and convection. Each sample was imaged >10 times at different locations (minimum of 600 NPs per measurement) using Olympus FV3000 Confocal Microscope. Then, images were contrast-enhanced, smooth, sharpened, and made binary for the ImageJ analysis. Clusters were defined as particle aggregates containing at least four particles. The diffusion coefficient with and without mucins biocoating was analyzed using multiple ParticleTracker plugin for ImageJ [46] while cluster analysis was performed using ImageJ the Particle Analysis function.
2.8. Statistical analysis
Statistical analysis was performed on the data. Repeated experimental results were averaged and presented with their respective standard deviations (SD). All experiments were repeated at least 3 times, see figure legends for specific numbers. Where relevant, the results were analyzed by Shapiro–Wilk test and then compared via student t-test. The obtained p-values are specified on relevant figures. All calculations were performed in Microsoft Excel software.
3. Results and Discussion
Throughout the years our research has primarily focused on developing better bioadhesive and bio-compatible polymers which will improve oral drug bioavailability. We found that PS – a non bio-compatible and bio-degradable polymer – demonstrated surprisingly high systemic uptake and moderately high bioadhesion. Our goal was to to understand the mode by wich PS NPs exhibited such positive results and replicate those properties with a bio-degradable polymer. To this end, the entry of PS particles through the absorptive epithelium of the proximal jejunum was investigated in rats by transmission electron microscopy (TEM). We then customized a Fourier transform infrared spectroscopy (FTIR) method that is practical, efficient, cost-effective, and available to many labs to better evaluate our results. Using these – and other - techniques, we investigated bio-degradable polymer NPs for viability as possible drug delivery systems.
3.1. The absorption of PS NPs in Gi tissue by TEM
Most scientists who investigated the passage of polymer-based particles across the lumen of the small intestine have focused on the microfold, or membranous (M) cells located within the Peyer’s patches of the non-absorptive epithelium. We decided to administer NPs in situ, to the proximal jejunum, which does not contain (M) cells, for intervals of 5 min and 30 min. After administration, particles with a diameter of 0.2, 0.5, and 1 μm were identified within the cytoplasm of absorptive cells (enterocytes) by TEM (S21–S22 and S24–S29 in the supplemental section). This confirmation greatly increases the potential surface area of the small intestine which can facilitate particle entry (for more detailed information regarding the TEM experiments, see section S3). Figures S23, S26 and S27 show PS NPs with a diameter ranging from 200 to 2000 nm, where the NPs located in the lumen seem to be coated with what we assume to be mucus. To assess whether other polymers can also be coated in vivo, we also tested PLA 8 kDa (PLA8) NPs, for full details see section S1.2 in the Supplements. The TEM results of these experiments show that the bio-degradable PLA8 NPs can also be coated with mucus in vivo. See figures S30 and S31. Therefore, we set out to assess the possible implications of mucus coating (termed biocoating) on the oral efficacy of various polymeric NPs.
3.2. Detecting and quantifying Polymeric NPs in GI Tissue Ex Vivo
To analyze the possible effects of mucin biocoating, we needed a simple method to detect and perhaps quantify polymer content in biological samples. To this end, several polymeric (PS, PLA8, PLGA, P(FA:SA) 20:80, and PBMAD) NPs were used to assess whether they could be detected in GI tissues, with and without mucus, using FTIR. All tested NP diameters were 300–400 nm. Figure 1 presents the FTIR spectrograhs obtained for PS NPs (blue line), pure duodenum control (black line), and extracted duodenum tissue exposed (with and without mucus, left, and right figures respectively, red line) to PS NPs for 1h ex vivo. The remaining tested polymers’ spectra and their respective analyses are presented in the supplementary information (SI) section (Figures S1–S5).
Figure 1 -.
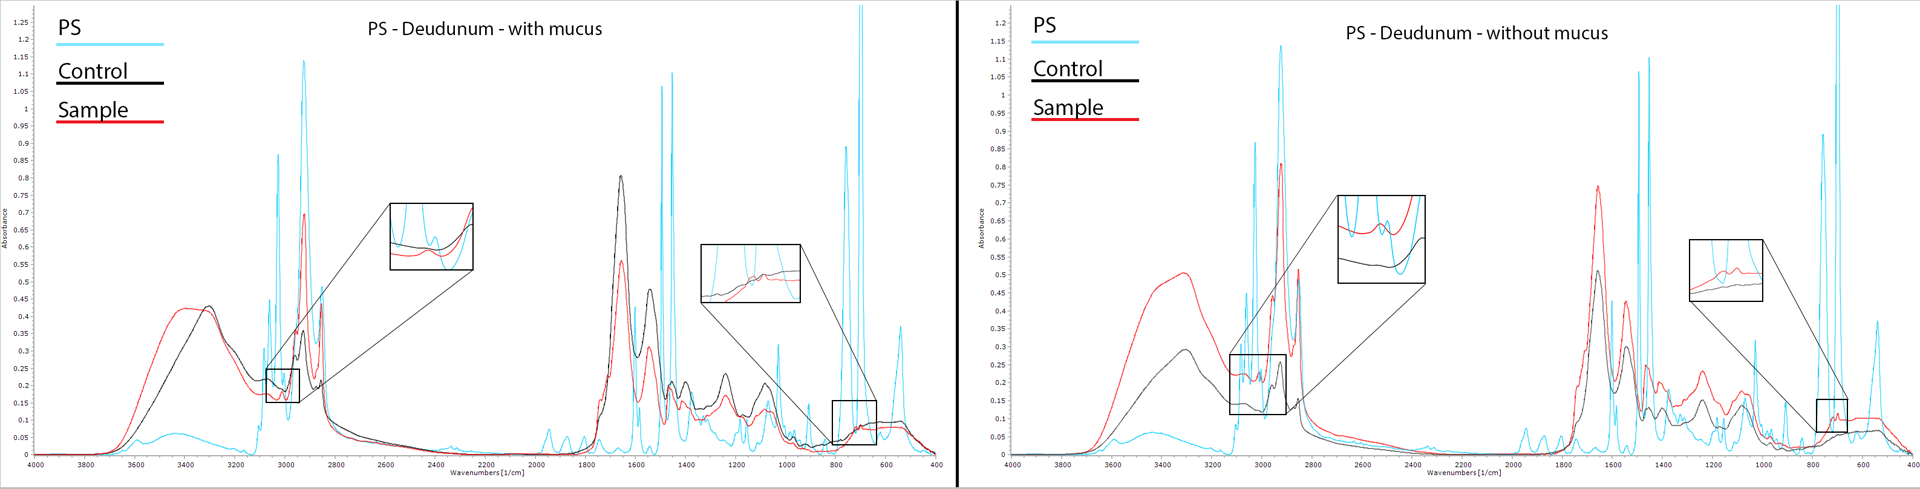
FTIR spectra of pure PS NPs (light blue), pure unexposed duodenum (black), and exposed duodenum ex vivo to PS NPs (red) for 1h. The left image’s tissue was with mucus while the right image shows tissue where the mucus was removed before exposure. Each spectrum was baseline corrected before analysis. Spectra were generated over 32 scans from 400–4000 cm−1 with 1 cm−1 steps.
As can be seen in Figure 1, several peaks were clearly detected in the pure PS spectrum which were not detected in the control duodenum spectrum: at 540, 698, and 758 (C-H bending vibration), 1030, 1375, 1493, 1601, 1804, 1872, 1944, 3002, 3026 (C-H ring vibration), and 3588 cm−1 (aromatic stretching vibration). The duodenum exposed to PS NPs ex vivo (with and without mucus) contained several bonds present both in pure PS and pure duodenum spectra. However, there were subtle differences detected in the exposed duodenum samples compared to the unexposed control duodenum. The 698 cm−1 peak corresponds to aromatic C-H bond deformations that are characteristic of PS while the peak at 3002 cm−1 corresponds to absorptions from the aromatic C–H stretching vibrations. These peaks were detected (magnified boxes in Figure 1) in the exposed tissue samples indicating PS NPs penetration to the duodenum. In summary, even though there are several distinct PS peaks, not all of them can be used for PS detection in the duodenum. But several peaks, unique for PS were detected in the exposed samples, which are good indicators of PS presence. The same approach was applied to test whether PLA8, PLGA, P(FA:SA) 20:80, and PBMAD NPs (Figures S2–S5) could be detected in exposed duodenum tissue with and without mucus. All tested polymeric NPs were detectable in exposed duodenum with or without mucus.
To quantify NP uptake, we relied on Be’er-Lambert law [47]. The protocol for sample preparation was developed based on the suggestion in Baker et al. [44]. This approach has been used before for the detection and quantification of specific components in biological specimens such as the skin, liver, release of Nigella sativa oil, and chorioamnion membrane [48–51]. Our customized FTIR method is practical, efficient, cost-effective, and available to many labs. The method was initially utilized to quantify PS NP content in exposed GI tissue. The quantification of PS was based on the observed ratio of the specific PS 698 cm−1 peak to the specific GI tissue 1545 cm−1 peak. Both peaks do not overlap, and by increasing the concentration of PS in dry GI tissues one can get linear calibration curves (see relevant spectra and calibration curve in Figures S1,6,7). This calibration curve was then used to quantify the penetration of PS NPs through the mucosal layer in the small intestine.
3.3. Effects of Particles Size and Small Intestine Region on GI Uptake Ex-Vivo and In-vivo
Two types of PS particles were used to assess the effects of NP size on each small intestine region (duodenum, jejunum, and ileum). These include the bigger particles from PS solvent evaporation (SE) - with an average diameter of 1541±151 nm (Fig. 2G), and the previously mentioned smaller PIN PS NPs with 310±100 nm (i.e., smaller particles, Fig. 2H). Both PS NPs had similar polydispersity. The FTIR-based method was used to detect and quantify the ex-vivo and in-vivo presence of these NPs in mucus and penetration into the underlining GI tissue section (Fig. 2A–D).
Figure 2:
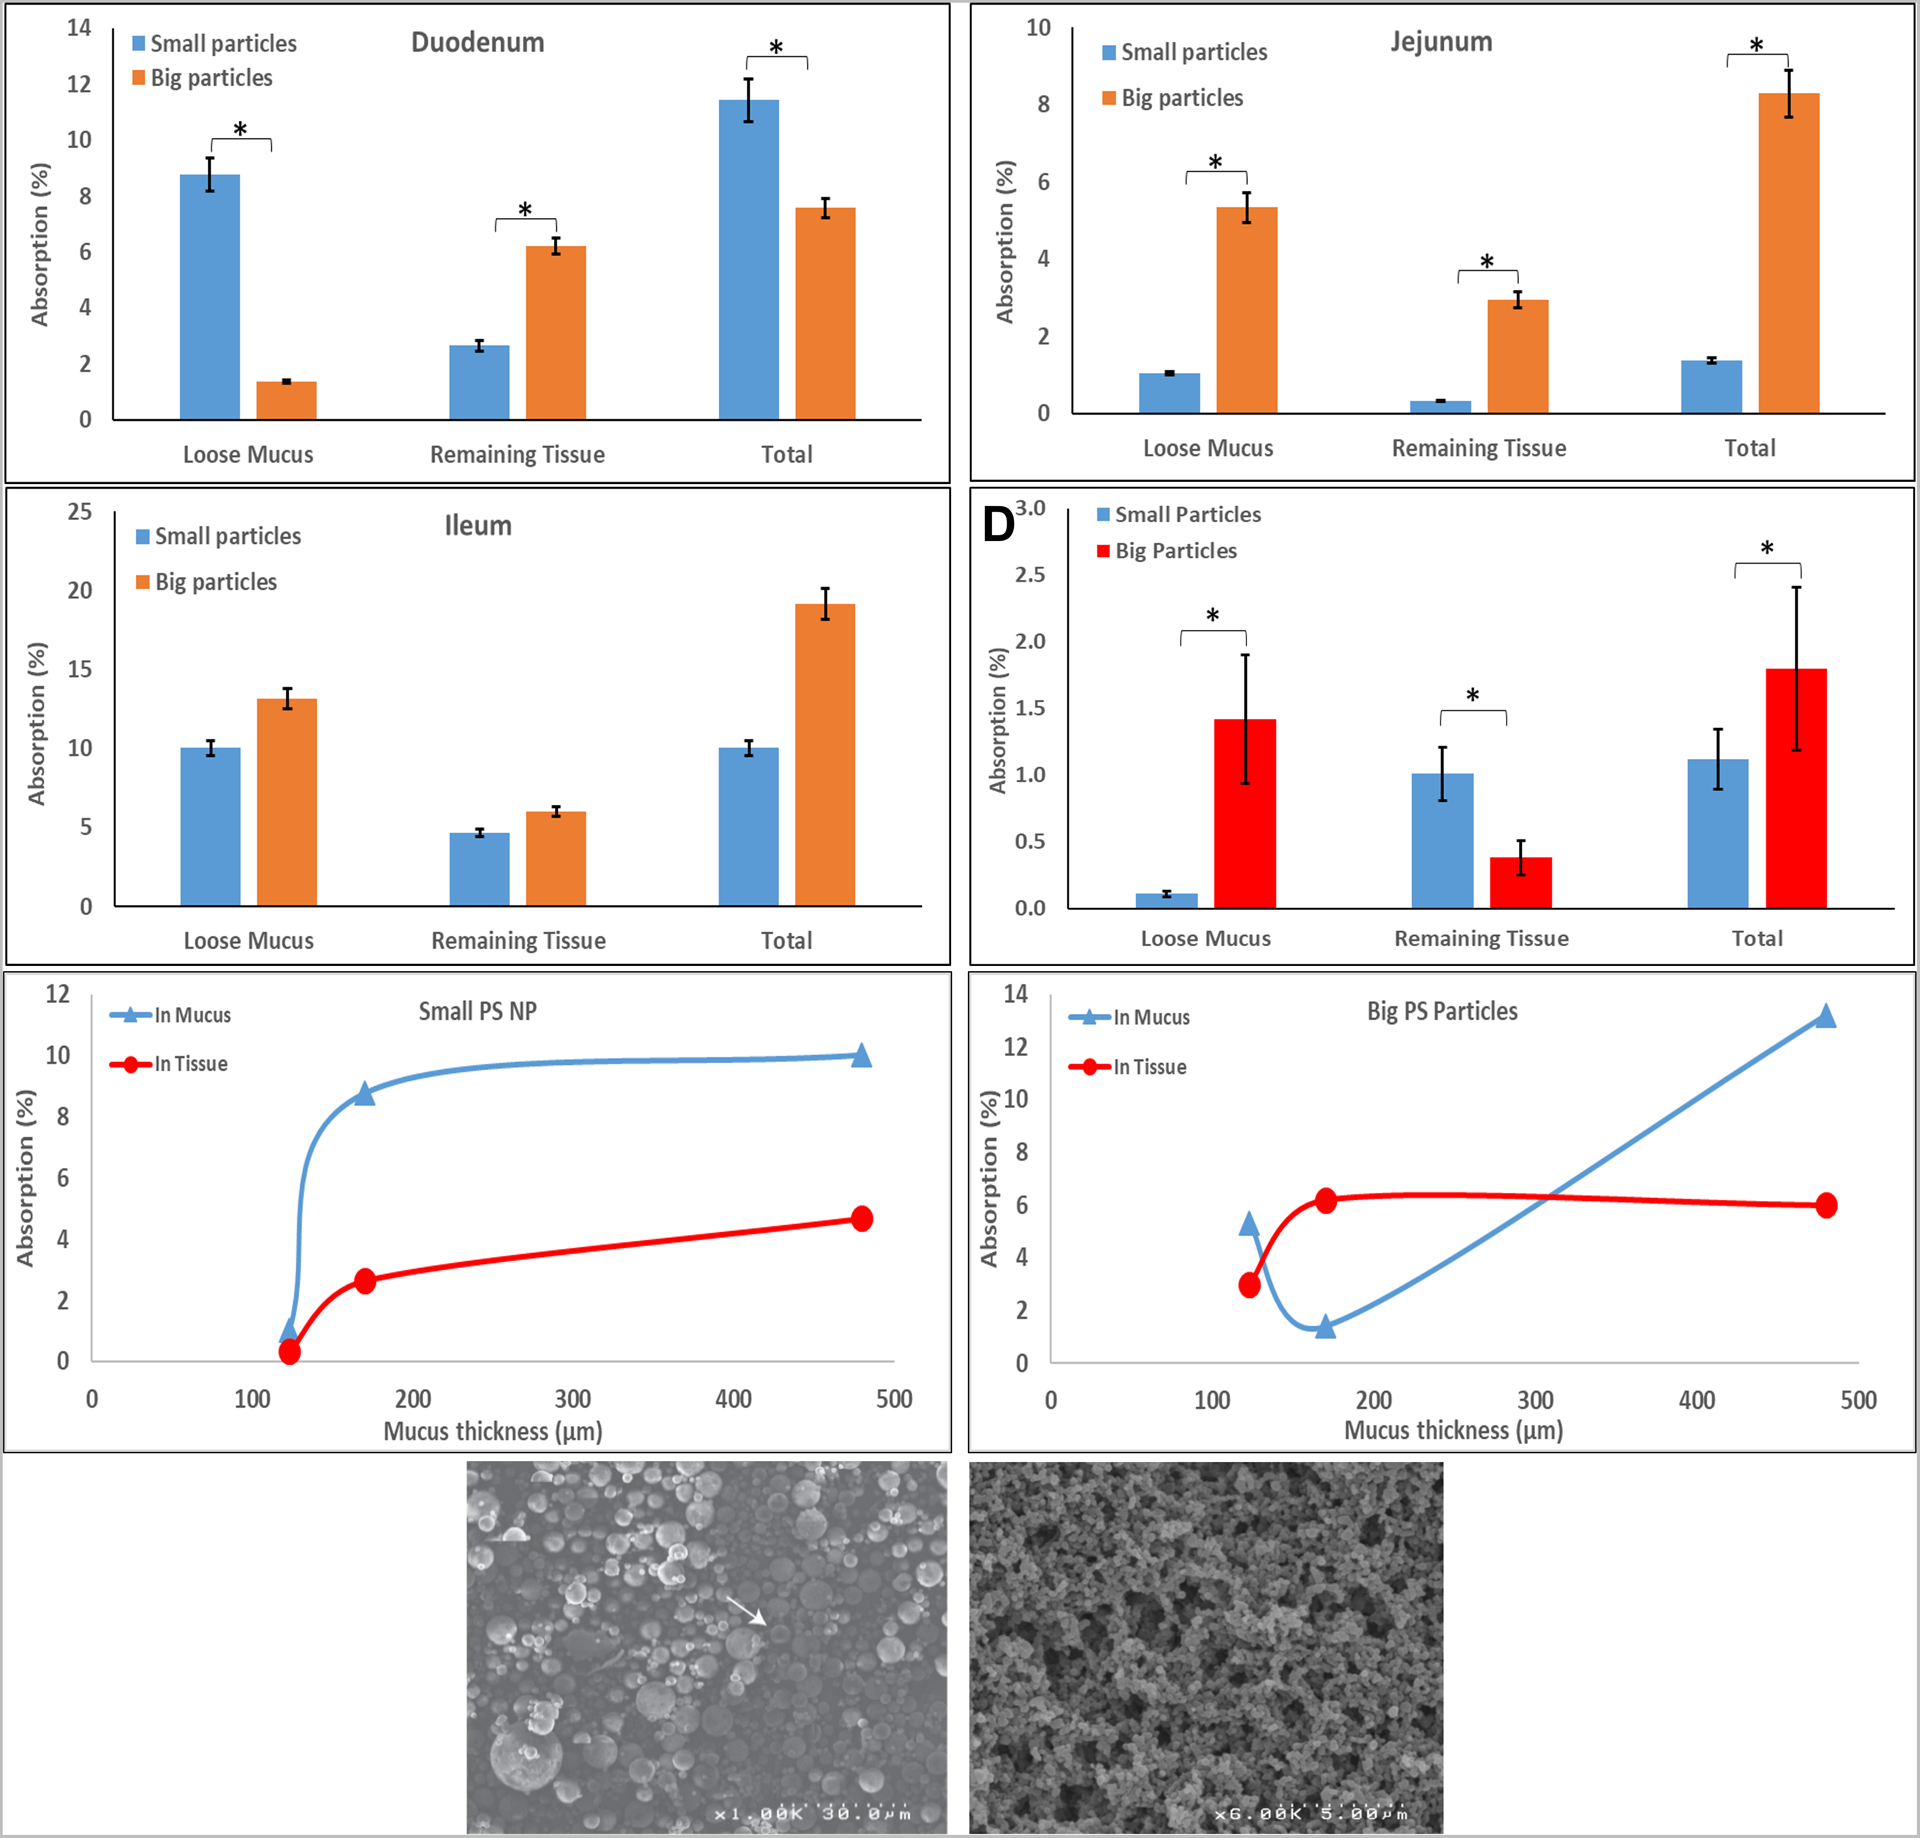
‘Big’ and ‘small’ PS NPs penetration into GI segments and the respective mucus of rats post 1h exposure in vitro; (A-C) Duodenum, Jejunum, and Ileum, respectively; (D) in vivo penetration into jejunum and mucus of rats post 5h exposure. ‘Small’ (E) and ‘big’ (F) PS NPs entrapment post 1h ex vivo in mucous (triangles) and its underlying tissue (circles) vs. mucous thickness. G-H SEM micrographs of ‘big’ and ‘small’ PS NPs, respectively. Values represent means (n≥3) ± SD (* p value<0.05).
‘Small’ PS NPs were found ex-vivo in mucus 6.4-folds more than the ‘big’ PS NPs, while on the underlining duodenum ‘big’ NPs were found 2.3-folds more (Fig. 2A). However, ‘big’ NPs were detected in higher quantities both in mucus and underlining jejunum (Fig. 2B) 8.7-folds and 5.1-folds, respectively. As for the ileum segment (Fig. 2C), no statistically significant difference was found between big and small PS NPs. In summary, the duodenum and jejunum (170±38 μm and 123±4 μm [52] respectively) exhibited greater mass-wise penetration of the big PS NPs, while absorption of big and small particles was similar in the ileum (which has the thickest mucous layer, 480±47 μm [52]).
As for the in vivo results (Fig. 2D) in the jejunal section, ‘small’ PS NPs mass penetration to jejunum was 2.7-folds greater than ‘big’ NPs while the latter was found ≈13-folds more in mucous. NPs were not detected in the IL’s lumen at the end of the experiment. NPs administered in vivo into an IL may end up in the IL’s lumen, GI tissue, or internally (liver, blood, etc.). Thus, not detecting NPs in the lumen and in small quantities in the GI tissue, suggests that most of the NPs were distributed in the body.
When we further analyzed the effect of mucosal thickness on ‘big’ and ‘small’ NPs GI uptake (Fig. 2E–F) we noticed that when the mucosal layer is >200 μm, ‘small’ NPs reach a maximal mass concentration in mucous while their tissue penetration increases with mucosal thickness. On the contrary, ‘big’ NPs reach maximal tissue penetration when the mucosal thickness is >200 μm while their mucous concentration keeps increasing with mucosal thickness. One would expect that the thinner the mucus layer is, the more NPs would be able to penetrate it. These unexpected results may be explained by the unique structure of the small intestine’s mucus. While the stomach and colon have relatively well-defined mucus layers, in the small intestine the mucus is discontinuous and less well-defined. Therefore, the tips of the intestine’s microvilli are not completely covered with mucus [53]. These gaps could allow for bigger particles to penetrate the mucosal layer into the underlying tissue.
Intuitively, one would expect smaller NPs to penetrate more as was observed for various trans-membrane/tissue such as transdermal [54], trans-tympanic [55], transbuccal[56], trans-chorioamnion [57], and transnasal [58]. However, like our results, a study by Lai et al[17], found that 100 nm NPs were slower to diffuse in mucous compared to bigger NPs. In addition, Maisel et al.[59] found that mucoadhesive particles with varying sizes exhibit no significant difference in colorectal penetration while non-mucoadhesive particles showed a decreased penetration as particle size increased (note, PS is considered moderately mucoadhesive). However, bear in mind that the presented uptake is mass-wise. Since the same polymer (PS) was used (meaning same density), we can use the ratio of their respective volumes (which is equivalent to mass when multiplied by density) to the number of NPs. The radii ratio is about 5-folds meaning the volume ratio is ≈125-folds (it is proportional to R3). Hence, there are ≈125-fold smaller NP which means that—in terms of number of particles—the smaller NPs penetrated significantly more than the bigger NPs. Considering the intestine gaps, even a few gaps entrapping bigger particles would have a great effect on their mass uptake compared to a small one (one big particle weighs 125 times more than small particles). Note that this section of the IL (jejunum) used did not contain visible Peyer’s patches which are known to enable absorption of larger particles (1–10 μm)[13, 15, 60, 61]. In these tests, we discovered that even larger particles (<2 μm) can be taken up compared to the previously reported particle size limit (<1 μm) [62].
An additional explanation for this observation (i.e., particles 3 times larger than the observed mucous pore size ≈500 nm [17] reach intestinal tissues) may relate to particles interactions with the mucosal mesh. Since PS NPs is chemically inert to mucins (no covalent bonds are formed), they can only interact via noncovalent interactions. Previously it was found that the noncovalent interaction force a microscopic particle exerts is about 100 nN [63]. Sotres et al. measured the Young’s modulus of the small intestine mucosa to be between 11 to 200 Pa [64]. Therefore, a microscopic (around 1 μm) particle would need to exert a force of 0.05–1 nN to stretch the mucous pores three times their original size. Therefore, it is very feasible that NPs can exert enough force to stretch and increase the pores diameter of the mucosal mesh. Moreover, Sotres et al. have also reported that reducing the medium pH from 7.4 to 2 resulted in a 4.7-fold increase in Young’s modulus of the small intestine [64]. Since the ileum (and despite the ileum having the thickest mucosal layer) is at pH≈7 and the duodenum is at pH≈4, its mucosal layer would be the easiest to stretch. This may further explain why the ileum had the highest absorption of NPs (big and small) in its mucosal layer. Nevertheless, the variations between ex vivo and in vivo results could also be attributed to active transport. Previously our group and others have shown that endocythosis plays a crucial part in systemic uptake of NPs within the ileum as well,[12, 13, 34, 38, 65]. Bioadhesion, electrostatic interactions, and endocytosis all stem from surface interactions. Therefore, the lumen’s mucins bio-coating certainly affect NPs oral uptake as postulated above.
As opposed to the ex vivo results, the in vivo results presented in Figure 2D show higher mass absorption (2.7-folds) into the small intestine for the smaller PS NPs compared to the bigger particles. As for the mucus entrapment, more of the bigger PS particles were entrapped than smaller PS NPs (≈13-folds). These results were further corroborated by TEM imaging comparing the in vivo uptake of PS NPs of different sizes. Based on the TEM PS particles between 200–1000 nm were shown to participate in endocytosis, see supplements section S3 Figures S21 to S27 (lower particle size (200 micron) correlated with more visible particles within endocytic). Particles larger than 1 μm were not detected within enterocytes of the proximal jejunum and were instead shown to adhere to microvilli and the mucosal layers.
3.4. Effect of Mucins Biocoating on Particles Surface Properties
The surface properties of NPs are extremely important, and are often used as predictors for successful GI uptake. However, contradictions exist as to which properties result in efficient delivery systems. For example, there are many conflicting reports about the desired surface charge—estimated via zeta potential measurements. For example, negatively charged NPs might experience electrostatic repulsion from the overall negative surface charge of mucins (-7.7 mV for 0.1% w/v). On the other hand, Kas et al.,[66] have suggested that highly positively charged (i.e., chitosan NPs) particles bind tightly to the negatively charged regions of mucins, thus hindering their movement within the mucus. Other in vivo studies demonstrated that negatively charged PS NPs can penetrate the mucosal barrier into the underlying GI tissue [8, 12, 13, 17, 38, 62, 67, 68]. Moreover, Bannunah et al. [69] reported that positively charged NPs (50 nm and 100 nm) are taken up better than negatively charged NP shown in Caco-2 cells (also post oral delivery [70]). Interestingly, many in the field know that several studies suggested that coating negatively charged particles with PEG neutralized their charge and increased their in vitro diffusion rate in mucin [16, 17, 26, 71]. Additionally, Li et al [72] found that proteins with certain positive/negative configurations were able to more effectively penetrate a mucin barrier than those proteins with a single charge alone. Overall, the literature in the field suggests that both positive, negative, and even neutral surface charge are all beneficial—and detrimental—for oral drug delivery. Another controversial surface property that is highly related to surface charge, is bioadhesion. The most important question we aimed to address was why the results obtained by our group and others [8, 12, 13] indicate that bioadhesive polymers increase systemic uptake, while other studies claim that bioadhesiveness immobilizes NPs in the mucosal layer [17].
To address these contradicting reports, we hypothesize that mucus biocoating — a constantly overlooked in vivo step — could be the answer. In essence, if mucin biocoating affects the surface properties (i.e., surface charge) of NPs, then their surface charge, measured in a medium without mucin would be an incorrect in-vivo representation of these NPs. Therefore, we set out to test if and how low concentration of mucins (mimicking GI lumen content) affects the surface charge and size of NPs. Moreover, comparing both the hydrodynamic diameter and the zeta (ƺ) potential (ZP) of polymeric NPs in DI water and a low concentration of mucin (0.1%) can indicate how mucin-NP interaction alters the surface properties of those NPs, as shown previously with silica NPs [26]. In addition, it may serve to further corroborate our TEM observation of mucins biocoating of NPs.
Therefore, polymeric NPs with different properties (bioadhesive, biodegradable, and biocompatible) were manufactured using the PIN method [42]. The size and surface charge of these NPs were measured in DI water and 0.1% mucin solution (Figures 4 and 5, respectively).
Figure 4:
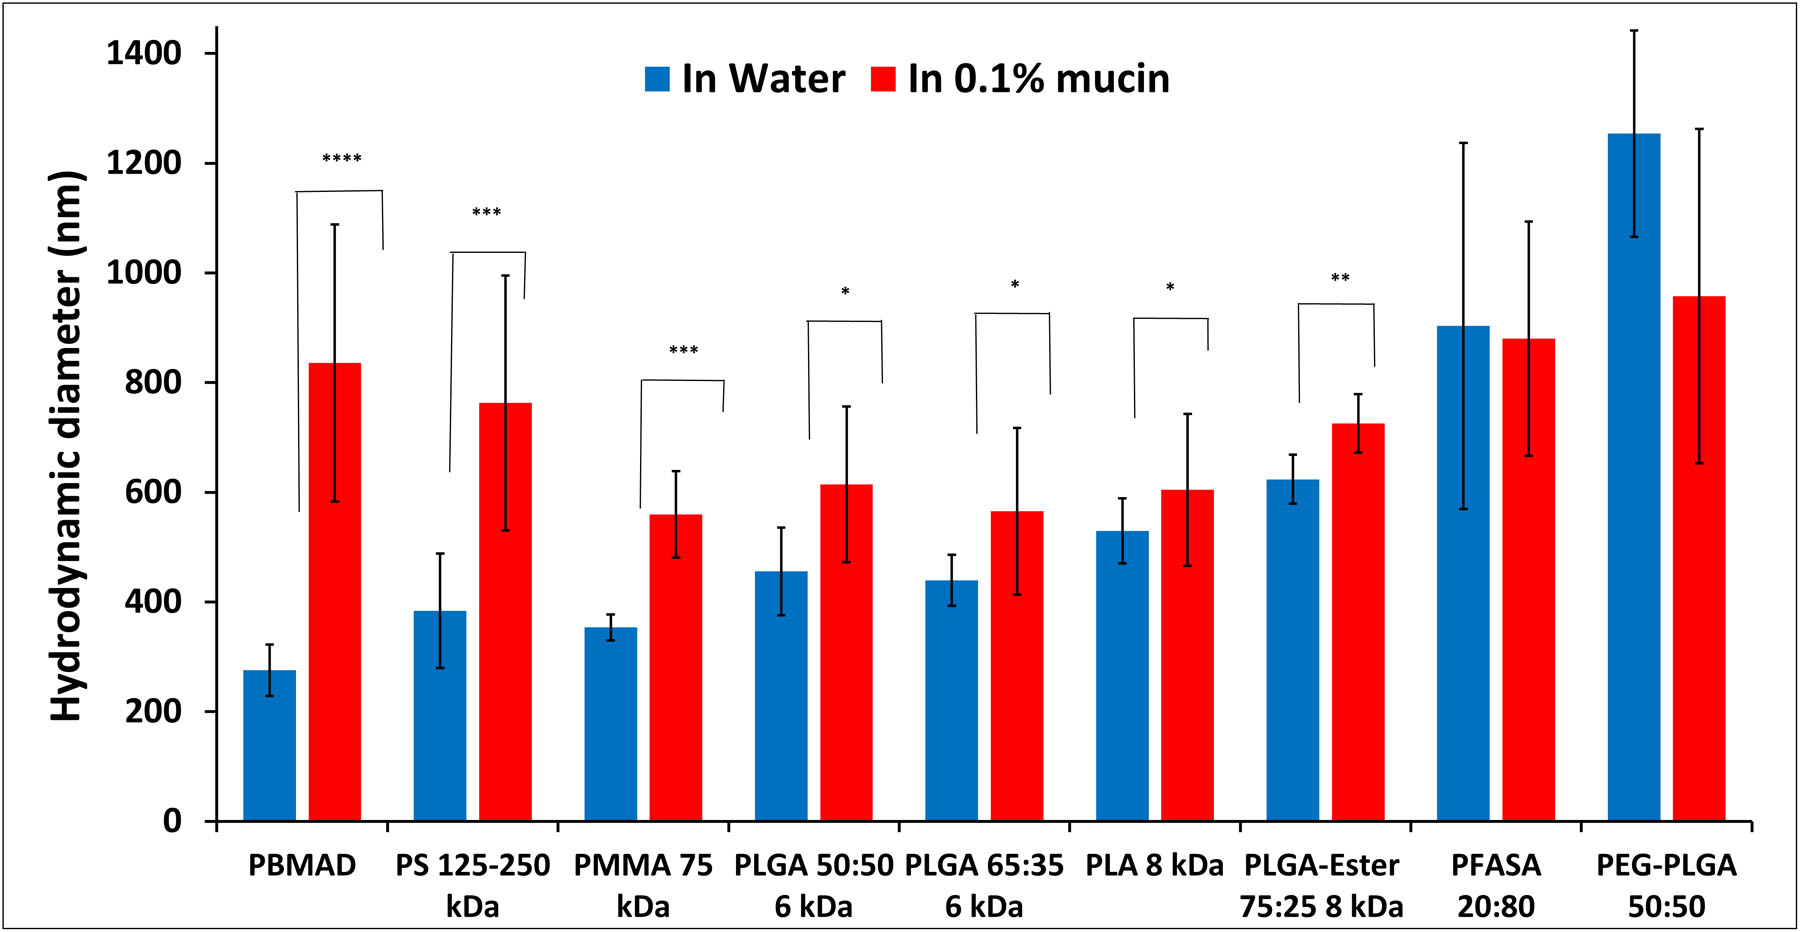
Hydrodynamic diameter (volumetric average) measurements of different polymeric NPs in 0.1% mucin (red bars) and DI water (blue bars). Mean (n≥3) ± SD (* p< 0.1; ** p< 0.05; *** p < 0.005, **** p < 0.0005).
Figure 5:
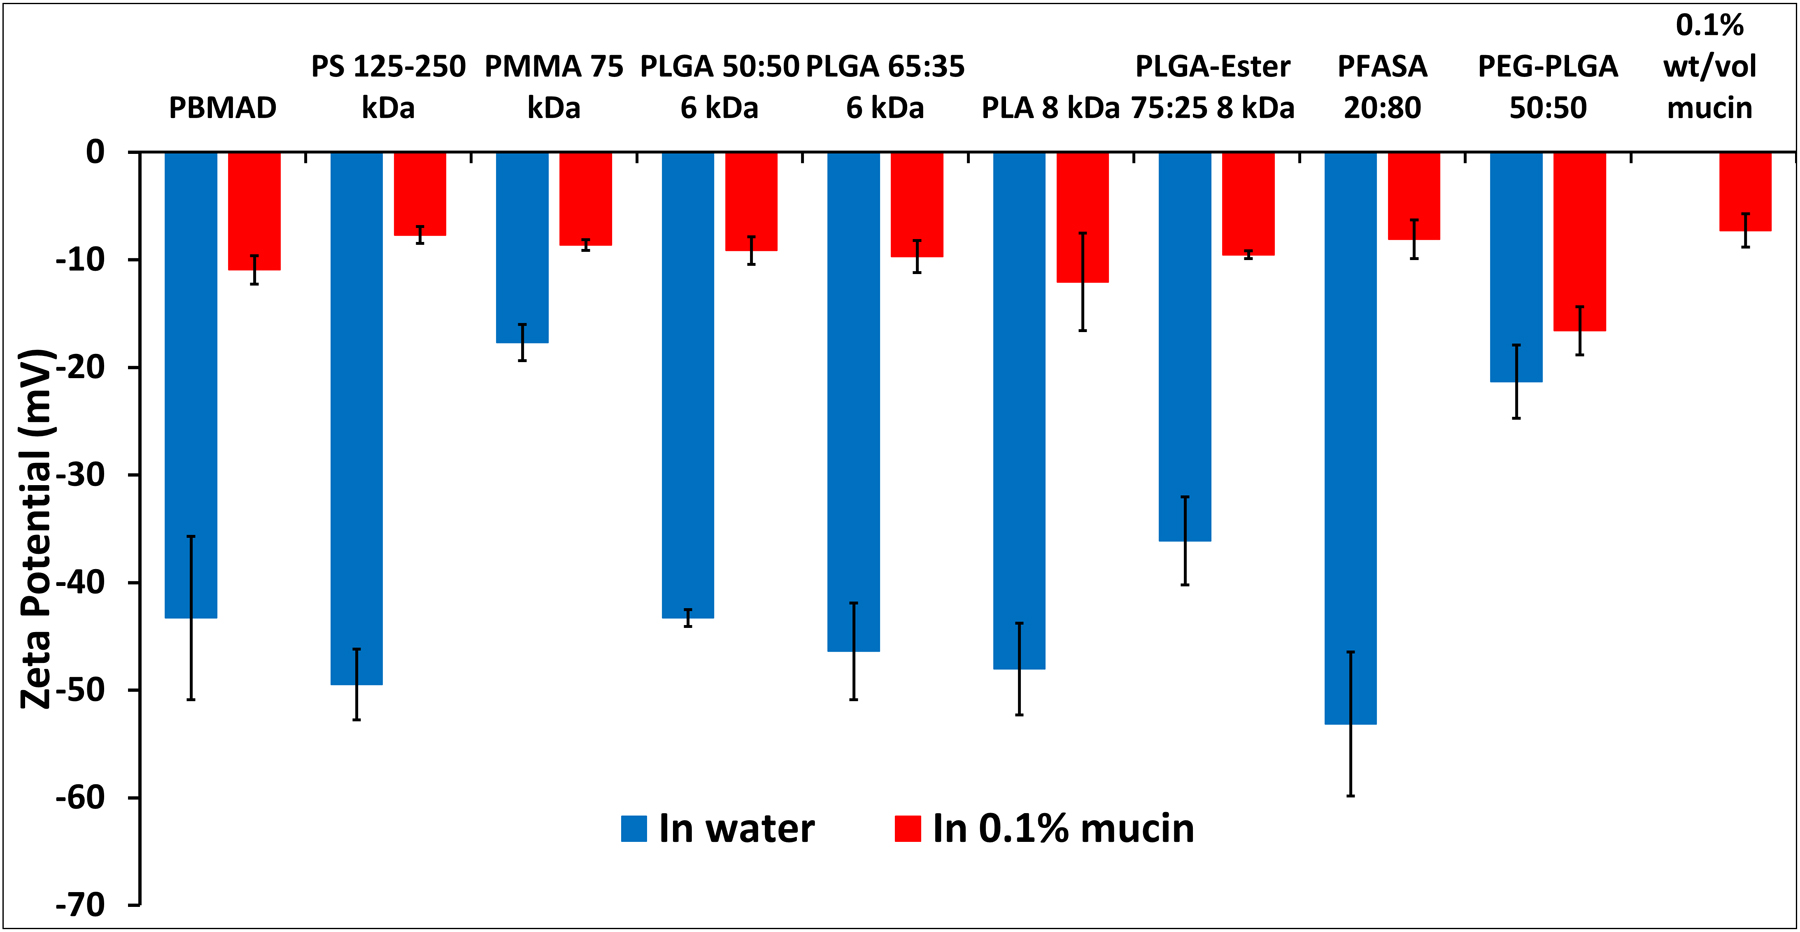
ZP measurements of different polymeric NPs in 0.1% mucin (red bars) and DI water (blue bars). Mean (n≥3) ± SD (* p< 0.1; ** p< 0.05; *** p < 0.005, **** p < 0.0005).
The results in Figure 4 illustrate that most of the tested polymeric NPs show an increase in their hydrodynamic diameter in mucin solution compared to DI water. Since these polymers are not known to swell in aquatic solutions (excluding PEG-PLGA), the increase in diameter suggests that mucin biocoats the NPs. More specifically, PBMAD NPs exhibited the greatest increase in size (3-folds) while P(FA:SA) 20:80 and PEG-PLGA (50:50) did not exhibit any statistically significant change in their diameter. This might be because NPs with PEG create a water interface that hinders surface interaction with mucin [17]. As for P(FA:SA) 20:80, it could be because it undergoes rapid hydrolysis in water [73]. This increase in size post-exposure to mucins (0.025%) was observed to be even more intense with positively charged silica NPs, increasing from 40 nm to almost 1000 nm [26, 74]. Suggesting that mucins interact with negative, positive, and hydrophobic NPs. Our results, and others [75], further support our TEM observation that mucus can biocoat NPs in the GI (Figures S30–31).
The results presented in Figure 5 show that all the tested polymers had a negative surface charge in DI water, ranging from −17 to −53 mV, while in 0.1% mucin solution their charge was significantly reduced to the range of −7.7 to −16 mV (note that neat 0.1% mucin had −7.3 mV charge). This would indicate that mucin-NP interaction and biocoating “masks” the innate charge of the polymers, bringing them closer to neutral. PS alongside P(FA:SA) 20:80 NPs had the least negative surface charge in mucin. The results of PS NPs could be attributed to reduced electrostatic repulsion to mucins as suggested previously by Cone et al. [16]. PLGA with different end groups (acid vs. ester end group) and PEGylated PLGA exhibited a substantial reduction in their surface charge. Though P(FA:SA) 20:80 NPs size didn’t change, its surface charge did change drastically (−53 to −8 mV) indicating P(FA:SA) 20:80 does interact strongly with mucin. It should be noted that no correlation was found between the size increase of NPs and their respective surface charge decrease. Both observations of an increase in NP size and reduced surface charge further support our claim that mucins coat NPs.
The chemistry of a polymer, and its functional groups, are the sole determinants of NP charge in non in vivo models (such as their charge in pure water). However, their effective in-vivo surface charge in the GI is governed by mucin-biocoating, which is dependant on a NPs’ electrostatic (or hydrophobic) charge. Biocoating is attributed to mucin’s glycoprotein’s various molecular interactions such as hydrogen bonding and electrostatic interactions with a flexible array of alternating hydrophilic/hydrophobic regions [21, 66], explaining why it can practically interact with positive, negative, and hydrophobic NPs. This interaction could be specifically attributed to the complex structure of mucins which have both positive and negative moieties (from their protein section which is 50–90% of their total MW [5] and distributed charge [76]). Thus, in vitro or ex vivo assessments of particle surface charge should be done in the presence of a low concentration of mucins to better mimic and predict in vivo efficacy, not only for oral delivery but for any mucosal barrier (e.g., vaginal, pulmonary, buccal, etc.)
3.5. Biocoating effects on polymeric NPs in mucous
After we have established that mucin biocoating affects the in-vivo surface properties of polymeric NPs, we hypothesized that mucin biocoating would also affect a NP diffusion in mucus. We evaluated the effect of biocoating on the mucosal diffusion coefficient of NPs and their cluster formation in mucus. To test the effects of biocoating on diffusion we used PCR-PS and PS 125–250 kDa NPs (hydrophobic interactions), PLA8 NPs (electrostatic interactions), and PMMA NPs (mild to no interactions). Briefly, NPs were first dispersed in DI water (i.e., unbiocoated) or 0.1% mucins solution (i.e., biocoated) before introducing it into the 5% mucin gel (mimicking mucosal barrier composition [77]). Then, we measured the mucosal diffusion coefficient (i.e., Dm) of biocoated and unbiocoated NPs. Note, PS 125–250 kDa NPs were also used to assess the effect of polymer MW. From ZP measurements we found that the fluorescent PCRPS NPs (500 nm) were less negatively charged compared to PS 125–250 NPs. The diffusion experimental results are presented in Table 1.
Table 1:
In vitro diffusion coefficient (Dm) of mucin biocoated and unbiocoated PMMA, PCRPS, PS 125–250 kDa, and PLA8 polymeric NPs in a 5% mucous gel.
| Polymer Type | Dm in 5% Mucin non-biocoated (cm2/s) | Dm in 5% mucin, biocoated with 0.1% Mucins (cm2/s) | Enhancement (folds) |
|---|---|---|---|
| PMMA | 1.9±0.2×10⁻¹⁰ | 1.8±0.2×10⁻¹⁰ | 0.9 |
| PCRPS | 6.8±2.9×10−08 | 8.8±3.4×10−08 | 1.3 |
| PS 125–250 | 2.2±0.5×10−08 | 1.1±0.4×10−07 | 5.2 |
| PLA8 | 3.4±1.5×10−08 | 7.3±0.1×10−07 | 21.3 |
As can be seen from Table 1, the Dm of non-coated PCRPS NPs was originally 6.8±2.9x10⁻⁸ cm2/s. Post mucin biocoating the PCRPS NPs had a mucosal diffusion coefficient 1.3-fold greater than the control. PS 125–250 with mucin biocoating had its Dm increase 5.2-folds to 1.1±0.4x10⁻⁷ cm2/s compared to the non-biocoated variant. PMMA NP’s Dm in 5% mucous solution was unaffected by mucins biocoating (1.9±0.2x10⁻¹⁰ cm2/s vs. 1.8±0.2x10⁻¹⁰ cm2/s). PLA8 NPs exhibited the highest change in Dm after biocoating, with a 21.3-fold increase from 3.4±1.5x10⁻⁸ cm2/s to 7.3±0.12×10⁻⁷ cm2/s. It is also interesting to note that PLA8 and PS 125–250 NPs had similarly high surface charges in water (−48 and −49.5 mV respectively, Figure 4), post mucin biocoating (−12mV and −8 mV respectively, Figure 4), and had the highest diffusion rates in 5% mucin. Therefore, we may conclude that mucins biocoating affects the diffusion rate of charged NPs only (PLA8 and PS 125–250 vs. PMMA NPs). Moreover, when looking into PS NP diffusion, as compared to PCRPS diffusion, the PS NPs have a 3-fold lower in vitro diffusion rate in DI water. However, when comparing the two in the 5% mucin solution (more indicative of an in vivo environment), PS NPs have a slightly higher diffusion rate. This demonstrates the importance of assessing NP properties in the presence of mucin.
While analyzing the diffusion experiments, it was evident that clusters of NPs had formed (excluded from calculations for all samples). This is to be expected since mucin biocoating affects the charge of NPs and it is well-known that surface charge affects the stability of suspensions [26]. Understanding cluster formation is important for GI uptake since clusters diffuse slower (and may even “get stuck”). On the other hand, clusters may result in a decreased burst release (which is a major limitation for drug delivery vehicles [73, 74, 78]). Moreover, NP aggregation was found to affect the fate, persistence, toxicity, and cellular uptake of NPs [71]. Therefore, we quantified the cluster formation of biocoated and uncoated NPs (Figure 6). Clusters were defined as aggregates larger than four times the diameter of the respective NPs.
Figure 6:
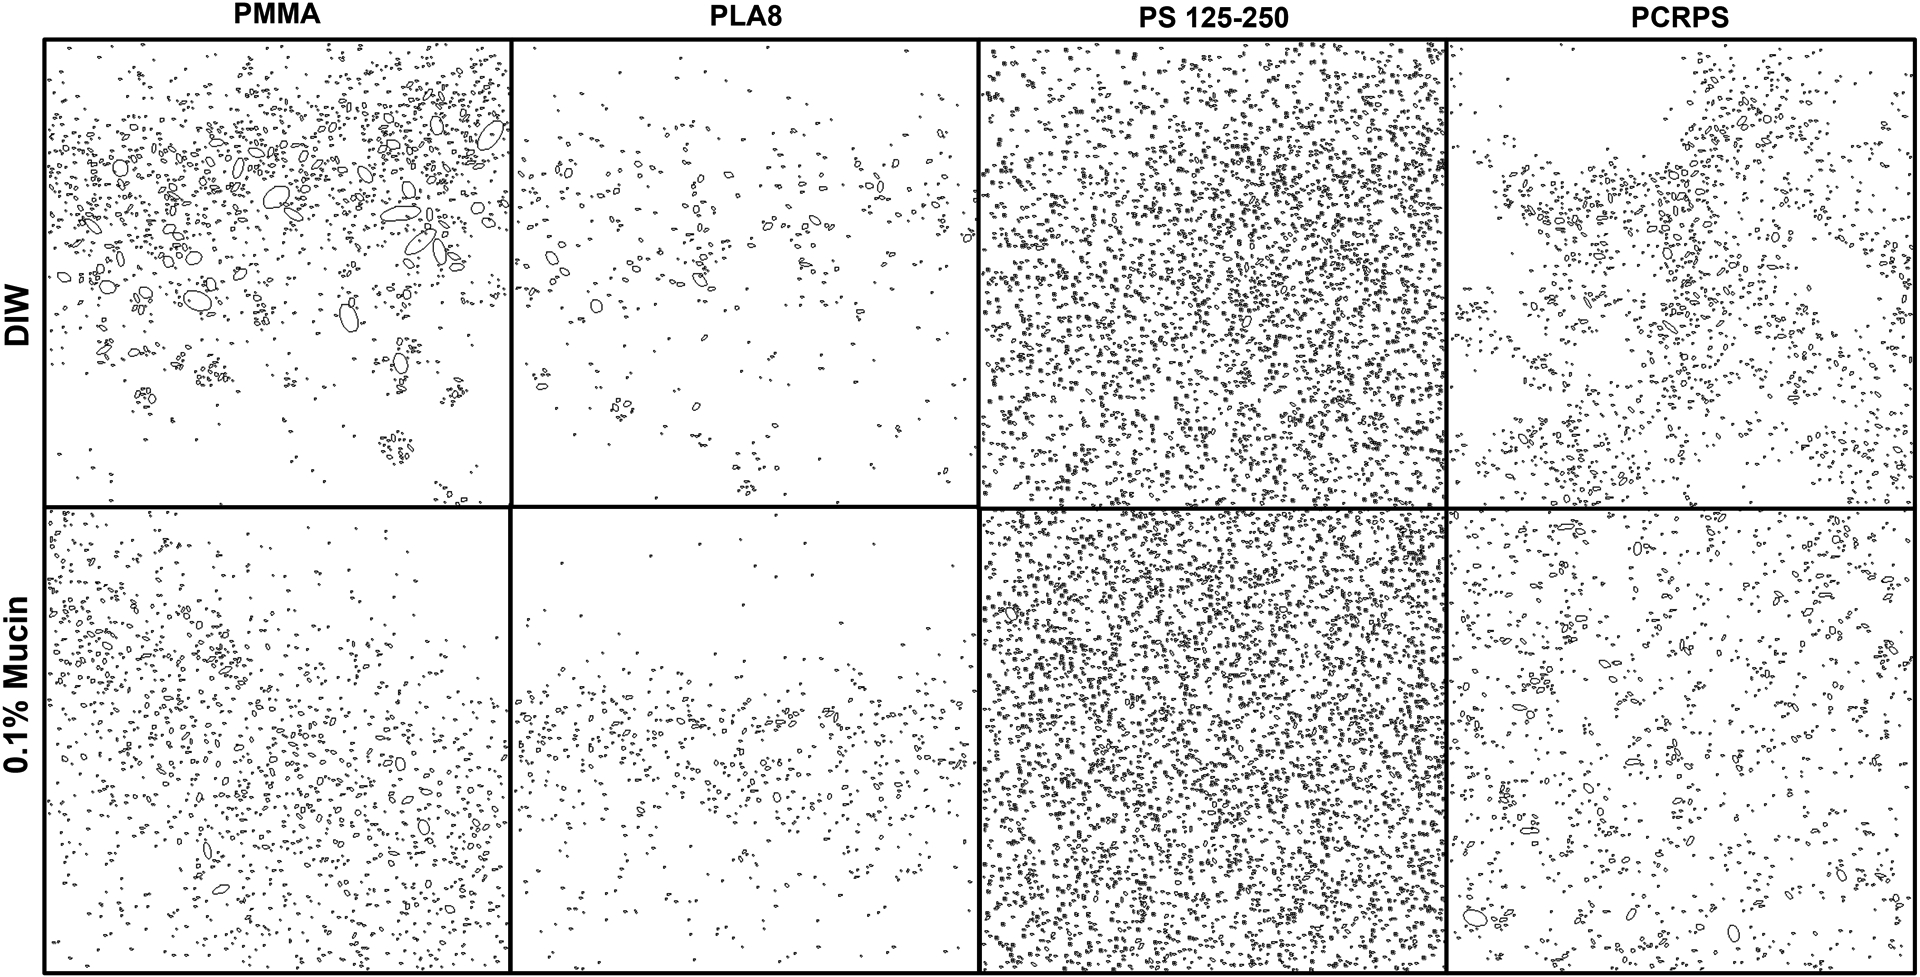
Detected clusters of polymeric (PLA8, PCR-PS, PS 125–250 and PMMA) NPs in 5% mucin solution. Top panels show the clusters detected when the NPs were first dispersed in DI water while bottom panels show the clusters detected when the NPs were first dispersed in 0.1% mucin solution.
The results show that biocoated PLA8 NPs had 20% fewer aggregates in 5% mucin compared to unbiocoated NPs. Biocoated PCRPS NPs exhibited 20% more clusters compared to unbiocoated NPs in a 5% mucin. Surprisingly, both PS 125–250 and PMMA NPs cluster formation was not affected by mucin biocoating. This effect may also be used to explain differences in efficacies of NPs in in-vitro vs. in-vivo experiments. Based on the observations of the effects that mucin biocoating has on NP mucosal diffusion, we believe that future studies analyzing in vitro oral NP delivery systems need to take into account mucin biocoating when designing and analyzing the efficacy of of oral delivery NPs.
3.6. Detection and Quantification of NPs in Blood
Having shown the possible benefits of mucin biocoating on NP delivery systems (i.e., enhanced diffusion & fewer aggregates), we set out to analyze their affects on systemic uptake (i.e., traversing the GI barrier). For systemic uptake to occur, NPs need to diffuse through the mucosal layer faster than the GI mucosal clearance rate [16]. Bioadhesive particles have been suggested to improve residence time and uptake. However, their oral delivery efficacy was controversial. Some have reported that bioadhesive NPs would get trapped in the mucosal layer and subsequently be cleared [17]. On the other hand, Reineke et al. reported that the total systemic uptake of PMMA NPs coated with the highly bioadhesive PBMAD increased from 6% to 66% [13]. In addition the bioavailability of the encapsulated active pharmaceutical ingredient (API) (e.g., insulin and dicumarol [8, 18]) was also shown to improve when delivered with bioadhesive polymers. Since many bioadhesive NPs have high negative ZP (due to their multiple carboxylic groups), it was hypothesized that negative charge may also predict bioadhesiveness. However, no correlation was found between bioadhesiveness and ZP in DI water nor 0.1% mucins solution (see Figure S11). Nevertheless, we hypothesized that a particle with a high surface charge (|ZP|>40 mV in water and nearly neutralized after mucin biocoating) and enhanced bioadhesion force would be beneficial for oral delivery. We postulate that the combined effect of enhanced mucosal diffusion and retention time would provide NPs with sufficient time and velocity to diffuse through the mucousal layer and reach systemic uptake. We had already evaluated several polymer NPs in the past, and knew that PMMA NPs have low uptake [12] while PS NPs have high uptake [13], and as such we decided to evaluate PLA8 as a biodegradable alternative to PS in-vivo. PLA8 was chosen with the mentioned criteria in mind: ZP reduction from −48 to −12 mV with ~1800 mN/cm2 bioadhesive force. PLA8 NPs also exhibited the highest increase in Dm and decrease in cluster formation after mucins biocoating. Moreover, PLA is biodegradable and biocompatible, Unlike PMMA and PS, thus more relevant to oral drug delivery. Accordingly, the FTIR-based method was further customized to detect and quantify PLA8 content in blood. Table 2 presents the calculated bioavailability (BA) of PLA8 NPs after in vivo IL experiments (for all rats, n=8).
Table 2:
Rats’ gender, weight, and PLA8 NP bioavailability (BA) post 5h in vivo ILs as calculated by calibration methods #1 (subtraction) and #2 (division). F/M - Female/Male rat.
| Rat | Weight (g) | PLA8 Dosage (mg) | Blood volume (mL) | Dry serum mass (mg)** | Method #1 – Subtraction average | Method #2 – Division average | ||
|---|---|---|---|---|---|---|---|---|
| % in serum | BA (%) | % in serum | BA (%) | |||||
| #1-F | 367 | 91 | 20.9 | 878±152 | 3.7±1.6 | 36±16 | 5.3±3.4 | 51±33 |
| #2-F | 270 | 77 | 15.4 | 646±112 | NA | NA | NA | NA |
| #3-M | 450 | 67 | 25.7 | 1077±186 | 2.6±0.9 | 42±14 | 2.6±1.5 | 43±25 |
| #4-M | 510 | 75 | 29.1 | 1221±211 | 2.1±0.9 | 35±14 | 2.1±1.5 | 34±24 |
| #5-M | 766 | 85 | 26.0* | 1094±189 | 6.6±1.2 | 85±16 | 3.5±0.5 | 45±7 |
| #6-M | 580 | 167 | 33.1 | 1388±240 | 2.6±1.3 | 22±11 | 2.1±1.4 | 18±12 |
| #7-M | 433 | 147 | 24.7 | 1036±179 | 5.0±1.6 | 35±11 | 3.0±1.7 | 21±12 |
| #8-M | 541 | 145 | 30.8 | 1294±224 | 2.0±0.6 | 17±6 | 1.8±0.9 | 16±8 |
First, it should be noted that PLA8 wasn’t detected in whole blood or the erythrocyte portion. This was expected as it was previously reported that spectra obtained with erythrocytes may mask the spectra of other biomolecules [44, 45]. However, we were able to detect PLA8 in the serum portion of blood samples taken after 5h. PLA8 NPs were not detected in earlier time point samples. PLA8 NPs exhibited impressive bioavailability (BA) (except for rat #2) of over 30% (35±6.9%). Moreover, PLA8 NPs were also detected in the liver, lungs, and spleen (SI section 2.7 and Fig. S15). The relatively high negative charge in DI water of PLA8 (−48 mV) is attributed to its low molecular weight (MW) resulting in a higher percentage of acid end groups exposed on the NP surface. In addition, it may also explain why PLA8 possesses a relatively high bioadhesive force, resembling P(FASA) (see Figure S11). This similarity might relate to their interactions with mucin. Mucins, which are the main ingredient of mucus, are fibers with long glycosylated and highly hydrophilic domains, separated by hydrophobic regions, creating a flexible array of alternating hydrophilic and hydrophobic regions as well as hydrogen bonding with the surface of nanospheres [22]. Thus, PS NPs may interact with mucin via hydrophobic interactions while PLA8 and PBMAD do so via electrostatic interactions. These results could be further explained with the following recent study. Lamson et al. found that silica NPs <200 nm with a negative charge of −40 to −60 mV induced tight junction openings in Caco-2 cells (the first line predominant cells in the GI) [79]. Interestingly, they also reported achieving ≈30% bioavailability for insulin using their negative silica NPs. Additionally, silica also possesses enhanced bioadhesion as was shown herein [80]. Our and Lamson et al. results support the hypothesis that a particle with a high surface charge (|ZP|>40 mV) and significant bioadhesion force would be beneficial for oral delivery.
3.7. Extended Discussion and Proposed Mechanism on the Effects of Mucins Biocoating
Interestingly, we found several reports in the literature where NPs with near-neutral surface charge exhibited enhanced oral uptake, albeit explained differently. For example, studies using PEGylation of negatively charged NPs claim that it renders them ‘mucus-inert’ thus creating mucus penetrating particles (MPPs) [17]. In these studies, when the particles reached ‘almost neutral surface charge’, they were defined to have “sufficient” PEG-coating [17, 19, 59, 81, 82]. In addition, Liu et al used N-(2-hydroxypropyl) methacrylamide copolymer (pHPMA) derivative to coat positively charged chitosan NPs which increased their uptake [83]. They showed that pHPMA coating neutralized the surface charge of chitosan NPs from +30 mV to a slightly negative charge of −3.35 mV [83]. Based on these reports and our results, we propose a general explanation to these observations. We argue that the type of interaction (hydrophobic/electrostatic) of NPs with mucins is less important than their effective surface charge post mucins exposure. Nearly neutral precoated NPs (e.g., PEG, pHPMA, etc.) will not be affected by mucins biocoating. Thus, mucins do not affect their in-vivo mucosal diffusion properties. However, charged NPs—negatively and positively—are shown to be affected by lumen’s mucins, effectively reducing their surface charge. In turn, this effective surface charge post biocoating is the determining factor of their in-vivo mucosal properties.
Next, we aimed to provide theoretical calculations regarding the proposed general mechanism to elucidate the effects of mucins biocoating and bioadhesion on the oral delivery of polymeric NPs. For successful oral uptake, NPs need to diffuse through the mucosal layer faster than the GI mucosal clearence rate [16], thus an adequate balance between residence time and diffusion rate is required. Bioadhesion is one approach used to increase residence time in the GI [32–39, 78, 84]. The importance of residence time could be demonstrated via equation 1 describing the mean squared displacement of a particle:
| Equation 1 |
where <x2> is the mean-square displacement and t is time and Dm is the diffusion coefficient. As a result, one can calculate the theoretical minimal diffusion coefficient required for a NP to diffuse through the mucosal layer.
For example, the average residence time in the small intestine of rodents is 2.6–3.3 h and the thickness of their jejunal mucosal layer is ≈120 μm (encompassing 90% of their small intestine) [85]. Therefore, based on these properties and equation 1, it could be calculated that a Dm of 2.5–3.0×10⁻⁹ cm2/s should suffice to diffuse across rodents’ mucosal layer. The same calculation could be applied to the human small intestine where the residence is 3.1–8 h for fasted and 3–6 h for fed humans [86]. Human mucosal jejunum thickness ranges from 300 to 400 μm[87]. Thus, for humans, the Dm should be in the range of 3.7–13.9×10⁻⁹ cm2/s. These values are like the calculated values for rodents, suggesting that rodents are a good animal model for evaluating GI uptake. Interestingly, both PS and PLA8 NPs which exhibited significant systemic uptake in rats have a greater Dm—post mucins biocoating—than theoretically required (Dm=1.1±0.4×10−07 cm2/s and Dm=7.3±0.12×10⁻⁷ cm2/s, respectively) NPs. This indicates that simply measuring the diffusion coefficient in mucus post mucins biocoating is a good in vitro model and predictor of successful oral uptake of polymeric NPs. On the other hand, the pig’s mucosal layer of the small intestine is merely 26–31 μm[88] while the residence time in their small intestine ranges vastly from 2 to 33 days[89, 90]. Even if we assume only 50h of residence time in pig’s intestines, the calculated required Dm to diffuse its mucosal layer would be 9.4–12.5×10⁻¹² cm2/s. This value is two to three orders of magnitude smaller (and even more so if we assume 33 days) than the required value for humans and rodents. It means that even a “slow” NP with a Dm value lower than 3.7–13.9×10⁻⁹ cm2/s would still perform well in pig’s intestines. Hence, pigs are not a good animal model for evaluating oral delivery systems. Nevertheless, other animal models should be considered for other evaluations. For example, dogs and humans have similar stomach morphology; pigs and humans have similar colon morphology; the intestinal microflora of rabbits is similar to humans[91]. In conclusion, these calculations further emphasize the importance of measuring the correct Dm of NPs (i.e., post mucins biocoating). In addition, since the mucous layer is considered a membrane, the mucus permeability coefficient (Pm) is better suited to describe penetration through a membrane. Pm can be used to quantify the rate at which a molecule crosses a membrane (e.g., mucous). Pm is defined in equation 2:
| Equation 2 |
where Kp is the partitioning coefficient between the medium and mucosal layer, and h is the mucosal thickness. As can be seen from equation 2, a lower Kp directly affects the permeability through a membrane. Since bioadhesion measures the affinity of a material to the mucosal layer, bioadhesion correlates with Kp. Therefore, high bioadhesion may potentially increase the number of NPs that adsorb to the mucosal membrane. Since bioadhesion increases the residence time (t) and partitioning into the mucosal membrane (Kp) but can get aggregated/stuck in the mucosal layer [19], bioadhesives (e.g., PBMAD) are better used as coating and not as the core material. However, degradable bioadhesives such as P(FA:SA) 20:80 NPs (as shown with insulin [38]) could be used as core polymers since their diameter decreases in the GI which in turn increases its diffusion.
Therefore, NPs with low bioadhesion may inherently be limited in their oral uptake. For example, even though inert NPs (e.g., PEGylated) have increased Dm, it may not be sufficient for successful GI uptake due to its inertness, suggesting low Kp. If materials cannot absorb to the mucosal membrane in sufficient amounts, then its uptake will be limited by its reduced absorption into mucus and not by its Dm. In summary, we propose the following steps in NPs GI uptake (chronologically): NPs biocoating (affecting NPs size and ZP), absorption to the mucosal layer (governed by bioadhesion force), diffusion through the mucosal layer (affected by NPs ZP), and GI epithelial cells uptake (see discussion in SI Section 2.4 about optimal NPs size, shape, and stiffness for Caco-2 cells). Thus, NPs ZP should be slightly negative (near-neutral) post biocoating (for improved Dm) with relatively good affinity (Kp) to mucous for effective GI uptake.
Lastly, regarding the mucosal layer thickness, age and gender should also be considered. For example, Trbojević-Stanković et al. [87] found that the mucosal layer thickness changes with age and gender, from jejunal mucosal layer thickness of 280 vs 420 μm for adult males and females to 220 and 260 μm for elderly males and females, respectively.
Particle size is not the only parameter to affect uptake in cells. For example, Win and Feng [92] showed that PLGA NPs coated with PVA or vitamin E TPGS increased uptake into Caco-2 cells 4–6 folds compared to naked PS NPs with a similar diameter (≈200 nm). Another factor is particle stiffness. A recent review by Anselmo and Mitragotri found mixed results regarding the effect of particle stiffness, though most of the studies claim that “harder” particles are being taken up more than “softer” particles [93]. However, the stiffness evaluated in these studies ranged from 1.3 kPa to 1·107 kPa, thus making softer and harder particles—relative terms. For example, one ex vivo study used a 4300 kPa particle as the “soft” particle compared to the harder particle with 1·107 kPa. On the other hand, another ex vivo study used 1.3 kPa and 15 kPa as soft and hard particles. Therefore, soft and hard terminology is relative which makes it hard to come to a decisive conclusion whether “harder” or “softer” particles result in higher uptake. The stiffness of PS NPs was investigated by Guo et al. [94] where the stiffness of PS NPs was shown to increase as the particle size decreased (from 2 to 8 GPa for the 1000 and 50 nm, respectively). This change could explain some of the conflicting reports where larger particles (< 1 μm) were absorbed into the GI ex vivo more than smaller particles [17, 92]. Interestingly, Guo et al. found that 50 nm penetrated Caco-2 cells the least (6%), while 100, 200, and 500 nm PS NPs were taken up 2-folds more. The results of Guo et al. [94] and Win and Feng [92] were combined in Figure S10 to gain further insights. In summary, we suggest that harder/softer terminology should not be used. Instead, stating the specific stiffness with enhanced uptake for a specific cell culture/tissue should be used. For Caco-2 cells which are more relevant for oral drug delivery, the optimal stiffness seems to be 3–7 GPa (with a particle size of 200–600 nm).
4. Conclusion
In this research project, we focused on a key step in oral drug delivery, which we termed mucus biocoating, which affects NP size, surface charge, diffusion coefficient, aggregation, and ultimately their oral uptake potency. Mucus biocoating occurs naturally when mucoadhesive particles enter the lumen of the samall intestine in vivo, forming a mucus corona around the NPs. Mucus biocoating was validated directly (visually via TEM), and indirectly via its effects on polymeric NPs properties such as their: effective surface charge, size, diffusion, and clusters formation in mucus. We found biocoating with mucin reduces (and for some neutralizes) the surface charge of NPs, increases their hydrodynamic size (due to mucin coating), and may increase their diffusion coefficient and decrease their cluster formation. We therefore advise that surface charge of NPs should be measured after exposure to a low concentration of mucins in ex-vivo and in-vitro experiments, to better simulate the in-vivo envioroment. Based on these results and published literature, we were able to propose a pathway for NP diffusion through the mucosal layer and ultimate uptake via endocytosis. The pathway consists of these stages: biocoating (primarily by mucus), absorption to the mucosal layer (extent determined by Kp), diffusion through it, and lastly GI cell uptake. We were able to create negatively charged NPs which show an increased diffusion rate post mucin coating (x21 increase in Dm) by using a low MW PLA (Mw 8 kDa). These NPs achieved over 30% uptake in the isolated loop in-vivo experiments, suggesting that low MW polysters with acid end groups possess a higher potential for oral drug delivery. Our group had previously utilized polystyrene NPs as model delivery systems due to their stability and high uptake capabilities, but these results show that low MW PLA (Mw 8 kDa) could serve as a viable bio-degradable alternative for future experiments.
Moreover, we have shown that taking mucus biocoating into account may explain various controversies in the field. Specifically, the controversies surrounding what surface charge is better for oral drug delivery; whether bioadhesion is beneficial or detrimental to oral drug delivery; and why non-in vivo oral delivery models poorly correlate with in vivo models. In terms of preferred charge, we show that both negatively and positively charged NPs could be potent oral drug delivery carriers, in addition to neutral NPs. In theory, a neutral charge seems to be preffered, however, achieving this neutral charge could be achieved via precoating (e.g., PEGylation) or with mucin biocoating of charged NPs. In addition, our theory explains the contraversies regarding in-vivo bioadhesive particle aggregation within the mucosal layer. We show that aggregation is likely to occur when charged bioadhesive particles are coated together, as is the case in most in-vivo environments - resulting in lower diffusion rates and uptake. However, we also show that individual pre-coating of said particles greatly reduces aggregation, increasing their diffusion coefficients in mucin solutions, and potentially improving their uptake efficacy. Moreover, we have shown through our calculations a possible additional advantage of bioadhesion which is an increased Kp. Lastly, we show that in vitro/ex vivo correlation to in vivo results could be greatly improved by taking biocoating into account, thus hopefully reducing the number of animals used. Based on theoretical calculations and the physiological properties of rodents, pigs, and humans, we were able to determine a suitable animal model for oral delivery. The results of these calculations show that NP diffusion through the rodents’ GI mucosal layer is similar to that of humans. Pigs are not suitable models due to their thinner GI mucosal layer and longer GI residence time, which could result in misleadingly high uptake results.
Our research found that size and surface charge play an important role in determining NP uptake via the oral route. We propose a theory of charge neutralizing mucus biocoating which helps explain some of the controversies in the field and shows how charged bioadhesive NPs can be used as viable oral drug delivery systems. Thus, we believe that this work can greatly increase the number and diversity of polymers chosen for oral drug delivery systems.
Supplementary Material
Figure 3:
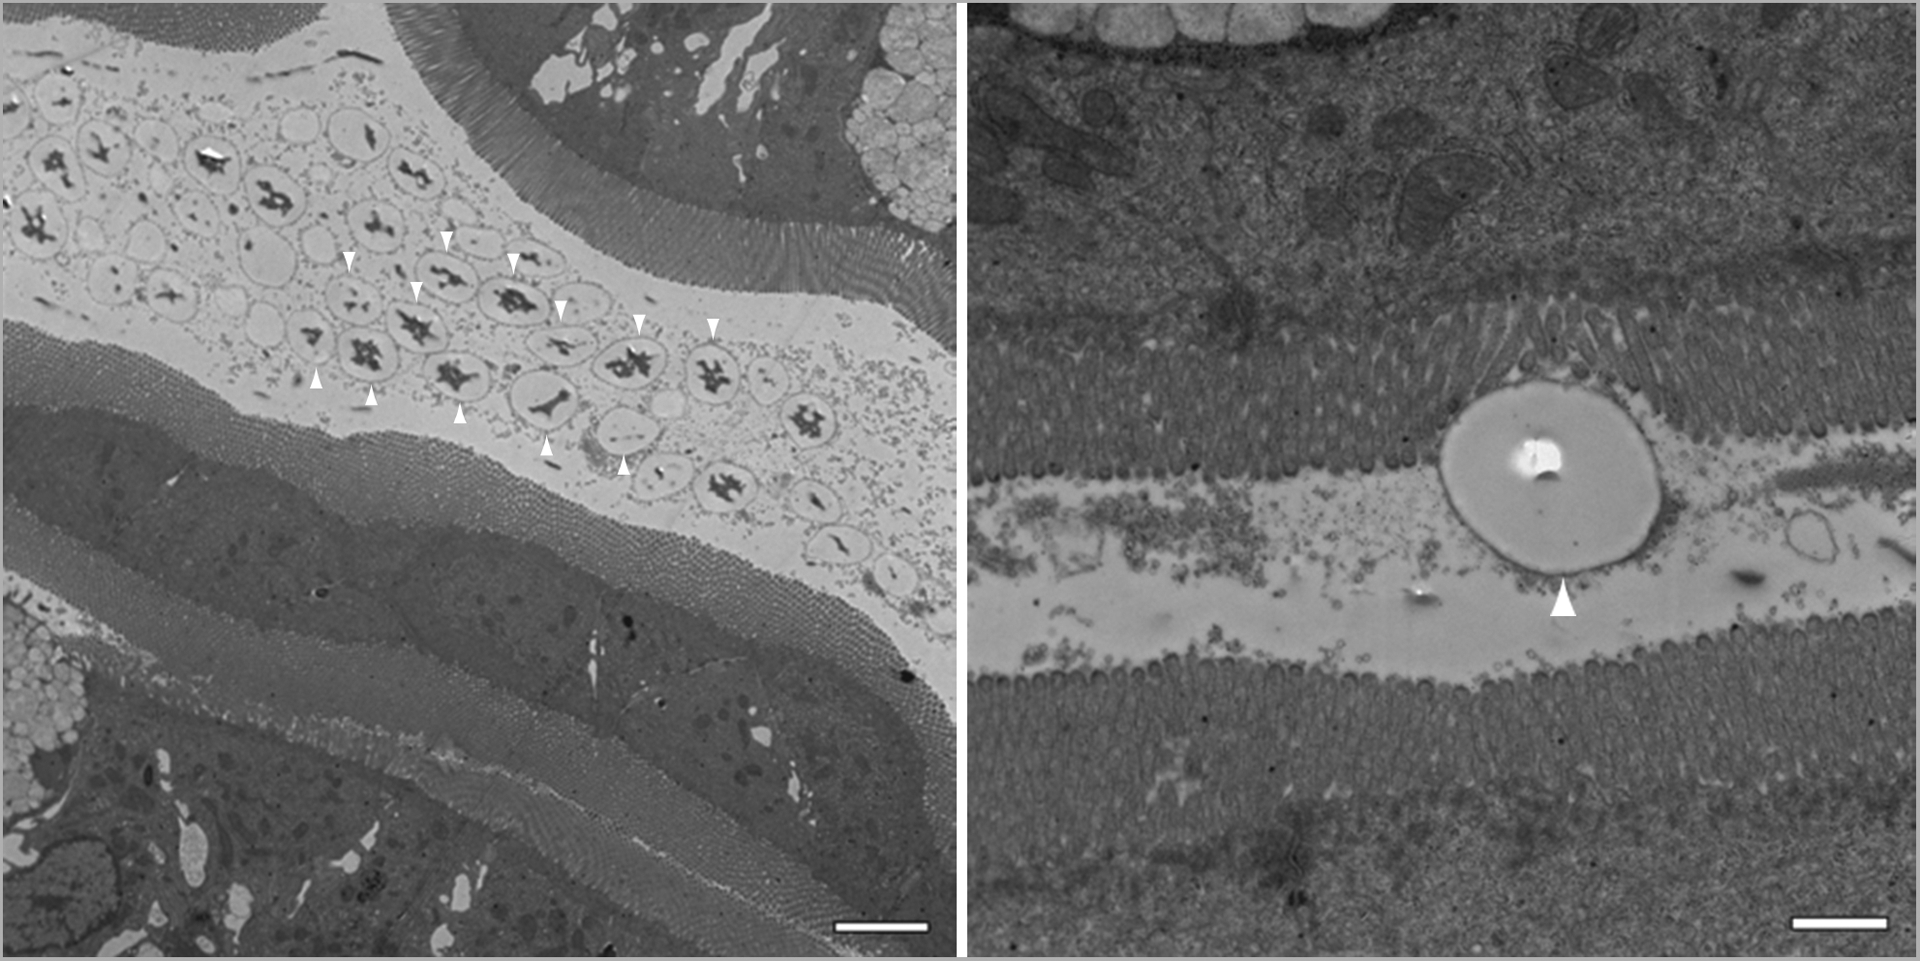
Transmission electron micrographs revealing 2000 nm polystyrene particles within the lumen five minutes after receiving a slurry of the particles. The right panel reveals a single 2 μm bead adhering to the microvilli. The magnification (from left to right) is 3,000Å~ and 12,000Å~, respectively, and the scale bars measure 4 μm and 1 μm in length, respectively. Please take note of the dark corona surrounding the beads (indicated by the white arrows) which we believe to be mucus biocoating.
Acknowledgments
We would like to acknowledge Robert Creton, Geoff Williams, and the Bioimaging Facility NIH for their support with the SEM, e.g.: The Thermo Apreo VS SEM was purchased with a high-end instrumentation grant from the Office of the Director at the National Institutes of Health (S10OD023461). In addition, we wish to acknowledge Takeda, Sanofi, RI C-AIM, and TherapyX for their partial support of this work.
Contributor Information
Edith Mathiowitz, Prof., Department of Pathology and Laboratory Medicine, Center of Biomedical Engineering, Brown University, 171 Meeting Street, Box G-B3, Providence, RI 02912,
Aharon Azagury, Noninvasive Biomimetic Drug Delivery Systems Lab, The Department of Chemical Engineering, Ariel Center for Applied Cancer Research (ACACR), Ariel University, Ramat HaGolan St 65, Ari’el.
Cameron Baptista, Department of Pathology and Laboratory Medicine, Center of Biomedical Engineering, Brown University, 171 Meeting Street, Box G-B3, Providence, RI 02912,.
Kosta Milovanovic, Department of Pathology and Laboratory Medicine, Center of Biomedical Engineering, Brown University, 171 Meeting Street, Box G-B3, Providence, RI 02912,.
Hyeseon Shin, Department of Pathology and Laboratory Medicine, Center of Biomedical Engineering, Brown University, 171 Meeting Street, Box G-B3, Providence, RI 02912,.
Peter Morello, Department of Pathology and Laboratory Medicine, Center of Biomedical Engineering, Brown University, 171 Meeting Street, Box G-B3, Providence, RI 02912,.
James Perez-Rogers, Department of Pathology and Laboratory Medicine, Center of Biomedical Engineering, Brown University, 171 Meeting Street, Box G-B3, Providence, RI 02912,.
Victoria Goldenshtein, Department of Pathology and Laboratory Medicine, Center of Biomedical Engineering, Brown University, 171 Meeting Street, Box G-B3, Providence, RI 02912,.
Travis Nguyen, Department of Pathology and Laboratory Medicine, Center of Biomedical Engineering, Brown University, 171 Meeting Street, Box G-B3, Providence, RI 02912,.
Arianna Markel, Department of Pathology and Laboratory Medicine, Center of Biomedical Engineering, Brown University, 171 Meeting Street, Box G-B3, Providence, RI 02912,.
Soham Rege, Department of Pathology and Laboratory Medicine, Center of Biomedical Engineering, Brown University, 171 Meeting Street, Box G-B3, Providence, RI 02912,.
Stephanie Hojsak, Department of Pathology and Laboratory Medicine, Center of Biomedical Engineering, Brown University, 171 Meeting Street, Box G-B3, Providence, RI 02912,.
Alexander Perl, Department of Pathology and Laboratory Medicine, Center of Biomedical Engineering, Brown University, 171 Meeting Street, Box G-B3, Providence, RI 02912,.
Carder Jones, Department of Pathology and Laboratory Medicine, Center of Biomedical Engineering, Brown University, 171 Meeting Street, Box G-B3, Providence, RI 02912,.
Megan Fife, Department of Pathology and Laboratory Medicine, Center of Biomedical Engineering, Brown University, 171 Meeting Street, Box G-B3, Providence, RI 02912,.
Stacia Furtado, Department of Pathology and Laboratory Medicine, Center of Biomedical Engineering, Brown University, 171 Meeting Street, Box G-B3, Providence, RI 02912,.
References
- [1].Sarosiek J; Slomiany A; Takagi A; Slomiany BL, Biochemical and Biophysical Research Communications 1984, 118 (2), 523–531. DOI 10.1016/0006-291X(84)91334-2. [DOI] [PubMed] [Google Scholar]
- [2].Witas H; Sarosiek J; Aono M; Murty VLN; Slomiany A; Slomiany BL, Carbohydrate Research 1983, 120, 67–76. DOI 10.1016/0008-6215(83)88007-0. [DOI] [PubMed] [Google Scholar]
- [3].Lichtenberger LM, Annual Review of Physiology 1995, 57 (1), 565–583. DOI 10.1146/annurev.ph.57.030195.003025. [DOI] [PubMed] [Google Scholar]
- [4].Käsdorf BT; Weber F; Petrou G; Srivastava V; Crouzier T; Lieleg O, Biomacromolecules 2017, 18 (8), 2454–2462. DOI 10.1021/acs.biomac.7b00605. [DOI] [PubMed] [Google Scholar]
- [5].Bansil R; Turner BS, Advanced Drug Delivery Reviews 2018, 124, 3–15. DOI 10.1016/j.addr.2017.09.023. [DOI] [PubMed] [Google Scholar]
- [6].Jung T, European Journal of Pharmaceutics and Biopharmaceutics 2000, 50 (1), 147–160. DOI 10.1016/S0939-6411(00)00084-9. [DOI] [PubMed] [Google Scholar]
- [7].Cu Y; Saltzman WM, Advanced Drug Delivery Reviews 2009, 61 (2), 101–114. DOI 10.1016/j.addr.2008.09.006. [DOI] [PMC free article] [PubMed] [Google Scholar]
- [8].Mathiowitz E; Jacob JS; Jong YS; Carino GP; Chickering DE; Chaturvedi P; Santos CA; Vijayaraghavan K; Montgomery S; Bassett M; Morrell C, Nature 1997, 386 (6623), 410–4. DOI 10.1038/386410a0. [DOI] [PubMed] [Google Scholar]
- [9].Kumari A; Yadav SK; Yadav SC, Colloids and Surfaces B: Biointerfaces 2010, 75 (1), 1–18. DOI 10.1016/j.colsurfb.2009.09.001. [DOI] [PubMed] [Google Scholar]
- [10].Panyam J; Labhasetwar V, Advanced Drug Delivery Reviews 2003, 55 (3), 329–347. DOI 10.1016/S0169-409X(02)00228-4. [DOI] [PubMed] [Google Scholar]
- [11].Plapied L; Duhem N; des Rieux A; Préat V, Current Opinion in Colloid & Interface Science 2011, 16 (3), 228–237. DOI 10.1016/j.cocis.2010.12.005. [DOI] [Google Scholar]
- [12].Reineke J; Cho DY; Dingle YL; Cheifetz P; Laulicht B; Lavin D; Furtado S; Mathiowitz E, Journal of Controlled Release 2013, 170 (3), 477–484. DOI 10.1016/j.jconrel.2013.05.043. [DOI] [PubMed] [Google Scholar]
- [13].Reineke JJ; Cho DY; Dingle YT; Morello AP 3rd; Jacob J; Thanos CG; Mathiowitz E, Proc Natl Acad Sci U S A 2013, 110 (34), 13803–8. DOI 10.1073/pnas.1305882110. [DOI] [PMC free article] [PubMed] [Google Scholar]
- [14].Amidon GL; Lennernäs H; Shah VP; Crison JR, Pharmaceutical Research 1995, 12 (3), 413–420. DOI 10.1023/A:1016212804288. [DOI] [PubMed] [Google Scholar]
- [15].LeFevre ME; Vanderhoff JW; Laissue JA; Joel DD, Experientia 1978, 34 (1), 120–122. DOI 10.1007/BF01921939. [DOI] [PubMed] [Google Scholar]
- [16].Cone RA, Advanced Drug Delivery Reviews 2009, 61 (2), 75–85. DOI 10.1016/j.addr.2008.09.008. [DOI] [PubMed] [Google Scholar]
- [17].Lai SK; O’Hanlon DE; Harrold S; Man ST; Wang Y-Y; Cone R; Hanes J, Proceedings of the National Academy of Sciences 2007, 104 (5), 1482–1487. DOI doi: 10.1073/pnas.0608611104. [DOI] [PMC free article] [PubMed] [Google Scholar]
- [18].des Rieux A; Fievez V; Garinot M; Schneider Y-J; Préat V, Journal of Controlled Release 2006, 116 (1), 1–27. DOI 10.1016/j.jconrel.2006.08.013. [DOI] [PubMed] [Google Scholar]
- [19].Ensign LM; Cone R; Hanes J, Advanced Drug Delivery Reviews 2012, 64 (6), 557–570. DOI 10.1016/j.addr.2011.12.009. [DOI] [PMC free article] [PubMed] [Google Scholar]
- [20].Yang D; Liu D; Qin M; Chen B; Song S; Dai W; Zhang H; Wang X; Wang Y; He B; Tang X; Zhang Q, ACS Applied Materials & Interfaces 2018, 10 (14), 11443–11456. DOI 10.1021/acsami.7b19153. [DOI] [PubMed] [Google Scholar]
- [21].Bhavsar MD; Tiwari SB; Amiji MM, Journal of Controlled Release 2006, 110 (2), 422–430. DOI 10.1016/j.jconrel.2005.11.001. [DOI] [PubMed] [Google Scholar]
- [22].Yu LX; Crison JR; Amidon GL, International Journal of Pharmaceutics 1996, 140 (1), 111–118. DOI 10.1016/0378-5173(96)04592-9. [DOI] [Google Scholar]
- [23].Yu LX; Lipka E; Crison JR; Amidon GL, Advanced Drug Delivery Reviews 1996, 19 (3), 359–376. DOI 10.1016/0169-409X(96)00009-9. [DOI] [PubMed] [Google Scholar]
- [24].Pillay V; Fassihi R, Journal of Controlled Release 1999, 59 (2), 229–242. DOI 10.1016/S0168-3659(98)00196-5. [DOI] [PubMed] [Google Scholar]
- [25].Minekus M; Marteau P; Havenaar R; Veld JHJH i. t., Alternatives to Laboratory Animals 1995, 23 (2), 197–209. DOI 10.1177/026119299502300205. [DOI] [Google Scholar]
- [26].Griffiths PC; Cattoz B; Ibrahim MS; Anuonye JC, European Journal of Pharmaceutics and Biopharmaceutics 2015, 97, 218–222. DOI 10.1016/j.ejpb.2015.05.004. [DOI] [PubMed] [Google Scholar]
- [27].Chen M-C; Mi F-L; Liao Z-X; Hsiao C-W; Sonaje K; Chung M-F; Hsu L-W; Sung H-W, Advanced Drug Delivery Reviews 2013, 65 (6), 865–879. DOI 10.1016/j.addr.2012.10.010. [DOI] [PubMed] [Google Scholar]
- [28].Paliwal R; Paliwal SR; Agrawal GP; Vyas SP, International Journal of Pharmaceutics 2012, 422 (1), 179–184. DOI 10.1016/j.ijpharm.2011.10.048. [DOI] [PubMed] [Google Scholar]
- [29].Lang X; Wang T; Sun M; Chen X; Liu Y, International Journal of Biological Macromolecules 2020, 154, 433–445. DOI 10.1016/j.ijbiomac.2020.03.148. [DOI] [PubMed] [Google Scholar]
- [30].Zhang K; Wang Q; Yang Q; Wei Q; Man N; Adu-Frimpong M; Toreniyazov E; Ji H; Yu J; Xu X, AAPS PharmSciTech 2019, 20 (5), 218. DOI 10.1208/s12249-019-1421-0. [DOI] [PubMed] [Google Scholar]
- [31].Huang Y-C; Lam U-I, Journal of the Chinese Chemical Society 2011, 58 (6), 779–785. DOI 10.1002/jccs.201190121. [DOI] [Google Scholar]
- [32].Carino GP; Jacob JS; Chen CJ; Santos CA; Hertzog BA; Mathiowitz E, Drugs and the pharmaceutical sciences 1999, 98, 459–476. [Google Scholar]
- [33].Thanos CG; Liu Z; Reineke J; Edwards E; Mathiowitz E, Pharm Res 2003, 20 (7), 1093–100. DOI 10.1023/a:1024474609667. [DOI] [PubMed] [Google Scholar]
- [34].Thanos CG; Liu Z; Goddard M; Reineke J; Bailey N; Cross M; Burrill R; Mathiowitz E, Journal of Pharmaceutical Sciences 2003, 92 (8), 1677–1689. DOI 10.1002/jps.10446. [DOI] [PubMed] [Google Scholar]
- [35].Chickering DE; Jacob JS; Keung A; Desai TA; Mathiowitz E, MRS Proceedings 1993, 331, 67. DOI 10.1557/PROC-331-67. [DOI] [Google Scholar]
- [36].Chickering DE; Jacob JS; Mathiowitz E, Reactive Polymers 1995, 25 (2), 189–206. DOI 10.1016/0923-1137(94)00098-P. [DOI] [Google Scholar]
- [37].Carino GP; Mathiowitz E, Advanced Drug Delivery Reviews 1999, 35 (2), 249–257. DOI 10.1016/S0169-409X(98)00075-1. [DOI] [PubMed] [Google Scholar]
- [38].Furtado S; Abramson D; Burrill R; Olivier G; Gourd C; Bubbers E; Mathiowitz E, Int J Pharm 2008, 347 (1–2), 149–55. DOI 10.1016/j.ijpharm.2007.06.039. [DOI] [PubMed] [Google Scholar]
- [39].Furtado S; Abramson D; Simhkay L; Wobbekind D; Mathiowitz E, Eur J Pharm Biopharm 2006, 63 (2), 229–36. DOI 10.1016/j.ejpb.2005.12.012. [DOI] [PubMed] [Google Scholar]
- [40].Laulicht B; Mancini A; Geman N; Cho D; Estrellas K; Furtado S; Hopson R; Tripathi A; Mathiowitz E, Macromolecular Bioscience 2012, 12 (11), 1555–1565. DOI 10.1002/mabi.201200179. [DOI] [PubMed] [Google Scholar]
- [41].Estrellas KM; Fiecas M; Azagury A; Laulicht B; Cho DY; Mancini A; Reineke J; Furtado S; Mathiowitz E, Colloids Surf B Biointerfaces 2019, 173, 454–469. DOI 10.1016/j.colsurfb.2018.10.011. [DOI] [PubMed] [Google Scholar]
- [42].Mathiowitz E; Jacob JS Methods and compositions for enhancing the bioadhesive properties of polymers. WO1997026864A2, 1997-07-31, 1997. [Google Scholar]
- [43].Mathiowitz E; Saltzman WM; Domb A; Dor P; Langer R, Journal of Applied Polymer Science 1988, 35 (3), 755–774. DOI 10.1002/app.1988.070350316. [DOI] [Google Scholar]
- [44].Baker MJ; Trevisan J; Bassan P; Bhargava R; Butler HJ; Dorling KM; Fielden PR; Fogarty SW; Fullwood NJ; Heys KA; Hughes C; Lasch P; Martin-Hirsch PL; Obinaju B; Sockalingum GD; Sulé-Suso J; Strong RJ; Walsh MJ; Wood BR; Gardner P; Martin FL, Nature Protocols 2014, 9 (8), 1771–1791. DOI 10.1038/nprot.2014.110. [DOI] [PMC free article] [PubMed] [Google Scholar]
- [45].Gajjar K; Trevisan J; Owens G; Keating PJ; Wood NJ; Stringfellow HF; Martin-Hirsch PL; Martin FL, The Analyst 2013, 138 (14), 3917. DOI 10.1039/c3an36654e. [DOI] [PubMed] [Google Scholar]
- [46].Sbalzarini IF; Koumoutsakos P, Journal of Structural Biology 2005, 151 (2), 182–195. DOI 10.1016/j.jsb.2005.06.002. [DOI] [PubMed] [Google Scholar]
- [47].Swinehart DF, Journal of Chemical Education 1962, 39 (7), 333. DOI 10.1021/ed039p333. [DOI] [Google Scholar]
- [48].Azagury A; Amar-Lewis E; Mann E; Goldbart R; Traitel T; Jelinek R; Hallak M; Kost J, Journal of Controlled Release 2014, 183, 105–113. DOI 10.1016/j.jconrel.2014.03.040. [DOI] [PubMed] [Google Scholar]
- [49].Moser K, European Journal of Pharmaceutics and Biopharmaceutics 2001, 52 (2), 103–112. DOI 10.1016/S0939-6411(01)00166-7. [DOI] [PubMed] [Google Scholar]
- [50].Rohman A; Sunarminin R; Man YBC, American Journal of Food Technology 2012, 7 (3), 151–159. DOI 10.3923/ajft.2012.151.159. [DOI] [Google Scholar]
- [51].Doolaanea AA; Harun Ismail AF; Mohamed F, International Journal of Pharmacy and Pharmaceutical Sciences 2014, 6, 228–232. [Google Scholar]
- [52].Atuma C; Strugala V; Allen A; Holm L, American Journal of Physiology-Gastrointestinal and Liver Physiology 2001, 280 (5), G922–G929. DOI 10.1152/ajpgi.2001.280.5.G922. [DOI] [PubMed] [Google Scholar]
- [53].Johansson MEV; Larsson JMH; Hansson GC, Proceedings of the National Academy of Sciences 2011, 108 (supplement_1), 4659–4665. DOI 10.1073/pnas.1006451107. [DOI] [Google Scholar]
- [54].Azagury A; Khoury L; Enden G; Kost J, Advanced Drug Delivery Reviews 2014, 72, 127–143. DOI 10.1016/j.addr.2014.01.007. [DOI] [PubMed] [Google Scholar]
- [55].Khoo X; Simons EJ; Chiang HH; Hickey JM; Sabharwal V; Pelton SI; Rosowski JJ; Langer R; Kohane DS, Biomaterials 2013, 34 (4), 1281–1288. DOI 10.1016/j.biomaterials.2012.10.025. [DOI] [PMC free article] [PubMed] [Google Scholar]
- [56].Galey WR; Lonsdale HK; Nacht S, Journal of Investigative Dermatology 1976, 67 (6), 713–717. DOI 10.1111/1523-1747.ep12598596. [DOI] [PubMed] [Google Scholar]
- [57].Azagury A; Khoury L; Adato Y; Wolloch L; Ariel I; Hallak M; Kost J, Journal of Controlled Release 2015, 200, 35–41. DOI 10.1016/j.jconrel.2014.12.025. [DOI] [PubMed] [Google Scholar]
- [58].Arora P; Sharma S; Garg S, Drug Discovery Today 2002, 7 (18), 967–975. DOI 10.1016/S1359-6446(02)02452-2. [DOI] [PubMed] [Google Scholar]
- [59].Maisel K; Ensign L; Reddy M; Cone R; Hanes J, Journal of Controlled Release 2015, 197, 48–57. DOI 10.1016/j.jconrel.2014.10.026. [DOI] [PMC free article] [PubMed] [Google Scholar]
- [60].Eldridge JH; Hammond CJ; Meulbroek JA; Staas JK; Gilley RM; Tice TR, Journal of Controlled Release 1990, 11 (1), 205–214. DOI 10.1016/0168-3659(90)90133-E. [DOI] [Google Scholar]
- [61].Shakweh M; Besnard M; Nicolas V; Fattal E, European Journal of Pharmaceutics and Biopharmaceutics 2005, 61 (1–2), 1–13. DOI 10.1016/j.ejpb.2005.04.006. [DOI] [PubMed] [Google Scholar]
- [62].Jani P; Halbert GW; Langridge J; Florence AT, J Pharm Pharmacol 1989, 41 (12), 809–12. DOI 10.1111/j.2042-7158.1989.tb06377.x. [DOI] [PubMed] [Google Scholar]
- [63].Israelachvili JN, Historical Perspective. In Intermolecular and Surface Forces, Elsevier: 2011; pp 3–22. [Google Scholar]
- [64].Sotres J; Jankovskaja S; Wannerberger K; Arnebrant T, Scientific Reports 2017, 7 (1), 7270. DOI 10.1038/s41598-017-07552-7. [DOI] [PMC free article] [PubMed] [Google Scholar]
- [65].Thanos CG; Yip K-P; Mathiowitz E, Journal of Bioactive and Compatible Polymers 2004, 19 (4), 247–266. DOI 10.1177/0883911504045275. [DOI] [Google Scholar]
- [66].Kas HS, Journal of Microencapsulation 1997, 14 (6), 689–711. DOI 10.3109/02652049709006820. [DOI] [PubMed] [Google Scholar]
- [67].Norris DA; Sinko PJ, Journal of Applied Polymer Science 1997, 63 (11), 1481–1492. DOI . [DOI] [Google Scholar]
- [68].Pekarek KJ; Jacob JS; Mathiowitz E, Nature 1994, 367 (6460), 258–260. DOI 10.1038/367258a0. [DOI] [PubMed] [Google Scholar]
- [69].Bannunah AM; Vllasaliu D; Lord J; Stolnik S, Molecular Pharmaceutics 2014, 11 (12), 4363–4373. DOI 10.1021/mp500439c. [DOI] [PubMed] [Google Scholar]
- [70].Lee C-H; Lo L-W; Mou C-Y; Yang C-S, Advanced Functional Materials 2008, 18 (20), 3283–3292. DOI 10.1002/adfm.200800521. [DOI] [Google Scholar]
- [71].Abdulkarim M; Agulló N; Cattoz B; Griffiths P; Bernkop-Schnürch A; Borros SG; Gumbleton M, European Journal of Pharmaceutics and Biopharmaceutics 2015, 97, 230–238. DOI 10.1016/j.ejpb.2015.01.023. [DOI] [PubMed] [Google Scholar]
- [72].Li LD; Crouzier T; Sarkar A; Dunphy L; Han J; Ribbeck K, Biophys J 2013, 105 (6), 1357–65. DOI 10.1016/j.bpj.2013.07.050. [DOI] [PMC free article] [PubMed] [Google Scholar]
- [73].Santos CA; Freedman BD; Leach KJ; Press DL; Scarpulla M; Mathiowitz E, Journal of Controlled Release 1999, 60 (1), 11–22. DOI 10.1016/S0168-3659(99)00016-4. [DOI] [PubMed] [Google Scholar]
- [74].Lieleg O; Vladescu I; Ribbeck K, Biophysical Journal 2010, 98 (9), 1782–1789. DOI 10.1016/j.bpj.2010.01.012. [DOI] [PMC free article] [PubMed] [Google Scholar]
- [75].Barbero N; Coletti M; Catalano F; Visentin S, International Journal of Pharmaceutics 2018, 535 (1), 438–443. DOI 10.1016/j.ijpharm.2017.11.026. [DOI] [PubMed] [Google Scholar]
- [76].Thornton DJ; Gray T; Nettesheim P; Howard M; Koo JS; Sheehan JK, American Journal of Physiology-Lung Cellular and Molecular Physiology 2000, 278 (6), L1118–L1128. DOI 10.1152/ajplung.2000.278.6.L1118. [DOI] [PubMed] [Google Scholar]
- [77].Ohar JA; Donohue JF; Spangenthal S, Chronic Obstr Pulm Dis 2019, 6 (4), 341–9. DOI 10.15326/jcopdf.6.4.2019.0139. [DOI] [PMC free article] [PubMed] [Google Scholar]
- [78].Chickering DE; Jacob JS; Desai TA; Harrison M; Harris WP; Morrell CN; Chaturvedi P; Mathiowitz E, Journal of Controlled Release 1997, 48 (1), 35–46. DOI 10.1016/S0168-3659(97)00054-0. [DOI] [Google Scholar]
- [79].Lamson NG; Berger A; Fein KC; Whitehead KA, Nature Biomedical Engineering 2020, 4 (1), 84–96. DOI 10.1038/s41551-019-0465-5. [DOI] [PMC free article] [PubMed] [Google Scholar]
- [80].Pinnaratip R; Meng H; Rajachar RM; Lee BP, Biomed Mater 2018, 13 (2), 025003. DOI 10.1088/1748-605X/aa985d. [DOI] [PMC free article] [PubMed] [Google Scholar]
- [81].Maisel K; Reddy M; Xu Q; Chattopadhyay S; Cone R; Ensign LM; Hanes J, Nanomedicine 2016, 11 (11), 1337–1343. DOI 10.2217/nnm-2016-0047. [DOI] [PMC free article] [PubMed] [Google Scholar]
- [82].Pereira de Sousa I; Moser T; Steiner C; Fichtl B; Bernkop-Schnürch A, International Journal of Pharmaceutics 2016, 500 (1–2), 236–244. DOI 10.1016/j.ijpharm.2016.01.022. [DOI] [PubMed] [Google Scholar]
- [83].Liu M; Zhang J; Zhu X; Shan W; Li L; Zhong J; Zhang Z; Huang Y, Journal of Controlled Release 2016, 222, 67–77. DOI 10.1016/j.jconrel.2015.12.008. [DOI] [PubMed] [Google Scholar]
- [84].Verma A; Sharma S; Gupta PK; Singh A; Teja BV; Dwivedi P; Gupta GK; Trivedi R; Mishra PR, Acta Biomaterialia 2016, 31, 288–300. DOI 10.1016/j.actbio.2015.12.017. [DOI] [PubMed] [Google Scholar]
- [85].Tuleu C; Andrieux C; Boy P; Chaumeil JC, International Journal of Pharmaceutics 1999, 180 (1), 123–131. DOI 10.1016/S0378-5173(98)00400-1. [DOI] [PubMed] [Google Scholar]
- [86].Yuen K-H, International Journal of Pharmaceutics 2010, 395 (1–2), 9–16. DOI 10.1016/j.ijpharm.2010.04.045. [DOI] [PubMed] [Google Scholar]
- [87].Trbojević-Stanković JB; Milićević NM; Milosević DP; Despotović N; Davidović M; Erceg P; Bojić B; Bojić D; Svorcan P; Protić M; Dapcević B; Miljković MD; Milićević Z, Histol Histopathol 2010, 25 (2), 153–8. DOI 10.14670/hh-25.153. [DOI] [PubMed] [Google Scholar]
- [88].Varum FJO; Veiga F; Sousa JS; Basit AW, European Journal of Pharmaceutical Sciences 2010, 40 (4), 335–341. DOI 10.1016/j.ejps.2010.04.007. [DOI] [PubMed] [Google Scholar]
- [89].Hossain M; Abramowitz W; Watrous BJ; Szpunar GJ; Ayres JW, Pharmaceutical Research 1990, 07 (11), 1163–1166. DOI 10.1023/A:1015936426906. [DOI] [PubMed] [Google Scholar]
- [90].Davis SS; Illum L; Hinchcliffe M, Journal of Pharmacy and Pharmacology 2010, 53 (1), 33–39. DOI 10.1211/0022357011775163. [DOI] [PubMed] [Google Scholar]
- [91].Kararli TT, Biopharmaceutics & Drug Disposition 1995, 16 (5), 351–380. DOI 10.1002/bdd.2510160502. [DOI] [PubMed] [Google Scholar]
- [92].Yin Win K; Feng S-S, Biomaterials 2005, 26 (15), 2713–2722. DOI 10.1016/j.biomaterials.2004.07.050. [DOI] [PubMed] [Google Scholar]
- [93].Anselmo AC; Mitragotri S, Advanced Drug Delivery Reviews 2017, 108, 51–67. DOI 10.1016/j.addr.2016.01.007. [DOI] [PubMed] [Google Scholar]
- [94].Guo D; Li J; Xie G; Wang Y; Luo J, Langmuir 2014, 30 (24), 7206–7212. DOI 10.1021/la501485e. [DOI] [PubMed] [Google Scholar]
Associated Data
This section collects any data citations, data availability statements, or supplementary materials included in this article.