

Abstract
In China, bovines are believed to be the most common animal source of human schistosomiasis infections, though little is known about what factors promote bovine infections. The current body of literature features inconsistent, and sometimes contradictory results, and to date, few studies have looked beyond physical characteristics to identify the broader environmental conditions that predict bovine schistosomiasis. Because schistosomiasis is a sanitation-related, water-borne disease transmitted by many animals, we hypothesized that several environmental factors – such as the lack of improved sanitation systems, or participation in agricultural production that is water-intensive – could promote schistosomiasis infection in bovines. Using data collected as part of a repeat cross-sectional study conducted in rural villages in Sichuan, China from 2007 to 2016, we used a Random Forests, machine learning approach to identify the best physical and environmental predictors of bovine Schistosoma japonicum infection. Candidate predictors included: (i) physical/biological characteristics of bovines, (ii) human sources of environmental schistosomes, (iii) socio-economic indicators, (iv) animal reservoirs, and (v) agricultural practices. The density of bovines in a village and agricultural practices such as the area of rice and dry summer crops planted, and the use of night soil as an agricultural fertilizer, were among the top predictors of bovine S. japonicum infection in all collection years. Additionally, human infection prevalence, pig ownership and bovine age were found to be strong predictors of bovine infection in at least 1 year. Our findings highlight that presumptively treating bovines in villages with high bovine density or human infection prevalence may help to interrupt transmission. Furthermore, village-level predictors were stronger predictors of bovine infection than household-level predictors, suggesting future investigations may need to apply a broad ecological lens to identify potential underlying sources of persistent transmission.
Keywords: Schistosomiasis, Buffalo, Cattle, Machine learning, Prevention and control, China
Graphical Abstract
1. Introduction
Bovines have long been recognized as a key contributor to human schistosomiasis in Asia (Guo et al., 2006; Gray et al., 2007), and emerging evidence suggests they may be contributing to human schistosomiasis in Africa (Colley and Loker, 2018). Schistosomiasis is among the most burdensome helminth infections worldwide, with transmission being reported in a total of 78 countries in 2018 and approximately 230 million people in need of preventative treatment (World Health Organization, https://www.who.int/news-room/fact-sheets/detail/schistosomiasis, Accessed August 20th, 2020). Although great strides have been made in the last few decades in global schistosomiasis control (World Health Organization, https://www.who.int/news-room/fact-sheets/detail/schistosomiasis, Accessed August 20th, 2020), the documentation of reemergent or persistent transmission in some areas highlights the need for careful consideration of possible local drivers of transmission, including bovines (Song et al., 2016; Kittur et al., 2019). The potential importance of bovines is not limited to Schistosoma japonicum in Asia. Bovines can serve as reservoirs for schistosomes that hybridize with the classically human schistosomes, Schistosoma haematobium and Schistosoma mansoni, leading to hybrid infections in humans (Leger and Webster, 2017; Catalano et al., 2018).
In the case of S. japonicum in China, despite well-established control programs and considerable progress towards elimination since the mid-1950s (Xu et al., 2016), a national report highlighted that there remained 450 endemic counties in 2020, a quarter of which had not achieved elimination criteria by year’s end (Zhang et al., 2021). Schistosoma japonicum is transmitted by at least 40 species of wild and domestic mammals (Gray et al., 2009b), and animal activities near likely transmission sites may be important sources of reemergence and persistence. Although there are several domesticated and wild animals that can carry and transmit S. japonicum, (Li et al., 2015; Van Dorssen et al., 2017), estimates from Eastern China suggest that bovines may be responsible for as much as 75% of human transmission (Guo et al., 2006). This substantial contribution is thought to be related to the high degree of environmental overlap between humans and bovines during agricultural production, as well as the large amount of fecal output of bovines, which is estimated to be as high as 100 times that of human fecal production each day (He et al., 2001; Ross et al., 2001; Gray et al., 2009b). Additionally, the high frequency of livestock movement via the livestock trade within mountainous regions of China may facilitate the spread of S. japonicum infections across the region (Zheng et al., 2000; Zhou et al., 2012).
Bovine parasitic flatworm infections also have important veterinary impacts. The consequences of Schistosoma bovis– as well as other parasitic flatworms such as those from the Paramphistomum genus – can be quite severe on the animal, including: mortality, extreme morbidity and organ damage, emaciation, reduced milk yields and other production issues, and greater susceptibility to other pathogens (McCauley et al., 1983; Al-Gaabary et al., 2009; Alemneh et al., 2015).
Despite strong evidence that bovines are an important driver of human S. japonicum infection in Asia (Guo et al., 2006; Gray et al., 2007; Rudge et al., 2013; Colley and Loker, 2018), and that hybrid schistosomes may perpetuate human schistosomiasis in areas of Africa (Leger and Webster, 2017; Catalano et al., 2018), there are major gaps in our understanding of the factors that contribute to bovine Schistosoma infection. Most studies assessing bovine infection risks have focused primarily on veterinary schistosome species, the results of which have been inconsistent. For example, several recent assessments of S. bovis infection risk in eastern Africa assessed sex, age, breed and body condition as predictors of cattle infection status with contradictory results (Chanie et al., 2012; Lulie and Guadu, 2014; Tsega and Derso, 2015; Gebremeskel et al., 2017; Defersha and Belete, 2018; Kebede et al., 2018; Yihunie et al., 2019). Whereas assessments from 2012 and 2017 in northwestern Ethiopia found that neither age, sex nor the bovine’s body condition was associated with bovine schistosomiasis infection (Chanie et al., 2012; Gebremeskel et al., 2017), a 2018 assessment found no significant effect of sex or breed, but suggested that bovines with poor body condition and bovines aged 2–5 years had the highest infection risk (Defersha and Belete, 2018). By contrast, a 2019 study from northwestern Ethiopia recently highlighted that female sex, breed and poor body condition were all associated with bovine infection, while age was not found to be associated (Yihunie et al., 2019). Reasons for such discrepancies have not been fully elucidated, although Defersha and Belete (2018) hypothesize that it may be related to variations in management practices for different bovine groups (e.g. separation of sexes or of age groups) and different grazing ranges and patterns allowed on different farms (e.g. smaller grazing area of very young and very old bovines) (Defersha and Belete, 2018).
Outside of eastern Africa, few studies have characterized predictors of bovine schistosomiasis infection. One study from Malaysia found that older age, low weight and male sex, were all risk factors for Schistosoma spindale infection in a range of different cattle species (Tan et al., 2015). By comparison, a study conducted primarily among water buffaloes (96.2% water buffalos, 3.8% cattle) in southern China found that S. japonicum infection intensity was highest in young bovines (<2 years) (Gray et al., 2007). These seemingly contradictory results may potentially be explained by isolation and limited grazing for calves in Malaysia (Tan et al., 2015), as well as potential genus-related differences in acquired immunity and self-cure rates between cattle and water buffalo (Li et al., 2014), as studies assessing worm establishment success in the two genera have found that cattle are more susceptible to infection than water buffalo (He et al., 1992; Xu et al., 1993). Nevertheless, water buffaloes may still act as important hosts in marshland areas of China, as they are more likely to spend time in water, and therefore more likely to be involved in the S. japonicum transmission cycle (He et al., 2001).
Not only is there a great deal of disagreement in the current body of literature over the key risk factors for bovine schistosomiasis infection, but studies to date have almost exclusively focused on physical characteristics rather than broader environmental conditions. There is a considerable literature that documents the role of social and environmental conditions in human schistosomiasis. For example, water, sanitation and hygiene (WASH) infrastructure, agriculture and fishing production, irrigation and night soil use – that is, the collection of either treated or untreated human and/or animal waste for use as fertilizer – have all been implicated as significant risk factors for human Schistosoma infection (Southgate, 1997; Carlton et al., 2015; Grimes et al., 2015; Zhou et al., 2018). While it is plausible that many of these factors pose similar risks to bovines, this has not yet been tested. Given that bovine parasitic flatworm infections are known to lead to significant morbidity and economic losses, and contribute substantially to human infection risk (McCauley et al., 1983; Al-Gaabary et al., 2009; Alemneh et al., 2015), studies aimed at assessing potential predictors of S. japonicum infection in bovines are of paramount importance.
To address this gap, we set out to assess a range of potential physical and environmental predictors of bovine S. japonicum infection in 2007, 2010 and 2016 at the individual, household and village levels in a region where schistosomiasis persistence has been demonstrated to exist in both human and bovine populations. We draw from the literature on human and bovine schistosomiasis to define a broad set of candidate predictors that describe individual bovine characteristics. In so doing, our study helps to fill the gaps in knowledge about the conditions that predict S. japonicum infection in bovines, as well as the relevance of two additional assessment scales (household- and village-level) that have rarely been considered in the studies conducted to date. The results of this study will ultimately serve as a critical stepping stone towards developing appropriately scaled and targeted schistosomiasis intervention and control activities.
2. Materials and methods
2.1. Village selection
This study was conducted in two rural counties in Sichuan, China where schistosomiasis has reemerged and persisted despite aggressive control efforts. Surveys of environmental and social risk factors, as well as human and bovine infection, were conducted in 2007, 2010 and 2016. In 2007, three of eight Sichuan counties where schistosomiasis had reemerged (Liang et al., 2006), were selected for inclusion in our study based on surveillance record availability and the local control stations’ willingness and capacity to collaborate, and a set of 17 to 19 villages was selected in each county, as described previously (Carlton et al., 2011). However, in May 2008, a 7.9 magnitude earthquake severely impacted one of the study counties (Carlton et al., 2015), such that, in 2010, follow-up surveys were conducted in two counties (36 villages). In an effort to hone in on the highest risk locations within the two study counties in a region where infections were declining, surveillance records were reexamined in 2016, from which a total of 10 villages was selected for inclusion in the 2016 data collection. Of these, seven were villages that were also included in 2007 and 2010, while three were new. We restrict this analysis to the two counties surveyed in all 3 years, noting that our villages were not selected with the intention of creating a representative sample of Sichuan, nor were the infection surveys intended to characterize infection prevalence in the absence of intervention and control efforts. Rather, this study was designed to be a survey of high-risk locations where schistosomiasis has persisted in spite of aggressive and ongoing local control and intervention efforts. All villages are located in the hilly regions of rural Sichuan and ranged from approximately 20 to 150 households and 50 to 200 residents. Finally, the analysis presented here was restricted to villages where bovines were both present and tested for S. japonicum infection: 35 villages in 2007, 30 villages in 2010 and eight villages in 2016. Details about the total number of included villages, households and bovines are provided in Supplementary Table S1.
2.2. Census, household questionnaires and infection surveys
A village census was conducted in each collection year and all residents over the age of 5 years were invited to participate in surveys for S. japonicum infection. In addition, attempts were made to survey all bovines in the village for S. japonicum infection. In the summers of 2007, 2010 and 2016, the head of each household was asked to complete a household survey that contained close-ended questions related to socioeconomic status, domestic and farm animal ownership, sanitation and water access, and agricultural practices. Information on bovine age, type and sex were collected at the time of the bovine infection surveys in 2007 and 2010 (these data were not collected in 2016). Trained staff from the Sichuan Center for Disease Control and Prevention and the county Schistosomiasis Control Stations piloted and conducted all surveys in the local Sichuan dialect. Only bovines that had both household survey data and S. japonicum infection data were included in this assessment (Supplementary Table S1).
Schistosoma japonicum infection surveys were conducted by attempting to test three stool samples on three consecutive days from eligible humans and all bovines using the miracidium hatching test. In addition, one stool sample per human was tested using the Kato-Katz thick smear procedure in 2007 and 2010. Infection surveys were conducted in November and December of 2007 and 2010, and July 2016. Bovines were isolated in a pen or tied up until a stool was produced on three separate days (consecutive, when possible). All stool samples were transported to the central laboratory soon after collection to be examined using the miracidium hatching test, following standard protocols (Department of Disease Control, 2000). To account for the short survival and rapid hatching of bovine miracidia, the bovine samples were examined for miracidia at one, three and 5 h after preparation for at least 2 min each time, whereas human samples were assessed at two, five and 8 h after preparation. One sample from each human was also examined using the Kato-Katz thick smear procedure in 2007 and 2010, using three slides per sample, and 41.7 mg of Kato-Katz template (Katz et al., 1972). A bovine was considered positive for S. japonicum if any miracidium hatching test was positive. A human was considered positive for S. japonicum if any miracidium hatching test or the Kato-Katz test was positive. Each person who tested positive was notified and referred to the local anti-schistosomiasis control station for treatment. When bovines tested positive, owners were notified and the animal was referred to the county veterinary station for treatment.
2.3. Ethics statement
This study was approved by the Sichuan Institutional Review Board (China), the University of California, Berkeley (USA), Committee for the Protection of Human Subjects, and the Colorado Multiple Institutional Review Board (USA). All participants provided written, informed consent. The collection of bovine samples was determined to be exempt from review by the Animal Care and Use Committee at the University of California, Berkeley and the Institutional Animal Care and Use Committee at the University of Colorado Anschutz (USA).
2.4. Predictor selection and definitions
The primary outcome of interest in this analysis was bovine S. japonicum infection in 2007, 2010 and 2016. All candidate predictors were defined using either the household surveys or the human infection surveys and were divided into five categories: (1) biological/physical characteristics; (2) potential human sources of environmental schistosomes; (3) socio-economic indicators; (4) potential animal reservoirs/sources of infection; (5) agricultural risk factors (Table 1). We included agriculture as its own category because bovines are frequently employed in agricultural work in China (Zheng et al., 2000), and because different crop types and agricultural practices have their own inherent exposure risks (e.g. planting wet crops such as rice may increase the likelihood of contact with snail habitat and exposure to cercariae (Gordon et al., 2019)). Variables with hypothesized similar mechanisms of transmission risk were aggregated where possible. Three crop type categories were created: winter crops (primarily rapeseed and wheat), summer dry crops (primarily corn, peanuts and vegetables) and summer wet crops (rice). Night soil use was also included as an agricultural risk factor and divided into three categories: night soil use on winter crops, dry summer crops and wet summer crops.
Table 1.
Summary of predictor variables included in the analysis.
| Predictor list | Predictor categorya | Scale of analysis | Years available | Variable type |
|---|---|---|---|---|
| Bovine type (water buffalo vs. cow) | Physical/biological | Individual | 2007, 2010 | Binary |
| Bovine sex | Physical/biological | Individual | 2007, 2010 | Binary |
| Bovine age | Physical/biological | Individual | 2007, 2010 | Continuous |
| Number of hatch testsb | Physical/biological | Individual | All | Discrete |
| County of residence | Physical/biological | Household | All | Binary |
| Prevalence of human infection in village | Potential human sources | Village | All | Continuous |
| Number of infected human household members | Potential human sources | Household | All | Discrete |
| Percent of households with improved sanitation | Socio-economic indicators | Village | All | Continuous |
| Household has improved sanitation (y/n)c | Socio-economic indicators | Household | All | Binary |
| Village mean asset score (0–9) | Socio-economic indicators | Village | All | Continuous |
| Household asset score (0–9) | Socio-economic indicators | Household | All | Discrete |
| Percent of households that own cats | Animal reservoirs/sources | Village | All | Continuous |
| Household cat ownership | Animal reservoirs/sources | Household | All | Binary |
| Percent of households that own dogs | Animal reservoirs/sources | Village | All | Continuous |
| Household dog ownership | Animal reservoirs/sources | Household | 2007, 2010 | Binary |
| Mean number of pigs per household | Animal reservoirs/sources | Village | 2010, 2016 | Continuous |
| Household pig ownership | Animal reservoirs/sources | Household | 2010 | Discrete |
| Mean number of bovines per household | Animal reservoirs/sources | Village | All | Continuous |
| Household owns other bovines | Animal reservoirs/sources | Household | All | Discrete |
| Mean area of rice planted per household | Agricultural risk factors | Village | All | Continuous |
| Area of rice planted by household | Agricultural risk factors | Household | All | Continuous |
| Mean area of dry summer crop planted per household | Agricultural risk factors | Village | All | Continuous |
| Area of dry summer crop planted by household | Agricultural risk factors | Household | All | Continuous |
| Mean area of winter crop planted per household | Agricultural risk factors | Village | All | Continuous |
| Area of winter crop planted by household | Agricultural risk factors | Household | All | Continuous |
| Mean number of buckets of night soil used on rice crops | Agricultural risk factors | Village | All | Continuous |
| Number of buckets of night soil used on rice crops | Agricultural risk factors | Household | All | Discrete |
| Mean number of buckets of night soil used on dry summer crops | Agricultural risk factors | Village | All | Continuous |
| Number of buckets of night soil used on dry summer crops | Agricultural risk factors | Household | All | Discrete |
| Mean number of buckets of night soil used on winter crops | Agricultural risk factors | Village | All | Continuous |
| Number of buckets of night soil used on winter crops | Agricultural risk factors | Household | All | Discrete |
Predictors were grouped into five categories relevant to bovine Schistosoma japonicum infection risk probability: i) physical/biological characteristics (e.g. old-age); ii) potential human sources of environmental schistosomes (e.g. human S. japonicum infection prevalence in the bovine’s household); iii) socio-economic indicators (e.g. prevalence of improved sanitation systems in the surround village); iv) potential animal reservoirs/sources of infections (e.g. prevalence of dog ownership in the surrounding village); v) agricultural risk factors (e.g. a household’s total rice crop area).
Because not all bovines produced three stool samples, and examination of a greater number of stool samples can increase the probability of detecting infection, the number of hatch tests used on a given bovine was also included as a predictor.
Improved sanitation was defined as access to an improved toilet in the household, including a biogas digester or a three-compartment toilet.
There were minor variations in the household survey content and question formulation across the study period (e.g., pig ownership was not assessed in 2007). Where possible, continuous/discrete predictors were included over binary measures. We excluded binary variables from the analysis if they represented very rare (<10%) or very common conditions (>90%). Continuous variables were excluded when >90% of the observations took a single value. For example, household dog and pig ownership were both excluded in 2016 because >90% of the households owned dogs while >90% did not own any pigs. A composite household asset score (0–9) was developed for use in this assessment, which included eight household assets assessed in all three collection years (washing machine, television, air conditioner, refrigerator, computer, car, motorcycle), as well as a binary measure indicating that the home was constructed of concrete, wood or bricks (versus adobe).
Because prior work has demonstrated that group-level measures can serve as important predictors of schistosomiasis infection in humans (Carlton et al., 2015), we also generated village-level predictors from the household survey data. Village-level variables represent all households that participated in the household survey from a given village, even if they didn’t own bovines. Village-level variables were either the village-average value of continuous household measures, or for binary variables, the proportion of the village population reporting the condition. Notably, the village-level variables excluded all observations from the bovine’s own household, and instead used only the data from the other households in the village that participated in the household survey. This allowed for an assessment of how the surrounding village environment impacts individual bovine infection risk, independent of the home environment, whereas the household-level variables aim to unpack the influence of the unique household environment on bovine infection status. The aforementioned criteria led to a total of 31 predictors.
2.5. Analysis
Among the bovines with S. japonicum infection data (i.e. the outcome variable), those that lacked all household survey data (i.e. the predictor variables) were excluded from the analysis (30/503 bovines in 2007; 36/233 bovines in 2010; and 1/72 in 2016). Infection prevalence was similar among the excluded bovines (11/67, 16.4%) compared with those included in this analysis (111/741, 15.0%). Missing data were low for included bovines: the variable with the most missing data was bovine sex in 2007 (21.6% missing). Missing values were imputed separately for each collection year using the rfImpute function from the “randomForest” package in R.
Two preliminary descriptive analyses were carried out. First, spatial patterns of bovine infection prevalence by village were visualized using the (Environmental Systems Research Institute (ESRI) ArcGIS ArcMap software release 10.5.1 (ESRI, 2017 ArcGIS Desktop Release, 10.5.1 ed, Redlands, CA, USA).. Second, categorical versions of the candidate predictors were generated in order to evaluate changes in the distribution of predictors over time as well as to allow a qualitative examination of the distribution of predictors by bovine infection status.
To determine which of our candidate predictors serve as the best predictors of bovine schistosomiasis infection in 2007, 2010 and 2016, a random forests (RF) machine learning approach was used. For each year, 25% of the data was reserved for validation, while the remaining 75% was used for model construction. To address class imbalance in our outcome of interest (13.3%, 17.3%, and 19.7% of bovines were S. japonicum-positive in 2007, 2010 and 2016, respectively), over-sampling of the minority class was conducted. For model tuning, 10-fold cross validation was performed using the Caret package in R to help select the optimal maximum node size and the number of variables to try at each branch. Once the optimal value of each of these parameters was determined, a final model was run using 5000 trees per forest (Breiman and Cutler, 2011).
For each collection year, we conducted a total of 10 rebalancing and model tuning iterations to assess the degree of stability in our variable importance rankings. The mean decrease in accuracy (MDA) value was used to rank the top 10 predictors from each model on a scale of 10 to 1 – from most to least important – such that the predictor with the highest MDA was assigned a score of 10, and predictors not in the top 10 were assigned a score of 0. These variable rankings were then summed across the 10 rebalancing iterations to give a 10 model summary score of variable importance, ranging from 100–1. The 10 highest scoring variables from the 10 model summary score were then reassigned a final ranking of first to tenth. Next, we created a “lean” ranking, using only those predictors ranked first through tenth within each collection year. To do this, we performed an additional 10 iterations of the aforementioned balancing and tuning process with the top 10 predictors, thereby reducing excess noise in the variable ranking assessment caused by including a large number of candidate predictors. Because we hypothesized that the inclusion of human infection as a predictor of bovine infection would strongly influence the predictive capacity of our RF models due to a presumed association between bovine and human infection, we also conducted 10 iterations of a sensitivity analysis for each collection year that excluded the human infection variables from the algorithm. The ability of the full, lean and sensitivity RF models to predict infection status was assessed using accuracy, sensitivity and the receiver operator curve (ROC) area under the curve (AUC), respectively. In the case of disagreement or a tie when comparing the chosen performance metrics, kappa and specificity were subsequently compared to select the top performing model for each year.
Simple logistic regression analyses were performed to assess the direction of association between the top predictors and bovine infection, dividing continuous variables into tertiles to assess potential non-linear relationships. The direction of association was recorded for the top predictors within each collection year, using a P-value of <0.2 to indicate weak evidence of a between-group difference. In the case that no difference was indicated between tertile groups at the P<0.2 level, the predictors were further divided into quartiles and reassessed. If still no evidence for a between-group difference was identified using quartiles, this point was noted in the results. Density plots by infection status were also examined for a subset of predictors that were found to have a change in the direction of association across the collection years. Stata 15 (Stata Statistical Software: Release 15. StataCorp LP, College Station, TX, USA) and R Studio 4.0 (RStudio Team (2020). RStudio: Integrated Development Environment for R. RStudio, PBC, Boston, MA , USA, http://www.rstudio.com/).were used for all analyses.
2.6. Data accessibility
The datasets used in this analysis were modified to remove identifiers and personal information – including the removal of human infection data. These datasets and the complete annotated R-scripts that were used to carry out this analysis are available as supplementary files via Mendeley Data (DOI: 10.17632/rpw8pz3m54.1).
3. Results
3.1. Bovine S. japonicum infections in study villages persist despite aggressive control measures
Villages with high bovine infection prevalence (>30%) were present in all collection years. While some villages were found to have repeatedly high infection prevalence in bovines across all years despite treatment programs and aggressive control measures, other villages emerged as high prevalence villages in 2016 after years of low infection prevalence in bovines. Fig. 1 shows a map of bovine infection distribution by village across two counties.
Fig. 1.
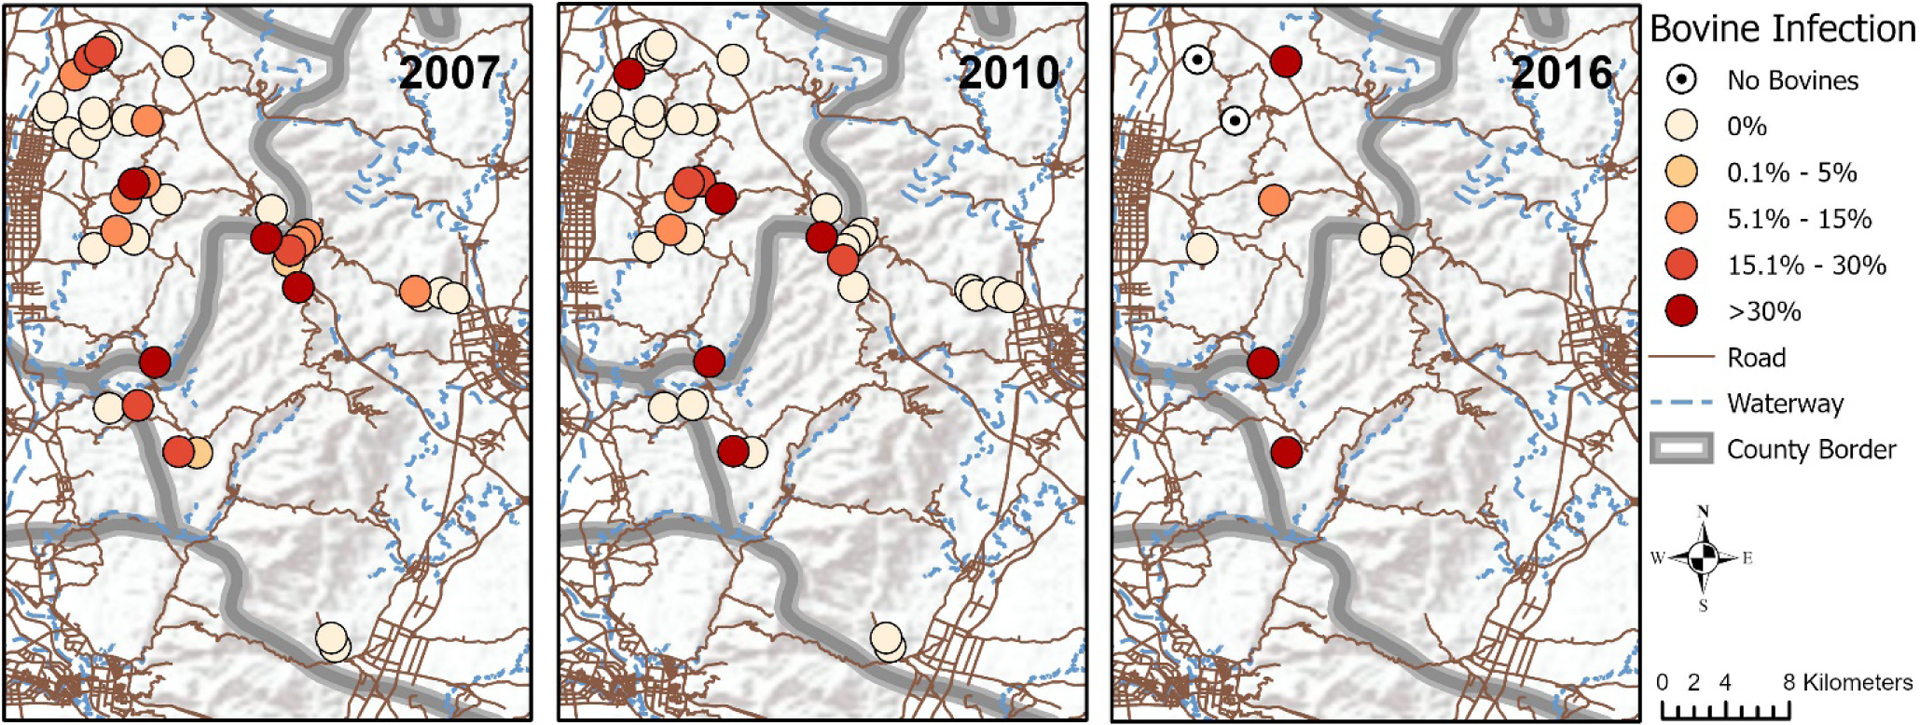
Village-level prevalence of schistosomiasis in bovines in 2007, 2010 and 2016. The prevalence of schistosomiasis infection in bovines is indicated for each village included in 2007, 2010 and 2016. The darker the shade, the higher the prevalence. While villages in the lower left corner of each map were found to have repeatedly high infection prevalence, other villages achieved 0% infection in bovines in later years (upper left and center right of maps), while still others emerged as high prevalence villages in 2010 (center of maps) and 2016 (upper left of maps) after years of low infection prevalence in bovines. Service Layer Credits: World Terrain Base Sources: Esri, USGS, NOAA. OpenStreetMap Data Extracts for China, Asia: Data/Maps Copyright 2018 Geofabrik GmbH and OpenStreetMap Contributors.
The bovine study population was comprised of fewer water buffaloes than cattle (18.5% of all bovines were water buffalo in 2007; 15.5% in 2010), was predominantly female (86.3% in 2007; 87.2% in 2010), and ranged widely in age from less than 1 year to 26 years old. See Supplementary Table S2 for a complete depiction of the distribution of all of the predictor variables included in this analysis by bovine infection status in 2007, 2010 and 2016.
3.2. Sanitation access, socio-economic status and agricultural practices have changed within study villages between 2007 and 2016
There were several notable shifts in the distribution of predictors over time in our study region. Access to improved sanitation increased across our study period, rising from 22.8% of households reporting improved sanitation in 2007 to 52.1% with improved sanitation by 2016. Notably, the percent of bovines infected was roughly equal across the two sanitation groups in 2007, but by 2016, a greater proportion of bovines were infected if they belonged to households with unimproved sanitation (23.5%) compared to the households with improved sanitation (16.2%).Household assets also increased over time, as approximately half of all villages had a mean asset score of less than two in 2007, whereas in 2010 and 2016, none of the included villages had a mean asset score that low. Across the study period, there was a steady increase in the percentage of households reporting planting rice (69.1% in 2007; 71.5% in 2010; 81.7% in 2016), and other summer crops (77.2% in 2007; 98% in 2010; 100% in 2016), as well as the cultivated area of rice and dry summer crops. Night soil use on rice and winter crops decreased over time: the proportion of households reporting any night soil use on rice crops dropped from 35.6% to 11.7% between 2007 and 2016, and for winter crops it dropped from 58.3% to 12.6%. By contrast, the proportion of night soil users for dry summer crops remained relatively constant across the study period (52.4% in 2007; 53.5% in 2010; 50.7% in 2016). Notably, the average amount of night soil being applied to crops dropped across the study period for all crop types. Table 2 compares the distributions of a subset of predictor variables by bovine infection status for 2007, 2010 and 2016.
Table 2.
Tabulation of a select set of key predictors by bovine infection status.
| 2007 | 2010 | 2016 | |||||||
|---|---|---|---|---|---|---|---|---|---|
| n positive | Total tested | % Positive | n positive | Total tested | % positive | n positive | Total tested | % positive | |
| Total | 63 | 473 | 13.32 | 34 | 197 | 17.26 | 14 | 71 | 19.72 |
| Bovine age b | |||||||||
| <2 | 3 | 43 | 6.98 | 6 | 35 | 17.14 | NDa | NDa | |
| 2 to 4 | 26 | 220 | 11.82 | 9 | 59 | 15.25 | NDa | NDa | |
| 5+ | 28 | 137 | 20.44 | 18 | 93 | 19.35 | NDa | NDa | |
| Missing | 6 | 73 | 8.22 | 1 | 10 | 10.00 | |||
| Prevalence of human infection in village | |||||||||
| 0–2.53% | 14 | 147 | 9.52 | 0 | 76 | 0.00 | 4 | 27 | 14.81 |
| 2.54– 11.11% | 13 | 158 | 8.23 | 11 | 57 | 19.30 | 8 | 29 | 27.59 |
| ≥11.12% | 36 | 168 | 21.43 | 23 | 64 | 35.94 | 2 | 15 | 13.33 |
| Number of infected human household members | |||||||||
| 0 | 38 | 366 | 10.38 | 19 | 154 | 12.34 | 12 | 61 | 19.67 |
| 1+ | 19 | 84 | 22.62 | 13 | 29 | 44.83 | 2 | 10 | 20.00 |
| Missing | 6 | 23 | 26.09 | 2 | 14 | 14.29 | 0 | 0 | -- |
| Household has improved sanitation | |||||||||
| No | 47 | 365 | 12.88 | 27 | 129 | 20.93 | 8 | 34 | 23.53 |
| Yes | 16 | 108 | 14.81 | 7 | 68 | 10.29 | 6 | 37 | 16.22 |
|
Village mean asset score
(0–9) |
|||||||||
| <2 | 39 | 225 | 17.33 | 0 | 0 | 0.00 | 0 | 0 | 0.00 |
| 2–3 | 24 | 248 | 9.68 | 26 | 143 | 18.18 | 2 | 23 | 8.70 |
| ≥4 | 0 | 0 | 0.00 | 8 | 54 | 14.81 | 12 | 48 | 25.00 |
| Household pig ownership c | |||||||||
| 0 | NDa | NDa | 27 | 116 | 23.28 | 14 | 64c | 21.88 | |
| 1+ | NDa | NDa | 7 | 81 | 8.64 | 0 | 7 | 0.00 | |
| Mean number of bovines per household | |||||||||
| < 0.5 | 5 | 116 | 4.31 | 4 | 59 | 6.78 | 10 | 57 | 17.54 |
| 0.5 – 1 | 40 | 300 | 13.33 | 19 | 99 | 19.19 | 4 | 14 | 28.57 |
| ≥ 1 | 18 | 57 | 31.58 | 11 | 39 | 28.21 | 0 | 0 | 0.00 |
| Household bovine ownership | |||||||||
| 0 | 49 | 334 | 14.67 | 20 | 126 | 15.87 | 8 | 38 | 21.05 |
| 1+ | 14 | 139 | 10.07 | 14 | 71 | 19.72 | 6 | 33 | 18.18 |
| Mean area of rice planted per household (mu) | |||||||||
| <0.75 | 14 | 143 | 9.79 | 9 | 90 | 10.00 | 7 | 18 | 38.89 |
| 0.75–1.5 | 19 | 183 | 10.38 | 12 | 48 | 25.00 | 5 | 41 | 12.20 |
| ≥1.5 | 30 | 147 | 20.41 | 13 | 59 | 22.03 | 2 | 12 | 16.67 |
| Area of rice planted by household (mu) | |||||||||
| 0 | 16 | 146 | 10.96 | 5 | 56 | 8.93 | 5 | 13 | 38.46 |
| <2 | 24 | 195 | 12.31 | 16 | 84 | 19.05 | 4 | 31 | 12.90 |
| 2+ | 23 | 132 | 17.42 | 13 | 57 | 22.81 | 5 | 27 | 18.52 |
| Mean area of dry summer crops planted per household (mu) | |||||||||
| <1 | 11 | 184 | 5.98 | 1 | 14 | 7.14 | 0 | 3 | 0.00 |
| 1 –2.5 | 44 | 195 | 22.56 | 23 | 110 | 20.91 | 2 | 26 | 7.69 |
| ≥2.5 | 8 | 94 | 8.51 | 10 | 73 | 13.70 | 12 | 42 | 28.57 |
| Area of dry summer crops planted by household (mu) | |||||||||
| 0 | 8 | 108 | 7.41 | 0 | 4 | 0.00 | 0 | 0 | -- |
| <3 | 39 | 242 | 16.12 | 18 | 99 | 18.18 | 2 | 26 | 7.69 |
| 3+ | 16 | 123 | 13.01 | 16 | 94 | 17.02 | 12 | 45 | 26.67 |
| 4+ | 16 | 108 | 14.81 | 7 | 48 | 14.58 | 0 | 13 | 0.00 |
| Mean number of buckets of night soil used on rice crops per household | |||||||||
| <1 | 3 | 58 | 5.17 | 29 | 146 | 19.86 | 8 | 41 | 19.51 |
| 1–9.9 | 21 | 153 | 13.73 | 4 | 38 | 10.53 | 6 | 27 | 22.22 |
| ≥10 | 39 | 262 | 14.89 | 1 | 13 | 7.69 | 0 | 3 | 0.00 |
| Number of buckets of night soil used on rice crops by household | |||||||||
| 0 | 40 | 304 | 13.16 | 29 | 168 | 17.26 | 8 | 53 | 15.09 |
| 1+ | 22 | 168 | 13.10 | 5 | 29 | 17.24 | 1 | 7 | 14.29 |
| Missing | 1 | 1 | 100.0 | 0 | 0 | -- | 5 | 11 | 45.45 |
| Mean buckets of night soil used on dry summer crops per household | |||||||||
| <10 | 13 | 190 | 6.84 | 24 | 99 | 24.24 | 1 | 15 | 6.67 |
| 10–30 | 18 | 109 | 16.51 | 7 | 47 | 14.89 | 13 | 47 | 27.66 |
| ≥30 | 32 | 174 | 18.39 | 3 | 51 | 5.88 | 0 | 9 | 0.00 |
| Number of buckets of night soil used on dry summer crops by household | |||||||||
| 0 | 31 | 248 | 12.50 | 24 | 105 | 22.86 | 6 | 36 | 16.67 |
| 1–25 | 6 | 53 | 11.32 | 5 | 32 | 15.63 | 5 | 22 | 22.73 |
| >25 | 26 | 172 | 15.12 | 5 | 60 | 8.33 | 3 | 13 | 23.08 |
| Mean number of buckets of night soil used on winter crops per household | |||||||||
| <10 | 1 | 26 | 3.85 | 24 | 121 | 19.83 | 14 | 71 | 100.0 |
| 10–30 | 19 | 218 | 8.72 | 7 | 41 | 17.07 | 0 | 0 | -- |
| ≥30 | 43 | 229 | 18.78 | 3 | 35 | 8.57 | 0 | 0 | -- |
| Number of buckets of night soil used on winter crops by household | |||||||||
| 0 | 27 | 197 | 13.71 | 31 | 137 | 22.63 | 9 | 62 | 14.52 |
| 1–26 | 5 | 79 | 6.33 | 0 | 16 | 0.00 | 1 | 3 | 33.33 |
| >26 | 31 | 197 | 15.74 | 3 | 44 | 6.82 | 4 | 6 | 66.67 |
A table of all candidate predictors is provided in Supplementary Table S2.
No data (ND). Data was not collected on bovine sex, age or type in 2016, or on pig ownership in 2007.
Although predictors are broken into categories to facilitate a comparison of the distributions across the study period, most were assessed as continuous variable in our Random Forests models. See Table 1 for details on variable formulation for the RF models.
Variables with >90% of observations taking on a single value were excluded from the RF assessment. This exclusion criteria applied twice in 2016: >90% of the included households reported owning at least one dog, and >90% of households owned zero pigs.
3.3. The most consistent, highly ranked predictor of bovine infection between 2007 and 2016 was the village’s bovine density
The predictor rankings from the RF assessment were relatively stable across the full models, lean models and sensitivity models within each year, although there was more variability across collection years (Fig. 2). For example, animal reservoirs were frequently among the top 10 predictors in 2016, but only a household’s pig ownership (2010) and bovine density in the surrounding village (both 2007 and 2010) were among the top 10 in earlier years.
Fig. 2.
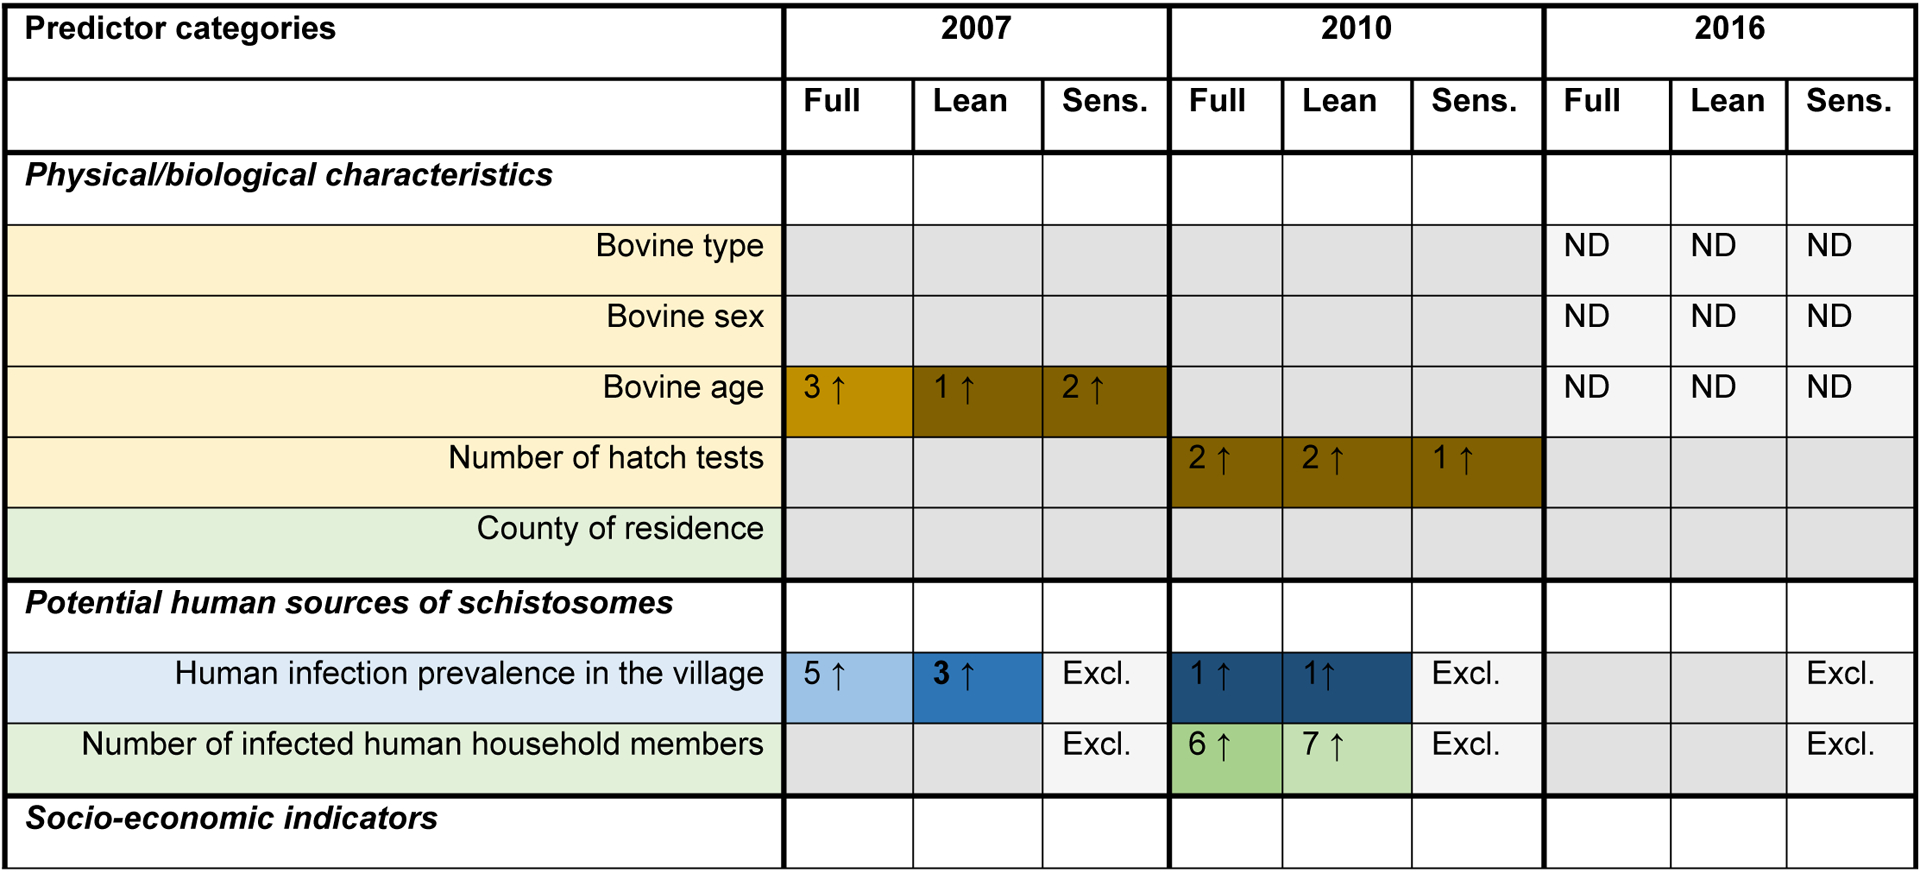
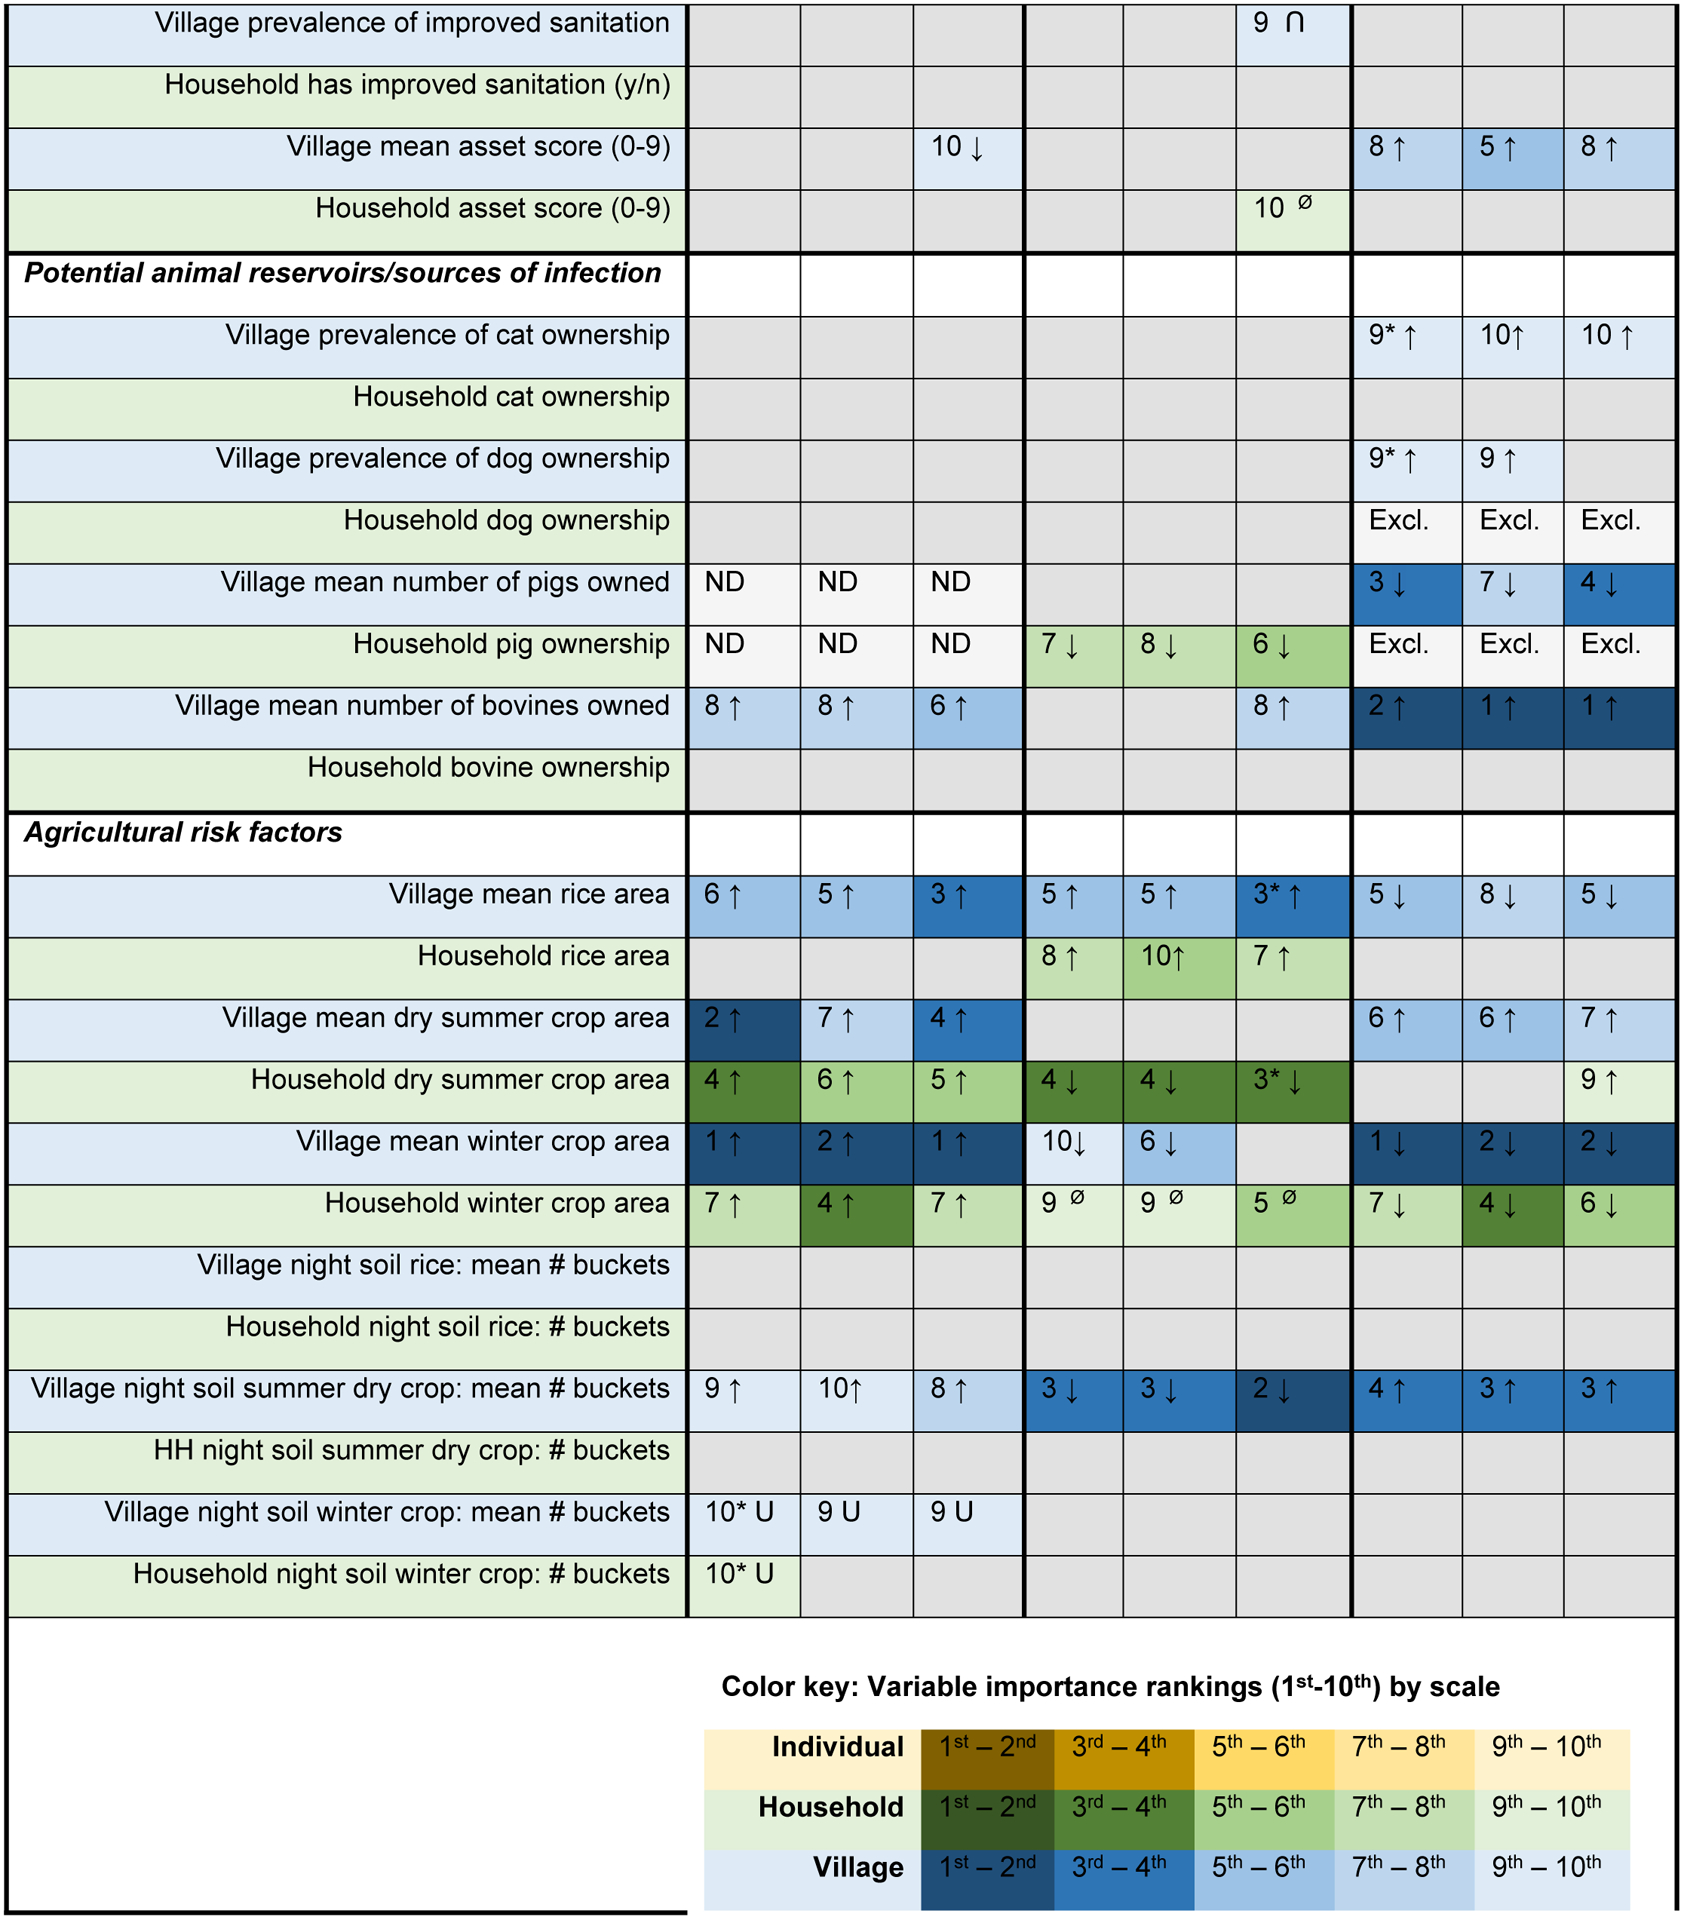
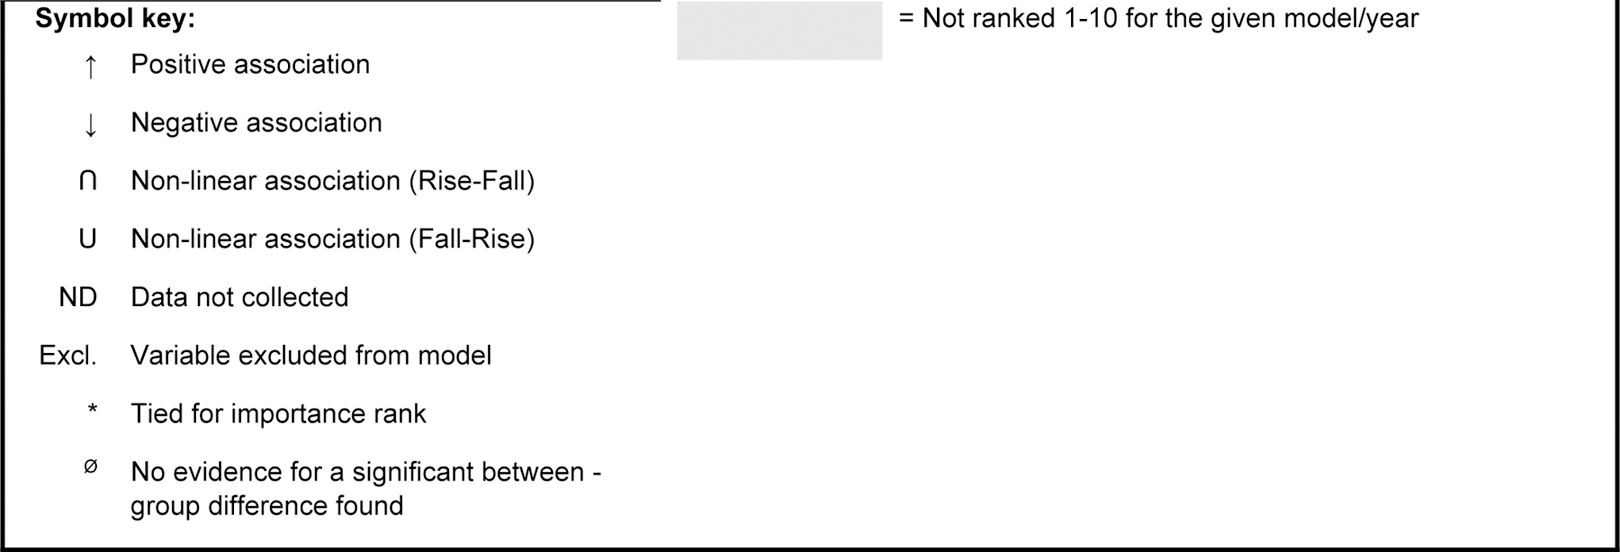
Variable importance rankings and direction of association for candidate predictors of bovine Schistosoma japonicum infection in 2007, 2010 and 2016. Variable importance rankings are based on a composite of mean decrease in accuracy scores for 10 random forest (RF) models for each model type (full, lean and sensitivity (Sens.)) and collection year. The direction of association was determined through logistic regression, using tertile categories for continuous variables to assess evidence for non-linearity. A P-value <0.2 was used to indicate evidence of a between-group difference and, when a between-group difference was found, the direction of association is indicated. See Supplementary Table S3 for detailed logistic regression results.
The density of bovines in a village was one of the most consistent predictors: it was scored in the top 10 in at least one RF analysis from each year, all of which indicate that an increase in bovine density in the surrounding village corresponds with an increase in bovine infection risk. Pig ownership was associated with a decrease in bovine infection risk in both years that it was assessed.
3.4. As a predictor category, agricultural practice was ranked in the top 10 more than any other category
Agricultural practices was the most frequently ranked predictor category across all years. Specifically, the household area of winter crops planted, the mean area of rice planted in the surrounding village, and the mean amount of night soil applied to dry summer crops in the surrounding village were all among the top 10 predictors in all models. Additionally, the total household area of summer crops planted and the village mean area of winter crops were also all among the top 10 predictors in at least one of the three model types for 2007, 2010 and 2016. However, despite the inter-year agreement indicating the importance of agricultural predictors, the direction of association between the top agricultural predictors and bovine infection was not always consistent across years. In 2007, increases in all key agricultural predictors were associated with an increase in bovine infection risk, apart from night soil use on winter crops. By contrast, in 2010 and 2016 our models indicate a mixture of positive and negative associations across the key agricultural predictors, and in one instance (household winter crop area in 2010), no evidence of a relationship was found.
3.5. Night soil use on all crop types decreased between 2007 and 2016, despite increases in dry summer crop farming over time
Fig. 3 depicts changes in the distribution of different agricultural practices by bovine infection status between 2007 and 2016. Most prominent among these is dry summer crop farming, which saw a notable increase in the total and mean area of crop being planted by households and villages between 2007 and 2016 (Fig. 3B). In 2007 and 2016 the area of dry summer crops cultivated at the household and village levels was positively associated with bovine infection, but in 2010 it was not. There was a general decrease in the amount of night soil being applied to rice, winter crops and, to a lesser extent, dry summer crops, between 2007 and 2016 (Fig. 3D–F). Greater night soil use on dry summer crops at the village level was associated with increased bovine infection risk in 2007 and 2016, but not in 2010. Less night soil was used on rice, compared with other crops, and night soil use on rice was not a key predictor of bovine infection in any year.
Fig. 3.
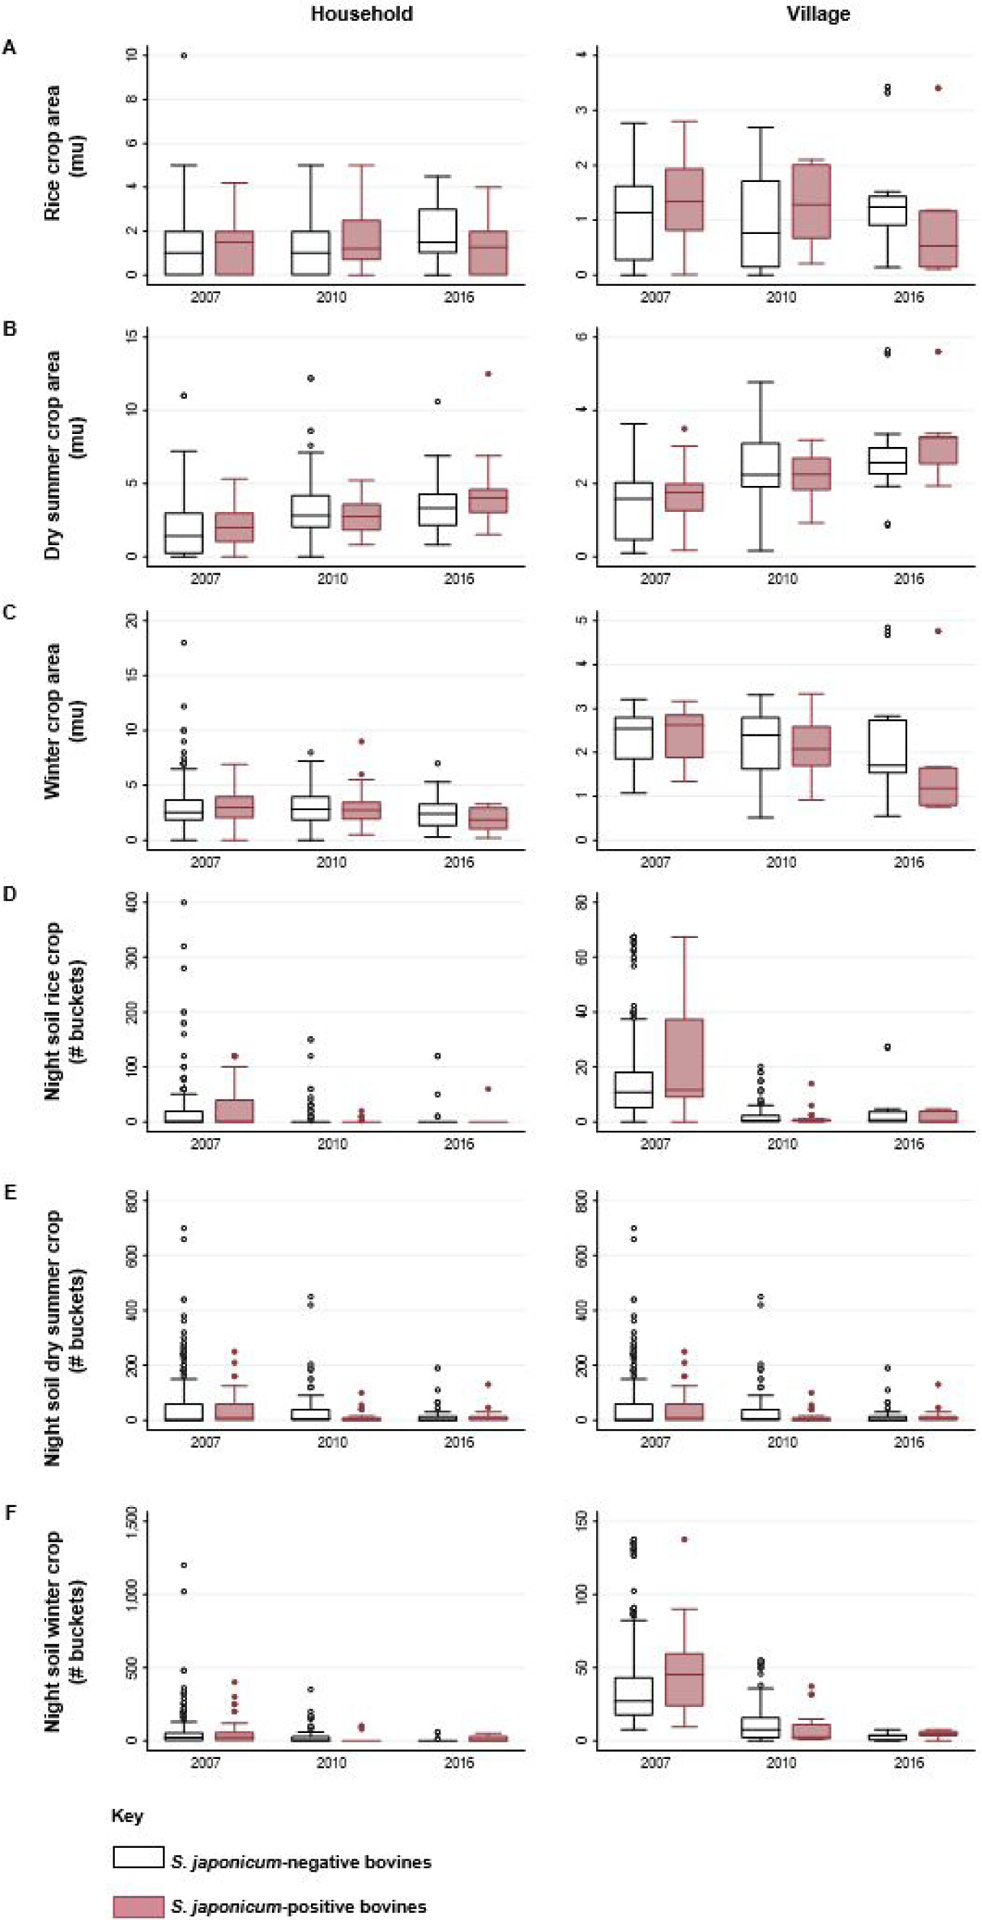
Changes in agricultural practices and the relationship between bovine Schistosoma japonicum infection and agricultural predictors over time. For each of the agricultural predictors included in this analysis, boxplots are used to represent the distribution of uninfected (white) and infected bovines, for household-level (left) and village-level variables (right) in 2007, 2010 and 2016.
3.6. Human infection, bovine age and the number of hatch tests performed were also important predictors of bovine S. japonicum infection in one or more years
There are several other key predictors that stand out in one or more collection years. Human infection prevalence in the surrounding village was among the top five predictors of bovine infection in 2007 and 2010, and the number of infected humans within the household was among the top 10 predictors in 2010. In all cases, an increase in human infections was associated with an increase in bovine infections. When the human infection predictors were removed for the sensitivity analysis, the rankings of the remaining predictors did not shift substantially in any collection year. Bovine age was also among the top predictors in 2007, and the probability of infection was found to increase with age. In all of the 2010 analyses, the number of hatch tests was an important predictor of bovine infection, a feature not shared by the 2007 and 2016 analyses. This may be related to the lower proportion of bovines with three hatch test results in 2010 (64.5%), compared with 2007 (70.6%) and 2016 (73.2%) (Supplementary Table S2).
3.7. The predictive performance of the RF models was satisfactorily high across the study period
Of the three different analyses performed (full, lean and sensitivity) for each collection year, the full models (i.e. those that included the full list of predictors available in a given year) tended to perform the best (Table 3, Supplementary Fig. S1). Overall, the models had high accuracy values, with the top performing full models producing a maximum accuracy of 0.864 (95% confidence interval (CI): 0.79 – 0.92) in 2007, 0.816 (95% CI: 0.68 – 0.91) in 2010, and 1.0 (95% CI: 0.81 – 1.0) in 2016. Furthermore, despite some variation in model performance across the 10 iterations of RF models for each analysis year, ultimately the models were relatively stable. For example, across each of the 10 iterations of full model analyses, the AUC range was relatively narrow: 0.724 – 0.75 in 2007, 0.816 – 0.863 in 2010, and 0.982 – 1.0 in 2016. However, due to class imbalance in the reserved test datasets (see the no information rate (NIR) in Table 3), the Kappa value is also a useful performance metric for our models, as this takes class imbalance into account. According to the benchmarks laid out by Landis and Koch (1977), the Kappa statistics from our 2007 analyses suggest a “fair” level of agreement (0.21 – 0.40) between our best RF models and the true known values in 2007. For 2010, the highest Kappa statistic came from the full predictor analysis, with a Kappa of 0.463, indicating a “moderate” level of agreement (0.41 – 0.60) between the prediction model and the reserved test dataset (Landis and Koch, 1977). In 2016, both the full and sensitivity models achieved perfect prediction (Kappa = 1) for the test dataset in at least one of the 10 model iterations, whereas the Kappa statistic for the top performing lean model was 0.853, or “almost perfect”, according to Landis and Koch (1977).
Table 3.
Comparison of model performance metrics for the top performing modela from the full, lean and sensitivity (Sens.) analyses in 2007, 2010 and 2016.
| Performance metrics | 2007 models | 2010 models | 2016 models | ||||||
|---|---|---|---|---|---|---|---|---|---|
| Full | Lean | Sens. | Full | Lean | Sens. | Full | Lean | Sens. | |
| Accuracy | 0.864 | 0.864 | 0.856 | 0.816 | 0.816 | 0.816 | 1 | 0.944 | 1 |
| 95% CI | 0.79 – 0.92 | 0.79 – 0.92 | 0.78 – 0.91 | 0.68 – 0.91 | 0.68 – 0.91 | 0.68 – 0.91 | 0.81 – 1 | 0.73 – 1 | 0.81 – 1 |
| NIRb | 0.864 | 0.864 | 0.864 | 0.837 | 0.837 | 0.837 | 0.778 | 0.778 | 0.778 |
| Kappac | 0.313 | 0.313 | 0.246 | 0.463 | 0.360 | 0.416 | 1 | 0.853 | 1 |
| Sensitivity | 0.313 | 0.313 | 0.25 | 0.75 | 0.5 | 0.505 | 1 | 1 | 1 |
| Specificity | 0.951 | 0.951 | 0.951 | 0.829 | 0.878 | 0.625 | 1 | 0.929 | 1 |
The top performing model was defined as the one with the highest accuracy for each analysis type (full, lean and sensitivity) and collection year (2007, 2010, 2016). In the case of a tie for the highest accuracy value, the sensitivity, receiver operating curve area under the curve, kappa and specificity were subsequently compared to select the top performing model for each analysis type and year.
No Information Rate
Due to the high degree of imbalance between the outcome classes across the study period, the Kappa value is a useful metric for our models, as it helps to correct bias that results when rewarding the prediction of the majority class. The benchmark values outlined by Landis & Koch (1977) are useful here for determining the relative strength of the predictive models: <0.00 = Poor; 0.00 – 0.20= Slight; 0.21 – 0.40 = Fair; 0.41 – 0.60 = Moderate; 0.61 – 0.81 = Substantial; 0.81 – 1.0 = Almost Perfect.
Because the full list of predictors changed slightly across the collection years, a supplemental analysis was conducted in which only predictors that were available in all three collection years were included in the RF models. This analysis demonstrated that (i) intra-year rankings and extra-year patterns did not change substantially, and (ii) agricultural variables remained the most prominent predictor category when comparing across the entire study period. See Supplementary Fig. S2 for details of the supplemental analysis.
4. Discussion
Agricultural risk factors, bovine density, human infection, pig ownership and bovine age were all found to be key predictors of bovine infection status in one or more of the years assessed in this analysis. Of the agricultural risk factors, night soil use on dry summer crops, the village-level area of rice crops, and both the household and village-level areas of dry summer and winter crops were each ranked among the top five predictors for one or more collection years in our RF models. Interestingly, for 2007, all of the ranked agricultural variables except night soil use on winter crops were associated with an increase in bovine infection risk in our logistic regression assessments, whereas in 2010 and 2016, these agricultural factors were found to be variably positively and negatively associated with infection. For example, the area of rice cultivated in a village was positively associated with bovine infection in 2007 and 2010, but negatively associated in 2016. This finding may be related to changing norms and interventions that have taken hold in recent years as a result of increasing awareness of the potential risks posed by both bovines as a reservoir of schistosomiasis, and specific agricultural practices. For example, across our study period, we saw a steady increase in the percent of households planting rice (69.1% in 2007; 71.5% in 2010; 81.7% in 2016), and a simultaneous decrease in the percentage of households applying any night soil to their rice crops (35.6% in 2007, 14.7% in 2010; 11.7% in 2016). These shifting norms in rice production and night soil use likely resulted in a decrease in the overall concentration of night soil on rice crops within our study villages, which in turn may help to explain why the village-level rice crop area shifts from having a positive association with bovine infection in 2007 and 2010, to a negative association by 2016.
Assessments conducted in China early in the new millennium repeatedly highlighted bovines as a key source of environmental contamination and as the main animal reservoir of S. japonicum in the country (Guo et al., 2006; Gray et al., 2007, 2009a). Beginning in 2004, a new government-led approach to eliminating schistosomiasis transmission in China was adopted, which – in conjunction with infrastructure improvements in rural areas and several new schistosomiasis elimination interventions – featured replacing bovines with machinery in agricultural production (Liu et al., 2017). Thus, the negative associations that were found intermittently between bovine infection and some of our agricultural variables in 2010 and 2016 may be linked to the added precautions that were being adopted when bovines were being used for agriculture, or because bovines were being reallocated for other purposes (e.g. beef production) as machinery became the norm for large crop areas or those deemed high risk (e.g. wet rice crops).
Dry summer crops stand out as a key agricultural risk factor for bovine infection. The area of dry summer crops cultivated and the quantity of night soil applied to dry summer crops were key predictors of bovine infection in all years, and positively associated with bovine infection in 2007 and 2016. It is unclear why this is: it is possible that the cultivation of such crops provides snail habitat and/or the use of night soil on dry summer crops facilitates infection of snails living near the field (in our study region, more night soil is applied to dry summer crops than rice), leading to bovine infection. A downward trend in night soil use (total and mean number of buckets) on crops can be observed in Fig. 3D–F, although notably, we do not see any substantial shift in the overall proportion of households that reported any night soil use on summer crops over the years (52.4% in 2007; 53.5% in 2010; 50.7% in 2016) (Table 2). Increasing recognition of the potential risks posed by night soil use during our study period (Carlton et al., 2011) may have also contributed to some decreases in night soil use and/or the more careful treatment of night soil prior to field applications. However, the continued practice of applying night soil to dry summer crops, paired with the steady increase in the total area of summer crops being planted by villagers over the study period (see Fig. 3B) may help to explain why night soil use on summer crops is positively associated with bovine infection status in 2016.
Bovine density in the surrounding village was in the top 10 predictors of our RF models, and was positively associated with bovine infection in our regression models in all collection years. These findings align well with the existing literature that points to bovines as the most important reservoir of S. japonicum infection in China (Gray et al., 2009a), and suggests that being in close proximity to higher densities of bovine hosts may correspond with increasing infection risk, as has been found for other bovine pathogens (Guo et al., 2006; Spencer et al., 2015; Meadows et al., 2018). However, it is worth noting that household-level bovine ownership was not among the top predictors in any of our RF models, highlighting that the larger-scale lens (i.e. village-level analysis scale) may be particularly important to future investigations and control strategies. Similarly, recent informal interviews with residents in our study sites have revealed that bovines are infrequently kept near the home, as allowing bovines to graze (and defecate) freely is an economical and efficient way of raising bovines, further illustrating that the household scale may not always be broad enough to capture larger scale trends. Instead, villagers opt to bring their bovines to the mountains to graze during the day, which subsequently presents more opportunities for contact between bovines from different households, and may ultimately result in more widespread environmental contamination (e.g. bovine feces washed into nearby irrigation ditches after precipitation).
In the developmental stages of this analysis, we hypothesized that human infection prevalence and the number of infected people in the household would be among the top predictors of bovine infection status, given the known link between human schistosomiasis and bovine reservoirs (e.g. Gray et al., 2009a). It was therefore somewhat surprising to find that household-level human infection was only highly ranked in 2007 within our RF models, while village human infection prevalence was ranked in the top 10 in 2007 and 2010, and neither household-level human infection nor village-level human infection prevalence were important predictors in 2016. One potential explanation for the changing importance of human infection as a predictor of bovine infection could be related to the aforementioned bovine removal phenomenon, in which bovines are increasingly being removed from the village area and brought to alternative mountain locations for grazing. As this act would likely result in an overall drop in time humans spent in bovine grazing areas, one might expect to see a separation of the bovine and human infection cycles if snail habitats are common in bovine grazing sites. In fact, the drop in the important rankings of human infection status in 2016 coincides with a jump in the variable importance rankings for village-level bovine ownership (6th – 8th in 2007 and 2010; 1st –2nd in 2016), providing further support for the theory that bovines may be becoming increasingly important reservoirs of schistosomiasis infection. On the other hand, an altogether different explanation for the differences in the 2016 rankings compared with 2007 and 2010 is that the 2016 data collection simply didn’t have a large enough sample size to allow for the detection of a true relationship between relatively rare events.
As such, one limitation of this assessment was the relatively small sample sizes, particularly in 2016 (n=71), although to a lesser extent 2010 (n=197) and 2007 (n=473), given the correspondingly large number of predictors that were included in the full predictor models (n=29, n=31, n=26, in 2007, 2010 and 2016, respectively). While RF models are generally acknowledged as being able to handle assessments of high dimensional data even with relatively small sample sizes (Biau and Scornet, 2016), it remains that small samples sizes can still give rise to the aforementioned issue of non-detection of rare events. Another limitation to this assessment is that RF models tends to favor continuous predictors over categorical measures, as they allow for a wider range of potential split points for classifying observations. For this reason, it is not particularly surprising that age was the only predictor from the individual/physical characteristics predictor group that was ranked among the top 10 predictors, as the remaining individual characteristics were binary measures. Another notable limitation of the variable importance rankings used in RF models is that they become less reliable when predictors are highly correlated with one another (Strobl et al., 2008). This may be particularly important to the rankings ascribed to the agricultural variables, as correlation between the area of the different crop types planted and the amount of night soil used on each crop tended to be high across all collection years, with the highest predictor correlations found in the 2016 collection year (See Supplementary Figs. S3 – S5 for correlation matrices). This is notable, as a higher degree of instability in the variable importance rankings was also found for 2016 compared with 2010 or 2007, suggesting predictor correlation may be responsible. We therefore recommend that the variable rankings presented in this analysis be interpreted more holistically (e.g. agricultural variables are strong predictors of bovine infection), and advise caution when comparing unique variable ranking values against one another (e.g. rice crop area is less important than winter crop area).
Our main interests in this assessment were to (i) identify the best physical and environmental predictors of bovine S. japonicum infection within rural farming communities in Sichuan China, and (ii) to ascertain whether there are broader trends in bovine infection distribution across individual, household or village level scales or over time. Our RF assessments have highlighted some key patterns that were repeated across multiple collection years and multiple iterations of three different models. Agricultural factors and animal reservoirs – specifically, high bovine density in the surrounding village – were repeatedly found to be among the top predictors of bovine S. japonicum infection across all assessment years. Furthermore, human infection, pig ownership and bovine age were also found to be strong predictors of bovine infection in at least 1 year. Taken together, these findings highlight the potential utility of presumptively treating bovines residing in villages and households that engage in high-risk agricultural practices, those of older age, or those belonging to villages with particularly high human infection or bovine density. Additionally, village-level predictors tended to be better predictors of bovine infection than household-level predictors, suggesting that future investigations and interventions may need to apply a broad ecological lens in order to successfully extricate and address environmental sources of ongoing transmission. In so doing, not only can unnecessary bovine morbidity and the associated economic losses be reduced, but such measures will also help to minimize the potential for bovines to serve as another pathway to persistent human schistosomiasis transmission.
Supplementary Material
Supplementary Fig. S1. Receiver operating curve area under the curve (ROC AUC) for the best performing models. The ROC AUC is shown for the top performing full, lean and sensitivity models for (A) 2007, (B) 2010, and (C) 2016.
Supplementary Fig. S2. Supplemental analysis assessing changes over time. Two additional Random Forests model iterations were run for each collection year that only included those predictors that were available in all three of the collection years. The top 10 predictors for these two iterations were given a score of 1–10, and the summed scores were used to determine the variable ranking 1st (top predictor) – 10th for each collection year, as well as a final variable ranking “all year score” that summed the rankings across all six iterations (two per collection year) conducted.
Supplementary Fig. S3. Correlation matrix for 2007 predictors. A correlation matrix for predictors included in the 2007 Random Forests models is provided to highlight those predictors whose relative variable ranking positions may be less reliable due to correlation with other influential predictors. Only predictors with a correlation coefficient of < −0.499 or > 0.499 are included. The 2007 correlation matrix demonstrates that there are some strongly correlated predictors, particularly in the agricultural predictor category, that may be impacting their relative importance rankings.
Supplementary Fig. S4. Correlation matrix for 2010 predictors. A correlation matrix for predictors included in the 2010 Random Forests models is provided to highlight those predictors whose relative variable ranking positions may be less reliable due to correlation with other influential predictors. Only predictors with a correlation coefficient of < −0.499 or > 0.499 are included. The 2010 correlation matrix demonstrates that there are just a few strongly correlated predictors in the agricultural predictor category. As well as the socio-economic indicator category that may be impacting relative importance rankings.
Supplementary Fig. S5. Correlation matrix for 2016 predictors. A correlation matrix for predictors included in the 2016 Random Forests models is provided to highlight those predictors whose relative variable ranking positions may be less reliable due to correlation with other influential predictors. Only predictors with a correlation coefficient of < −0.499 or > 0.499 are included. The 2016 correlation matrix demonstrates that there are several strongly correlated predictors across the different predictor categories that may be impacting relative importance rankings for the 2016 RF models.
Highlights.
Local agricultural practices are strong predictors of bovine schistosomiasis
High bovine density in the surrounding village was associated with bovine infection
Village-level predictors outperformed household and individual-level predictors
Presumptively treating bovines in high-risk settings may slow the transmission cycle
An ecological lens can help to identify sources of persistent schistosomiasis
Acknowledgments
We are grateful for the support and efforts of the field research team members from the Institute of Parasitic Diseases, China, and the county anti-schistosomiasis control stations for their efforts in collecting the data presented here. This research was supported by grants from the National Institute of Allergy and Infectious Diseases (USA): R01AI134673 (EJC, PI), R21AI115288 (EJC, PI) and R01AI068854 (Robert Spear, PI). The content is solely the responsibility of the authors and does not necessarily represent the official views of the National Institutes of Health (USA). The funders had no role in study design, data collection and analysis, decision to publish, or preparation of the manuscript.
Footnotes
Publisher's Disclaimer: This is a PDF file of an unedited manuscript that has been accepted for publication. As a service to our customers we are providing this early version of the manuscript. The manuscript will undergo copyediting, typesetting, and review of the resulting proof before it is published in its final form. Please note that during the production process errors may be discovered which could affect the content, and all legal disclaimers that apply to the journal pertain.
Note: Supplementary data is associated with this article.
References
- Al-Gaabary M, Osman S, El-Tonoby A, 2009. Studies on paramphistomiasis in ruminants. Kafrelsheikh Vet Med J 7, 116–136. [Google Scholar]
- Alemneh T, Engdaw, Alemseged G, Abuhay, 2015. Overview on: Schistosoma infection in cattle. World J Pharm Res 1, 1–11. [Google Scholar]
- Biau G, Scornet E, 2016. A random forest guided tour. TEST 25, 197–227. [Google Scholar]
- Breiman L, Cutler A, 2011. Manual: Setting up, using, and understanding random forests V4.0 Accessed Sep 8, 2020: https://wwwstatberkeleyedu/~breiman/Using_random_forests_v40pdf.
- Carlton EJ, Bates MN, Zhong B, Seto EYW, Spear RC, 2011. Evaluation of Mammalian and Intermediate Host Surveillance Methods for Detecting Schistosomiasis Reemergence in Southwest China. PLoS Negl Trop Dis 5, e987. [DOI] [PMC free article] [PubMed] [Google Scholar]
- Carlton EJ, Liu Y, Zhong B, Hubbard A, Spear RC, 2015. Associations between Schistosomiasis and the Use of Human Waste as an Agricultural Fertilizer in China. PLoS Negl Trop Dis 9, e0003444. [DOI] [PMC free article] [PubMed] [Google Scholar]
- Catalano S, Sène M, Diouf ND, Fall CB, Borlase A, Léger E, Bâ K, Webster JP, 2018. Rodents as natural hosts of zoonotic Schistosoma species and hybrids: an epidemiological and evolutionary perspective from West Africa. J Infect Dis 218, 429–433. [DOI] [PubMed] [Google Scholar]
- Chanie M, Dejen B, Fentahun T, 2012. Prevalence of cattle schistosomiasis and associated risk factors in Fogera cattle, south Gondar zone, Amhara national regional state, Ethiopia. J Adv Vet Res 2, 153–156. [Google Scholar]
- Colley DG, Loker ES, 2018. New Tools for Old Questions: How Strictly Human Are “Human Schistosomes”-And Does It Matter? J Infect Dis 218, 344–346. [DOI] [PubMed] [Google Scholar]
- Defersha T, Belete B, 2018. The Neglected Infectious Disease, Bovine Schistosomiasis: Prevalence and Associated Risk Factors for its Occurrence among Cattle in the North Gulf of Lake Tana, Northwest Ethiopia. J Vet Med Health 2, 112. [Google Scholar]
- Department of Disease Control, 2000. Textbook for Schistosomiasis Control, China Shanghai Publishing House for Science and Technology, Shanghai.
- Gebremeskel AK, Simeneh ST, Mekuria SA, 2017. Prevalence and Associated Risk Factors of Bovine Schistosomiasis in Northwestern Ethiopia. World’s Vet J 7, 01–04. [Google Scholar]
- Gordon CA, Kurscheid J, Williams GM, Clements ACA, Li Y, Zhou XN, Utzinger J, McManus DP, Gray DJ, 2019. Asian Schistosomiasis: Current Status and Prospects for Control Leading to Elimination. Trop Med Infect Dis 4. [DOI] [PMC free article] [PubMed] [Google Scholar]
- Gray DJ, Williams GM, Li Y, Chen H, Forsyth SJ, Li RS, Barnett AG, Guo J, Ross AG, Feng Z, 2009a. A cluster-randomised intervention trial against Schistosoma japonicum in the Peoples’ Republic of China: bovine and human transmission. PLoS One 4, e5900. [DOI] [PMC free article] [PubMed] [Google Scholar]
- Gray DJ, Williams GM, Li Y, Chen H, Li RS, Forsyth SJ, Barnett AG, Guo J, Feng Z, McManus DP, 2007. A cluster-randomized bovine intervention trial against Schistosoma japonicum in the People’s Republic of China: design and baseline results. Am J Trop Med 77, 866–874. [PMC free article] [PubMed] [Google Scholar]
- Gray DJ, Williams GM, Li Y, McManus DP, 2009b. Transmission Dynamics of Schistosoma japonicum in the Lakes and Marshlands of China. PLoS One 3, e4058. [DOI] [PMC free article] [PubMed] [Google Scholar]
- Grimes JET, Croll D, Harrison WE, Utzinger J, Freeman MC, Templeton MR, 2015. The roles of water, sanitation and hygiene in reducing schistosomiasis: a review. Parasites Vectors 8, 156. [DOI] [PMC free article] [PubMed] [Google Scholar]
- Guo J, Li Y, Gray D, Ning A, Hu G, Chen H, Davis GM, Sleigh AC, Feng Z, McManus DP, Williams GM, 2006. A drug-based intervention study on the importance of buffaloes for human Schistosoma japonicum infection around Poyang Lake, People’s Republic of China. Am J Trop Med Hyg 74, 335–341. [PubMed] [Google Scholar]
- He Y, Xu S, Shi F, Shen W, Hsü S, Hsü H, 1992. Comparative studies on the infection and maturation of Schistosoma japonicum in cattle and buffaloes. Curr Zool 38, 266–271. [Google Scholar]
- He YX, Salafsky B, Ramaswamy K, 2001. Host--parasite relationships of Schistosoma japonicum in mammalian hosts. Trends Parasitol 17, 320–324. [DOI] [PubMed] [Google Scholar]
- Katz N, Chaves A, Pellegrino J, 1972. A simple device for quantitative stool thick-smear technique in Schistosomiasis mansoni. Rev Inst Med Trop Sao Paulo 14, 397–400. [PubMed] [Google Scholar]
- Kebede A, Dugassa J, Haile G, Wakjira BM, 2018. Prevalence of bovine schistosomiasis in and around Nekemte, East Wollega zone, Western Ethiopia. J Vet Med Anim Health 10, 123–127. [Google Scholar]
- Kittur N, King CH, Campbell CH, Kinung’hi S, Mwinzi PNM, Karanja DMS, N’Goran EK, Phillips AE, Gazzinelli-Guimaraes PH, Olsen A, Magnussen P, Secor WE, Montgomery SP, Utzinger J, Walker JW, Binder S, Colley DG, 2019. Persistent Hotspots in Schistosomiasis Consortium for Operational Research and Evaluation Studies for Gaining and Sustaining Control of Schistosomiasis after Four Years of Mass Drug Administration of Praziquantel. Am J Trop Med Hyg 101, 617–627. [DOI] [PMC free article] [PubMed] [Google Scholar]
- Landis JR, Koch GG, 1977. The Measurement of Observer Agreement for Categorical Data. Biometrics 33, 159–174. [PubMed] [Google Scholar]
- Leger E, Webster JP, 2017. Hybridizations within the Genus Schistosoma: implications for evolution, epidemiology and control. Parasitology 144, 65–80. [DOI] [PubMed] [Google Scholar]
- Li H, Dong GD, Liu JM, Gao JX, Shi YJ, Zhang YG, Jin YM, Lu K, Cheng GF, Lin JJ, 2015. Elimination of schistosomiasis japonica from formerly endemic areas in mountainous regions of southern China using a praziquantel regimen. Vet Parasitol 208, 254–258. [DOI] [PubMed] [Google Scholar]
- Li YS, McManus DP, Lin DD, Williams GM, Harn DA, Ross AG, Feng Z, Gray DJ, 2014. The Schistosoma japonicum self-cure phenomenon in water buffaloes: potential impact on the control and elimination of schistosomiasis in China. Int J Parasitol 44, 167–171. [DOI] [PubMed] [Google Scholar]
- Liang S, Yang C, Zhong B, Qiu D, 2006. Re-emerging schistosomiasis in hilly and mountainous areas of Sichuan, China. Bull World Health Organ 84, 139–144. [DOI] [PMC free article] [PubMed] [Google Scholar]
- Liu Y, Zhong B, Wu Z-S, Liang S, Qiu D-C, Ma X, 2017. Interruption of schistosomiasis transmission in mountainous and hilly regions with an integrated strategy: a longitudinal case study in Sichuan, China. Infect Dis Poverty 6, 79. [DOI] [PMC free article] [PubMed] [Google Scholar]
- Lulie B, Guadu T, 2014. Bovine schistosomiasis: A threat in public health perspective in Bahir Dar town, northwest Ethiopia. Acta Parasitol Glob 5, 1–6. [Google Scholar]
- McCauley EH, Majid AA, Tayeb A, Bushara HO, 1983. Clinical diagnosis of schistosomiasis in Sudanese cattle. Trop Anim Health Prod 15, 129–136. [DOI] [PubMed] [Google Scholar]
- Meadows AJ, Mundt CC, Keeling MJ, Tildesley MJ, 2018. Disentangling the influence of livestock vs. farm density on livestock disease epidemics. Ecosphere 9, e02294. [Google Scholar]
- Ross AG, Sleigh AC, Li Y, Davis GM, Williams GM, Jiang Z, Feng Z, McManus DP, 2001. Schistosomiasis in the People’s Republic of China: prospects and challenges for the 21st century. Clin Microbiol Rev 14, 270–295. [DOI] [PMC free article] [PubMed] [Google Scholar]
- Rudge JW, Webster JP, Lu DB, Wang TP, Fang GR, Basáñez MG, 2013. Identifying host species driving transmission of schistosomiasis japonica, a multihost parasite system, in China. Proc Natl Acad Sci USA 110, 11457–11462. [DOI] [PMC free article] [PubMed] [Google Scholar]
- Song LG, Wu XY, Sacko M, Wu ZD, 2016. History of schistosomiasis epidemiology, current status, and challenges in China: on the road to schistosomiasis elimination. Parasitol Res 115, 4071–4081. [DOI] [PubMed] [Google Scholar]
- Southgate VR, 1997. Schistosomiasis in the Senegal River Basin: before and after the construction of the dams at Diama, Senegal and Manantali, Mali and future prospects. J Helminthol 71, 125–132. [DOI] [PubMed] [Google Scholar]
- Spencer SE, Besser TE, Cobbold RN, French NP, 2015. ‘Super’ or just ‘above average’? Supershedders and the transmission of Escherichia coli O157:H7 among feedlot cattle. J R Soc Interface 12, 0446. [DOI] [PMC free article] [PubMed] [Google Scholar]
- Strobl C, Boulesteix A-L, Kneib T, Augustin T, Zeileis A, 2008. Conditional variable importance for random forests. BMC Bioinform 9, 307. [DOI] [PMC free article] [PubMed] [Google Scholar]
- Tan TK, Low VL, Lee SC, Panchadcharam C, Kho KL, Koh FX, Sharma RSK, Jaafar T, Lim YAL, 2015. Detection of Schistosoma spindale ova and associated risk factors among Malaysian cattle through coprological survey. Jpn J Vet Res 63, 63–71. [PubMed] [Google Scholar]
- Tsega M, Derso S, 2015. Prevalence of bovine schistosomiasis and its associated risk factor in and around Debre Tabor town, north west of Ethiopia. Europ J Biol Sci 7, 108–113. [Google Scholar]
- Van Dorssen CF, Gordon CA, Li Y, Williams GM, Wang Y, Luo Z, Gobert GN, You H, McManus DP, Gray DJ, 2017. Rodents, goats and dogs – their potential roles in the transmission of schistosomiasis in China. Parasitology 144, 1633–1642. [DOI] [PubMed] [Google Scholar]
- Xu J, Steinman P, Maybe D, Zhou XN, Lv S, Li SZ, Peeling R, 2016. Evolution of the National Schistosomiasis Control Programmes in The People’s Republic of China. Adv Parasitol 92, 1–38. [DOI] [PubMed] [Google Scholar]
- Xu S, Shi F, Shen W, Lin J, Wang Y, Lin B, Qian C, Ye P, Fu L, Shi Y, 1993. Vaccination of bovines against schistosomiasis japonica with cryopreserved-irradiated and freeze-thaw schistosomula. Vet Parasitol 47, 37–50. [DOI] [PubMed] [Google Scholar]
- Yihunie A, Urga B, Alebie G, 2019. Prevalence and risk factors of bovine schistosomiasis in Northwestern Ethiopia. BMC Vet Res 15, 12. [DOI] [PMC free article] [PubMed] [Google Scholar]
- Zhang LJ, Xu ZM, Yang F, Dang H, Li YL, Lü S, Cao CL, Xu J, Li SZ, Zhou XN, 2021. [Endemic status of schistosomiasis in People’s Republic of China in 2020]. Zhongguo Xue Xi Chong Bing Fang Zhi Za Zhi 33, 225–233. [DOI] [PubMed] [Google Scholar]
- Zheng J, Guo JG, Wang XF, Zhu HQ, 2000. Relationship of the livestock trade to schistosomiasis transmission in mountainous area. Zhongguo Ji Sheng Chong Xue Yu Ji Sheng Chong Bing Za Zhi 18, 146–148. [PubMed] [Google Scholar]
- Zhou G, Shan L, Shi-Zhu L, Hui D, Li-Juan Z, Jing X, 2018. Analysis on the situation of schistosome infections in floating population in national schistosomiasis surveillance sites of China. Zhongguo Xue Xi Chong Bing Fang Zhi Za Zhi 30, 124–130. [DOI] [PubMed] [Google Scholar]
- Zhou YB, Liang S, Jiang QW, 2012. Factors impacting on progress towards elimination of transmission of schistosomiasis japonica in China. Parasite Vectors 5, 275. [DOI] [PMC free article] [PubMed] [Google Scholar]
Associated Data
This section collects any data citations, data availability statements, or supplementary materials included in this article.
Supplementary Materials
Supplementary Fig. S1. Receiver operating curve area under the curve (ROC AUC) for the best performing models. The ROC AUC is shown for the top performing full, lean and sensitivity models for (A) 2007, (B) 2010, and (C) 2016.
Supplementary Fig. S2. Supplemental analysis assessing changes over time. Two additional Random Forests model iterations were run for each collection year that only included those predictors that were available in all three of the collection years. The top 10 predictors for these two iterations were given a score of 1–10, and the summed scores were used to determine the variable ranking 1st (top predictor) – 10th for each collection year, as well as a final variable ranking “all year score” that summed the rankings across all six iterations (two per collection year) conducted.
Supplementary Fig. S3. Correlation matrix for 2007 predictors. A correlation matrix for predictors included in the 2007 Random Forests models is provided to highlight those predictors whose relative variable ranking positions may be less reliable due to correlation with other influential predictors. Only predictors with a correlation coefficient of < −0.499 or > 0.499 are included. The 2007 correlation matrix demonstrates that there are some strongly correlated predictors, particularly in the agricultural predictor category, that may be impacting their relative importance rankings.
Supplementary Fig. S4. Correlation matrix for 2010 predictors. A correlation matrix for predictors included in the 2010 Random Forests models is provided to highlight those predictors whose relative variable ranking positions may be less reliable due to correlation with other influential predictors. Only predictors with a correlation coefficient of < −0.499 or > 0.499 are included. The 2010 correlation matrix demonstrates that there are just a few strongly correlated predictors in the agricultural predictor category. As well as the socio-economic indicator category that may be impacting relative importance rankings.
Supplementary Fig. S5. Correlation matrix for 2016 predictors. A correlation matrix for predictors included in the 2016 Random Forests models is provided to highlight those predictors whose relative variable ranking positions may be less reliable due to correlation with other influential predictors. Only predictors with a correlation coefficient of < −0.499 or > 0.499 are included. The 2016 correlation matrix demonstrates that there are several strongly correlated predictors across the different predictor categories that may be impacting relative importance rankings for the 2016 RF models.
Data Availability Statement
The datasets used in this analysis were modified to remove identifiers and personal information – including the removal of human infection data. These datasets and the complete annotated R-scripts that were used to carry out this analysis are available as supplementary files via Mendeley Data (DOI: 10.17632/rpw8pz3m54.1).