

Abstract
DNA origami (DO) nanotechnology enables the construction of precise nanostructures capable of functionalization with small molecule drugs, nucleic acids, and proteins, suggesting a promising platform for biomedical applications. Despite potential for drug and vaccine delivery, the impact of DO vehicles on immunogenicity in vivo is not well understood. Here, we evaluate two DO vehicles, a flat triangle and a nanorod, at varying concentrations in vitro and with a repeated dosing regimen administered at a high dose in vivo to study early and late immunogenicity. Our studies showed normal CD11b+ myeloid cell populations preferentially internalize DO in vitro. DO structures distribute well systemically in vivo, elicit a modest pro-inflammatory immune response that diminishes over time and are non-toxic as shown by weight, histopathology, lack of cytokine storm, and a complete biochemistry panel at the day 10 end point. Our results take critical steps to characterize the biological response to DO and suggest DO vehicles represent a promising platform for drug delivery and vaccine development where immunogenicity should be a key consideration.
Keywords: DNA origami, biomedical nanotechnology, drug delivery, in vivo, immunogenicity
Graphical Abstract
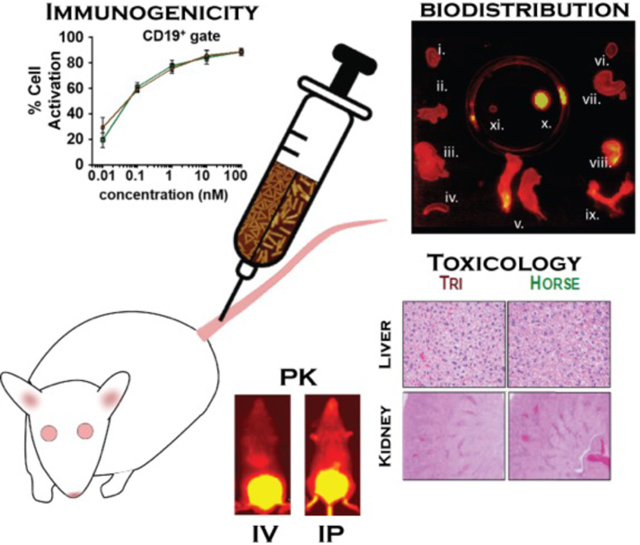
Although DNA origami nanostructures represent an exciting platform for drug delivery, the impact on in vivo immunogenicity at high dose remains unclear. We evaluate the immune response both in vitro and in vivo, and biodistribution profiles generated. DNA origami nanostructures are mildly immunogenic, distribute well, and are non-toxic at the day 10 end point suggesting a promising platform for pre-clinical drug development.
1. Introduction
Nanotechnology-based drug delivery systems offer advantages over conventional approaches including targeting against disease specific cell surface antigens [1], increased drug pharmacokinetic (PK) half-life[2], enhanced tissue and cell-specific delivery efficiencies[3–6], and reduced side effects[1,2,7–9]. However, current nanotechnologies have limitations including reduced dosing due to cardiotoxicity, vascular permeability issues, low payload delivery efficiency to target cells, and slow and/or unpredictable drug release rates[10,11], indicating novel nanotherapeutic strategies are required. DNA-based nanostructures have emerged as a promising candidate to overcome these challenges due to their biocompatibility, precise design, and relative ease of functionalization with drug[12–16] or targeting moieties[5,17–19]. In particular, scaffolded DNA origami (DO)[20] enables unprecedented control over shape and molecular functionalization[20–22], including incorporation of small molecule drugs[12–15,23], targeting moieties[17–19], peptides[24], [25], and nucleic acids[25–27]. Furthermore, DO can exhibit tunable drug loading and release rates[12],[15], circumvent drug resistance mechanisms[13],[15], and has been shown to improve efficacy of small molecule drugs relative to free drug in vivo[14],[23]. Hence, they are highly attractive as a nanocarrier for a variety of therapeutic applications.
Although promising, central questions remain regarding the behavior of DO nanostructures, especially administered at a high dose in vivo. In particular, whether or not DO elicits an immune response in vivo remains uncertain, while features of the immune response remain largely unexplored. It was previously shown that the immune system detects and responds to foreign DNA though pattern recognition receptors (PRRs) that trigger a pro-inflammatory response mediated via the interferon (IFN) pathway[28], which is extensively reviewed in [29]. Yet previous studies suggested DO is non-immunogenic in vivo[14],[19]. However, others showed DO induced a mild inflammatory response in vitro[30],[31] and in vivo[16]. Hence, a better understanding of immunogenicity is a crucial step towards clinical applications of DO. In addition, other basic questions such as tissue toxicity and biodistribution in vivo at the organ system and cell-level in response to a high dose of DO are not well characterized.
To address these challenges, we performed in vivo studies using murine models of immunogenicity and toxicity in a long-term 10-day repeated dosing experiment (intraperitoneal (i.p.), injection), and biodistribution in a short-term single dose experiment both (i.p. and intravenous, (i.v.), injection) with unloaded DO drug delivery vehicles. These experiments were performed at doses that are ~10-fold higher than those previously studied (~1.0 mg/kg)[14],[16],[23] at levels typical in clinical dosing [32],[33]. To gain more detailed insight into the immune response, we performed in vitro experiments in isolated murine cells to study dose-dependent immuneactivation and cell-level DO distribution. For all experiments, we evaluated two DO nanostructures with distinct shapes, a single layer flat-2D triangle (Tri) previously used to demonstrate effective anthracycline drug delivery in a breast cancer model both in vitro[13] and in vivo[14], and 3D-rod-shaped nanostructure, which was shown to effectively deliver daunorubicin to an Acute Myeloid Leukemia cell line model, including circumventing drug resistance[15]. As in the previous study[15], we refer to the nanorod structure as ‘Horse’. Early immunogenicity experiments in vitro showed preferential Tri and Horse DO localization into myeloid cells and clear immune activation in a dose- and time-dependent manner. The high-dose repeat dosing regimen in vivo of unloaded Tri and Horse structures revealed a modest pro-inflammatory immune response that was non-toxic and mostly diminished by the completion of the 10-day dosing regimen. Taken together, our findings suggest that DO nanostructures generate a modest and dose-dependent immune response and are non-toxic; hence, they represent a promising platform for drug delivery or other biomedical applications in vivo such as vaccine development.
2. Results
2.1. Design and Construction of DNA origami nanostructures
Here we compare the in vivo profiles of immunogenicity, biodistribution, and toxicity, of two DO nanostructures that vary in shape. These include a flat single-layer 2D Triangle (Tri), first presented in[20] and a 3D rod-shaped ‘Horse’ DO previously described[15] (Figure 1A, Tables S1–S2). Both DOs were fabricated in thermal annealing reactions scaled up to large volumes (20–80 mls)[32] with scaffold material devoid of endotoxin Figure S1). Each structure was folded with four Alexa750-labeled oligonucleotides to enable live animal imaging. Agarose gel electrophoresis revealed well-folded Tri and Horse and proper incorporation of Alexa750-labeled oligonucletide (Figure 1B, Figure S2). Leading bands were excised and imaged by transmission electron microscopy (TEM) and atomic force microscopy (AFM) to confirm proper folding (Figure 1C). DO in vitro stability was evaluated in 50% FBS (non-heat inactivated) incubated at 37 °C. Time-dependent decreases in structural integrity were observed in Tri, which were mostly degraded by 24 hours (hrs) as indicated by clear degradation products migrating faster on the gel (Figure 1D). Horse DO remained significantly intact, although aggregation was observed in the gel wells at 6 and 24 hrs (Figure 1D), suggesting the compact DO nanorod displayed enhanced stability compared to a flat DO triangle.
Figure 1. Structural evaluation of Triangle (Tri) and Horse DNA origami nanostructures.

(A) Solid model schematic of Triangle (Tri) and Horse DNA origami (DO) nanostructures (top) and color code Tri (brown) and Horse (green) used in the current study. (B) Agarose gel electrophoresis (AGE) post construction of Tri and Horse DO labeled with AlexaFluor(AF)-750 where the lanes are as follows (left to right): 1kb Molecular Weight Ladder, M13mp18 scaffold DNA, Tri-AF750, and Horse-AF750 (top, typhoon gel fluorescence, 640nm excitation; bottom, ethidium bromide, UV excitation). The gel was cropped to show relevant Tri and Horse DO lanes next to each other (original full gel image shown in Figure S2). (C) Gel-purified Tri and Horse DO were subjected to transmission electron microscopy (TEM) and atomic force microscopy (AFM) showing well-formed Tri and Horse DO. (D) To assess structural stability in vitro, Tri and Horse DO were added (1:1) with non-heat inactivated FBS and incubated over a 24-hr time course, followed by PEG-purification and AGE; lanes are as follows (left to right): 1kb Molecular Weight Ladder, M13mp18 scaffold DNA, Tri and Horse DO alone, and Tri and Horse DO incubated with FBS (50% solution) for 0, 1, 2, 6, and 24 hrs. Representative images in (B-D) are shown from at least three independent experiments. Scale bars, 50nm.
2.2. Evaluation of Tri and Horse DO localization to immune cells and early immune activation in vitro
Previous studies showed that DNA nanostructures (non-scaffolded, wire-frame, and DO) elevated pro-inflammatory cytokines in macrophages[33], dendritic cells[34] and splenic mononuclear cells[31] in vitro, and elevated CD69 (an immune activation marker[35]) on dendritic cells and B cells[30]. However, the specific types of immune cells responsible for DO localization and early immune activation of specific cell types remained ill-defined. To address these questions, we cultured murine splenic mononuclear cells with varying concentrations (0.01–100 nM) of Alexa750-Tri and Alexa750-Horse for 24 hrs and used flow cytometry to evaluate localization to immune cell subsets (Figures S3–S5). We observed concentration-dependent increases in the percentage of all cell subsets positive for both Tri and Horse DO (Figure S4A). Horse nanostructures appeared to localize more readily in all cell subsets at 1–10 nM concentrations, while percent DO positive cells remained either comparable or decreased at 100 nM (Figure S4A). Interestingly, the DO median fluorescence intensity (MFI) among the CD11b+ (monocyte and macrophage) cell population also increased in a concentration-dependent manner, while DO MFI among CD11c+ dendritc cells increased in a linear fashion (Figure S4B). No changes in DO MFI were observed in NK1.1+ NK cells, CD19+ B cells, and CD3+/CD4+/CD8+ T cells (Figure S4B).
We also investigated cellular localization kinetics at 100 nM DO concentration via flow cytometry at 1, 5, and 24 hr time points, which revealed significant time-dependent increases in localization of Tri and Horse DO in cell types up to 5 hrs (CD19+ (B cells), CD3+ (T cells), CD4+ T cells) and up to 24 hrs (CD11b+ (monocytes/macrophages), CD11c+ (dendritic cells), NK1.1 (NK cells), and CD8+ T cells) (Figure 2A and Figure S5A). At 24 hrs, the CD11b+ (monocytes/macrophages), CD11c+ (dendritic cells (DCs)), NK1.1+(natural killer (NK) cells), and CD19+(B cells) cell populations all showed similar levels (% Gated) of DO localization, and CD3+ (T cells) cells showed lower amounts of localization. Horse DO was internalized to a significantly greater extent compared to Tri DO among the CD11b+ (at 5 and 24 hr) and CD11c+ (at 5 hrs) cell populations (Figure 2A). Collectively, these findings suggest that Tri and Horse DO are internalized in a concentration and time dependent manner by a variety of immune cell subtypes. Furthremore, CD11b+ myeloid lineage cells (monocytes/macrophages) cells showed the highest percentage of localization and nanorod Horse DO exhibiting preferential localization over the flat Tri DO in CD11b+ myeloid lineage cells and CD11c+ dendritic cells.
Figure 2. Immune cell localization and early immune activation of DO nanostructures in vitro and in vivo.

(A-B) To identify the immune cell subtype(s) responsible for internalizing DO nanostructures in vitro and whether early immune activation occurred, splenic mononuclear cells were cultured with either PBS+ or AF750-labeled Tri and Horse DO (100nM) for 1, 5, and 24 hrs followed by flow cytometry to assess the level of (A) AF750-DO and (B) BUV395-anti-CD69 fluorescence among the CD11b, CD11c, NK1.1, CD19, and CD3 immune cell populations. The percentage of cells positive for DO and CD69 are expressed as (A) mean DO-AF750 % Gated ± SEM and (B) mean BUV395-CD69 % Gated ± SEM and represent three independent experiments. (C) Schematic created with BioRender.com showing intraperitoneal (i.p.) and intravenous (i.v.) injection routes for biodistribution, and early immune activation experiments in vivo. (D) To address early immune activation in vivo, peripheral blood was collected from female ICR mice previously injected (i.v. tail vein/n=5–6/group) with either PBS+2.5mM MgCl2, Tri, or Horse DO (~12.0mg/kg) at 2 hrs post injection and analyzed by flow cytometry for the level of CD11b expression on CD45+ cells (histogram, % Gated) dot plots (side scatter vs. CD11b) shown in Figure S15 Stats, two-way ANOVA followed by Tukey’s Multiple Comparisons test where statistical differences are shown between groups. *, p≤0.05; **, p≤0.01; ***, p≤0.001; ****, p≤0.0001
We also monitored early immune activation by measuring CD69, a well-known indicator of early immune cell activation across various immune cell subtypes[35] and also studied in a previous DO report[30]. We implemented the well-established immune stimulant, CpG-ODN[36],[37] to confirm CD69 as an appropriate indicator of early immune activation in peripheral blood (Figures S6–S7). Clear CD69 surface level increases relative to PBS+ treated controls were observed in all cell types and to a lesser extent in CD8+ T cells perhaps due to the level of low CD8+ T cell number in perpheral blood (Figure S7). To address immune cell specific early activation by DO, we used flow cytometry to quantify CD69 surface levels after incubation with Tri and Horse DO nanostructures for 24 hrs at varying concentrations (gating scheme Figure S8). Tri and Horse DO-induced concentration dependent increases were seen in both the amount (% Gated) of the monocytes/macrophages, DCs, NK cells, B cells, total and CD4+, and CD8+ T cells positive for CD69 (Figure S9A) as well as the level (MFI) of CD69 expressed on the surface (Figure S9B), although CD69 levels elevated modestly in T cell populations (Figures S9A and S9B). Interestingly, CD4+ T cells showed a significant decrease in CD69 levels (% Gated) when treated at the highest concentration of 100 nM Horse DO relative to the 10 nM treatment, suggesting a dose response with maximum activation of CD4+ T cells in the ~10 nM range. CD4+ T cells exhibited a similar dose-response trend in response to Tri DO, and CD8+ T cells also exhibited a similar trend in response to Horse and Tri DO, although these changes were not significant (Figures S9A and S9B). This saturation of CD69 activation has been observed in response to other immunogens [38,39], and in the case of DO it is possible that the relatively large structures sterically interfere with cell recognition systems at high concentrations. However, the surface density of CD69 molecules (MFI) remains unchanged (Figure S9B) suggesting a modest T cell response.
We also tested the kinetics of immune activation at 100 nM DO concentrations. Tri and Horse DO induced significant time-dependent increases in CD69 relative to PBS treated controls for all cell subsets (Figure 2B and Figure S5B) with the greatest percent positive cell population being B cells followed by DCs, monocytes/macrophages, NK cells, and total T cells (Figure 2B). While Tri and Horse DO increased the percentage of cells positive and levels of CD69 comparably for most cell types, Horse DO significantly increased the percentage of CD69+ monocytes/macrophages (CD11b+) relative to Tri DO at 24 hrs (Figure 2B). This is consistent with the stronger localization of the Horse structures in these cells (Figure 2A). Although Tri and Horse DO localized to the highest level in monocytes/macrophages, the strongest early immune activation via CD69 elevation occurred in the B cell population. With respect to CD69 elevation kinetics across all cell types, increases were observed beginning at 5 hrs and increased further up to 24 hrs. An exception was observed in T cells, which did not show an activation response until 24 hr (Figure 2B). This is logical since DO localization increases were observed beginning at 1 hr post DO treatment (Figure 2A) allowing for cellular recognition mechanisms to trigger gene expression and surface elevation of CD69 indicating early immune activation. Collectively, these findings suggest that Tri and Horse DO are recognized by a variety of immune cell subtypes both in a concentration and time dependent manner to elevate the early activation antigen CD69. Interestingly, myeloid lineage cells exhibited shape-dependent localization of DO and monocytes and macrophages, in particular, exhibited shape-dependent early immune activation.
2.3. Biodistribution and Early Immune Activation of Tri and Horse DNA origami nanostructures in vivo
Our in vitro results revealed DO localization and immune cellular activation is dose and time-dependent, with a high concentration of DO eliciting robust activation of several immune cell types. Hence, we moved toward monitoring DO immunogenicity at a high dose in vivo. Previous studies have shown PEG-coated, liposomal encapsulated[31] and oligolysine positively-charged peptide protected[40] DO nanostructures increase PK elimination half-lives in vivo upon tail vein injection of fluorophore-labeled DO at moderate doses. However, DO nanostructure early immunogenicity and biodistribution at a high dose (12.0mg/kg) administered via both i.v. and i.p. routes in vivo are not well-characterized.
Alexa750-labeled (four labeled oligonucleotides per DO nanostructure) Tri, and Horse DO, Alexa750 oligonucleotides alone, and PBS + 2.5mM MgCl2 were injected either i.p. or i.v. (n=3 mice/treatment) into ICR mice (Figure 2C). Mice were anesthetized and were subjected to immediate live animal imaging where images were collected at 50 minutes (mins) and 100 mins (i.v. and i.p. route) or 120–220 mins (i.p. route), every 50 mins, to confirm effective distribution into the periphery (Figures S10). Alexa750 oligonucleotides, and Alexa750-labeled Tri and Horse DO were observed in the periphery immediately upon i.v. injection and at 50 min post i.p. injection (Figures S10A and S10B).
Mice were then euthanized and major organs, blood, and urine were collected and imaged on an IVIS system to elucidate biodistribution profiles (Figure S11; statistical considerations Figures S12–S14). At 2 hrs post i.v. injection, the Alexa750-labeled Tri and Horse DO were localized mainly to the urine, kidneys, and the liver with the majority of signal observed in the urine (Figure S11, top right). At 2 hrs post i.p. injection, the highest amount of Alexa750 oligonucleotides, and AlexaFluor750-labled Tri and Horse DO were observed in the urine, reproductive organs, kidneys, stomach, spleen, and liver and no observable signal was detected in the blood and brain (Figure S11, bottom left). At 4 hrs post i.p. injection, the highest Alexa750 signal was observed in the urine (increased relative to 2 hrs), kidneys, stomach, liver, spleen, and reproductive organs (all decreased relative to 2 hrs) (Figure S11, bottom right). Interestingly, Tri DO was evident at significantly higher levels relative to Horse-DO upon i.v. injection in the spleen (Figures S11–S12; p = 0.0468), and trended higher (although not significant) in other organs including the liver, kidneys, and blood (Figure S11, top right, Figure S12). These results indicate the flat Tri DO accumulate to a greater extent in the spleen (and possibly other organs) relative to 3D Horse DO upon i.v. injection. No statistically significant differences in biodistribution were observed between Tri DO and Horse DO at 2 hr or 4 hr when post i.p. injection (Figures S13–S14). However, Tri DO trended to higher levels than Horse DO in the liver and spleen at both timepoints, and Horse DO trending higher in the urine at 2 hr (Figure S11, bottom left and bottom right, Figures S13–S14). These trends suggest a potential shape-dependent distribution upon i.p. injection. Taken together, these findings suggest that Tri and Horse DO administered at a high dose (12.0 mg/kg) via both the i.v. and i.p. injection routes distribute well into the periphery and throughout many major organ systems. Furthermore, our results suggest the DO nanoparticle structure is important for prolonging retention compared to free oligonucleotides and that localization and clearance are shape dependent when structures are administered via i.v. injection, and possibly also via i.p. injection.
Subsequent to biodistribution imaging sessions, samples were collected from peripheral blood (Figure 2D and Figures S6, S15–S19), splenic mononuclear cells (Figures S3, S8, S20–S22), and bone marrow (Figures S23–27) to assess the level of DO nanostructure accumulation/cellular localization, early immune activation, and influence on immune cell expansion/differentiation via Flow Cytometry among various immune cell subtypes including: monocytes/macrophages, dendritic cells, NK cells, B cells, and total and CD4+, and CD8+ T cells. These findings indicate that Tri and Horse DO administered via i.v. induce an early immune activation response in vivo as indicated by significantly elevated CD69 levels in all immune cell subtypes in peripheral blood. Interestingly, we also observed significant elevation of CD69 levels in the bone marrow in response to Horse DO nanostructures, with NK cells and T cells exhibiting activation at 2 hrs with i.v. administration, and dendritic cells and B cells exhibiting activation at 4 hrs with i.p. administration (Figure S26). Collectively, these results confirm early immune activation occurs in vivo (consistent with our earlier in vitro results) and suggest the immune response profile and kinetics are dependent on DO shape and route of administration.
2.4. Immunogenicity Profile of Tri and Horse DNA origami nanostructures in vivo
While several prior studies reported a lack of an immune response against non-drug loaded DO in vivo [14,19], another revealed a pro-inflammatory non-specific immune response[16], although it was dampened by liposomal encapsulation[31]. Therefore, whether or not DO induces an immune response upon a high dose of DO in vivo (12.0 mg/kg) and the type of potential immune response (innate or adaptive) remained uncertain. Furthermore, the effects of repeated DO dosing, an approach used to deliver many chemotherapeutics, including doxorubicin[14], on the immune response remained poorly understood. Therefore, we designed a repeat dosing regimen of DO (5 i.p. injections at 48-intervals over a 10-day time course) with blood collection time points of high immunological relevance with respect to innate, non-specific, inflammatory responses (day 1, day 3, day 5, day 10) as well as specific adaptive immune responses (day 10) (Figure 3A). Potential immunogenicity was evaluated by immune cell expansion (Figure 3B, Figure S28) and accumulation of pro-inflammatory cytokines, chemokines, and T-cell mediators in the periphery (Table 1, additional detail in Tables S3 and S4, and statistical considerations, Figures S32–S35). Female ICR mice received the following treatments (single i.p. injections) on days 0, 2, 4, 6, and 8: PBS+2.5mM MgCl2, CpG-ODN 2395[36,37]; p7249 M13mp18 bacteriophage DNA; Tri-Alexa750; and Horse-Alexa750 (Figure 3A). Only female mice were used in immunogenicity studies as the introduction of agressively dominant male mice can create a stress-induced immune reaction[41], which could mask treatment induced immune responses. Peripheral blood was collected on days 0, 1, 3, 5, and 10 post initial i.p. injection for complete blood count (CBC), and plasma cytokine/chemokine analysis, while peripheral blood and splenic mononuclear cells were analyzed on day 10 by Flow Cytometry. In addition, plasma IgM and IgG antibody level on day 10 relative to pre-injection baseline were compared.
Figure 3. Immunogenicity evaluation of Triangle and Horse DNA origami nanostructures in vivo.

(A) Experimental design schematic; female ICR mice were subjected to a repeat-dosing regimen: 5 total injections administered (i.p.) at 48-hr intervals over a 10-day time course with the following treatment groups: (PBS+2.5mM MgCl2, (n=4) (blue); CpG-ODN (10μg, n=5) (red); M13mp18 (6.0mg/kg, n=7); (yellow) AF750-Tri DNA origami (DO) (12.0mg/kg, n=7) (brown); and AF750-Horse DNA origami (12.0mg/kg, n=7) (green). The number of animals chosen for each treatment group was suggested by previous statistical power analysis results. The lower animal numbers represent control conditions previously studied, where the higher numbers represent experimental treatment groups. Peripheral blood was collected for complete blood counts (CBCs) and plasma cytokine levels on days 0, 1, 3, 5, and 10. On day 10 (endpoint) peripheral blood was also collected for plasma antibody levels via ELISA. Peripheral blood and splenic mononuclear were analyzed via flow cytometry (Figures S29–S31). (B) CBC analysis of white blood cells (WBCs) right, monocytes (middle), and lymphocytes (right) where dashed lines represent upper and lower normal range boundaries. (C) IgM ELISA of paired samples (Tri DO, n=3; Horse DO, n=4) on days 0 and 10; arrows indicate injection (i.p.) days. The data in (B) are expressed as mean cell number/volume ± SEM (C) single paired samples (line) IgM (μg/ml) from Tri and Horse DO. Stats, (B) two-way ANOVA followed by Tukey’s Multiple Comparisons test (C) paired t test where statistical differences are shown between groups. *, p≤0.05; **, p≤0.01; ***, p≤0.001
Table 1. Plasma cytokine evaluation of Triangle and Horse DNA origami nanostructures in vivo.
Female ICR mice underwent a repeat dosing regimen with treatment groups described in Figure 3A. Plasma isolated from peripheral blood collected on days 0, 1, 3, 5, and 10 was analyzed for a panel of cytokine/chemokine levels including inflammatory mediators (IFN-γ, IL-1β, IL-6, IL-10, IL-12(p70), TNF-α) chemoattractants (MCP-1, MIP-2, MIG) and T-cell cell mediators (IL-2, IL-5, IL-17); (IL-4 and IL-9 are shown in Tables S1–S2) via the Milliplex Magnetic Cytokine array.

|
The data are expressed as a heat map mean Fold Change relative to day 0 for each cytokine/chemokine: gray (0.0–1.0, little to no change); yellow (1.01–2.0, mild response); orange (2.01–4.0, intermediate response); red (>4.01, strong response).
Differential complete blood count analysis revealed that while CpG-ODN-treated mice contained elevated levels of total white blood cells (WBCs) above the normal range by day 3 and decreased by day 5, all other treatment groups possessed WBC levels within the normal range (Figure 3B). Monocyte levels within all treatment groups were elevated above the normal range on day 5 except for PBS treated mice, with all treatment groups displaying normal monocyte levels by day 10 (Figure 3B). In addition, CpG-ODN-treated mice had modest elevations of lymphocytes (Figure 3B), neutrophils, eosinophils, and basophils on day 3 and elevated levels of eosinophils and basophils on day 10; and, all other treatment groups displayed cell densities within the normal range (Figure S28). While Tri and Horse DO did not appear to induce an immune response globally at the total WBC level, monocyte expansion suggests the induction of a pro-inflammatory response. To extend our CBC findings, on day 10 both peripheral blood and splenic mononuclear cells were analyzed by Flow Cytometry for populations of myeloid cells, as well as populations and activation status of T and B-lymphocytes (Figures S29–S31), which in summary showed no increase in cell percentages relative to PBS controls with the exception of significantly increased peripheral blood CD8+ effector cells among mice treated with CpG-ODN (Figure S28). Collectively, these findings suggest a modest pro-inflammatory response was mounted by mice treated with CpG-ODN, p7249, and both DO-treatment groups that diminished, albeit not completely by day 10.
In order to evaluate immunogenicity at the molecular level, a panel of pro-inflammatory cytokines, chemokines, and T-cell mediators was evaluated by the Milliplex Cytokine/Chemokine array (Table 1, additional details in Tables S3 and S4 and Figures S32–S35). Significant elevations of IFN-γ and MIG were observed among CpG-ODN treated mice, while a similar trend was evident among p7249, Tri, and Horse DO, although the response was moderate. Interestingly, both Tri and Horse DO cytokine profiles were distinct from CpG and p7249. The Tri DO response more closely resembled the p7249 response, which could be due to faster degradation in biological media as suggested by stability tests in FBS (Figure 1D). Importantly, many elevated factors from p7249, Tri, and Horse DO treated mice decreased to at or below day 0 baseline levels by day 10 (i.e. no significant increases on day 10 relative to day 0).
Additionally, we assessed plasma IgM and IgG antibodies levels via ELISA. IgM levels significantly increased (Tri, p = 0.0433; Horse, p = 0.0154) in mice treated with DO on day 10 relative to baseline levels on day 0 (Figure 3C and Table S5) suggesting recognition by the B cell population in non-specific manner, which is consistent with the early activation of B cells in peripheral blood (Figure S18). These findings suggest a pro-inflammatory response occurred in response to DO and mostly diminished by day 10, with the exception of several factors that remained elevated (PBS+ (1 factor); CpG-ODN (5); M13mp18 (4); Tri DO (1); Horse DO (3)) that remained slightly elevated relative to baseline at day 10; however the elevations that remained on day 10 were not statistically significant relative to the day 0 baseline (Figures S33–S35). Interestingly, cytokine profiles were clearly different between Tri and Horse DO nanostructures with an apparently stronger response observed in Tri DO treated mice, indicating a shape-dependent immune response.
2.5. Toxicological evaluation of Tri and Horse DNA origami nanostructures in vivo
Although previous work showed unloaded DO nanostructures injected i.v were non-toxic in vivo, including both a single bolus[31], a repeat 3-day dosing schedule[14], using a thrombin-loaded tube shaped DO nanostructure[19], and a rectangle DO nanostructure of a single dose[42], whether or not a large dose of DO alone (12.0 mg/kg; ~500nM) was toxic in vivo remained unknown. Concomitant to monitoring immunogenicity upon a repeat DO nanostructure-dosing regimen that included i.p. injections at 48-hr intervals over a ten day time course, described in (Figure 3A), we evaluated toxicological profiles. Each animal was weighed daily to monitor overall health and potential toxicity. A transient decrease in weight (≲ 5%) among mice from all treatment groups out to day 3 was evident followed by stabilization in weight (Figure 4A); however, no statistically significant differences were observed among treatment groups relative to the PBS control group. On day 10, animals were euthanized and major organ systems were harvested from a subset of mice (PBS; Tri DO; Horse DO; n=3 mice/treatment group) and subjected to fluorescent imaging via IVIS to evaluate potential DO accumulation. Organs from DO treatment mice showed comparable levels of background signal to PBS treated mice suggesting a lack of DO accumulation in major organ systems (Figure S36).
Figure 4. Toxicology evaluation of Triangle (Tri) and Horse DNA origami nanostructures in vivo.

Female ICR mice were subjected to a repeat-dosing regimen as described in Figure 3: 5 total injections administered (i.p.) at 48-hr intervals over a 10-day time course with the following treatment groups: (PBS+2.5mM MgCl2, (n=4); CpG-ODN (10μg, n=5); M13mp18 (6.0mg/kg, n=7); AF750-Tri DNA origami (DO) (12.0mg/kg, n=7); and AF750-Horse DNA origami (12.0mg/kg, n=7). (A) Weight was monitored daily and expressed as weight (g) ± SEM. (B) Histopathology liver and kidney sections at endpoint (day 10) where arrows indicate mild hepatic necrosis (heart, uterus, and urinary bladder sections shown in Figure S37) where a representative image is shown from n=4 mice/treatment group, (20X magnification). (C) Complete biochemistry panel monitoring liver/kidney function: Albumin (ABL), Alanine Aminotransferase (ALT), Aspartate Aminotransferase (AST), Total Protein (TPROT), Glucose (GLU), Total Bilirubin (TBIL), Blood Urea Nitrogen (BUN), and Creatinine (CREAT). Dashed lines represent upper bound of normal range. The data are expressed as mean (parameter concentration) ± SEM from n=4 mice/treatment group. Stats, (A) two-way ANOVA followed by Tukey’s Multiple Comparisons test and (C) one-way ANOVA followed by Dunnett’s Multiple Comparisons test where statistical differences are shown relative to the PBS+ treated mice. N.S., not significant; *, p≤0.05; **, p≤0.01
In addition, on day 10, whole mice were fixed in 10% neutral buffered formalin for histopathology evaluation. They were examined grossly and microscopically, and tabular results are reported (Table S6). Representative images from H&E stained tissue sections from the liver and kidney are shown in (Figure 4B), where mild hepatic necrosis lesions are identified by arrows in the liver sections from mice treated with CpG-ODN. Tissue sections from the heart, uterus, and urinary bladder sections are shown in (Figure S37). Additionally on day 10, serum was analyzed via a Comprehensive Biochemical Panel (Figure 4C and Figure S38). All DO treatment groups displayed mean values of biochemical parameters either at or below the upper normal bound[43,44] with no significant difference between groups. The free p7249 scaffold (M13mp18) treated mice showing elevated levels of TBIL, suggesting potential liver effects of the unstructured ssDNA scaffold (Figure 4C). However, all treatment groups reduced ALT levels relative to PBS+ treated mice, although the difference was not statistically significant and low levels typically indicate healthy liver function, since elevated ALT levels suggest liver injury[45] (Figure 4C). All treatment groups decreased levels of BUN, where CpG-ODN, p7249 (M13mp18), and Horse were significant relative to PBS+ treated mice albeit a non-toxic result, while CREAT levels remained unchanged (Figure 4C), likely indicating healthy kidney function [46–48] Taken together, these multiple lines of toxicological evidence (weight, histopathology, biochemical panel, and lack of cytokine storm) indicate that Tri and Horse DO nanostructure treatments alone in vivo are non-toxic in response to repeat dosing at a high dose of 12.0mg/kg.
3.0. Discussion
To explore the potential of non-drug loaded DO nanostructures as a viable therapeutic or vaccine delivery vehicle, we generated immunogenicity, biodistribution, and toxicity profiles of DO administered both i.v. and via i.p. route in vivo, comparing a flat single layer-2D Triangle (Tri) DO nanostructure[20] with a compact, multi-layer 3D rod-shaped ‘Horse’ DO previously described[15]. Biodistribution findings showed DO distribute throughout the periphery both via i.v. and i.p. injection. In particular, our demonstration of i.p. injection establishes an administration route previously not well understood. Furthermore, future studies will focus on profiling the subcutaneous and intramuscular administration routes, which would be particularly important for applications like vaccine delivery. Interestingly, DO biodistribution appeared to be shape dependent with the Tri DO nanostructure accumulating in multiple organs. This is consistent with a previous study that showed triangle shaped DO demonstrated optimal tumor passive targeting accumulation compared to both a square and tube shaped DO[14]. Additionally, DO administration route affected both the kinetics and level of the immune response, in particular in peripheral blood. This is supported by increased CD11b+ cell populations at 2 hrs post i.v. injection, a response not observed until 4 hrs post i.p. injection (Figures S15, S19), suggesting the requirement for a longer amount of time for DO to induce an immune response. Furthermore, while DO i.v. administration allowed for significant CD69 cell surface elevation by all major immune cell subsets in peripheral blood (Figure S18), DO i.p. administration likely allowed for a prolonged DO release from the lymphatic system into the periphery, which may explain the weaker and non-significant CD69 elevation among peripheral blood immune cells (Figure S18). At a cellular level, myeloid lineage cell populations preferentially internalized DO nanostructures in vitro and in vivo, with rod-shaped Horse nanostructures being more readily internalized compared to Tri DO nanostructures. This is consistent with prior work showing DOnanostructures were effectively internalized in vitro by both immune cells of high granularity[31] and by dendritic cells where more compact DO nanostructures were more readily internalized[40]. Furthermore, our results suggest DO are an attractive option for applications targeting myeloid lineage cells, such as drug delivery vehicles for acute myeloid leukemia[15] or related myelodysplasia.
Previous reports evaluating DO toxicity showed animal weight and histopathology were unaffected by a triangular DO nanostructure repeat tail-vein dosing regimen in vivo[14], using a thrombin-loaded tube shaped DO nanostructure[19], and a rectangle DO nanostructure[42] at small estimated doses <1.0mg/kg. The lack of weight change and histopathologic lesions upon high dose DO administration (12.0 mg/kg) in the current study are consistent with this previous work[14,19,42], although differing in administration routes (i.p. vs. i.v.). In contrast, non-drug loaded DO at a high concentration (100 μg/ml) induces cytotoxic and cytostructural effects on liver organoids in vitro [23], perhaps explained by a fixed concentration of DO that is not constantly decreasing in an in vitro environment vs. in vivo. In our studies, evaluating liver and kidney function via a complete biochemistry panel suggested normal liver and kidney function (Figure 3C), consistent with other previous work[42].
As a key step towards clinical applications, we focused on elucidating DO activation of immune response by combining: 1) in vivo characterization in repeated dosing experiments at cellular (complete blood counts) and molecular (cytokine analysis); 2) short-term in vivo characterization upon single dose (complete blood counts and CD69 activation); and 3) concentration and time-dependent in vitro studies characterization (complete blood counts and CD69 activation). Our repeat dosing regimen of unloaded Tri and Horse DO nanostructures in ICR mice in vivo administered at a high dose revealed a clear, modest pro-inflammatory response at both the cellular and molecular levels, where the pro-inflammatory response mostly subsided by day 10 suggesting effective immunity. Furthermore, early immune activation in response to DO in the periphery suggested a clear early immune activation phenotype. Findings in the current study upon repeat dosing in vivo showed a strong induction of both IFN-γ and MIG among CpG-ODN treated mice, and a similar trend, although much less pronounced, among mice treated with p7249, Tri, and Horse DO (Table 1, additional details in Tables S3 and S4 and Figures S32–S35). The induction of MIG suggests that the immune system responded to all forms of foreign DNA treatment groups. And, therefore, may be actively promoting immune cell proliferation and differentiation, chemotaxis, and tissue extravasation in vivo, all well-defined roles of MIG[49].
Non-specific pro-inflammatory findings in vivo presented here are consistent with previous work that showed an early increase at 6 hrs in the pro-inflammatory cytokine, IL-6 in vivo in response to a single low dose (<1.0mg/kg) of DO[16]. In contrast, other studies showed mice injected with a low dose of DO (0.08mg/kg) i.v. had comparable levels of WBCs[14] and pro-inflammatory cytokines[19,42] relative to control mice. Our in vitro studies show a clear concentration dependence of early immune activation suggesting inconsistencies as to whether DO is immunogenic in vivo are likely due to dosing level differences. In addition, the use of ICR outbred mice in the current study compared to previously reported inbred strains, or monitoring pro-inflammatory markers at differing time points may also explain observed differences. Nevertheless, multiple lines of evidence in the present study suggest that DO-nanostructures are capable of inducing a modest, non-specific pro-inflammatory immune response both in vitro and in vivo. Importantly, these results clearly indicate a lack of cytokine storm (Table 1 and Table S1), suggesting the immune response mounted against Tri and Horse DO in vivo was non-toxic at the day 10 end point. The observed pro-inflammatory immunogenic profile, which diminished over time, albeit not completely is promising; and the acute inflammatory mechanisms may allow for the activation of productive immune responses, for example to induce anti-tumor immunity.
Our findings demonstrate that DO induces a modest, non-specific immune response, yet the mechanisms of DO recognition by immune cells require further investigation. Toll-like Receptor 9 (TLR9) is the receptor mostly commonly associated with detection of foreign DNA[50]; TLR9 activation has been proposed by Palazzolo, et. al[16] to be responsible for immunogenicity of DO. However, Schuller et al.[30] showed DO nanostructures alone and conjugated with CpG elevated CD69 on DCs and B cells in both WT and TLR9-deficient cells[30], suggesting potential TLR9-independent recognition. Early immune activation experiments in the present study in vitro and in vivo showed significant elevation of CD69 suggesting that DO induces immune cell activation mechanisms. However, the long-term impact of CD69 elevation as it relates to a potential autoimmune phenotpye remains unknown and would be an important consideration for further evaluation of the safety of DO.
4.0. Conclusion
Here, we observed an immune response to DO in vivo that was distinct from CpG oligonucleotide and p7249 control treatments suggesting the immune response is distinct from a TLR9-induced foreign DNA response. Furthermore, the difference in the cytokine profile between Tri and Horse DO revealed a shape-dependent immune response. This could be due to differences in processing (i.e. degradation), due directly to interactions in vivo that depend on higher order structure of DNA assemblies, such as differences in DO surface area or what sequences are exposed on the surface, which could impact immune cell recognition mechanisms. These results suggest that different shapes may be better suited to different applications in vivo. Moving forward, further work to elucidate DO recognition mechanism(s) by the immune system is necessary to guide therapeutic applications. Other important factors to consider will be to improve DO stability in vivo, for example via addition of PEG as previously described[40,51] and payload targeting to diseased cells via cell surface receptor targeting moieties[19,52], and this work can provide a framework to study biological response to these modified DO structures. In conclusion, our findings suggest that DO nanostructures represent a promising novel platform for future cancer drug delivery and vaccine development studies in vivo when administered at a high dose.
5.0. Experimental Section/Methods
DNA origami nanostructure fabrication.
‘Rothemund’ triangle (Tri) (100 nm × 100 nm × 100 nm (each of three sides/end-to-end distance) 2.2 nm (height) and rod-shaped ‘Horse’ (~92.5 nm (end-to-end distance) × ~13.2 nm (width) × ~11 nm (height)) DO were designed using caDNAno software[53] where unmodified nanostructures were adopted prior work[15,20]. Complete oligonucleotide staple lists are shown in (Tables S1 and S2). DO nanostructures were constructed according to protocols previously defined in[21] and scaled up according to procedures developed in[32]. Briefly, a 7249 base M13mp18 ssDNA scaffold was placed in solution at 100 × 10−9m in a buffer containing 5 × 10⁻³m Tris, 5 × 10⁻³m NaCl, 1 × 10⁻³m EDTA, 20 × 10−3m MgCl2, and 208 (Tri DO) and 165 (Horse)oligonucleotide staple strands each in a 5-fold (unlabeled) or 2.5-fold (Alexa750labled oligonucleotides) (Integrated DNA Technologies, Coralville, IA) molar excess relative to scaffold. Reactions were carried out in 20–80 ml volumes that were heated on a hot plate at 65–70 °C for 20–30 mins before being placed at 52 °C for 4 hrs in a water bath[32]. Reactions were then placed in an ice-water bath for 15 mins before being stored at 4°C. Folded nanostructures were purified either by gel electrophoresis or centrifugation in the presence of PEG. For gel electrophoresis, structures were subjected to 2% agarose gel electrophoresis (0.5× TBE) in the presence of 11 × 10−3m MgCl2 where gels were stained with either ethidium bromide or imaged via Typhoon scanning (General Electric, Boston, MA) Bands containing well-folded structures[21] were excised from the gel, and nanostructures were extracted from the agarose bands via centrifugation with “freeze ‘N squeeze” purification tubes (BioRAD, Hercules, CA). Gel-purified nanostructures were visualized via TEM and AFM according to previously established protocols[15,21]. Nanostructures used for all experiments were purified by centrifugation in the presence of PEG, unless otherwise noted. Tri and Horse DNA origami nanostructures were mixed with equivolume amounts of 15% PEG 8000 (Sigma–Aldrich, St Louis, MO) and centrifuged for 25 min at 16 000× g at room temperature to remove excess staple DNA strands[54]. Pelleted structures were then resuspended in 1× PBS (Gibco, Life Technologies, Carlsbad, CA) supplemented with 2.5mM MgCl2 where the purpose of the MgCl2 is to stabilize DO nanostructures in aqueous solution. While DO are stable for at least several hours in PBS, adding 2.5 mM MgCl2 improves longer term stability. PBS was used instead of saline to match the buffer conditions of the resuspended Tri and Horse DO nanostructures. Nanostructure concentrations (molar) were determined by UV absorbance measurements (280nm) on a Nanodrop 2000 (ThermoFisher Scientific, Waltham, MA), and were typically ~500–600 nM after resuspension in PBS+2.5mM MgCl2. Tri and Horse stability was assessed in 50% fetal bovine serum (Atlas Biologics, Fort Collins, CO) in 1X PBS resuspended in 200 μL and allowed to incubate in a humidified atmosphere containing 5% CO2 at 37 °C for 0, 1, 2, 6, and 24 hrs followed by PEG-mediated precipitation[32] and evaluation via agarose gel electrophoresis as previously described.
Transmission Electron Microscopy.
TEM grids pre-coated with carbon and formvar (Electron Microscopy Sciences, Hatfield, PA) were prepared for negative stain imaging as previously described[15,21]. Tri and Horse DO nanostructures were imaged on a Tecnai G2 BioTWIN transmission electron microscope (FEI, Hillsboro, OR) at an electron acceleration voltage of 80kV.
Atomic Force Microscopy.
AFM mica discs were prepared as previously described[15]. Tri and Horse DO nanostructures were imaged by a Bruker AXS Dimension Icon atomic force microscope in ScanAsyst mode (Bruker Corporation, Billerica, MA). Images were collected using a ScanAsyst-Air silicon nitride cantilever (spring constant = ~0.79 N/m) and nominal tip radius of 2nm.
Animals.
Female, pathogen-free outbred ICR mice were obtained from (Envigo RMS, Indianapolis, IN) and were housed in American Association Accreditation of Laboratory Animal Care (AAALAC)-accredited Animal Research Facility at The Ohio State University (Columbus, OH) and approved by the Institutional Animal Care and Use Committee (IUCAC) under the protocol number, 2015A00000043. All mice were provided autoclaved food and deionized water ad libitum and used at 8–10 weeks of age. For biodistribution experiments, mice were provided autoclaved food devoid of alfalfa (Envigo RMS, Indianapolis, IN) to prevent auto-fluorescence under 750nm laser excitation[55].
DO localization and early immune activation in vitro cell culture.
Spleens were harvested from female ICR mice followed by homogenization into a PBS solution followed by RBC lysis (1X RBC Lysis Buffer, eBioscience, San Diego, CA) treatment according to manufacturer’s instructions. Splenic mononuclear cell suspensions were washed twice in 1X PBS followed by cell counting and resuspension at 1 × 10⁷/ml in complete RPMI 1640 (CellGro, Manassas, VA) with 10% heat inactivated fetal bovine serum (FBS) (Atlas Biologicals, Ft. Collins, CO), 100 U mL−1 penicillin (Gibco, Life Technologies, Grand Island, NY), 100 μg mL−1 streptomycin (Gibco), 2 × 10⁻³m l ‐glutamine (Gibco), and 2-mercapto ethanol (50μM) (Sigma). Cells were maintained in a humidified atmosphere containing 5% CO2 at 37 °C. Cells were cultured at 2–5 × 10⁶/ml and treated with various concentrations (0.01, 0.1, 1.0, 10.0, or 100nM) of Alexa750-labeled Tri or Horse DO for 1, 5, or 24 hrs. The percentage of monocytes/macrophages, dendritic cells, natural killer cells, B cells, T cells, T helper cells, and cytotoxic T cells positive for Alexa750-DO and early activation marker, CD69 was determined by Flow Cytometry. Control experiments to evauate internalization vs. cell surface binding were performed culturing splenic mononuclear cells with DO for 24 hrs followed by DNAse I treatment at manufacturer recommended concentrations. Comparable levels of DO-AF750 were observed in the presence or absence of DNAse I (data not shown).
Live Animal Imaging for Biodistribution.
ICR mice were injected i.p. or i.v. with the following treatments (PBS+2.5mM MgCl2 (100μl); Alexa750 labeled oligonucleotides (2μM, 100μl) Tri and Horse DO (~500nM, ~12.0mg/kg) where all DO were labelled with 4-incorporated Alexa750-labeled oligonucleotides. Animals were subjected to live animal imaging either immediately (i.v. and i.p. 0–100 min imaging groups) or after 2 hrs (i.p. 120–220 min imaging group) under 2% isofluorane anesthesia on an CaliperTM IVIS Lumina II (PerkinElmer, Waltham, MA) at 50-minute time intervals (n=3–6 mice/treatment group). Imaging parameters were set as follows: 750nm laser excitation/780nm laser emission filter; F/Stop = 1.2; height (max) = 1.98cm; exposure = 4.0 seconds; lamp = high; binning = medium; photo (F/Stop) = 1.2. Imaging data was processed and analyzed via Living Image Software (PerkinElmer). Upon completion of each imaging session, mice were euthanized via CO2 inhalation and major organ systems (brain, lungs, liver, spleen, heart, stomach, kidneys, reproductive (uterus and fallopian tubes), bone marrow (hind legs)) and urine and peripheral blood were collected and imaged for DO organ distribution. Subsequently, peripheral blood, spleens, and bone marrow from each animal was collected and analyzed for potential immune cell localization and early activation by Flow Cytometry.
Flow Cytometry.
Flow Cytometry was performed on a Fortessa Flow Cytometer (BD Biosciences) on samples from mouse peripheral blood, processed splenic mononuclear cells, and bone marrow samples according to previously established protocols[56,57]; The following panels were designed to characterize B/T cell populations and activation status, myeloid cell populations, and a DO-localization early immune activation panel that included major immune cell subset markers. The following antibodies were used to stain immune cell surface markers: (myeloid cell panel): BUV395-anti-NK-1.1 (PK136) (BD Bioscience), FITC-anti-CD11b (M1/70), Brilliant Violet 421™-anti-Ly-6C (HK1.4), APC/Fire750-anti-Ly-6G (1A8), APC-anti-CD27 (LG.3A10), Brilliant Violet 785™-anti-Ly-6A/E (Sca-1) (D7), PE/Dazzle594-anti-c-KIT (CD117) (2B8), Brilliant Violet 711™-anti-CD45.1 (A20), AF700-anti-CD45.2 (104) (BioLegend); LIVE/DEAD® Fixable Aqua Dead Cell Stain Kit (Life Technologies, ThermoFisher); and DO-localization: (DO-conjugated AlexaFluor 750-labled oligonucleotides (Tables S1–S2)) (IDT). APC-anti-CD45 (30-F11) (BD Biosciences), PerCP/Cy5.5-anti-CD3 (17A2) (BioLegend), FITC-anti-CD19 (1D3) (eBioscience, San Diego, CA), V450-anti-CD11b (M1/70) (BD Biosciences), PE-anti-CD11c (N418) (BioLegend), LIVE/DEAD® Fixable Aqua Dead Cell Stain Kit (ThermoFisher) (B/T cell panel): FITC-anti-CD3e (145–2C11), PE/Dazzle594-anti-CD45R/B220 (RA3–6B2), APC-anti-CD4 (RM4–4) (BioLegend, San Diego, CA); BUV395-anti-CD8a (53–6.7) (BD Bioscience); Brilliant Violet 421-anti-CD86 (16–10A1), Brilliant Violet 785-anti-CD69 (H1.2F3), APC/Fire 750-anti-CD44 (IM7), Brilliant Violet 605-anti-PD-1 (29F.1A12), PE-anti-CD62L (MEL-14), AF700-anti-CD45 common (BioLegend); in vitro and post-biodistribution panel: FITC-anti-CD19 (eBio1D3 (1D3)) (eBioscience); PerCPCy5.5-anti-CD3 (17A2), PECy7-anti-CD8 (53–6.7) (BioLegend, San Diego, CA); APC-anti-CD45 (30-F11), v450-anti-CD11b (M1/70), PE-anti-NK1.1 (PK136), PE CF594-anti-CD11c (HL3), BV450-anti-CD4 (RM 4–5), BUV395-anti-CD69 (H1 2F3) (BD Biosciences) and DO-conjugated AlexaFluor 750-labled oligonucleotides (Tables S1–S2)) (IDT). Data was analyzed via Kaluza Flow Cytometry Analysis Software (Beckman Coulter, Indianapolis, IN), where gating schemes are shown in (Figures S3, S6, S8, S16, S23, S25).
Immunotoxicology Dosing Schedule.
Female ICR mice (6 wks of age) were injected i.p. every 48-hrs over a 10-day time course (day 0, 2, 4, 6, and 8) with the following treatments: PBS+2.5mM MgCl2, 100μl, n=4; CpG-ODN 2395 (InvivoGen, San Diego, CA) (10μg), n=5; p7249 M13mp18 bacteriophage DNA (Guild Biosciences, Dublin, OH) (6.0mg/kg), n=7; Tri DO (12mg/kg), n=7; Horse DO (12mg/kg), n=7. For these experiments, each DO nanostructure contained 2 incorporated Alexa750 fluorophores (Figure 3A). Scaffold DNA was prepared following protocols described in[21] followed by removal of endotoxin via Endo-free Maxi-Prep kits (Qiagen, Germantown, MD) where the level of endotoxin was confirmed to be below the level of detection (0.0125EU/ml) (Figure S1). Peripheral blood was collected via submandibular laceration and stored in EDTA-lavender tubes (BD Biosciences, San Jose, CA) for complete blood count and Milliplex Cytokine array analysis on days 0, 1, 3, 5, and 10. At the conclusion of the experiment, animals were euthanized via CO2, and major organ systems from a subset of mice from all treatment groups (n=3) were subjected to IVIS imaging to evaluateDO biodistribution. On day 10, cardiac blood was collected for a serum Comprehensive Liver Biochemistry Panel evaluation (n=4 mice/treatment group) in yellow-top collection tubes (BD Biosciences, San Jose, CA). A subset of mice from each treatment group (PBS+2.5mM MgCl2; n=1; CpG-ODN, n=5; (M13mp18 DNA), n=7; Tri DO, n=4; and Horse DO, n=4) were fixed whole in 4% paraformaldehyde for histopathology evaluation. Spleens and peripheral blood (n=3/treatment group) were collected and evaluated by flow cytometry for myeloid and lymphoid immune cell subset evaluation.
IgM and IgG ELISA.
Total plasma IgM and IgG levels were measured via the Mouse IgM and Mouse IgG ELISA assay (Life Diagnostics, Inc. West Chester, PA) according to manufacturer’s instructions. Briefly, plasma samples were diluted in assay diluent as recommended and incubated alongside prepared mouse IgM and IgG standards for 45 min at room temperature on microtiter plates that contained either anti-IgM or anti-IgG bound capture antibodies. The samples were then washed with 1X wash solution as recommended followed by the addition of HRP-labeled detection antibodies and incubated for 45 min at room temperature and washed as described above. TMB reagent (HRP substrate) was then added to the wells and plates were placed on a micro-plate shaker at 125 rpm for 20 min followed by the addition of stop solution. The optical density (O.D.) was measured on a SpectraMax M2 microtiter plate reader (Molecular Devices, San Jose, CA) at 450 nm within 5 min of adding stop solution. Sample IgM and IgG levels were extrapolated from generated standard curves.
Histopathology and Comprehensive Biochemistry Panel.
Spleen, liver, heart, lung, kidneys, urinary bladder, skin, gastrointestinal tract, trachea, thyroids, pancreas, thymus, adrenal gland, skeletal muscle (cranial thigh), brain (cortex, thalamus, cerebellum, brainstem), eye, sternal bone marrow, uterus and ovaries, and mesenteric lymph node were examined grossly and microscopically from fixed mice from the following treatment groups: (PBS+2.5mM MgCl2; n=1; CpG-ODN, n=5; p7249 (M13mp18 DNA), n=7; Tri DO, n=4; and Horse DO, n=4). Tissues were fixed in 10% neutral buffered formalin, paraffin embedded and sectioned at 3μM onto glass slides with H&E staining by routine methodology by the Comparative Pathology and Mouse Phenotyping Shared Resource at the Ohio State University (Columbus, OH). A Comprehensive Biochemical Panel was conducted on serum also by the Comparative Pathology and Mouse Phenotyping Shared Resource according to in-house protocols for the following factors: albumin, alkaline phosphatase (ALP), alanine aminotransferase (ALT), amylase, aspartate aminotransferase (AST), blood urea nitrogen (BUN), calcium, chloride, cholesterol, creatinine, creatinine kinase (CK), gammaglutamyl transferase (GGT), globulins, glucose, lipase, phosphorus, potassium, sodium, total bilirubin, total protein, and triglyceride. All toxicology data generated was analyzed by a board-certified veterinary pathologist.
Complete Blood Count.
Peripheral blood (25μl) was collected at various time points (days 0, 1, 3, 5, and 10 post initial injection) and stored at room temperature in EDTA-lavender top tubes (BD Biosciences) until analysis. Complete Blood Counts were performed on a HemaVet II complete blood counting instrument (Drew Scientific, Waterford, CT) according to manufacturer’s instructions. The data was analyzed by a board-certified veterinary pathologist.
Milliplex Cytokine Array.
Murine plasma was analyzed for the following cytokine levels: IFN-γ, IL-1β, IL-2, IL-4, IL-5, IL-6, IL-9 IL-10, IL 12(p70), IL-17, TNF-α, MCP-1, MIP-2, and MIG via the MILLIPLEX MAP Mouse Cytokine/Chemokine Magnetic Bead Panel - Immunology Multiplex Assay (Millipore Sigma, St. Louis, MO) according to manufacturer’s instructions. Briefly, murine peripheral blood (~30μl) was collected by submandibular laceration in EDTA-lavender top tubes (BD Bioscience) and mixed from all treatment groups on days 0, 1, 3, 5, and 10 post initial injection (Figure 3A). All samples were centrifuged at 1000 × g for 10 mins and the plasma supernatant was removed and stored at −20°C until analysis. Thawed samples were centrifuged at 1000 × g for 10 mins and (~27μl) was diluted 1:2 in 1x assay buffer. Plates were hydrated with wash buffer, followed by removal and addition of standard and control to appropriate wells and assay buffer to background wells. Matrix solution or diluted plasma samples were then added to appropriate wells followed by the addition of magnetic beads to each well. Plates were then incubated overnight at 4°C. The following day, plates were washed twice with wash buffer followed the addition of detection antibodies. After 1 hr incubation, PE-conjugated streptavidin was added to each well and allowed to incubate for 30 min. Plates were then washed twice with wash buffer followed by the addition of Sheath/Drive Fluid to each well and read by a Luminex® 200™ (Luminex Corporation, Austin, TX). Raw data was analyzed by a 4logP fit from a standard curve generated from each cytokine/chemokine factor. The plasma levels of each cytokine/chemokine were reported either as values within the standard curve range or ≤ the lower limit of detection and transformed to a Fold Change scale relative to the cytokine/chemokine level of each mouse at day 0.
Statistical Analysis.
Statistical analysis was conducted using GraphPad Prism software (GraphPad Software, La Jolla, CA). Data from multiple treatment groups were analyzed using a one-way or two-way ANOVA to determine whether an overall statistical change existed, where all data collected assumed a normal distribution. One-way ANOVA followed by post hoc analysis compared each treatment group to each other where two-way ANOVA compared each treatment group to each other at a given concentration or time point. Certain p values were calculated using a Dunnett’s or Tukey’s multiple comparisons post hoc analysis. A two-sided Students t test was used to determine whether a statistically significant difference existed between two datasets or time points of a single treatment relative to baseline. A p value ≤0.05 indicated statistically significant results. Levels of statistical significance were reported as follows: *, p≤0.05; **, p≤0.01; ***, p≤0.001; ****, p≤0.0001.
Supplementary Material
Acknowledgements
This work was funded by NIH-R35 CA197734 NIH-R01 HL141941. C.R.L. is a recipient of a National Institutes of Health T32 Award in Oncology Training Fellowship at The Ohio State University Comprehensive Cancer Center (OSUCCC), NIH-T32-CA009338. We thank the Comparative Pathology and Digital Imaging OSUCCC Shared Resource, NIH-P30 CA016058, Dr. Aparna Lakshmanan, Carolyn Cheney, and Charlene Mao for assistance with flow cytometry, Ronni Wasmuth for assistance with animal studies, and Dr. Niksa Roki for critically reviewing our manuscript and helpful discussions.
Footnotes
Supporting Information
Supporting Information is available from the Wiley Online Library or from the author.
References
- [1].Shi J, Kantoff PW, Wooster R, Farokhzad OC, Nature Reviews Cancer 2017, 17, 20. [DOI] [PMC free article] [PubMed] [Google Scholar]
- [2].Tran S, DeGiovanni P-J, Piel B, Rai P, Clin Transl Med 2017, 6, 44. [DOI] [PMC free article] [PubMed] [Google Scholar]
- [3].Sercombe L, Veerati T, Moheimani F, Wu SY, Sood AK, Hua S, Front Pharmacol 2015, 6, 286. [DOI] [PMC free article] [PubMed] [Google Scholar]
- [4].Akbarzadeh A, Rezaei-Sadabady R, Davaran S, Joo SW, Zarghami N, Hanifehpour Y, Samiei M, Kouhi M, Nejati-Koshki K, Nanoscale Res Lett 2013, 8, 102. [DOI] [PMC free article] [PubMed] [Google Scholar]
- [5].Patra JK, Das G, Fraceto LF, Campos EVR, Rodriguez-Torres MDP, Acosta-Torres LS, Diaz-Torres LA, Grillo R, Swamy MK, Sharma S, Habtemariam S, Shin H-S, J Nanobiotechnology 2018, 16, 71. [DOI] [PMC free article] [PubMed] [Google Scholar]
- [6].Azandaryani AH, Kashanian S, Jamshidnejad-Tosaramandani T, Curr Pharm Biotechnol 2019, 20, 526. [DOI] [PubMed] [Google Scholar]
- [7].Wang AZ, Langer R, Farokhzad OC, Annu. Rev. Med 2012, 63, 185. [DOI] [PubMed] [Google Scholar]
- [8].Petros RA, DeSimone JM, Nature Reviews Drug Discovery 2010, 9, 615. [DOI] [PubMed] [Google Scholar]
- [9].Davis ME, Chen Z. (Georgia), Shin DM, Nature Reviews Drug Discovery 2008, 7, 771. [DOI] [PubMed] [Google Scholar]
- [10].Manzoor AA, Lindner LH, Landon CD, Park J-Y, Simnick AJ, Dreher MR, Das S, Hanna G, Park W, Chilkoti A, Koning GA, ten Hagen TLM, Needham D, Dewhirst MW, Cancer Res 2012, 72, 5566. [DOI] [PMC free article] [PubMed] [Google Scholar]
- [11].Fassas A, Anagnostopoulos A, Leukemia & Lymphoma 2005, 46, 795. [DOI] [PubMed] [Google Scholar]
- [12].Zhao Y-X, Shaw A, Zeng X, Benson E, Nyström AM, Högberg B, ACS Nano 2012, 6, 8684. [DOI] [PubMed] [Google Scholar]
- [13].Jiang Q, Song C, Nangreave J, Liu X, Lin L, Qiu D, Wang Z-G, Zou G, Liang X, Yan H, Ding B, J. Am. Chem. Soc 2012, 134, 13396. [DOI] [PubMed] [Google Scholar]
- [14].Zhang Q, Jiang Q, Li N, Dai L, Liu Q, Song L, Wang J, Li Y, Tian J, Ding B, Du Y, ACS Nano 2014, 8, 6633. [DOI] [PubMed] [Google Scholar]
- [15].Halley PD, Lucas CR, McWilliams EM, Webber MJ, Patton RA, Kural C, Lucas DM, Byrd JC, Castro CE, Small 2016, 12, 308. [DOI] [PMC free article] [PubMed] [Google Scholar]
- [16].Palazzolo S, Hadla M, Spena CR, Bayda S, Kumar V, Lo Re F, Adeel M, Caligiuri I, Romano F, Corona G, Canzonieri V, Toffoli G, Rizzolio F, ACS Med Chem Lett 2019, 10, 517. [DOI] [PMC free article] [PubMed] [Google Scholar]
- [17].Douglas SM, Bachelet I, Church GM, Science 2012, 335, 831. [DOI] [PubMed] [Google Scholar]
- [18].Shaw A, Hoffecker IT, Smyrlaki I, Rosa J, Grevys A, Bratlie D, Sandlie I, Michaelsen TE, Andersen JT, Högberg B, Nature Nanotechnology 2019, 14, 184. [DOI] [PMC free article] [PubMed] [Google Scholar]
- [19].Li S, Jiang Q, Liu S, Zhang Y, Tian Y, Song C, Wang J, Zou Y, Anderson GJ, Han J-Y, Chang Y, Liu Y, Zhang C, Chen L, Zhou G, Nie G, Yan H, Ding B, Zhao Y, Nat Biotechnol 2018, 36, 258. [DOI] [PubMed] [Google Scholar]
- [20].Rothemund PWK, Nature 2006, 440, 297. [DOI] [PubMed] [Google Scholar]
- [21].Castro CE, Kilchherr F, Kim D-N, Shiao EL, Wauer T, Wortmann P, Bathe M, Dietz H, Nat Methods 2011, 8, 221. [DOI] [PubMed] [Google Scholar]
- [22].Kearney CJ, Lucas CR, O’Brien FJ, Castro CE, Adv Mater 2016, 28, 5509. [DOI] [PMC free article] [PubMed] [Google Scholar]
- [23].Palazzolo S, Hadla M, Russo Spena C, Caligiuri I, Rotondo R, Adeel M, Kumar V, Corona G, Canzonieri V, Toffoli G, Rizzolio F, Cancers (Basel) 2019, 11, DOI 10.3390/cancers11121997. [DOI] [PMC free article] [PubMed] [Google Scholar]
- [24].Veneziano R, Moyer TJ, Stone MB, Wamhoff E-C, Read BJ, Mukherjee S, Shepherd TR, Das J, Schief WR, Irvine DJ, Bathe M, Nature Nanotechnology 2020, 15, 716. [DOI] [PMC free article] [PubMed] [Google Scholar]
- [25].Liu S, Jiang Q, Zhao X, Zhao R, Wang Y, Wang Y, Liu J, Shang Y, Zhao S, Wu T, Zhang Y, Nie G, Ding B, Nat Mater 2021, 20, 421. [DOI] [PubMed] [Google Scholar]
- [26].Zhang H, Demirer GS, Zhang H, Ye T, Goh NS, Aditham AJ, Cunningham FJ, Fan C, Landry MP, PNAS 2019, 116, 7543. [DOI] [PMC free article] [PubMed] [Google Scholar]
- [27].Z W, L S, Q L, R T, Y S, F L, S L, S Z, Z H, J S, Q J, B D, Angew Chem Int Ed Engl 2020, 60, 2594.33089613 [Google Scholar]
- [28].Paludan SR, Bowie AG, Immunity 2013, 38, 870. [DOI] [PMC free article] [PubMed] [Google Scholar]
- [29].Surana S, Shenoy AR, Krishnan Y, Nature Nanotechnology 2015, 10, 741. [DOI] [PMC free article] [PubMed] [Google Scholar]
- [30].Schüller VJ, Heidegger S, Sandholzer N, Nickels PC, Suhartha NA, Endres S, Bourquin C, Liedl T, ACS Nano 2011, 5, 9696. [DOI] [PubMed] [Google Scholar]
- [31].Perrault SD, Shih WM, ACS Nano 2014, 8, 5132. [DOI] [PMC free article] [PubMed] [Google Scholar]
- [32].Halley PD, Patton RA, Chowdhury A, Byrd JC, Castro CE, Nano Res. 2019, 12, 1207. [Google Scholar]
- [33].Li J, Pei H, Zhu B, Liang L, Wei M, He Y, Chen N, Li D, Huang Q, Fan C, ACS Nano 2011, 5, 8783. [DOI] [PubMed] [Google Scholar]
- [34].Yang G, Koo JE, Lee HE, Shin SW, Um SH, Lee JY, Biomedicine & Pharmacotherapy 2019, 112, 108657. [DOI] [PubMed] [Google Scholar]
- [35].Cibrián D, Sánchez-Madrid F, European Journal of Immunology 2017, 47, 946. [DOI] [PMC free article] [PubMed] [Google Scholar]
- [36].Vollmer J, Weeratna R, Payette P, Jurk M, Schetter C, Laucht M, Wader T, Tluk S, Liu M, Davis HL, Krieg AM, European Journal of Immunology 2004, 34, 251. [DOI] [PubMed] [Google Scholar]
- [37].Jurk M, Schulte B, Kritzler A, Noll B, Uhlmann E, Wader T, Schetter C, Krieg AM, Vollmer J, Immunobiology 2004, 209, 141. [DOI] [PubMed] [Google Scholar]
- [38].Lee HY, Contreras E, Register AC, Wu Q, Abadie K, Garcia K, Wong PY, Jiang G, Sci Rep 2019, 9, 3900. [DOI] [PMC free article] [PubMed] [Google Scholar]
- [39].Laky K, Evans S, Perez-Diez A, Fowlkes BJ, Immunity 2015, 42, 80. [DOI] [PMC free article] [PubMed] [Google Scholar]
- [40].Ponnuswamy N, Bastings MMC, Nathwani B, Ryu JH, Chou LYT, Vinther M, Li WA, Anastassacos FM, Mooney DJ, Shih WM, Nat Commun 2017, 8, 1. [DOI] [PMC free article] [PubMed] [Google Scholar]
- [41].Avitsur R, Powell N, Padgett DA, Sheridan JF, Immunology and Allergy Clinics 2009, 29, 285. [DOI] [PubMed] [Google Scholar]
- [42].Jiang D, Ge Z, Im H-J, England CG, Ni D, Hou J, Zhang L, Kutyreff CJ, Yan Y, Liu Y, Cho SY, Engle JW, Shi J, Huang P, Fan C, Yan H, Cai W, Nat Biomed Eng 2018, 2, 865. [DOI] [PMC free article] [PubMed] [Google Scholar]
- [43].Long CT, Luong R, Lab Anim 2009, 38, 49. [DOI] [PubMed] [Google Scholar]
- [44].Wolford ST, Schroer RA, Gohs FX, Gallo PP, Brodeck M, Falk HB, Ruhren R, J Toxicol Environ Health 1986, 18, 161. [DOI] [PubMed] [Google Scholar]
- [45].Toita R, Kawano T, Fujita S, Murata M, Kang J-H, J Toxicol Pathol 2018, 31, 43. [DOI] [PMC free article] [PubMed] [Google Scholar]
- [46].Keppler A, Gretz N, Schmidt R, Kloetzer H-M, Groene H-J, Lelongt B, Meyer M, Sadick M, Pill J, Kidney International 2007, 71, 74. [DOI] [PubMed] [Google Scholar]
- [47].Dunn SR, Qi Z, Bottinger EP, Breyer MD, Sharma K, Kidney International 2004, 65, 1959. [DOI] [PubMed] [Google Scholar]
- [48].Metzger CE, Swallow EA, Stacy AJ, Allen MR, PLOS ONE 2021, 16, e0250438. [DOI] [PMC free article] [PubMed] [Google Scholar]
- [49].Tokunaga R, Zhang W, Naseem M, Puccini A, Berger MD, Soni S, McSkane M, Baba H, Lenz H-J, Cancer Treatment Reviews 2018, 63, 40. [DOI] [PMC free article] [PubMed] [Google Scholar]
- [50].Hemmi H, Takeuchi O, Kawai T, Kaisho T, Sato S, Sanjo H, Matsumoto M, Hoshino K, Wagner H, Takeda K, Akira S, Nature 2000, 408, 740. [DOI] [PubMed] [Google Scholar]
- [51].Agarwal NP, Matthies M, Gür FN, Osada K, Schmidt TL, Angewandte Chemie International Edition 2017, 56, 5460. [DOI] [PubMed] [Google Scholar]
- [52].Roki N, Tsinas Z, Solomon M, Bowers J, Getts RC, Muro S, Journal of Controlled Release 2019, 305, 41. [DOI] [PMC free article] [PubMed] [Google Scholar]
- [53].Douglas SM, Marblestone AH, Teerapittayanon S, Vazquez A, Church GM, Shih WM, Nucleic Acids Res 2009, 37, 5001. [DOI] [PMC free article] [PubMed] [Google Scholar]
- [54].Stahl E, Martin TG, Praetorius F, Dietz H, Angewandte Chemie International Edition 2014, 53, 12735. [DOI] [PMC free article] [PubMed] [Google Scholar]
- [55].Edgington LE, Bogyo M, Curr Protoc Chem Biol 2013, 5, 25. [DOI] [PMC free article] [PubMed] [Google Scholar]
- [56].McWilliams EM, Lucas CR, Chen T, Harrington BK, Wasmuth R, Campbell A, Rogers KA, Cheney CM, Mo X, Andritsos LA, Awan FT, Woyach J, Carson WE, Butchar J, Tridandapani S, Hertlein E, Castro CE, Muthusamy N, Byrd JC, Blood Adv 2019, 3, 447. [DOI] [PMC free article] [PubMed] [Google Scholar]
- [57].Abdul-Aziz AM, Sun Y, Hellmich C, Marlein CR, Mistry J, Forde E, Piddock RE, Shafat MS, Morfakis A, Mehta T, Di Palma F, Macaulay I, Ingham CJ, Haestier A, Collins A, Campisi J, Bowles KM, Rushworth SA, Blood 2019, 133, 446. [DOI] [PMC free article] [PubMed] [Google Scholar]
Associated Data
This section collects any data citations, data availability statements, or supplementary materials included in this article.