

Abstract
Purpose
To determine the correlation of the T1-weighted signal intensity ratio (T1 SIR, or T1 Score) and arterial-to-delayed venous enhancement ratio (ADV ratio) of the pancreas with pancreatic fibrosis on histopathology.
Methods
Sixty consecutive adult CP patients who had an MRI/MRCP study prior to pancreatic surgery were analyzed. Three blinded observers measured T1 SIR of pancreas to spleen (T1 SIR p/s), pancreas-to-paraspinal muscle (T1 SIR p/m), ADV ratio, and Cambridge grade. Histopathologic grades were given by a gastrointestinal pathologist using Ammann’s fibrosis score. Statistical analysis included Spearman’s correlation coefficient of the T1 SIR, ADV ratio, Cambridge grade with the fibrosis score, and weighted kappa for interobserver agreement.
Results
The study population included 31 female and 29 male patients, with an average age of 52.1 (26–78 years). Correlations between fibrosis score and T1 SIR p/s, T1 SIR p/m, and ADV ratio were ρ = − 0.54 (p = 0.0001), ρ = − 0.19 (p = 0.19), and ρ = − 0.39 (p = 0.003), respectively. The correlation of Cambridge grade with fibrosis score was ρ = 0.26 (p = 0.07). There was substantial interobserver agreement (weighted kappa) for T1 SIR p/s (0.78), T1 SIR p/m (0.71), and ADV ratio (0.64). T1 SIR p/s of ≤ 1.20 provided a sensitivity of 74% and specificity of 50% (AUC: 0.74), while ADV ratio of ≤ 1.10 provided a sensitivity of 75% and specificity of 55% (AUC: 0.68) to detect a fibrosis score of ≥ 6.
Conclusion
There is a moderate negative correlation between the T1 Score (SIR p/s) and ADV ratio with pancreatic fibrosis and a substantial interobserver agreement. These parenchymal metrics show a higher correlation than the Cambridge grade.
Keywords: Pancreatitis, MRI, T1, Fibrosis, Histopathology
Introduction
Chronic pancreatitis (CP) is a chronic inflammatory condition of the pancreas with clinical manifestations ranging from abdominal pain, acute pancreatitis, exocrine and/or endocrine dysfunction (diabetes mellitus), and increased risk for the development of pancreatic cancer [1]. Computerized tomography and Magnetic Resonance Imaging (MRI) with Magnetic Resonance Cholangiopancreatography (MRCP) are the most common cross-sectional imaging studies to evaluate CP. The Cambridge classification [2] is designed to interpret endoscopic retrograde cholangiopancreatography (ERCP) and is still used in clinical practice. The American Pancreatic Association guidelines [3] suggest that radiologists convert what they see on cross-sectional images to pancreatic ductal findings defined by the Cambridge classification. This process is subject to variable interpretation [4] resulting in moderate interobserver agreement among abdominal imagers with significant experience [5].
Several studies reported that several MR features of the pancreatic parenchyma might accurately reflect the changes related to CP [6–11] and could be incorporated into a new classification system [4, 12–14]. The cardinal histopathologic features of CP are fibrosis, loss of acinar tissue, and ductal changes [15]. Cambridge classification used for MRCP primarily captures periductal fibrosis and does not directly assess the fibrosis in the rest of the parenchyma or loss of acinar cells. Since the pancreatic ductal system comprises only a small fraction (4%) of the normal pancreas [16, 17], the diagnosis of non-calcific CP can be elusive or delayed when using ductal imaging alone [6, 11]. MRI parenchymal signal changes may provide a more comprehensive evaluation of CP [12–14], potentially earlier detection of the pathophysiology, considering acinar cells comprise up to 85% of the normal pancreas [18]. Consensus guidelines also highlighted the potential benefit of parenchymal imaging [12–14]. A crucial step to achieve this goal is to correlate these MR parenchymal features with pancreatic fibrosis graded on histopathologic evaluation [19–21]. Since the core biopsy of the pancreas is rarely performed due to the high risk of causing acute pancreatitis, an ideal study population would be pancreatic resections secondary to complications of CP. This study aimed to correlate the fibrosis score with ADV ratio and T1 SIR of pancreas to spleen and directly compare T1 SIR and ADV ratio with the Cambridge classification.
Materials and methods
The institutional review board granted a waiver for obtaining informed written consent. This study was conducted in compliance with the HIPAA rules.
Participant selection
In this single-center study, a retrospective search of the surgical medical records identified 160 consecutive adult patients who underwent pancreatic resection due to complications of CP between 2017 and 2019. Eligibility criteria included age > 18, history of CP, history of pancreatic resection, and presence of an MRI/MRCP prior to the surgery (Fig. 1), leaving 108 patients. We eliminated 48 cases due to exclusion criteria which included MRI/MRCP older than 180 days from the surgery (n = 26), evidence of acute pancreatitis (n = 10), lack of histopathologic slides (n = 4), prior pancreatic surgery (n = 3), large post-inflammatory cyst obscuring the pancreas (n = 2), lack of post-contrast phase (n = 2), lack of T1-weighted images (n = 1), splenectomy (n = 0), and hemosiderosis (n = 0), leaving 60 patients for the analysis. The indications for pancreatic surgery were chronic-intractable abdominal pain of pancreatic origin (n = 23), recurrent acute pancreatitis with pancreas divisum (n = 13), pancreatic and/or biliary stricture (n = 12), pancreatic ductal disruption/disconnection (n = 6), pancreas-to-enteric fistula (n = 5), and not available/unknown (n = 1).
Fig. 1.

Enrollment flowchart
Imaging sequences
All MRI/MRCP examinations were performed at our institution using the standard of care protocol in either 1.5 (n = 37) or 3.0 Tesla (n = 23) scanners. We used a T1-weighted fat-suppressed, volume-interpolated 3D gradient-echo sequence (VIBE, Siemens Medical Solutions, Malvern, PA, USA) in the unenhanced, arterial, and 5-min delayed post-contrast phases obtained in the same acquisition. MRCP images included thick-slab coronal single-shot turbo spin-echo images at varying angles to cover the entire ductal anatomy, followed by a thin-slice coronal respiratory synchronized 3D turbo spin-echo sequence (SPACE, Siemens Medical Solutions, Malvern, PA). No adverse events were documented.
Histopathologic evaluation
Histologic grading was performed by a fellowship-trained gastrointestinal pathologist (OAS) using Ammann’s fibrosis score [22]. The pathologist reviewed the slides independently without knowledge of the imaging findings. The Ammann’s fibrosis system gives scores for fibrosis in two components of the parenchyma; peri-lobular (scored from 1 to 6) and intralobular (scored from 1 to 6) (Fig. 2), and the final score is the sum of two components. Fibrosis was considered mild for the peri-lobular component when the lobules were separated by fibrous tissue without altered architecture or atrophy [22]. It was considered severe when the lobules were separated by thick-fibrous tissue with significant lobular atrophy. When the pathology involved less than 50% of the pancreatic parenchyma, the fibrosis was staged as 1 (mild), 2 (moderate), and 3 (marked). When the changes affected more than 50% (diffuse), the fibrosis was staged as 4 (mild), 5 (moderate), and 6 (marked). For intralobular fibrosis, the fibrosis was deemed to be mild when thin-fibrous strands separated the acini within the lobules without significant alteration of the architecture. The fibrosis was considered to be severe when the fibrosis completely replaced the lobules without any remaining acini. When the changes involved less than 50% of the pancreatic parenchyma, the fibrosis was staged as 1 (mild), 2 (moderate), and 3 (marked). When the changes affected more than 50% (diffuse), the fibrosis was staged as 4 (mild), 5 (moderate), and 6 (marked).
Fig. 2.

Representative sections of pancreas tissue evaluated by Hematoxylin and Eosin stain and fibrosis were graded according to Ammann’s scoring system, which separates peri-lobular and intralobular fibrosis. a shows a moderate degree peri-lobular fibrosis (F) with thick-fibrous septae and lobular atrophy and b shows a moderate degree of intralobular fibrosis (F) with the loss of acinar cells
Image analysis
Two independent observers without the knowledge of the clinical information and fibrosis score measured T1 SIR from unenhanced T1-weighted fat-saturated gradient-echo images. Region of interest (ROI) measurements were performed from the pancreas, spleen, and paraspinal muscle. Special instructions were given at the beginning of the study to ensure the ROI area is between 50 and 100 mm2, circular/elliptical in a homogenous region, avoiding edema, volume averaging from fat, vessels, and dilated pancreatic duct, matching the locations as closely as possible to the surgical specimen, and one sample from other sections of the gland. T1 SIR was calculated by dividing the average pancreas signal intensity (SI) by the SI of the reference organ (SIR = SI Pancreas / SI Reference) (Fig. 3). ADV ratio is calculated from the post-contrast arterial and 5-min delayed venous phase images using the formula ADV = (SI arterial – SI pre-contrast) / (SI dld-venous – SI pre-contrast). Cambridge grades are given by the third observer using the Cambridge classification [2] as shown in Table 1.
Fig. 3.

Histopathologic scores correlating with T1 SIR and ADV ratio. a This is a 29-year-old female patient with a history of chronic-intractable abdominal pain, secondary to alcohol-related chronic pancreatitis and pancreas divisum. The post-operative histopathologic fibrosis score was 2. This pre-operative image is an axial, unenhanced, fat-suppressed T1-weighted image shows a relatively higher signal intensity of the pancreas (thick arrow) than the spleen (thin arrow). T1 SIR p/s was high (1.57), indicating minimal-to-mild fibrosis. b This is a 57-year-old female with a history of abdominal pain, recurrent pancreatitis, cholecystectomy, and bariatric surgery. Due to recurrent-intractable abdominal pain, the patient elected to undergo pylorus sparing pancreaticoduodenectomy. The post-operative fibrosis score was 12 indicating severe fibrosis. T1 SIR p/s measured on this axial-unenhanced T1-weighted fat-suppressed image was 0.80, reflecting the changes secondary to advanced fibrosis
Table 1.
Cambridge classification for diagnosis and grading of chronic pancreatitis
| Cambridge Grade | Main pancreatic duct | Abnormal side branches |
|---|---|---|
| Grade 0 | Normal | None |
| Grade 1 | Normal | Fewer than 3 |
| Grade 2 | Normal | 3 or more |
| Grade 3 | Abnormal | More than 3 |
| Grade 4 | Abnormal | Presence of a large cavity, obstruction, filling defect, severe dilation, or irregularity |
Statistical analysis
Statistical analysis was done using the average of the data from two observers. Spearman’s coefficient (ρ) was used to assess the correlation of the T1 SIR, ADV ratio, and Cambridge score with the fibrosis score. Correlations were considered weak from 0 to 0.2, moderate from 0.2 to 0.5, strong from 0.5 to 0.8, and perfect from 0.8 to 1.0 [23]. Weighted Kappa was used for interobserver agreement. We accepted Kappa coefficients of 0.21 – 0.40 as fair, 0.41 – 0.60 as moderate, 0.61 – 0.80 as substantial, and 0.81 – 1.00 as almost perfect [24]. Multi-variate analysis was performed using generalized linear model. The significance level (α) used in this study was < 0.05. IBM SPSS Statistics version 28.0 was used for statistical analysis.
Results
The study included 31 female and 29 male patients with an average age of 52.1 (26–78 years). The mean fibrosis score was 8.3 (range: 0–12), and the mean Cambridge score was 2.2. Table 2 lists the patient demographics obtained from the electronic medical records, and Fig. 4 shows the distribution of T1 SIR p/s, T1 SIR p/m, ADV ratio, and Cambridge grades on a histogram.
Table 2.
Patient demographics
| Demographics | N |
|---|---|
| Sex | 29/60 (48%) |
| Male | 31/60 (52%) |
| Female | |
| Age average (range) | 52.1 (26–78) |
| < 30 | 3/60 (5%) |
| 30–39 | 5/60 (8%) |
| 40–49 | 12/60 (20%) |
| 50–59 | 24/60 (40%) |
| 60–69 | 12/60 (20%) |
| > 70 | 4/60 (7%) |
| Race | 48/60 (80%) |
| White | 8/60 (14%) |
| Black | 4/60 (6%) |
| Other a | |
| Alcohol | 10/60 (17%) |
| Current | 18/60 (30%) |
| Past | 32/60 (53%) |
| Never | |
| Smoking | 26/60 (43%) |
| Current | 15/60 (25%) |
| Past | 19/60 (32%) |
| Never | |
| Fibrosis score | 8.3 |
| Mean | 1 |
| Min | 12 |
| Max | |
| Days between MRI and surgery | 87 |
| Mean | 3 |
| Min | 174 |
| Max |
Hispanic, Asian, American Indian/Alaska Native, or Native Hawaiian/Pacific Islander
Fig. 4.
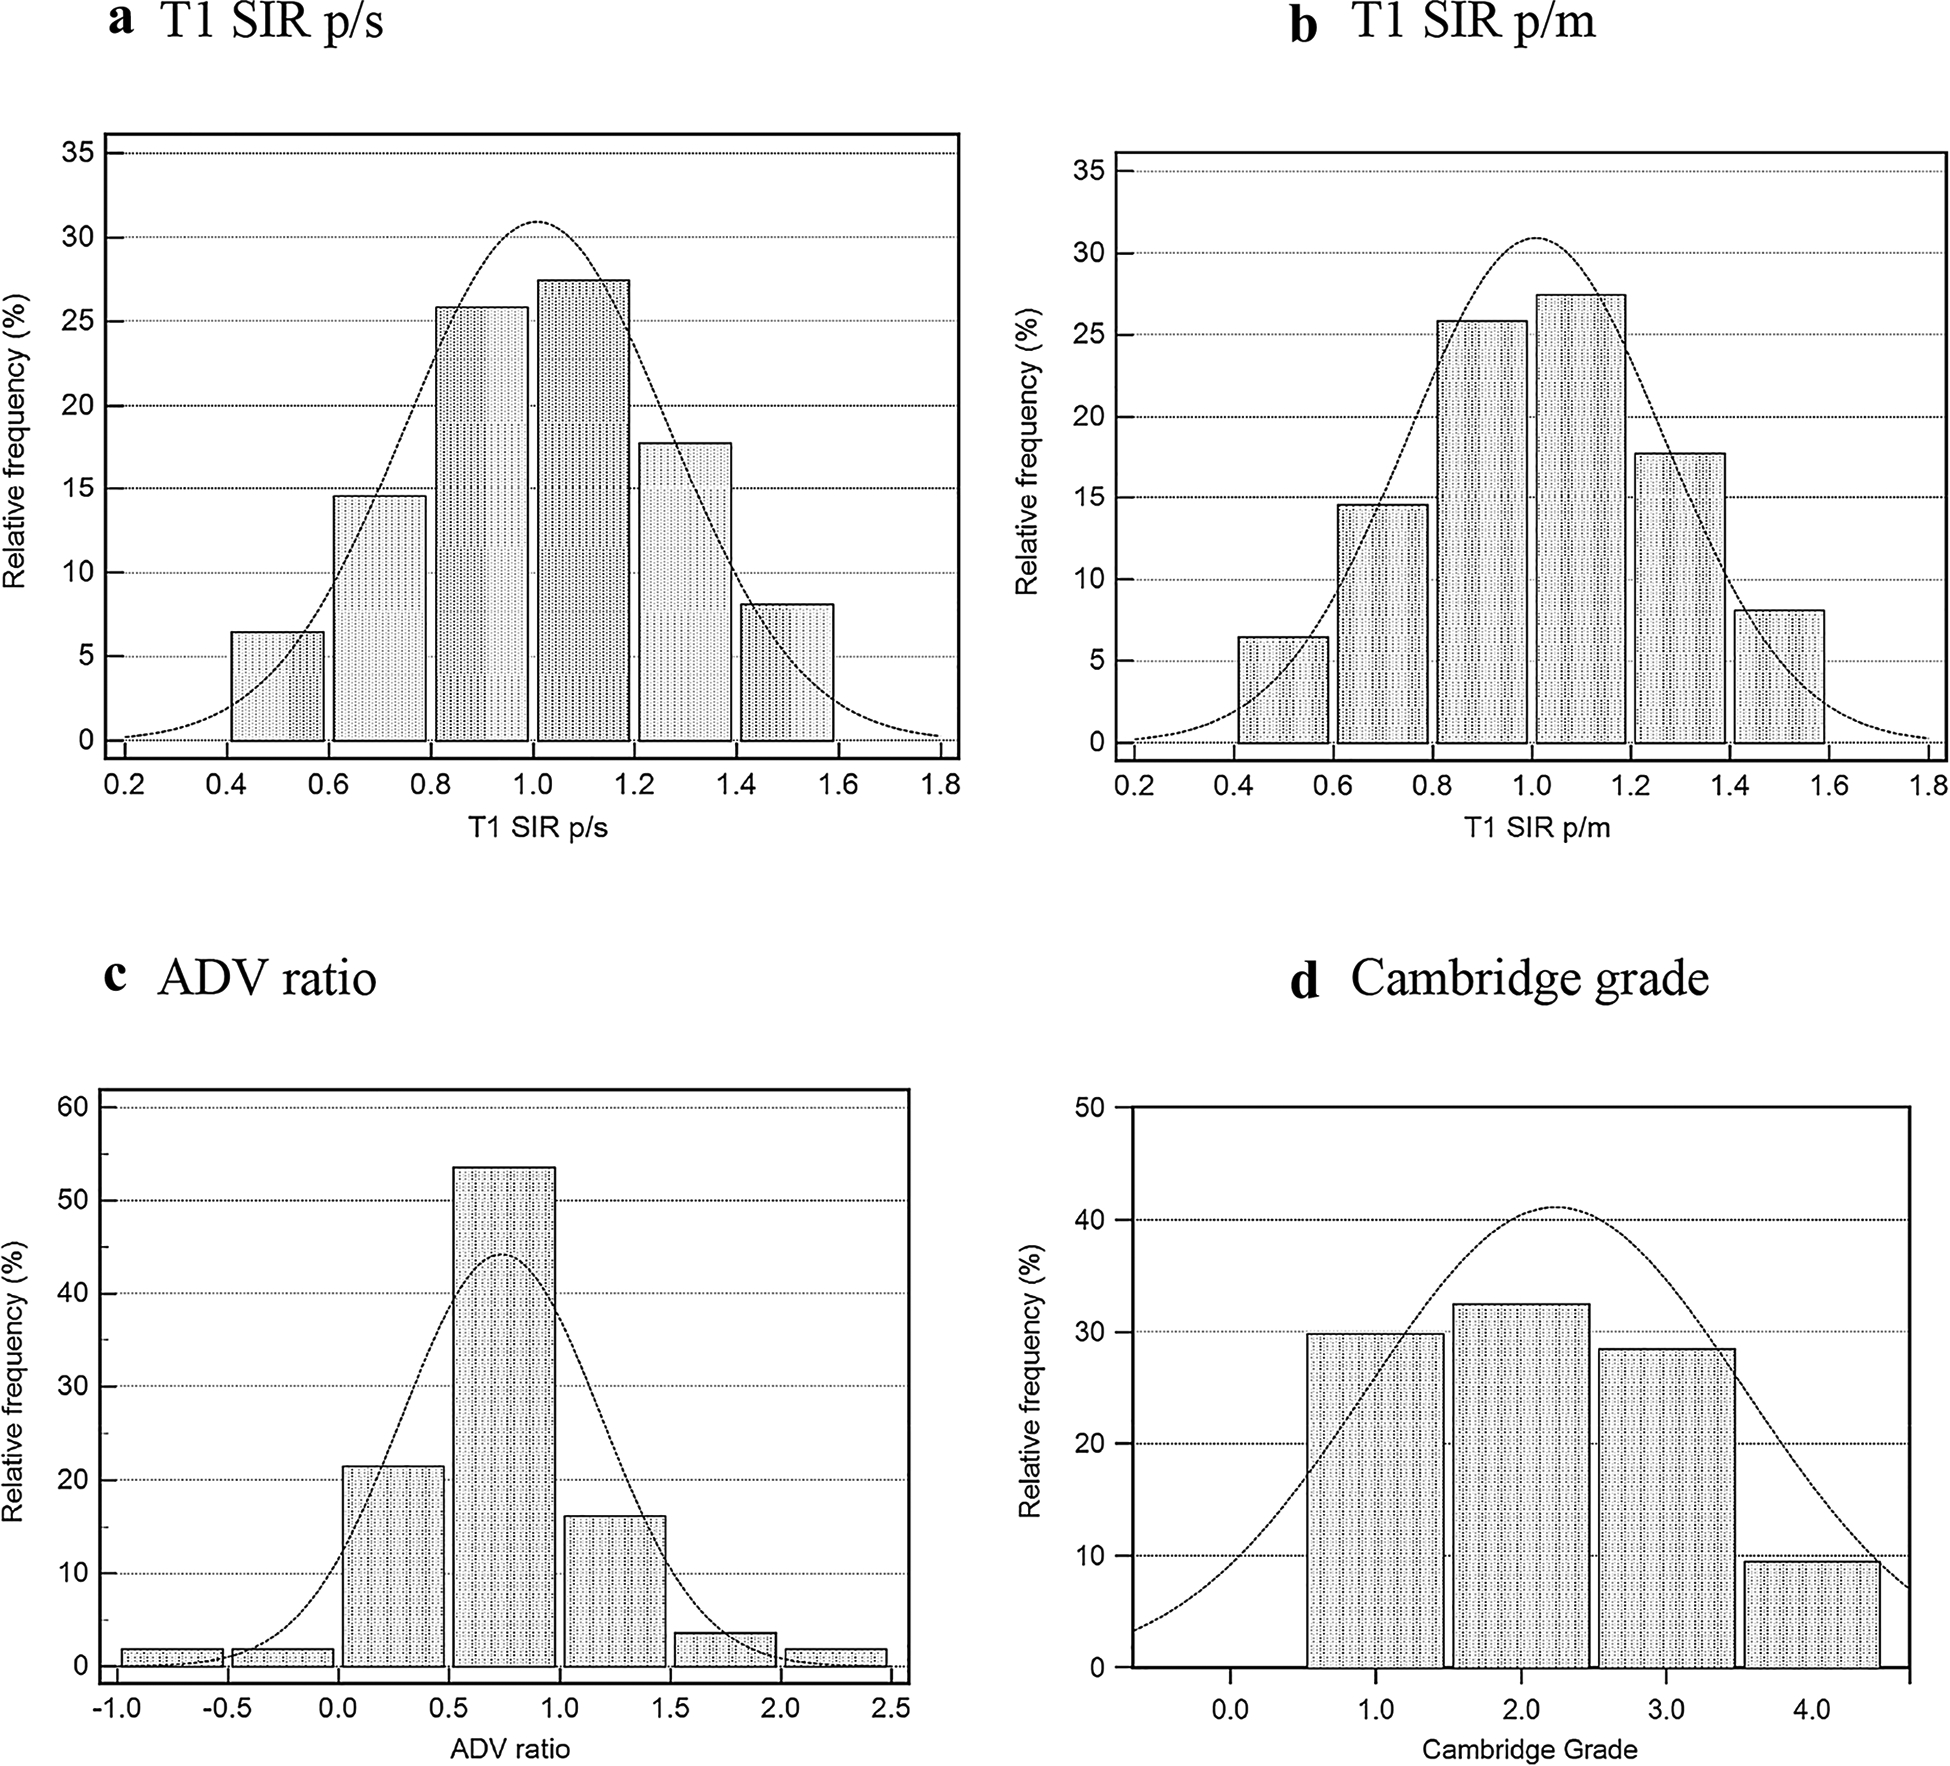
Distribution of two T1 Scores a T1 SIR p/s, b T1 SIR p/m; arterial-to-delayed venous enhancement ratio, c ADV ratio; and MRCP ductal imaging results, d Cambridge grade. T1 SIR p/s and ADV ratio show a normal or bell-shaped curve, while the Cambridge grades have more plateau distribution
Correlations between fibrosis score and the parenchymal features were as follows: T1 SIR p/s; ρ = − 0.54 (95%CI: − 0.71 to − 0.30, p = 0.0001), T1 SIR p/m; ρ = − 0.19 (95%CI: − 0.45 to 0.09, p = 0.19), and ADV ratio; ρ = − 0.39 (95%CI: − 0.60 to − 0.14, p = 0.003). Correlation between the Cambridge grade and the fibrosis score was ρ = 0.26 (95% CI: − 0.02 to 0.50, p = 0.07) (Fig. 5). There was substantial interobserver agreement (weighted Kappa) for T1 SIR p/s, T1 SIR p/m, and ADV ratio (0.78, 0.71, and 0.64, respectively) (Table 3).
Fig. 5.

Correlation analysis. a Correlation of T1 signal intensity ratio of the pancreas to the spleen (T1 SIR p/s) with fibrosis score (ρ = − 0.54). Thin lines indicate 95% confidence intervals. b Correlation of arterial-to-delayed venous enhancement ratio of the pancreas (ADV ratio) with fibrosis score (ρ = − 0.39). c Correlation of Cambridge score with fibrosis score (ρ = 0.26)
Table 3.
Results of T1 SIR p/s, T1 SIR p/m, ADV ratio, and Cambridge grade
| Results | T1 SIR P/S | T1 SIR P/M | ADV ratio | Cambridge grade |
|---|---|---|---|---|
| Mean | ||||
| 95% CI | 1.06 | 1.08 | 0.74 | 2.2 |
| Min | 1.00 to 1.13 | 0.98 to 1.19 | − 0.62 to 0.86 | 1.95 to 2.40 |
| Max | 0.63 | 0.35 | 0.34 | 1 |
| 1.5 | 3.13 | 2.21 | 4 | |
| Correlation with fibrosis | ||||
| P (Rho) | −0.54 | −0.19 | −0.39 | 0.26 |
| 95% Ci | −0.71 to – 0.30 | −0.45 to 0.09 | −0.60 to – 0.14 | − 0.02 to 0.50 |
| P Value | 0.0001 | 0.19 | 0.003 | 0.07 |
T1 SIR p/s: T1 signal intensity of the pancreas to the spleen. T1 SIR p/m: T1 signal intensity of the pancreas to the paraspinal muscle. ADV ratio: arterial-to-delayed venous enhancement ratio. CI: confidence interval
Considering fibrosis score of 6 and higher as the threshold for CP, T1 SIR p/s of 1.20 or less provided a sensitivity of 74% and specificity of 50% (AUC: 0.74), ADV ratio of 1.10 or less provided a sensitivity of 75% and specificity of 55% (AUC: 0.68) and T1 SIR p/m of 1.20 or less provided a sensitivity of 84% and specificity of 42% (AUC: 0.68) (Fig. 6). Multi-variate analysis showed that T1 SIR p/s was the most statistically significant variable (p = 0.17) to detect fibrosis scores of 6 or higher (Table 4).
Fig. 6.

Comparison of ROC curves for T1 SIR p/s (AUC: 0.74), T1 SIR p/m (AUC: 0.68), and ADV ratio (AUC: 0.68)
Table 4.
Multi-variate analysis for detection of fibrosis score 6 and higher
| Dependent variable | Sum of squares | df | Mean square | F | Significance (p) |
|---|---|---|---|---|---|
| T1 SIR p/s | 0.360 | 1 | 0.360 | 6.193 | .017 |
| T1 SIR p/m | 0.258 | 1 | 0.258 | 1.405 | .242 |
| ADV ratio | 1.066 | 1 | 1.066 | 3.435 | .070 |
| Cambridge score | 1.623 | 1 | 1.623 | 1.907 | .174 |
Discussion
This study retrospectively analyzed sixty CP patients who had MRI/MRCP performed prior to the pancreatic resection. Our results showed that as the severity of fibrosis increases, both T1 SIR and ADV ratios decrease, showing a moderate negative correlation. This correlation was higher than the correlation between Cambridge grade and fibrosis which was a significant result that showed the higher value of parenchymal features over the Cambridge classification for evaluation of CP. In addition, two observers showed a substantial interobserver agreement for T1 SIR p/s (Kappa = 0.78) and T1 SIR p/m (Kappa = 0.71), higher than the reported interobserver variability for Cambridge classification (Kappa = 0.64) [5]. Although this was not our primary aim of this study, our diagnostic performance analysis showed sensitivities of 74%, 84%, and 75% and specificities of 50%, 42%, and 55% for T1 SIR p/s, T1 SIR p/m, and ADV ratio, respectively. While these numbers are less than satisfactory as a diagnostic test, T1 SIR and ADV ratio could be helpful to assess the severity of the pancreatic fibrosis based on correlation analysis, at least providing better correlation than the Cambridge classification.
Our results strengthen the support for using the parenchymal T1 signal properties and enhancement ratio [11] to assess the severity of CP [12, 13]. Prospective multi-institutional studies [25, 26] are currently looking into this potential within the Consortium for the Study of Chronic Pancreatitis, Diabetes and Pancreatic Cancer (CPDPC) [27]. These new imaging biomarkers derived from MR imaging sequences have the potential to open a new chapter for the diagnosis and severity assessment of CP [28]. Among the possible clinical applications would be assisting the decision process to treat CP cases with resection versus non-surgical interventions (preserving the remaining tissue). These semi-quantitative metrics can also be helpful in clinical trials to assess response to a drug or non-surgical intervention.
Conventional MR images are commonly obtained together with the MRCP, and radiologists noticed the pancreas’ relatively higher T1 signal intensity compared to the other solid organs. This feature was attributed to the rich proteinaceous material in the acinar cells containing abundant rough endoplasmic reticulum [9, 29, 30]. In conditions such as CP, loss of proteinaceous material is reduced by chronic inflammation causing replacement of acini by fibrosis. Therefore, patients with CP often exhibited a relatively lower T1 signal intensity of the pancreas [6, 11]. These changes can also be measured quantitatively using quantitative MR relaxometry techniques, such as T1 mapping [7, 31, 32].
We correlated our findings with Ammann’s histopathologic scoring system, designed to grade pancreatic fibrosis in patients with CP [15]. This is the most commonly used criteria; therefore, previous studies that compared endoscopic ultrasound with surgical pathology used this scoring system [33, 34] using different thresholds to define CP. We considered a fibrosis score of 6/12 since this is the threshold used within the Consortium for the Study of Chronic Pancreatitis, Diabetes, and Pancreatic Cancer (CPDPC) [27] which our institution is a member. Our results support the conclusion of a 4-year longitudinal study that evaluated the role of parenchymal MRI features in the progression of CP. Results from 25 patients suggested that progression of CP can be better observed in the parenchyma than in the pancreatic ducts [14]. Cambridge classification is a ductal criteria established for ERCP and therefore only reflects the changes within a fraction of the pancreatic parenchyma. We agree that MR parenchymal features can be incorporated into a new classification system, and this necessity was raised previously by several recent publications and consensus guidelines [4, 12–14].
Our literature search found three similar studies that correlated several MRI parenchymal features with fibrosis. The first study included fifty-seven patients with non-calcific CP who underwent total pancreatectomy with islet auto transplantation [19]. The study showed that main pancreatic duct irregularity, T1 SIR of the pancreas-to-paraspinal muscle, and duodenal filling after secretin stimulation were significant independent predictors of fibrosis [19]. This study reported pancreas-to-paraspinal muscle SIR of > 1 to be a good indicator of fibrosis score < 2. The second study correlated quantitative MR features (T1 mapping, MR elastography, and diffusion-weighted imaging) with histopathology in 144 patients. This study did not assess any T1 SIR but reported that T1 relaxation time correlated with fibrosis (r = 0.77; P < 0.001) [20]. The third study was performed on 29 patients and assessed the correlation of fibrosis with T1 SIR of the pancreas-to-paraspinal muscle and diffusion-weighted images [21]. There was a significant negative correlation between T1 SIR pancreas-to-paraspinal muscle (r = − 0.69, p < 0.0001) and ADC values (r = − 0.60, p = 0.006) with pancreatic fibrosis. This study reported a T1 SIR of 1.51 ± 0.25 in patients with a fibrosis score of 0 (n = 7). Our study is the first to report the correlation of fibrosis with ADV ratio and T1 SIR of the pancreas to spleen and the first study to directly compare T1 SIR p/s and ADV ratio with the Cambridge classification in terms of correlation with pancreatic fibrosis.
We found other studies which explored the association of T1 SIR with pancreatic exocrine function. One of these studies was on fifty-one patients with abdominal pain suspected of CP who ended up having ePFT secondary to long list of inconclusive imaging and clinical findings. Within the exocrine dysfunction group, 20 out of 22 MRCPs were normal/equivocal (Cambridge score 0/1), showing the low sensitivity of ductal imaging for detection of early CP. However, T1 SIR p/s showed a moderate positive correlation between the bicarbonate concentration (ρ = 0.70, p < 0.0001). While the ductal imaging was insensitive to detecting early CP, T1 SIR p/s of 1.2 yielded a sensitivity of 77% and specificity of 83% for detecting pancreatic exocrine dysfunction (AUC: 0.89) [6]. Another study on thirty-two patients reported that patients with chronic abdominal pain consistent with CP and normal ePFT might have abnormal findings on MRI/MRCP. The authors concluded that functional pancreatic testing alone might not be sufficient to detect early CP [35]. Another study on eighty-one patients suggested that MRI signal and enhancement characteristics may precede pancreatic exocrine insufficiency, which was assessed by fecal elastase [36]. Our study complements these publications by demonstrating the correlation of T1 SIR and ADV ratio with pancreatic fibrosis in addition to pancreatic exocrine dysfunction.
The correlation of T1 SIR p/m with the fibrosis score was less than the T1 SIR p/s and ADV ratio. We attribute the lesser correlation to the possibility of muscle atrophy with fatty replacement affecting the MR signal intensity. Spleen is less likely to undergo atrophy or fatty replacement; however, the splenic signal can be altered by hemosiderosis, one of our exclusion criteria. Another critical factor to avoid when making ROI measurements in MRI is the presence of edema secondary to acute pancreatitis. We excluded patients with acute pancreatitis from analysis to prevent the effect of edema on the T1 signal.
Our study was limited by low patient population, retrospective nature, and selection bias. All patients underwent surgery secondary to complications of CP. This selection bias led our study population to have higher fibrosis scores. We did not have any patients with a fibrosis score of 0; however, we had two cases with a score of 1, five patients with a score of 1, and three patients with a score of 3. Investigating subjects with a fibrosis score of 0 is very challenging since the histopathologic correlation studies are usually possible in advanced cases that require surgical treatment. If we performed an analysis on patients with malignancy, we could potentially increase the population size and find a fibrosis score of 0. However, it would be problematic to use Ammann’s score, which was specifically designed to assess fibrosis in CP.
Conclusion
There is a moderate negative correlation between the T1 Score (SIR p/s) and ADV ratio of the pancreas with the pancreatic fibrosis and substantial interobserver agreement. The correlation of these parenchymal metrics with pancreatic fibrosis was higher than what was observed with the Cambridge classification. These parenchymal features have the potential to become a biomarker for the severity of fibrosis and may assist physicians in clinical practice or clinical trials. Multi-institutional prospective studies are required to verify the T1 Score and ADV ratio as potential imaging biomarkers of pancreatic fibrosis and generate a new scoring system for CP.
Funding
Temel Tirkes is supported by National Cancer Institute and National Institute of Diabetes and Digestive and Kidney Diseases of the National Institutes of Health under award numbers 1R01DK116963 (Magnetic resonance imaging as a non-invasive method for the assessment of pancreatic fibrosis [MINIMAP]), U01DK127382 (Type 1 Diabetes in Acute Pancreatitis Consortium), U01DK108323 (Consortium for the Study of Chronic Pancreatitis, Diabetes, and Pancreatic Cancer), and R01CA260955 (Predicting Pancreatic Ductal Adenocarcinoma (PDAC) Using Artificial Intelligence Analysis of Pre-diagnostic Computed Tomography Images). Evan Fogel is supported by National Cancer Institute and National Institute of Diabetes and Digestive and Kidney Diseases of the National Institutes of Health under award numbers 1R01DK116963 (Magnetic resonance imaging as a noninvasive method for the assessment of pancreatic fibrosis [MINIMAP]), U01DK116743 (SpHincterotomy for Acute Recurrent Pancreatitis), U01DK127382 (Type 1 Diabetes in Acute Pancreatitis Consortium), and U01DK108323 (Consortium for the Study of Chronic Pancreatitis, Diabetes, and Pancreatic Cancer).
Abbreviations
- SIR
Signal Intensity Ratio
- ADV ratio
Arterial-to-delayed venous enhancement ratio
- CP
Chronic pancreatitis
- MRI
Magnetic Resonance Imaging
- MRCP
Magnetic Resonance Cholangiopancreatography
- ERCP
Endoscopic Retrograde Cholangiopancreatography
- ePFT
Endoscopic pancreatic function test
References
- 1.Stevens T, Conwell DL, Zuccaro G. Pathogenesis of chronic pancreatitis: an evidence-based review of past theories and recent developments. Am J Gastroenterol. 2004;99(11):2256–70. doi: 10.1111/j.1572-0241.2004.40694.x. [DOI] [PubMed] [Google Scholar]
- 2.Axon AT, Classen M, Cotton PB, Cremer M, Freeny PC, Lees WR. Pancreatography in chronic pancreatitis: international definitions. Gut. 1984;25(10):1107–12. doi: 10.1136/gut.25.10.1107 [DOI] [PMC free article] [PubMed] [Google Scholar]
- 3.Conwell DL, Lee LS, Yadav D, Longnecker DS, Miller FH, Mortele KJ, et al. American Pancreatic Association Practice Guidelines in Chronic Pancreatitis: evidence-based report on diagnostic guidelines. Pancreas. 2014;43(8):1143–62. doi: 10.1097/MPA.0000000000000237. [DOI] [PMC free article] [PubMed] [Google Scholar]
- 4.Swensson J, Akisik F, Collins D, Olesen SS, Drewes AM, Frokjaer JB. Is Cambridge scoring in chronic pancreatitis the same using ERCP and MRCP?: A need for revision of standards. Abdom Radiol (NY). 2021;46(2):647–54. doi: 10.1007/s00261-020-02685-2. [DOI] [PubMed] [Google Scholar]
- 5.Tirkes T, Shah ZK, Takahashi N, Grajo JR, Chang ST, Wachsman AM, et al. Inter-observer variability of radiologists for Cambridge classification of chronic pancreatitis using CT and MRCP: results from a large multi-center study. Abdom Radiol. 2020;45(5):1481–7. doi: 10.1007/s00261-020-02521-7. [DOI] [PMC free article] [PubMed] [Google Scholar]
- 6.Tirkes T, Fogel EL, Sherman S, Lin C, Swensson J, Akisik F, et al. Detection of exocrine dysfunction by MRI in patients with early chronic pancreatitis. Abdom Radiol. 2017;42(2):544–51. Epub 2016/09/24. doi: 10.1007/s00261-016-0917-2. [DOI] [PMC free article] [PubMed] [Google Scholar]
- 7.Tirkes T, Lin C, Fogel EL, Sherman SS, Wang Q, Sandrasegaran K. T1 mapping for diagnosis of mild chronic pancreatitis. J Magn Reson Imaging. 2017;45(4):1171–6. doi: 10.1002/jmri.25428. [DOI] [PMC free article] [PubMed] [Google Scholar]
- 8.Tirkes T, Lin C, Cui E, Deng Y, Territo PR, Sandrasegaran K, et al. Quantitative MR Evaluation of Chronic Pancreatitis: Extracellular Volume Fraction and MR Relaxometry. AJR Am J Roentgenol. 2018;210(3):533–42. doi: 10.2214/AJR.17.18606. [DOI] [PMC free article] [PubMed] [Google Scholar]
- 9.Winston CB, Mitchell DG, Outwater EK, Ehrlich SM. Pancreatic signal intensity on T1-weighted fat saturation MR images: clinical correlation. J Magn Reson Imaging. 1995;5(3):267–71. doi: 10.1002/jmri.1880050307 [DOI] [PubMed] [Google Scholar]
- 10.Balci NC, Smith A, Momtahen AJ, Alkaade S, Fattahi R, Tariq S, et al. MRI and S-MRCP findings in patients with suspected chronic pancreatitis: correlation with endoscopic pancreatic function testing (ePFT). J Magn Reson Imaging. 2010;31(3):601–6. doi: 10.1002/jmri.22085 [DOI] [PubMed] [Google Scholar]
- 11.Balci NC, Alkaade S, Magas L, Momtahen AJ, Burton FR. Suspected chronic pancreatitis with normal MRCP: findings on MRI in correlation with secretin MRCP. J Magn Reson Imaging. 2008;27(1):125–31. doi: 10.1002/jmri.21241. [DOI] [PubMed] [Google Scholar]
- 12.Frokjaer JB, Akisik F, Farooq A, Akpinar B, Dasyam A, Drewes AM, et al. Guidelines for the Diagnostic Cross Sectional Imaging and Severity Scoring of Chronic Pancreatitis. Pancreatology. 2018;18(7):764–73. doi: 10.1016/j.pan.2018.08.012. [DOI] [PubMed] [Google Scholar]
- 13.Tirkes T, Shah ZK, Takahashi N, Grajo JR, Chang ST, Venkatesh SK, et al. Reporting Standards for Chronic Pancreatitis by Using CT, MRI, and MR Cholangiopancreatography: The Consortium for the Study of Chronic Pancreatitis, Diabetes, and Pancreatic Cancer. Radiology. 2019;290(1):207–15. doi: 10.1148/radiol.2018181353. [DOI] [PMC free article] [PubMed] [Google Scholar]
- 14.Steinkohl E, Olesen SS, Mark EB, Hansen TM, Frandsen LK, Drewes AM, et al. Progression of parenchymal and ductal findings in patients with chronic pancreatitis: A 4-year follow-up MRI study. Eur J Radiol. 2020;125:108868. doi: 10.1016/j.ejrad.2020.108868. [DOI] [PubMed] [Google Scholar]
- 15.Esposito I, Hruban RH, Verbeke C, Terris B, Zamboni G, Scarpa A, et al. Guidelines on the histopathology of chronic pancreatitis. Recommendations from the working group for the international consensus guidelines for chronic pancreatitis in collaboration with the International Association of Pancreatology, the American Pancreatic Association, the Japan Pancreas Society, and the European Pancreatic Club. Pancreatology. 2020;20(4):586–93. doi: 10.1016/j.pan.2020.04.009. [DOI] [PubMed] [Google Scholar]
- 16.Barreto SG, Carati CJ, Toouli J, Saccone GT. The islet-acinar axis of the pancreas: more than just insulin. Am J Physiol Gastrointest Liver Physiol. 2010;299(1):G10–22. doi: 10.1152/ajpgi.00077.2010. [DOI] [PubMed] [Google Scholar]
- 17.Tang X, Kusmartseva I, Kulkarni S, Posgai A, Speier S, Schatz DA, et al. Image-Based Machine Learning Algorithms for Disease Characterization in the Human Type 1 Diabetes Pancreas. Am J Pathol. 2021;191(3):454–62. doi: 10.1016/j.ajpath.2020.11.010. [DOI] [PMC free article] [PubMed] [Google Scholar]
- 18.Atkinson MA, Campbell-Thompson M, Kusmartseva I, Kaestner KH. Organisation of the human pancreas in health and in diabetes. Diabetologia. 2020;63(10):1966–73. doi: 10.1007/s00125-020-05203-7. [DOI] [PMC free article] [PubMed] [Google Scholar]
- 19.Trikudanathan G, Walker SP, Munigala S, Spilseth B, Malli A, Han Y, et al. Diagnostic Performance of Contrast-Enhanced MRI With Secretin-Stimulated MRCP for Non-Calcific Chronic Pancreatitis: A Comparison With Histopathology. Am J Gastroenterol. 2015;110(11):1598–606. doi: 10.1038/ajg.2015.297. [DOI] [PubMed] [Google Scholar]
- 20.Liu C, Shi Y, Lan G, Xu Y, Yang F. Evaluation of Pancreatic Fibrosis Grading by Multiparametric Quantitative Magnetic Resonance Imaging. J Magn Reson Imaging. 2021;54(5):1417–29. doi: 10.1002/jmri.27626. [DOI] [PubMed] [Google Scholar]
- 21.Watanabe H, Kanematsu M, Tanaka K, Osada S, Tomita H, Hara A, et al. Fibrosis and postoperative fistula of the pancreas: correlation with MR imaging findings--preliminary results. Radiology. 2014;270(3):791–9. doi: 10.1148/radiol.13131194. [DOI] [PubMed] [Google Scholar]
- 22.Ammann RW, Heitz PU, Kloppel G. Course of alcoholic chronic pancreatitis: a prospective clinicomorphological long-term study. Gastroenterology. 1996;111(1):224–31. doi: 10.1053/gast.1996.v111.pm8698203. [DOI] [PubMed] [Google Scholar]
- 23.Zou KH, Tuncali K, Silverman SG. Correlation and simple linear regression. Radiology. 2003;227(3):617–22. doi: 10.1148/radiol.2273011499.. [DOI] [PubMed] [Google Scholar]
- 24.Crewson PE. Reader agreement studies. AJR Am J Roentgenol. 2005;184(5):1391–7. doi: 10.2214/ajr.184.5.01841391. [DOI] [PubMed] [Google Scholar]
- 25.Tirkes T, Yadav D, Conwell DL, Territo PR, Zhao X, Venkatesh SK, et al. Magnetic resonance imaging as a non-invasive method for the assessment of pancreatic fibrosis (MINIMAP): a comprehensive study design from the consortium for the study of chronic pancreatitis, diabetes, and pancreatic cancer. Abdom Radiol (NY). 2019;44(8):2809–21. doi: 10.1007/s00261-019-02049-5. [DOI] [PMC free article] [PubMed] [Google Scholar]
- 26.Yadav D, Park WG, Fogel EL, Li L, Chari ST, Feng Z, et al. PROspective Evaluation of Chronic Pancreatitis for EpidEmiologic and Translational StuDies: Rationale and Study Design for PROCEED From the Consortium for the Study of Chronic Pancreatitis, Diabetes, and Pancreatic Cancer. Pancreas. 2018;47(10):1229–38. doi: 10.1097/MPA.0000000000001170. [DOI] [PMC free article] [PubMed] [Google Scholar]
- 27.The Consortium for the Study of Chronic Pancreatitis, Diabetes and Pancreatic Cancer (CPDPC) NIDDK and NCI; 2015. https://cpdpc.mdanderson.org.
- 28.Tirkes T, Dasyam AK, Shah ZK, Fogel EL. Role of standardized reporting and novel imaging markers in chronic pancreatitis. Curr Opin Gastroenterol. 2021;37(5):512–9. doi: 10.1097/MOG.0000000000000766. [DOI] [PMC free article] [PubMed] [Google Scholar]
- 29.Balci C MRI assessment of chronic pancreatitis. Diagn Interv Radiol. 2011;17(3):249–54. doi: 10.4261/1305-3825.DIR.3889-10.0. [DOI] [PubMed] [Google Scholar]
- 30.Parakh A, Tirkes T. Advanced imaging techniques for chronic pancreatitis. Abdom Radiol (NY). 2020;45(5):1420–38. doi: 10.1007/s00261-019-02191-0. [DOI] [PMC free article] [PubMed] [Google Scholar]
- 31.Tirkes T, Mitchell JR, Li L, Zhao X, Lin C. Normal T1 relaxometry and extracellular volume of the pancreas in subjects with no pancreas disease: correlation with age and gender. Abdom Radiol (NY). 2019;44(9):3133–8. doi: 10.1007/s00261-019-02071-7. [DOI] [PMC free article] [PubMed] [Google Scholar]
- 32.Cheng M, Gromski MA, Fogel EL, DeWitt JM, Patel AA, Tirkes T. T1 mapping for the diagnosis of early chronic pancreatitis: correlation with Cambridge classification system. Br J Radiol. 2021;94(1121):20200685. doi: 10.1259/bjr.20200685. [DOI] [PMC free article] [PubMed] [Google Scholar]
- 33.Chong AK, Hawes RH, Hoffman BJ, Adams DB, Lewin DN, Romagnuolo J. Diagnostic performance of EUS for chronic pancreatitis: a comparison with histopathology. Gastrointest Endosc. 2007;65(6):808–14. doi: 10.1016/j.gie.2006.09.026. [DOI] [PubMed] [Google Scholar]
- 34.Varadarajulu S, Eltoum I, Tamhane A, Eloubeidi MA. Histopathologic correlates of noncalcific chronic pancreatitis by EUS: a prospective tissue characterization study. Gastrointest Endosc. 2007;66(3):501–9. doi: 10.1016/j.gie.2006.12.043. [DOI] [PubMed] [Google Scholar]
- 35.Alkaade S, Cem Balci N, Momtahen AJ, Burton F. Normal pancreatic exocrine function does not exclude MRI/MRCP chronic pancreatitis findings. J Clin Gastroenterol. 2008;42(8):950–5. doi: 10.1097/MCG.0b013e31812f4ef5. [DOI] [PubMed] [Google Scholar]
- 36.Bilgin M, Bilgin S, Balci NC, Momtahen AJ, Bilgin Y, Klor HU, et al. Magnetic resonance imaging and magnetic resonance cholangiopancreatography findings compared with fecal elastase 1 measurement for the diagnosis of chronic pancreatitis. Pancreas. 2008;36(1):e33–9. doi: 10.1097/mpa.0b013e318150e557. [DOI] [PubMed] [Google Scholar]