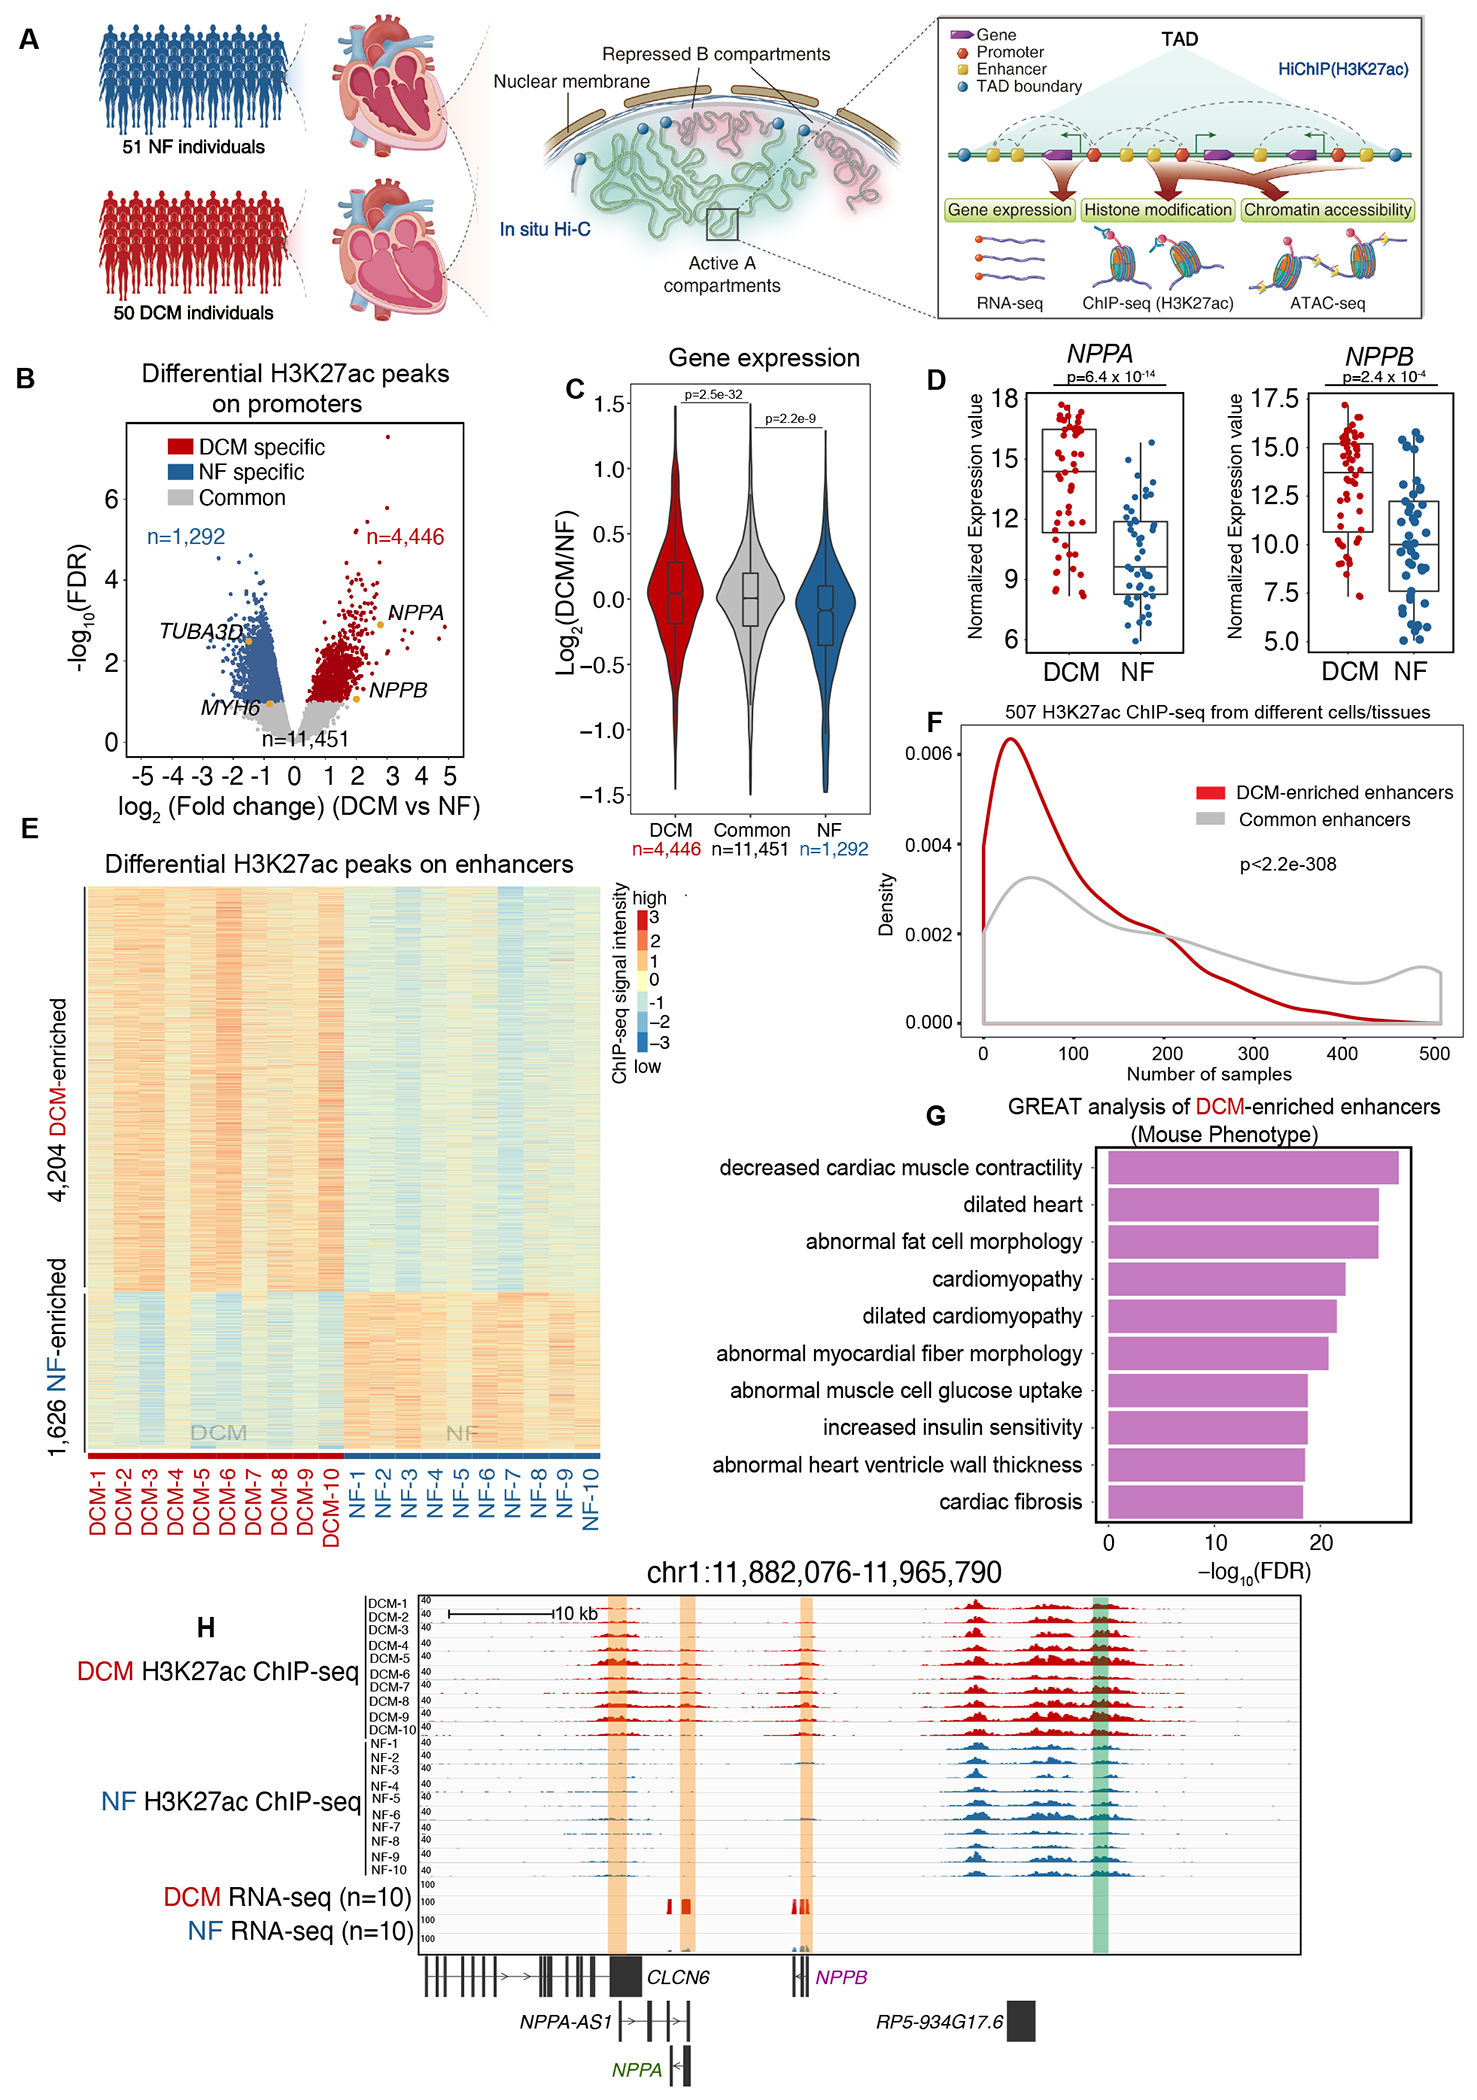
Figure 1. Genome-Wide Identification of Active CREs in DCM and NF Hearts.

A. Schematic representation of 3D epigenome and transcriptome mapping for 50 DCM and 51 NF left ventricle heart tissue samples (left panel). In situ Hi-C was performed to examine the active A compartment and B compartment and topologically associating domains (TADs) (middle panel). HiChIP (H3K27ac) was performed to map the interactome of the active CREs, which was annotated by H3K27ac ChIP-seq. ATAC-seq was used to identify chromatin accessibility on the CREs. RNA-seq was used to measure transcription output (right panel).
B. Volcano plot showing NF-enriched (n=1,292), DCM-enriched (n=4,446) and common (n=11,451) H3K27ac ChIP-seq peaks in promoter regions (within +/−2.5 kb of known transcription start sites (TSSs)) of DCM and NF hearts. Cardiac hypertrophy marker genes (NPPA, NPPB), normal cardiac marker gene (MYH6) and the cytoskeleton marker gene (TUBA3D) are labeled in yellow.
C. Violin plot showing expression bias for genes exhibiting specific H3K27ac peaks in promoter regions (n=4,446 DCM-enriched H3K27ac peaks, n=1,292 NF heart-enriched H3K27ac peaks and n=11,451 common H3K27ac peaks). Data were analyzed by Wilcoxon rank sum test with continuity correction.
D. Expression values (log2(normalized counts)) for NPPA and NPPB in 50 DCM and 51 NF heart RNA-seq datasets. Data were analyzed by Wald test.
E. Heatmap of DCM-enriched (n=4,204) and NF-enriched (n=1,626) H3K27ac ChIP-Seq peaks on enhancer regions in 10 DCM and 10 NF heart samples (rows represent peaks, and columns represent samples).
F. Enhancer breadth (number of cells/tissues in which an enhancer is activated) of DCM-enriched and common enhancers. DCM-enriched enhancers (red) are significantly more represented as tissue-enriched than common enhancers (grey). Data were analyzed by Kolmogorov-Smirnov test.
G. Bar chart showing the top 10 Ontology terms (Mouse Phenotype, from GREAT analysis) enriched for genes associated with DCM-enriched enhancers (ontology terms were ranked by negative log10(FDR) from smallest to largest).
H. Genome browser view of the genes NPPA and NPPB and their associated promoters and enhancers in DCM and NF hearts. Enhancer is highlighted in the green box, while promoter is highlighted in the orange box.
