

Abstract
Background & aims:
In our recent acute metabolic study, we found no differences in the anabolic response to differing patterns of dietary protein intake. To confirm this in a chronic study, we investigated the effects of protein distribution pattern on functional outcomes and protein kinetics in older adults over 8 weeks.
Methods:
To determine chronic effects of protein intake pattern at 1.1 g protein/kg/day in mixed meals on lean body mass (LBM), functional outcomes, whole body protein kinetics and muscle protein fractional synthesis rate (MPS) over 8-week respective dietary intervention, fourteen older subjects were randomly divided into either EVEN or UNVEN group. The UNEVEN group (n = 7) consumed the majority of dietary protein with dinner (UNEVEN, 15/20/65%; breakfast, lunch, dinner), while the EVEN group (n = 7) consumed dietary protein evenly throughout the day (EVEN: 33/33/33%).
Results:
We found no significant differences in LBM, muscle strength, and other functional outcomes between EVEN and UNEVEN before and after 8-week intervention. Consistent with these functional outcomes, we did not find significant differences in the 20-h integrated whole body protein kinetics [net protein balance (NB), protein synthesis (PS), and breakdown (PB)] above basal states and MPS between EVEN and UNEVEN intake patterns.
Conclusions:
We conclude that over an 8-week intervention period, the protein intake distribution pattern in mixed meals does not play an important role in determining anabolic response, muscle strength, or functional outcomes. This trial is registered at https://ClinicalTrials.gov as NCT02787889.
Keywords: Sarcopenia, Aging, Stable isotope tracer, Essential amino acids, Protein turnover
Graphical Abstract
1. Introduction
The benefits of increased protein intake on the age-related loss of muscle mass and strength, i.e., sarcopenia, and many related physiological functions is becoming increasingly evident [1]. The NHANES data indicates that the average protein consumption of both men and women over the age of 50 yrs is approximately 1.1 g/kg/d [2], or 77 g protein/d for 70 kg adults. NHANES data also suggests that the American pattern of dietary protein intake is typically skewed towards the evening meal, which constitutes more than half of total daily protein intake [3]. The preponderance of literature indicates that muscle protein synthesis (MPS) in resting conditions can be maximally stimulated with approximately 20–35 g of protein or 0.25 g–0.43 g/kg (based on average body weight: 80 kg) [4-7], depending on protein quality and individual age. These findings are consistent with the recent report by Moore et al. [8] showing that a maximal MPS response is achieved with 0.24 g/kg/meal and 0.4 g/kg/meal for young and older adults, respectively. The latter amount translates to the average protein intake (1.1 g/kg/d) of middle age and older American adults if an even distribution of protein intake throughout the day is assumed [2]. Thus, with the traditional pattern of meal intake (e.g., 15%/20%/65% of protein for breakfast, lunch, and dinner, respectively) in the United States, a maximal stimulation of MPS would theoretically occur only at the dinner meal of approximately 50 g of protein (for a 70 kg adult). In addition, this amount would theoretically exceed the protein intake required to elicit the maximal anabolic effect by ~80% (i.e., excess amount of 22 g protein). This observation led to the promulgation of a popular hypothesis that distributing total protein intake equally over three meals would result in a more frequent stimulation of MPS as compared to the traditional intake pattern [9]. Although recent acute metabolic studies in older individuals indicated no pattern effect of dietary protein intake [10,11], it has been argued that acute studies may not reflect functional changes over time [12]. Therefore, we hypothesized that 1) the 20-h integrated whole-body net protein balance and MPS would be greater with even vs. uneven distribution pattern of protein intake after the 8 week of dietary intervention; and 2) an even distribution pattern of dietary protein intake throughout the day would result in greater gains in lean mass, strength, and function after 8 weeks of dietary intervention.
2. Materials and methods
2.1. Subjects
Nineteen healthy male and female older adults [51–69 yrs] with body mass indexes between 25 and 30 kg/m2 were enrolled in the study (February 2014 through March 2015). Subject were excluded from the study participation if subjects had any of the followings: type I or II diabetes mellitus, active malignancy within the past 6 months, history of gastrointestinal bypass surgery, lactose intolerance or allergy to milk or milk products, a chronic inflammatory or other chronic disease (e.g., HIV/AIDS), low hematocrit or hemoglobin concentration, low platelets, current use of corticosteroids, any unstable medical conditions. Also excluded were subjects who participated in regular resistance exercise (>twice per week). All subjects actively signed written informed consent, and the study was approved by the Institutional Review Board at the University of Arkansas for Medical Sciences. Subjects were then randomly assigned to EVEN or UNEVEN group. Sample size for the present study that has been estimated based on the power analysis of muscle protein synthesis rate to detect effect sizes of 0.45 or larger were sixteen older subjects (8 subjects per group). We included fourteen older adult subjects [7 subjects per group; range of age: 51–69 yrs] for the final analyses (Table 1) due to subject dropout (n = 4) and screening failures (See CONSORT Diagram; Supplemental Fig. 1).
Table 1.
Group characteristics before and after 8-week dietary intervention.
| Groups | EVEN |
UNEVEN |
||
|---|---|---|---|---|
| Intervention period | Pre | Post | Pre | Post |
| N (M/F) | 7 (4/3) | 7 (2/5) | ||
| Age, yrs | 58.1 ± 2.4 | 60.3 ± 2.4 | ||
| Height, cm | 170.6 ± 3.3 | 170.9 ± 4.5 | ||
| Total mass, kg | 80.4 ± 2.4 | 78.9 ± 2.1 | 79.7 ± 4.7 | 76.9 ± 4.8 |
| BMI, kg/m2 | 27.7 ± 0.6 | 27.2 ± 0.7 | 27.2 ± 0.7 | 26.3 ± 0.9 |
| LBM, kg | 50.5 ± 2.7 | 50.3 ± 3.1 | 47.7 ± 4.2 | 46.9 ± 4.1 |
| Body fat mass, % | 31.8 ± 2.6 | 31.5 ± 2.9 | 35.3 ± 2.0 | 34.3 ± 2.4 |
Values are expressed as means ± SEM; M/F is the no. of male and female subjects in each group; BMI, body mass index; LBM, lean body mass.
2.2. Experimental design
During the screening visit, body composition was determined by dual-energy X-ray absorptiometry (DEXA, QDR-4500A; Hologic, Waltham, MA) (Table 1) and was repeated at 8 weeks while subjects remained on their respective diets. Eligible subjects were then randomly assigned by a study coordinator to one of two dietary pattern groups in a permuted block randomization method using a sealed envelope: UNEVEN group where subjects consumed 1.1 g protein/kg body weight/day in an uneven pattern (15/20/65% of total daily protein; breakfast/lunch/dinner, respectively); or an EVEN group where subjects consumed the same amount of protein in an even pattern (~33% of total protein with each meal) for an 8-week dietary intervention period. After the screening, a 3-d dietary record and instruction were given to all subjects. The Clinical Research Services Core (CRSC) research dietician used the information from these dietary records to estimate their habitual food intake including the amount of protein intake and food preferences. Diets were configured to provide adequate caloric intake to maintain stable body weight over the 8-week intervention period using the Harris–Benedict equation and their level of physical activity (range of physical activity factor used = 1.38–1.83), and a daily vitamin/mineral supplement was included. The study dietician prepared all diets in the Metabolic Kitchen at the CRSC (Table 2). Diets were prepared to maximize protein intake from high quality protein sources including egg, dairy, and beef (31.4 ± 0.3% of EAA in the dietary protein). Individuals adhering to a purely vegan diet were excluded from the study because of the difficulty in matching the quality of protein with the other diets. Each distribution pattern was consumed for a total of 8 weeks. Primary outcomes were studied before and after the 8-week dietary intervention, and included body composition (lean body mass) and muscle strength and functional outcomes (see Strength and functional tests). Secondary outcomes i.e., whole body protein kinetics (protein synthesis, protein breakdown, and net balance) and MPS were also determined at the beginning and end of the 8-week dietary intervention period. Subjects obtained their meal allotment from the study coordinator at the Reynolds Institute on Aging (RIOA) twice each week. Prior to dietary intervention, subjects were provided a dietary record and point-and-shoot digital camera to record all the information regarding their food intake including the time of meal consumption and the amount of food leftover [10], which helped the study dietician ascertain calorie/protein intake as well as study compliance. This trial is registered at http://ClinicalTrials.gov under NCT02787889.
Table 2.
Interventional diet during the entire study period.
| Groups | EVEN | UNEVEN | |
|---|---|---|---|
| Daily energy intake, kcal | Total | 2390 ± 139 | 2194 ± 162 |
| Per kg | 29.7 ± 1.4 | 27.5 ± 0.9 | |
| Protein, g | B | 29.3 ± 0.9 | 13.1 ± 0.8*** |
| L | 29.3 ± 0.8 | 17.7 ± 1.1*** | |
| D | 29.2 ± 0.9 | 55.6 ± 3.6*** | |
| Total | 87.8 ± 2.6 | 86.4 ± 4.9 | |
| Fat, g | B | 25.8 ± 1.5 | 12.2 ± 0.8*** |
| L | 38.0 ± 2.1 | 25.1 ± 2.0*** | |
| D | 29.0 ± 2.7 | 46.4 ± 4.0** | |
| Total | 92.8 ± 6.3 | 83.6 ± 6.6 | |
| Carbohydrate, g | B | 100.0 ± 6.6 | 88.5 ± 5.2 |
| L | 99.1 ± 3.1 | 84.9 ± 6.0 | |
| D | 109.4 ± 10.8 | 106.9 ± 11.5 | |
| Total | 308.5 ± 19.6 | 280.3 ± 21.8 | |
| Fiber, g | B | 5.7 ± 0.4 | 5.2 ± 0.3 |
| L | 9.8 ± 0.4 | 8.0 ± 0.6* | |
| D | 10.1 ± 0.7 | 9.9 ± 0.8 | |
| Total | 25.6 ± 1.3 | 23.0 ± 1.5 |
Values are expressed as means ± SEM; B, breakfast; L, lunch; D, Dinner. Independent student t-test revealed no differences in daily total intakes of energy, protein, fat, carbohydrate, and fiber. Significant differences in B, L, or D existed between the EVEN and the UNEVEN as the study was designed for
p < 0.05
p < 0.01
p < 0.001.
2.3. Strength and functional tests
One repetition maximum (1RM) for knee extension [13] and handgrip strength (dominant hand) were determined. Subjects also performed a battery of functional tests. For the 5-repetition sit-to-stand test, subjects were asked to start seated with arms crossed over chest and were timed from start until seated for 5th time. For the stair ascent/descent power test, subjects were asked to start at bottom or at top until both feet touch upper landing or lower landing, respectively [14]. For the 10-m maximal gait speed test, subjects were asked to walk for 20 m distance as fast as possible while the middle 10 m was timed. All the strength and functional tests were performed several days before the initiation of dietary intervention and several days before the second infusion studies. During the second strength and functional tests, subjects were on their respective interventional diets.
2.4. Stable isotope tracer infusion protocol
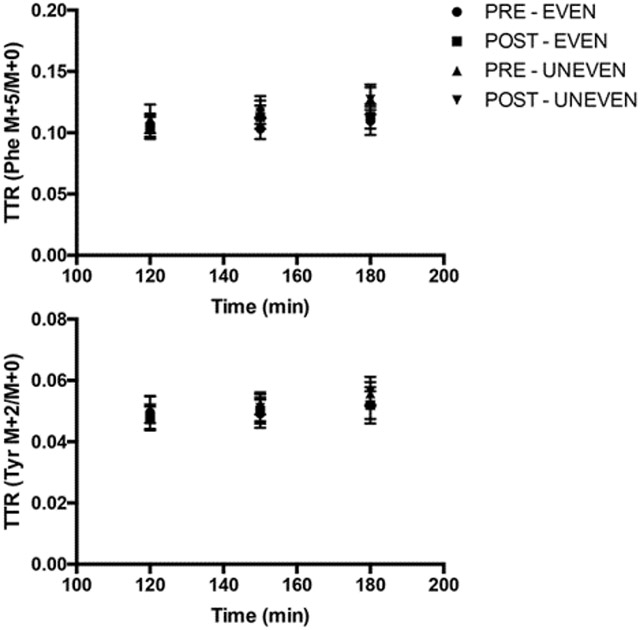
A metabolic study was performed before and after the 8-week dietary intervention. Following a 3-day dietary control, subjects reported to the RIOA after an overnight (after 2200 h) fast for the first metabolic infusion study during which subjects consumed meal for their respective intake pattern. The same metabolic study was repeated after the 8-week dietary intervention. The 23-h stable isotope tracer infusion protocol is depicted in Fig. 1. During each metabolic study, a IV catheter was inserted into each lower arm; one for the tracer infusion and the other for the sampling of “arterialized” blood [15]. To determine background isotopic enrichments and blood chemistry, a blood sample was collected prior to the initiation of the tracer infusion. Then, primed continuous infusions of L-[2H5]phenylalanine (prime, 4.60 μmol/kg; rate, 3.92 μmol/kg/h) and L-[2H2]tyrosine (prime, 0.95 μmol/kg; rate, 1.57 μmol/kg/h) were performed to determine in vivo whole body protein kinetics. A priming dose of L-[2H4]tyrosine was also administered (prime: 0.33 μmol/kg) for achieving an isotopic steady-state of L-[ 2H4]-tyrosine enrichment derived from L-[2H5] phenylalanine tracer infused (Cambridge Isotope Laboratories, Andover, MA). For measurements of tracer enrichment and blood concentrations of glucose, insulin and leucine, blood samples were taken at 0, 120, 150, 180, 210, 240, 270, 300, 330, 360, 480, 510, 540, 570, 630, 660, 720, 750, 780, 810, 840, 900, 960, 1020, 1080, 1140, 1200, 1260, 1320, 1380 min (total: approx. 180 mL). Meals were provided at 180, 450, and 720 min. To reduce the catabolic effects of 23 h of bed rest during the infusion of tracers, subjects walked on a treadmill for 15 min at 3.22 km/h starting at 660 min of the metabolic study immediately before the dinner meal. The first muscle biopsy from the vastus lateralis was taken 2.5 h (at 150 min) after the initiation of tracer infusion. The second muscle biopsy was taken at the end of the metabolic study (at 1380 min).
Fig. 1.
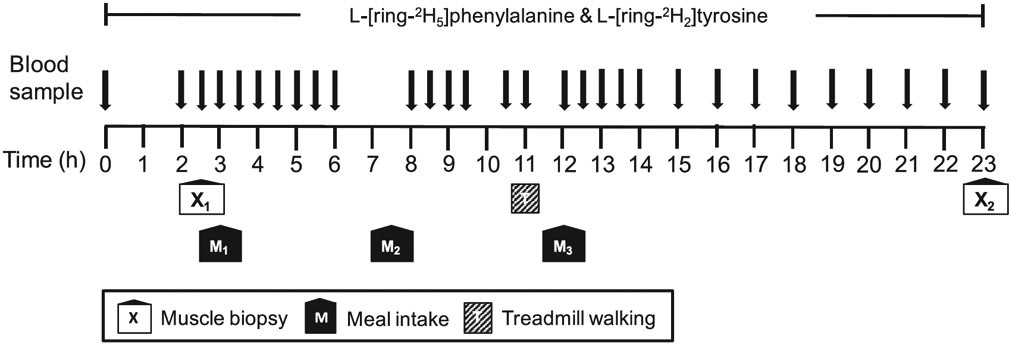
Infusion protocol utilized for each metabolic study before and after the 8 weeks of each nutritional intervention.
2.5. Analytic methods
Tracer enrichments and leucine concentrations were determined by gas-chromatography mass spectrometry (GCMS: Models 7890A/5975, Agilent Technologies, Inc. Santa Clara CA) as previously described [10,16]. Plasma glucose concentrations were measured spectrophotometrically on a Cobas c 111 analyzer (Roche, F. Hoffman-La Roche Ltd, Basel, Switzerland). Plasma insulin concentrations were measured by using commercially available human insulin ELISA kit (Alpco Diagnostics, Salem, USA).
2.6. Calculations of protein kinetics
Whole body protein kinetics [protein synthesis (PS), protein breakdown (PB), and net protein balance (NB), g protein•1200 min−1] were calculated as previously described [10,16]. For the estimation of the amount of exogenous protein (g) that are appearing as amino acids in the circulation as a result of the exogenous protein digestion, we accounted for digestibility (65%) of amino acids in older adults [17].
2.7. Statistical analysis
Paired t-tests were performed to assess the time effect (pre vs. post) within each protein distribution pattern group for each outcomes measure. Independent t-tests were performed to compare differences in macronutrient consumptions between distribution pattern groups. A one-factor analysis of covariance (ANCOVA) model was used to evaluate the effect for protein distribution pattern (Even vs. Uneven) for each outcomes measure. Baseline values were included as covariates to adjust for each subject's starting values. Statistical significance was declared when p-values are less than 0.05. In cases where multiple testing was necessary, Hommel's method was used to adjust the p-values. All data were analyzed using PROC GLM in SAS (SAS Institute Inc., Cary, NC).
3. Results
3.1. Changes in body composition and functional outcomes
LBM, muscle strength, and functional outcomes are presented in Table 3. There were no changes from pre- to post-dietary intervention (for all, p > 0.05) and no differences between patterns in LBM, sit-to-stand speed, 10 m gait speed, handgrip strength, 1RM knee extension, stair ascent power, or stair descent power (for all, p > 0.05).
Table 3.
Changes in muscle strength and function before and after 8-week dietary intervention.
| Groups | EVEN |
UNEVEN |
||
|---|---|---|---|---|
| Pre | Post | Pre | Post | |
| 1RM knee extension, kg | 59.2 ± 5.6 | 73.1 ± 7.4* | 45.8 ± 6.1 | 52.3 ± 8.7 |
| Sit-stand speed, s | 10.4 ± 0.9 | 8.0 ± 1.0 | 10.5 ± 1.7 | 9.7 ± 1.2 |
| 10 m gait speed, s | 5.6 ± 0.6 | 5.0 ± 0.4 | 6.2 ± 0.6 | 6.7 ± 0.6 |
| Handgrip strength, kg | 37.5 ± 3.8 | 40.7 ± 4.5 | 33.0 ± 4.6 | 32.9 ± 3.9 |
| Stair ascend power, Nm/s | 347.9 ± 15.7 | 360.3 ± 30.3 | 290.6 ± 46.6 | 282.7 ± 46.6 |
| Stair descend power, Nm/s | 363.9 ± 16.8 | 401.1 ± 32.7 | 300.8 ± 53.7 | 304.6 ± 58.1 |
Values are expressed as means ± SEM; 1RM, 1 repetition maximum. There were no differences in any of the functional outcomes between the EVEN and the UNEVEN (for all, p > 0.05). Power was calculated as body weight (kg) × 9.8 m/s2 × vertical height of the stairs (m) ÷ time (s) [14].
3.2. Protein kinetics at whole body and muscle levels
The 20-h integrated whole-body kinetics (180–1380 min) were calculated as changes from the fasted state to the fed state (i.e., fed minus fasted kinetic values) (Fig. 2). Positive NB (PS – PB) was achieved with UNEVEN and EVEN before and after the 8-week dietary intervention. The positive NB in both patterns was achieved entirely through reductions in PB from the fasted states, as PS in both patterns was decreased below the fasted states before and after the intervention. There were no effects of pattern and time (post vs. pre-intervention) on NB, PS, and PB (for all, p > 0.05). Consistent with the whole body protein kinetics in the present study, the 8-week dietary intervention did not change MPS. There were no differences from pre- to post-dietary intervention (p > 0.05) and no differences in pattern (p = 0.980) on MPS (Fig. 3).
Fig. 2.
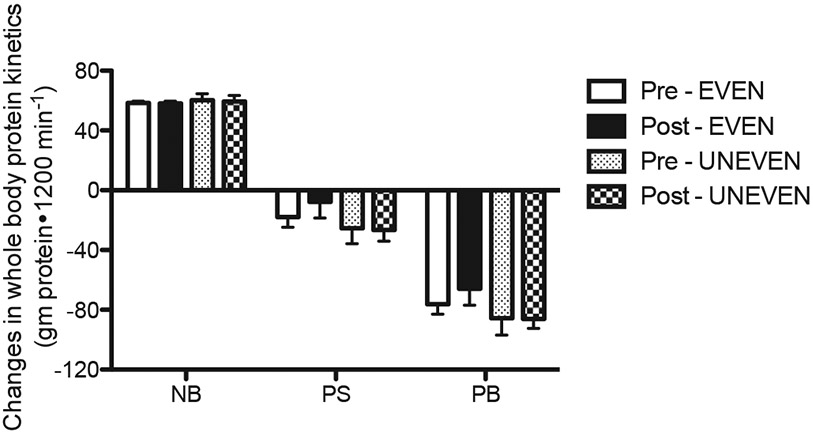
Changes in the rates of 20-h whole body protein synthesis (PS), protein breakdown (PB), and net protein balance (NB) from the fasted state before and after 8 weeks of each dietary intervention. Values are expressed as means ± SEM.
Fig. 3.
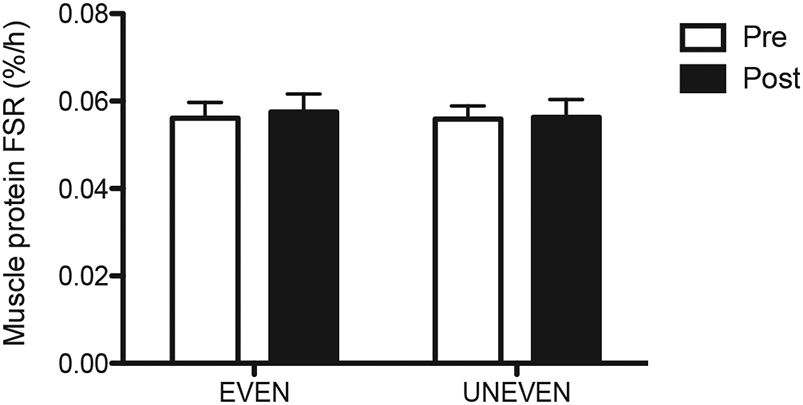
Muscle protein fractional synthesis rate (MPS) with EVEN or UNEVEN before and after 8 weeks of each dietary intervention. Values are expressed as means ± SEM.
3.3. Plasma concentrations
Plasma responses of glucose insulin and leucine are presented in Fig. 4. Plasma responses of glucose insulin and leucine are expressed as area under the curves (AUC). There were no differences from pre- to post-dietary intervention and no differences in pattern on glucose, insulin and leucine AUC responses (for all, p > 0.05).
Fig. 4.
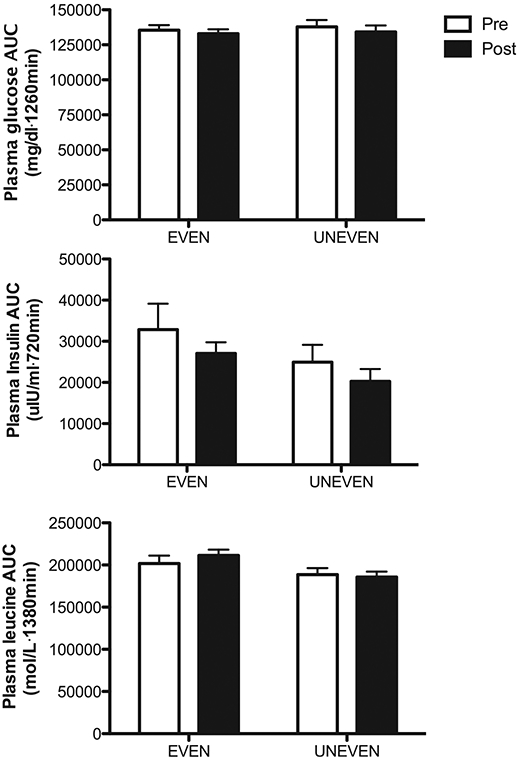
Area under the curve (AUC) for plasma glucose insulin and leucine before and after 8 weeks of respective dietary intervention. Values are expressed as means ± SEM.
4. Discussion
In our previous acute metabolic study, we demonstrated that even distribution of protein intake did not further increase the anabolic responses to dietary protein at either the whole body or muscle levels [10] when compared to an uneven pattern of protein intake. To confirm whether this relation occurs in a longitudinal outcomes study, we investigated effects of protein intake pattern on LBM, muscle strength, and functional outcomes over 8 weeks. As predicted by the results of our acute metabolic study [10], we found no differences in LBM, strength, or functional outcomes between patterns following 8 weeks of either dietary paradigm. The improvement in 1RM knee extension is inconsistent with other outcomes in both EVEN and UNEVEN after 8-weeks and is most likely a learning effect. The 1RM test was performed only once at the baseline, while the other tests were familiarized and performed 2–3 times, which average scores reported. In retrospect, an extra 1RM familiarization would most likely have eliminated this incongruent finding and been consistent with the fact that no differences were detected between groups in any of the functional tests.
Since stimulation of net anabolic response is the metabolic basis for maintaining or increasing muscle mass [18], strength, and function [13], we also determined protein kinetics at muscle and whole body levels before and after a 8-week of each dietary intervention. Consistent with our previous findings [10] and extrapolated to the functional outcomes of the present study, we found no pattern effects of protein intake on whole body net protein balance and MPS before and after the 8-week dietary intervention. In agreement with our findings, Murphy et al. [11] demonstrated that MPS responses were not different in older adults subjected to UNEVEN (7/17/72/4% B/L/D, and pre-bed snack) or UNEVEN (25% per each) diets at 1.3 g protein/kg/day. However, Mamerow et al. [19] in relatively younger adults (37 ± 3 y) showed that MPS responses were greater with EVEN (33% per meal) compared to the UNEVEN (11/17/72% for breakfast, lunch, and dinner) at 1.2 g protein/kg/day. An age-associated anabolic resistance to protein-containing meals [8,20,21] may be a potential explanation for the discordant findings. For example, in the study by Mamerow et al. [19], the average amount of protein eaten per meal (~0.39 g protein/kg per meal) in the EVEN groups was greater than the “optimal” protein dose (0.24 g/kg/meal) that is effective for maximal MPS responses in young subjects [22]. Thus, in the Mamerow work, the EVEN group achieved a maximal MPS response every meal intake, while the UNEVEN group achieved a maximal MPS response only with the dinner meal. In the present study, although similar amounts of protein intake (0.37 g/kg/meal on average) in the EVEN group approaches the optimal protein dose (i.e., 0.40 g/kg/meal) for maximal MPS in older adults, it may be slightly “suboptimal” to account for the majority of older subjects (i.e., <0.59 g/kg/meal) [22]. Moreover, it is likely that in the context of mixed meal, greater protein intake is required to achieve similar aminoacidemia (particularly leucine) to trigger maximal MPS responses. For example, it has been shown that peak leucine concentrations were 300% of basal concentrations following only 7 g of EEA intake [21]. However, in the present study, it was only 140% of the basal concentrations in EVEN groups with a far greater amount of protein intake (>14 g EAA). Consistent with this finding, the pattern effect was not discernable following mixed meal intake with higher protein in our previous study [10]. Furthermore, a recent study supports our assertion by demonstrating a positive association between protein intake, leg lean mass, and strength at a level of ~45 g protein/meal, or 0.55 g protein/kg/meal [23]. Lastly, it may be argued that the null effect would be due to sex differences with respect to MPS (i.e., lower anabolic response to protein or amino acid in older women) [24]. If true, it would manifest as an increased opportunity to observe a greater anabolic response in the EVEN pattern, as more women were in the EVEN. Furthermore, as in our previous study [10], we found that both older men and women responded similarly to mixed meals containing varying amounts of dietary protein.
It is possible that the null finding may be due to an insufficient duration of the intervention. However, the evidence for this hypothesis is not strong. A recent study demonstrated that a 12-week EAA supplementation (1260 g EAA over 12 weeks) resulted in a 1.7 kg gain of LBM in older women [25]. In the present study, the subjects consumed approximately 448 g EAAs (32% EAA in the proteins) from the dietary protein over the 8-week intervention period. Thus, if a pattern effect existed, we would have expected an increase in LBM of approximately 0.60 kg, which did not occur.
It is primarily the stimulation of protein synthesis that leads to a greater net protein balance following an ingestion of pure EAA or protein alone [21,26]. However, in the context of mixed meal, the main driving force for the improved net protein balance at the whole-body level, and potentially at muscle (though not measured), appears to be a suppression of protein breakdown. In this present study, we presented whole body protein kinetic data as changes from the fasted to the fed states (i.e., fed – fasted states), as these metabolic changes would account for physiological outcomes. We found that 1.1 g/kg/d of protein intake, regardless of the intake pattern, resulted in a positive protein balance attributable to reductions in protein breakdown. In fact, protein synthesis was actually reduced from the fasted to fed state. It is likely the insulin response to the mixed meal was at least in part responsible for the decrease in protein synthesis [27]. Since the total availability of intracellular EAA (i.e., from breakdown and inward transport from plasma) is a primary determinant of protein synthesis [18] and total plasma leucine responses were not different between patterns, it is likely that the reduction in protein synthesis in response to a meal ingestion in both groups was an indirect suppressive effect of insulin on protein breakdown.
Although our current results do not support the anabolic impact of an even pattern of protein intake, increasing protein intake at each meal would promote protein intake above RDA and realize the demonstrated effects in older adults [1,10,23]. In an older population, protein intake is often confounded by a myriad of issues ranging from cost to their ability to chew. Since the consolidated message of our work indicates that, with regard to the anabolic response, the pattern of intake is of minimal importance as compared to the amount of protein eaten [10], it is reasonable to recommend that daily protein intake be distributed in a manner most convenient to an older population.
In conclusion, in older adults consuming an average amount of protein, the distribution pattern of protein intake in mixed meals does not affect changes in lean body mass, muscle strength or muscle function, nor result in changes in whole body net protein balance or MPS after 8 weeks of dietary intervention.
Supplementary Material
Acknowledgment
We thank the research subjects for their participation in the study. We also thank the research staffs/associates for their support in conducting isotope tracer infusion protocols and sample analyses: Cosby J. Lasley for coordinating study subjects, conducting the isotope infusion studies and strength/functional tests; Josh Spore for conducting the isotope infusion studies, strength/functional tests, and determination of blood chemistry; Rick Williams for gas-chromatography mass-spectrometry analysis and determination of blood chemistry. We also thank Deb Viane for her administrative assistance. Lastly, we thank the study dietician Amanda M. Dawson for preparing study foods for subjects.
Funding sources
The project was financially supported by a grant from National Dairy Council, Egg Nutrition Center, and National Cattlemen's Beef Association. This project was partially supported by Pepper Center Grant PG30-AG-028718 and Award Number UL1-TR-000039 and KL2-TR-000063 from the National Center for Advancing Translations Sciences (NCATS).
Footnotes
Conflict of interest
Dr. Wolfe has received research grants and honoraria from the National Cattleman's Beef Checkoff program. Other authors have no potential conflicts of interest.
Appendix A. Supplementary data
Supplementary data related to this article can be found at http://dx.doi.org/10.1016/j.clnu.2017.02.020.
References
- [1].Wolfe RR, Miller SL, Miller KB. Optimal protein intake in the elderly. Clin Nutr 2008;27:675–84. 10.1016/j.clnu.2008.06.008. [DOI] [PubMed] [Google Scholar]
- [2].Fulgoni VL. Current protein intake in America: analysis of the National Health and Nutrition Examination Survey, 2003-2004. Am J Clin Nutr 2008;87:1554S–7S. [DOI] [PubMed] [Google Scholar]
- [3].USDA Agricultural Research Service. Energy intake: percentages of energy from protein, carbohydrate, fat, and alcohol, by gender and age, what we eat in America, NHANES 2013-2014. 2016. Available from: www.ars.usda.gov.
- [4].Witard OC, Jackman SR, Breen L, Smith K, Selby A, Tipton KD. Myofibrillar muscle protein synthesis rates subsequent to a meal in response to increasing doses of whey protein at rest and after resistance exercise. Am J Clin Nutr 2014;99:86–95. 10.3945/ajcn.112.055517. [DOI] [PubMed] [Google Scholar]
- [5].Yang Y, Churchward-Venne TA, Burd NA, Breen L, Tarnopolsky MA, Phillips SM. Myofibrillar protein synthesis following ingestion of soy protein isolate at rest and after resistance exercise in elderly men. Nutr Metab (Lond) 2012;9:57. 10.1186/1743-7075-9-57. [DOI] [PMC free article] [PubMed] [Google Scholar]
- [6].Yang Y, Breen L, Burd NA, Hector AJ, Churchward-Venne TA, Josse AR, et al. Resistance exercise enhances myofibrillar protein synthesis with graded intakes of whey protein in older men. Br J Nutr 2012;108:1780–8. 10.1017/S0007114511007422. [DOI] [PubMed] [Google Scholar]
- [7].Symons TB, Sheffield-Moore M, Wolfe RR, Paddon-Jones D. A moderate serving of high-quality protein maximally stimulates skeletal muscle protein synthesis in young and elderly subjects. J Am Diet Assoc 2009;109:1582–6. 10.1016/j.jada.2009.06.369. [DOI] [PMC free article] [PubMed] [Google Scholar]
- [8].Moore DR, Churchward-Venne TA, Witard O, Breen L, Burd NA, Tipton KD, et al. Protein ingestion to stimulate myofibrillar protein synthesis requires greater relative protein intakes in healthy older versus younger men. J Gerontol A Biol Sci Med Sci 2015;70:57–62. 10.1093/gerona/glu103. [DOI] [PubMed] [Google Scholar]
- [9].Paddon-Jones D, Rasmussen BB. Dietary protein recommendations and the prevention of sarcopenia. Curr Opin Clin Nutr Metab Care 2009;12:86–90. 10.1097/MCO.0b013e32831cef8b. [DOI] [PMC free article] [PubMed] [Google Scholar]
- [10].Kim I-Y, Schutzler S, Schrader A, Spencer H, Kortebein P, Deutz NEP, et al. Quantity of dietary protein intake, but not pattern of intake, affects net protein balance primarily through differences in protein synthesis in older adults. Am J Physiol Endocrinol Metab 2015;308:E21–8. 10.1152/ajpendo.00382.2014. [DOI] [PMC free article] [PubMed] [Google Scholar]
- [11].Murphy CH, Churchward-Venne TA, Mitchell CJ, Kolar NM, Kassis A, Karagounis LG, et al. Hypoenergetic diet-induced reductions in myofibrillar protein synthesis are restored with resistance training and balanced daily protein ingestion in older men. Am J Physiol Endocrinol Metab 2015;308: E734–43. 10.1152/ajpendo.00550.2014. [DOI] [PMC free article] [PubMed] [Google Scholar]
- [12].Mitchell CJ, Churchward-Venne TA, Parise G, Bellamy L, Baker SK, Smith K, et al. Acute post-exercise myofibrillar protein synthesis is not correlated with resistance training-induced muscle hypertrophy in young men. PLoS One 2014;9:e89431. 10.1371/journal.pone.0089431. [DOI] [PMC free article] [PubMed] [Google Scholar]
- [13].Borsheim E, Bui Q-UT, Tissier S, Kobayashi H, Ferrando AA, Wolfe RR. Effect of amino acid supplementation on muscle mass, strength and physical function in elderly. Clin Nutr 2008;27:189–95. 10.1016/j.clnu.2008.01.001. [DOI] [PMC free article] [PubMed] [Google Scholar]
- [14].Ferrando AA, Paddon-Jones D, Hays NP, Kortebein P, Ronsen O, Williams RH, et al. EAA supplementation to increase nitrogen intake improves muscle function during bed rest in the elderly. Clin Nutr 2010;29:18–23. 10.1016/j.clnu.2009.03.009. [DOI] [PubMed] [Google Scholar]
- [15].Abumrad NN, Rabin D, Diamond MP, Lacy WW. Use of a heated superficial hand vein as an alternative site for the measurement of amino acid concentrations and for the study of glucose and alanine kinetics in man. Metab Clin Exp 1981;30:936–40. [DOI] [PubMed] [Google Scholar]
- [16].Kim I-Y, Schutzler S, Schrader A, Spencer HJ, Azhar G, Ferrando AA, et al. The anabolic response to a meal containing different amounts of protein is not limited by the maximal stimulation of protein synthesis in healthy young adults. Am J Physiol Endocrinol Metab 2016;310:E73–80. 10.1152/ajpendo.00365.2015. [DOI] [PMC free article] [PubMed] [Google Scholar]
- [17].Volpi E, Mittendorfer B, Wolf SE, Wolfe RR. Oral amino acids stimulate muscle protein anabolism in the elderly despite higher first-pass splanchnic extraction 1999;277:E513–20. [DOI] [PubMed] [Google Scholar]
- [18].Wolfe RR. Regulation of muscle protein by amino acids. J Nutr 2002;132:3219S–24S. [DOI] [PubMed] [Google Scholar]
- [19].Mamerow MM, Mettler JA, English KL, Casperson SL, Arentson-Lantz E, Sheffield-Moore M, et al. Dietary protein distribution positively influences 24-h muscle protein synthesis in healthy adults. J Nutr 2014;144:876–80. 10.3945/jn.113.185280. [DOI] [PMC free article] [PubMed] [Google Scholar]
- [20].Burd NA, Gorissen SH, van Loon LJC. Anabolic resistance of muscle protein synthesis with aging. Exerc Sport Sci Rev 2013;41:169–73. 10.1097/JES.0b013e318292f3d5. [DOI] [PubMed] [Google Scholar]
- [21].Katsanos CS, Kobayashi H, Sheffield-Moore M, Aarsland A, Wolfe RR. Aging is associated with diminished accretion of muscle proteins after the ingestion of a small bolus of essential amino acids. Am J Clin Nutr 2005;82:1065–73. [DOI] [PubMed] [Google Scholar]
- [22].Moore DR, Robinson MJ, Fry JL, Tang JE, Glover EI, Wilkinson SB, et al. Ingested protein dose response of muscle and albumin protein synthesis after resistance exercise in young men. Am J Clin Nutr 2009;89:161–8. 10.3945/ajcn.2008.26401. [DOI] [PubMed] [Google Scholar]
- [23].Loenneke JP, Loprinzi PD, Murphy CH, Phillips SM. Per meal dose and frequency of protein consumption is associated with lean mass and muscle performance. Clin Nutr 2016;35(6):1506–11. 10.1016/j.clnu.2016.04.002. [DOI] [PubMed] [Google Scholar]
- [24].Smith GI, Mittendorfer B. Sexual dimorphism in skeletal muscle protein turnover. J Appl Physiol 2016;120:674–82. 10.1152/japplphysiol.00625.2015. [DOI] [PMC free article] [PubMed] [Google Scholar]
- [25].Dillon EL, Sheffield-Moore M, Paddon-Jones D, Gilkison C, Sanford AP, Casperson SL, et al. Amino acid supplementation increases lean body mass, basal muscle protein synthesis, and insulin-like growth factor-I expression in older women. J Clin Endocrinol Metab 2009;94:1630–7. 10.1210/jc.2008-1564. [DOI] [PMC free article] [PubMed] [Google Scholar]
- [26].Volpi E, Ferrando AA, Yeckel CW, Tipton KD, Wolfe RR. Exogenous amino acids stimulate net muscle protein synthesis in the elderly. J Clin Investig 1998;101:2000–7. 10.1172/JCI939. [DOI] [PMC free article] [PubMed] [Google Scholar]
- [27].Biolo G, Declan Fleming RY, Wolfe RR. Physiologic hyperinsulinemia stimulates protein synthesis and enhances transport of selected amino acids in human skeletal muscle. J Clin Investig 1995;95:811–9. 10.1172/JCI117731. [DOI] [PMC free article] [PubMed] [Google Scholar]
Associated Data
This section collects any data citations, data availability statements, or supplementary materials included in this article.