A method is described to reconstruct the 3D molecular structure without the need for particle picking in the random conical tilt scheme. The results show promise to reduce the size limit for single-particle reconstruction in cryo-electron microscopy.
Keywords: cryo-EM, random conical tilt, autocorrelation analysis, structure reconstruction
Abstract
A method is proposed to reconstruct the 3D molecular structure from micrographs collected at just one sample tilt angle in the random conical tilt scheme in cryo-electron microscopy. The method uses autocorrelation analysis on the micrographs to estimate features of the molecule which are invariant under certain nuisance parameters such as the positions of molecular projections in the micrographs. This enables the molecular structure to be reconstructed directly from micrographs, completely circumventing the need for particle picking. Reconstructions are demonstrated with simulated data and the effect of the missing-cone region is investigated. These results show promise to reduce the size limit for single-particle reconstruction in cryo-electron microscopy.
1. Introduction
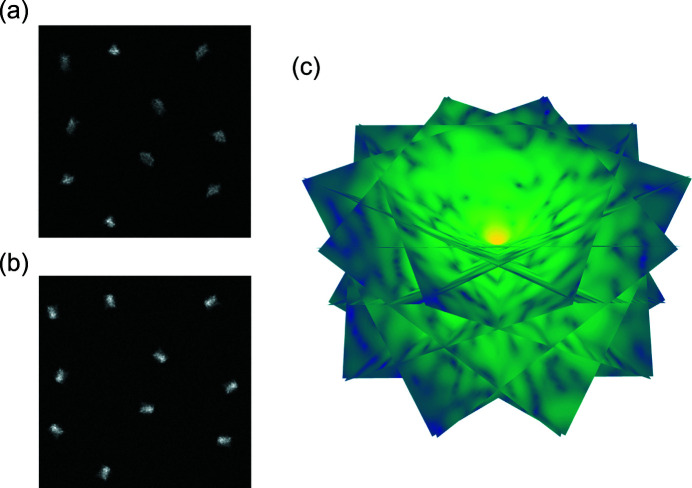
Random conical tilt (RCT) (Radermacher et al., 1987 ▸; Radermacher, 1988 ▸; Sorzano et al., 2015 ▸) is an important technique in single-particle cryo-electron microscopy (cryo-EM) to generate a de novo 3D reconstruction, which provides an unbiased initial model for a subsequent iterative refinement process to determine high-resolution structures. The technique applies to molecules that have a preferred orientation to the 2D substrate they are deposited on and random in-plane rotations. The standard data collection scheme of RCT involves measuring pairs of images, or micrographs, of the same field of view: one with a large sample tilt angle [Fig. 1 ▸(a)] and one with no tilt [Fig. 1 ▸(b)]. Since the micrograph pairs contain projections of each molecule at two views that are physically related, one can first estimate the in-plane rotation of each molecule by aligning the molecular projections measured in the untilted micrographs and then assemble the corresponding molecular projections recorded in the tilted micrographs to reconstruct the 3D molecular structure, as shown in Fig. 1 ▸(c).
Figure 1.
The micrographs of the same field of view collected at (a) one large sample tilt angle and (b) no tilt. (c) The Fourier transforms of the molecular projections recorded in (a), which are assembled in Fourier space with respect to their corresponding orientations according to the Fourier slice theorem discussed in Section 2.2.
However, some limitations exist for the RCT method. The design of the sample holder restricts the maximum tilt angle to about 60°, which makes a considerable fraction of information about the molecular structure inaccessible to the technique: this is the so-called ‘missing-cone’ problem. Another limitation is the need to collect data from the same field of view at two different sample tilt angles. For each of the two tilt angles, the signal-to-noise ratio (SNR) must be high enough so that it is possible to reliably locate the molecular projections (that is, pick particles) in the noisy micrographs. This essentially doubles the required electron dose on the sample. Meanwhile, the molecule must be large enough so that the irreversible structural damage caused by incident electrons is limited enough to allow for particle picking. Indeed, this has led to the common belief that small biological molecules are out of the reach for cryo-EM (Henderson, 1995 ▸).
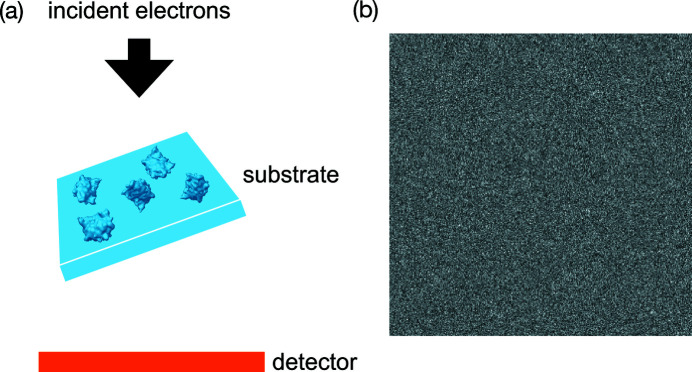
In this study, we develop an approach to reconstruct the 3D molecular structure from data collected at just one large sample tilt angle, as depicted in Fig. 2 ▸(a). More importantly, our approach circumvents the need for particle picking to reconstruct the molecular structure directly from the micrographs. The main idea is to first estimate features of the molecule that are invariant to the 2D positions of molecular projections in the micrographs. The estimation is done through a variant of Kam’s autocorrelation analysis (Kam, 1980 ▸). We subsequently determine the molecular structure by fitting the estimated invariants through an optimization problem. We address the problem of missing information by adding a regularizer in the optimization. Assuming white noise, this approach can in principle handle cases of arbitrarily low SNR as long as sufficiently many micrographs are used to estimate the invariants. Fig. 2 ▸(b) shows one such noisy micrograph where particle picking becomes challenging. This observation notably suggests that the feasibility of particle picking does not limit the smallest usable molecule size in single-particle cryo-EM.
Figure 2.
(a) The data collection scheme of RCT with just one sample tilt angle. (b) A micrograph that is so noisy that picking particles is challenging.
Kam’s autocorrelation analysis was also applied for analyzing X-ray single-particle imaging data (Kam, 1977 ▸; Saldin et al., 2010 ▸; Donatelli et al., 2015 ▸; von Ardenne et al., 2018 ▸). In particular, Saldin et al. (2010 ▸) considered the problem of reconstructing the top-down projection of molecules randomly oriented about a single axis, which is similar to the case of no tilt in RCT. Subsequently, Elser (2011 ▸) designed an algorithm to reconstruct the 3D structure of such partially oriented molecules from a tilt series. Kam’s method was recently demonstrated with actual data collected from randomly oriented virus particles (Kurta et al., 2017 ▸; Pande et al., 2018 ▸).
This work belongs to a methodical program to develop algorithms to reconstruct molecular structures without the need for particle picking, which was first proposed by Bendory et al. (2018 ▸). The development started with the studies of a simplified 1D model, where multiple copies of a target signal occur at unknown locations in a noisy long measurement (Bendory et al., 2018 ▸, 2019 ▸; Lan et al., 2020 ▸). The extension to the 2D case, where multiple copies of a target image are randomly rotated and translated in a large noisy measurement image, was later studied by Marshall et al. (2020 ▸) and Bendory et al. (2021 ▸). These results can be used to reconstruct the top-down molecular projection from the micrographs collected at no tilt in the RCT scheme.
We organize the rest of the paper as follows. We describe the data simulation procedure in Sections 2.1 to 2.3. The details of our approach are discussed in Sections 2.4 and 2.5. In Section 3, we study the effect of the missing-cone region on the quality of reconstruction and present the reconstructions of two molecular structures from simulated noisy micrographs. The computational details are described in the Appendix.
2. Methods
2.1. Image formation model
In the cryo-EM imaging process, the incident electrons are scattered by the 3D Coulomb potential of the sample
 . We define the coordinate system for data collection S by the orthogonal x and y axes along the edges of the detector and the normally incident electron beam, as the z axis. Under the weak-phase object approximation, the micrograph recorded by an
 pixelated detector can be modeled as
where
 ,
,
 is the 2D coordinate of the ith pixel, and ξ denotes the pixel sampling rate. The operator
 generates the tomographic projection of
 along the z axis by
The 2D function
 represents the point spread function of the imaging system, and the operator
 denotes the 2D convolution, where
for any 2D function
 . Finally, the measurement noise is modeled by the additive random variable
 .
.
In this work, we consider the simplified scenario where we ignore the effect of the point spread function by making the idealistic assumption that it is a 2D Dirac delta function, namely,
 . Moreover, we assume that the random noise ɛ is drawn from an i.i.d. (independent and identically distributed) Gaussian distribution with zero mean and variance
 . The arising challenges beyond these assumptions will be discussed in Section 4.
2.2. Random conical tilt
The sample used in RCT consists of multiple copies of partially oriented molecules. Specifically, the molecules adsorb to a 2D substrate such that a particular axis within the molecules aligns with the substrate normal. The molecular orientations are limited to rotations about the particular body axis by angles uniformly drawn from
 . Let
. Let
 be the body frame of one particular molecule, where the
 axis coincides with its body rotation axis. We further define another reference frame
 fixed on the 2D substrate such that the
 axis coincides with the tilt axis of the substrate and the
 axis aligns with the substrate normal. In the following, we also assume that the x axis of the laboratory frame is parallel to the
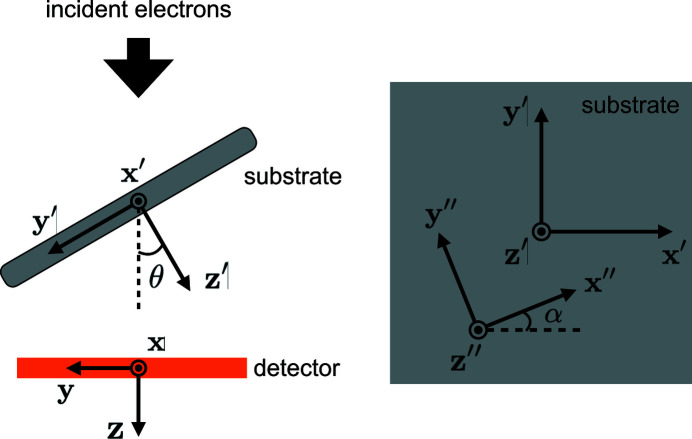
 axis. After specifying these reference frames, we define the substrate tilt angle θ as the angle between the z and
 axes. The rotation angle α of the particular molecule with respect to its body rotation axis is defined as the angle between the
 and
and
 axes. The relationships between the reference frames are shown in Fig. 3 ▸.
Figure 3.
The relationships between the laboratory frame S, the frame fixed on the 2D substrate
 and the body frame of one particular molecule
 .
.
Let
 be the 3D Coulomb potential of the particular molecule in its own body frame
 . Hereafter, we refer to f as the structure of the molecule. From the geometries shown in Fig. 3 ▸, the coordinate transformation between S and
 is given by
 |
where
 ,
,
 ,
,
 is the rotation matrix that aligns the axes of S with the axes of
 , and
, and
 is the vector pointing from the origin of S to the origin of
 . We can therefore express the molecular structure in the laboratory frame S by
 , and its tomographic projection along the z axis is given by
 , where
Taking the 2D Fourier transform on both sides of (5), with the Fourier slice theorem, we get
where
 denotes the 3D Fourier transform of
 . As a result, a projection image contains the same information as the central slice of the 3D Fourier transform that is perpendicular to the direction of projection. Since the molecular orientations are limited to in-plane rotations on the 2D substrate, which is itself tilted by an angle θ, the corresponding Fourier slices fill the whole 3D Fourier space except for the region within a double cone, whose axis coincides with the body rotation axis of the molecules. The double cone has an opening angle
 and the region within the missing cone represents the inaccessible information of the molecular structure in the setting of RCT.
2.3. Micrograph simulation
Before discussing our model for simulating micrographs, we first consider the computation of the molecular projection images. Let F be the discretization of the molecular structure f that is defined on a cubic grid
 by
by
The integer r represents the radius of a spherical support such that
 is negligible for
 . In addition, we define the discretization of the molecular projection
 by
by
where
 , and it immediately follows that
 has a circular support of radius r. From the Fourier slice theorem, we can compute the discrete Fourier transform (DFT) of
 from the DFT of F by
where
 . To reduce the interpolation error, we use the FINUFFT package (Barnett et al., 2019 ▸; Barnett, 2021 ▸) to evaluate
 on the non-Cartesian grid points. Finally, we obtain the molecular projections
 by the inverse DFT of
 .
.
We simulate the micrographs measured in an RCT experiment at the substrate tilt angle θ by
where
 ,
,
 is the number of molecular projections in the micrograph,
 is the in-plane rotation of the jth molecule that is uniformly drawn from
 ,
,
 is the center of the tomographic projection of the jth molecule, and
 is i.i.d. Gaussian noise with zero mean and variance
 . For a reason that will be clear in Section 2.4, we further assume that
such that the molecular projections are well separated in the micrographs. Fig. 4 ▸ shows a sample micrograph with SNR = 1. We define SNR as the ratio of the mean squared pixel values of molecular projections to the noise variance. Specifically,
Figure 4.
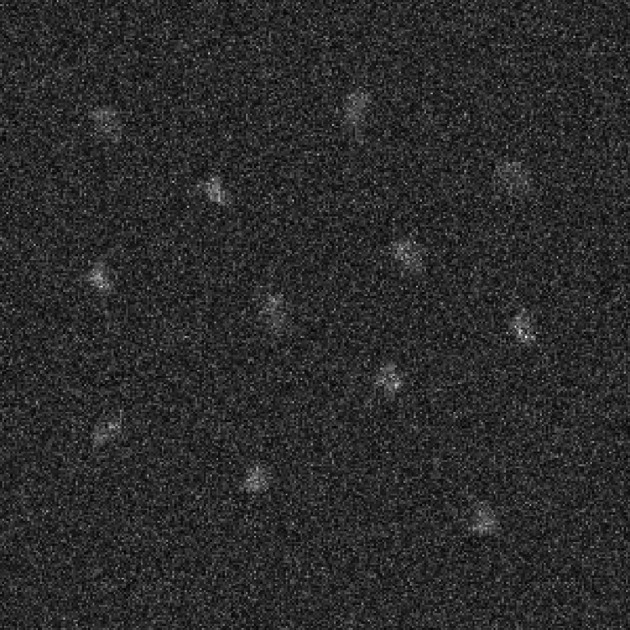
A sample micrograph with SNR = 1.
2.4. Autocorrelation analysis
The standard data processing pipelines in single-particle cryo-EM start with the step of particle picking to locate the molecular projections in the noisy micrographs, which is equivalent to determining the 2D vector
 for each molecular projection. This task, however, becomes challenging when the noise level is high. An alternative is to extract from the data quantities that are invariant to the 2D translations of molecular projections in the micrographs. We achieve this through the approach of autocorrelation analysis.
Consider an
 image
image
 . We define its autocorrelation function of order
 for any 2D translations
 by
by
where
 and
and
 is zero-padded for arguments out of the range. In the context of this study, we set
 when g represents a micrograph M and
 when g represents a molecular projection
 .
.
Under the assumption that the molecular projections are well separated, as in (11), the autocorrelations of a micrograph with 2D translations
 , where
 , are insensitive to the locations of molecular projections in the micrograph. As a result, the micrograph autocorrelations can be directly related to the autocorrelations of molecular projections, which provide information about the molecular structure.
In this work, we consider the micrograph autocorrelations up to the third order. This choice is based on the number of equations provided by the autocorrelations. The first-, second- and third-order autocorrelations provide
 and
and
 equations, respectively. Our goal is to estimate the
 voxel values of the molecular structure F. Hence, we need to go to at least the third order. Using autocorrelations of even higher orders may provide additional information about F, but it also requires more data and computational resources to accurately estimate their values.
Under the additional assumption that the density of molecular projections
 is fixed, it is straightforward to show that [see for example Bendory et al. (2018 ▸)]
 |
for any fixed level of noise and
 . Here
 represents the expectation over the distributions of the random Gaussian noise and the in-plane rotations of molecules and
 denotes the angular average over
 . The delta functions, defined by
 and
and
 , are due to the autocorrelations of the random Gaussian noise.
We estimate the expectations in (14)–(16) by averaging autocorrelations computed from many micrographs. In practice,
 and
and
 can be estimated from the micrographs:
 can be estimated by the variance of micrograph pixel values in the low-SNR regime;
 can be estimated by the empirical mean of micrographs. As a result, we can estimate the autocorrelations
 ,
,
 and
and
 up to the constant factor γ. For simplicity, we assume that
 and γ are known to us.
2.5. Regularized optimization
In this section, we design an optimization problem to reconstruct the molecular structure F from autocorrelations. We start by expressing F in a non-redundant representation. Recall that F is defined on a cubic grid of size
 and has a spherical support of radius r. We represent F by a vector
 of length
 , where
 denotes the number of voxels within the support. Furthermore, we define the linear operator
 that maps
 to F by
 .
.
In our optimization problem, we estimate
 by fitting the rotationally averaged third-order autocorrelation
 . As will be seen later,
 is used to generate the initial guess for
 , and
, and
 is used to build the regularizer in the optimization. For computational efficiency, we construct the cost function with the DFT of
 , where
 |
where
 denotes the complex conjugate. In the last step, we replace the integration with a discrete sum over
 samples, where
 .
.
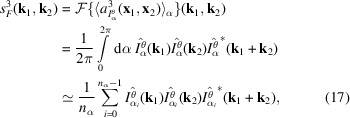
The triple product in (17) is the Fourier transform of the third-order autocorrelation
 , also known as the bispectrum (Tukey, 1953 ▸). Its applications in signal processing can be seen, for instance, in the work of Sadler & Giannakis (1992 ▸) and Bendory et al. (2017 ▸). Since we assume that the information of the molecular projections is preserved only up to the Nyquist frequency due to noise, we only consider spatial frequencies
 , where
 =
=
 . Let
. Let
 be the DFT of the estimation of
 from data. We can hence express the sum of least-square errors by
 .
.
As discussed in Section 2.2, there exists a double-cone region in the Fourier space that cannot be probed in RCT. Therefore, our reconstruction problem is ill-posed in nature, and we must include a regularization term in the cost function to incorporate some prior knowledge of the true solution. Our regularization enforces the smoothness assumption on F and has the form of the weighted sum of squares:
 , where
 . This regularization is related to the Gaussian prior described by Scheres (2012 ▸) in that we expect the scale parameters
 to act as a low-pass filter to reduce high-frequency noise while still preserving some high-resolution features of the molecule.
We estimate the values of
 based on the observation that the structure factors of proteins obey Wilson statistics (Wilson, 1949 ▸). To be more precise, the structure factors within each resolution shell follow the complex normal distribution with mean zero and variance estimated from the mean intensity in the resolution shell (French & Wilson, 1978 ▸). Taking the DFT of
 , we obtain
 |
where
 and we only consider spatial frequencies within the Nyquist frequency, that is,
 . Since
 |
we can see that
 is the mean intensity over a circle that is perpendicular to the body rotation axis of the molecule and has radius
 and height
 . Therefore, with appropriate weights, the average of
 for all
 that fall into the same annulus
 gives the mean intensity within the resolution shell
 , excluding the spherical caps that lie in the missing-cone region. We represent this weighted average by
 , whose values are in practice computed from
 , the DFT of the estimation of
 from data.
In addition to the scale parameters
 for
for
 , it is helpful to have regularization outside the Nyquist frequency to limit high-frequency noise. We choose
 for
for
 . This choice is based on the identity
such that one can minimize the sum of gradient squares by minimizing
 .
.
Finally, we define the cost function of our optimization problem by
 |
where
 is the non-redundant representation of F, λ denotes the regularization parameter, and we compute the scale factor β such that the two curves
 and
and
 attain the same value at
 . In a separate attempt, we have used
 as the only regularizer, but the quality of the reconstruction appears to be inferior with significant high-frequency noise (not shown in this study). This result suggests that Wilson statistics is a reasonably good prior for the Fourier components.
The optimization problem shown in (21) is inherently nonconvex due to the term of non-linear least-square errors. We find that the BFGS (Broyden–Fletcher–Goldfarb–Shanno) algorithm, despite being a local search algorithm, works well on the problem when initialized at a reasonable guess. We initialize
 from a (deterministic) 3D Gaussian profile with variance
 , which is rescaled such that the sum of its 3D discretization is consistent with
 estimated from data. We run the BFGS algorithm in the TensorFlow software library (Abadi et al., 2015 ▸) to minimize (21) over a set of regularization parameters
 . From the converged solutions, we choose the optimal value of λ using the L-curve method (Hansen, 1992 ▸). Our reconstructed structures are the estimates for F with these optimal values of λ.
3. Results
3.1. Reconstruction at different substrate tilts
In this section, we explore the effect of the missing-cone region on the quality of reconstruction by considering micrographs measured at different substrate tilt angles
 = 60°, 35° and 10°. The molecule used in our simulation is bovine pancreatic trypsin inhibitor (BPTI), which has a size of 35 Å and weight of 6.5 kDa. This molecular size is substantially below the limit (40 kDa) believed to be attainable by single-particle cryo-EM (Henderson, 1995 ▸), and our model structure was determined using X-ray crystallography.
We generate the discrete molecular structure F from the PDB entry 1qlq (Czapinska et al., 2000 ▸) using the UCSF Chimera software (Pettersen et al., 2004 ▸) at a resolution of 5 Å. The resulting contrast has a spherical support of radius
 voxels, and is further zero-padded to be a cubic grid of size 61. From the discrete contrast F, we simulate the micrographs as described in Section 2.3. To obtain the baseline results on the effect of the missing-cone region, we consider the idealistic scenario that the in-plane rotation of the jth molecule is given by
 ,
,
 , and the noise variance
 . By setting the micrograph length m = 4096 pixels and the number of molecules
 , we only simulate one micrograph at each given value of the substrate tilt angle.
From the simulated micrographs, we compute the rotationally averaged autocorrelations of molecular projections and the values of
 and
and
 . Fig. 5 ▸ shows the comparison of the mean intensities
 and the scale parameters
 and
and
 for
for
 . We first see that
 provides a good estimate for
 up to the Nyquist frequency. On the other hand, the scale parameter
 is substantially greater than
 outside the Nyquist frequency, which may inevitably preserve some high-resolution noise in the reconstruction.
Figure 5.
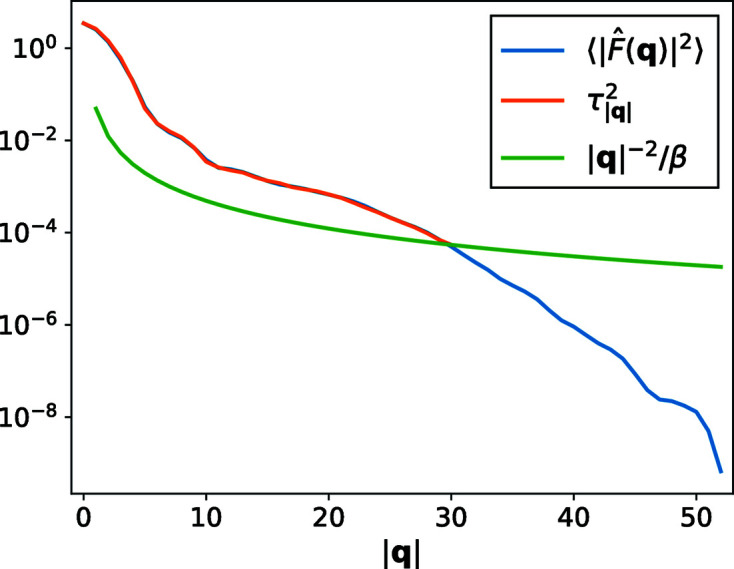
The comparison of the mean intensities
 and the scale parameters
 and
and
 for the BPTI molecule at the substate tilt angle
 .
.
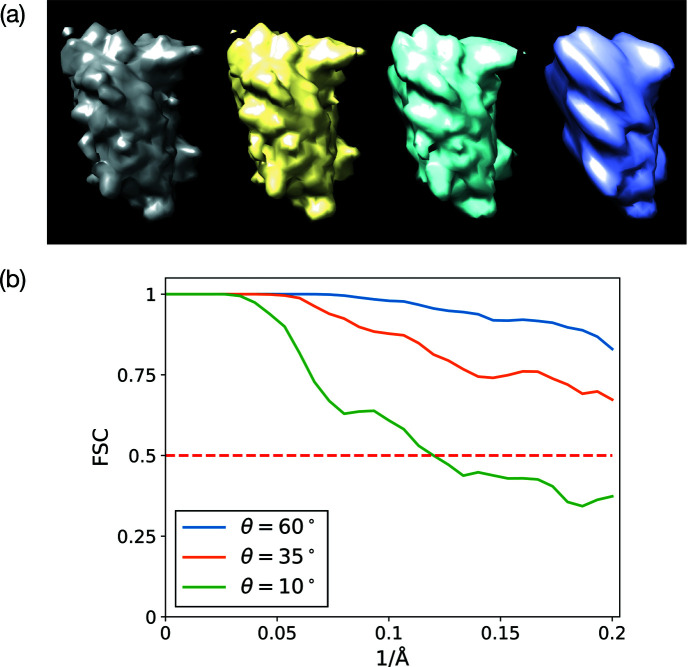
Fig. 6 ▸(a) shows the comparison of our reconstructed BPTI structures with the ground truth used to simulate the micrographs. As expected, the visual quality of the reconstructions degrades when the sample tilt angle θ decreases, which results in a larger missing-data region. To assess the reconstructions in more detail, we plot the Fourier shell correlation (FSC) (Harauz & Van Heel, 1986 ▸) of the reconstructed structures with the ground truth in Fig. 6 ▸(b). Although the reconstruction at
 correlates to the ground truth worse than the one at
 , both of them have the same resolution as the ground truth (5 Å) according to the FSC = 0.5 criterion. Using the same criterion, the resolution of the reconstruction at
 is 8.3 Å.
Figure 6.
(a) The reconstructed BPTI structures from noiseless micrographs at different sample tilt angles:
 (yellow),
 (cyan) and
 (purple). The gray one is the ground truth used to simulate the micrographs. (b) The FSC of the reconstructed structures with the ground truth.
3.2. Reconstruction from noisy micrographs
After having the baseline results for reconstructions from noiseless micrographs, we turn to test our approach on noisy micrographs. At the sample tilt angle
 , we simulate 500 micrographs of size
 using the same discrete contrast F for BPTI. We adjust the noise level such that the micrographs have SNR = 1. By maximizing the density of molecular projections while still preserving the requirement of good separation (11), the resulting micrographs contain
 molecular projections in total.
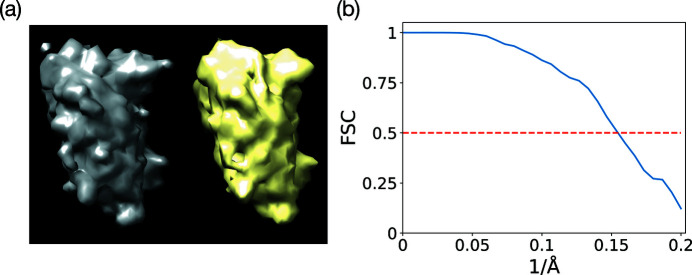
From the noisy micrographs, we compute the estimates for the rotationally averaged autocorrelations of molecular projections. Fig. 7 ▸(a) shows the reconstruction from these estimates along with the ground truth. The negative effect of noise on the quality of the reconstruction can best be seen by comparing this reconstruction with its counterpart in Fig. 6 ▸(a). As plotted in Fig. 7 ▸(b), we determine the resolution of this reconstructed structure to be 6.5 Å using the FSC = 0.5 criterion.
Figure 7.
(a) The reconstructed BPTI structure (yellow) from noisy micrographs with SNR = 1 at the sample tilt angle
 . The ground truth is rendered in gray. (b) The FSC of the reconstructed structure with the ground truth.
To demonstrate that our approach applies to other biological molecules, we test it on another data set simulated from the myoglobin molecule, which has a size of 40 Å and weight of 17.8 kDa. We generate the discrete molecular structure F for myoglobin from the PDB entry 1mbn (Watson, 1969 ▸) using the UCSF Chimera software at a resolution of 5 Å. The resulting contrast has a spherical support of radius
 voxels, and is further zero-padded to be a cubic grid of size 65. At the sample tilt angle
 , we generate 500 micrographs of size
 from F. The number of molecular projections in these micrographs totals
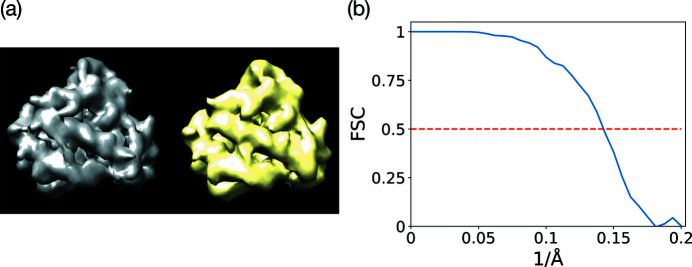
 , and we also set SNR = 1 for the micrographs. The reconstructed myoglobin structure from the noisy micrographs is shown in Fig. 8 ▸(a) along with the ground truth. We can see that our reconstruction recovers most of the main features of the ground truth. We plot the FSC of our reconstruction with the ground truth in Fig. 8 ▸(b), and we determine the resolution of the reconstruction to be 7.0 Å according to the FSC = 0.5 criterion.
Figure 8.
(a) The reconstructed myoglobin structure (yellow) from noisy micrographs with SNR = 1 at the sample tilt angle
 . The ground truth is rendered in gray. (b) The FSC of the reconstructed structure with the ground truth.
4. Discussion
In this paper, we present a method to reconstruct the 3D molecular structure from data collected at just one sample tilt angle in RCT. Our method reduces data to quantities that are invariant to the 2D positions of molecular projections in the micrographs, which removes the need for particle picking when analyzing data. In order to address the missing data in the double-cone region of the molecule’s Fourier transform, we design a regularized optimization problem to reconstruct the molecular structure by fitting the autocorrelations estimated from micrographs. Our numerical studies illustrate the effect of the missing-cone region on the quality of reconstruction. In addition, we demonstrate structure reconstruction from the autocorrelations computed from noisy micrographs. Since the accuracy of the autocorrelation estimates can be improved by averaging many more micrographs, our results show promise in applying autocorrelation analysis to reconstruct the structures of small biological molecules in the setting of RCT.
A few issues still stand in the way of applying our approach to real RCT data. In Section 2.1, we make the assumption that the point spread function is a 2D Dirac delta function to ignore its effect. In reality, however, we may have to consider a varying point spread function with respect to the locations on the detector because different regions of the tilted specimen are exposed to the electron beam with different defocus values. Another challenge arises when the noise is colored. In that case, the expectations of products of noise at different pixels are not zero. It will require a more sophisticated model for the noise power spectrum instead of a single parameter
 . Furthermore, structure heterogeneity of the target molecule will be another test for our approach.
Additionally, we assume that the molecular projections are well separated in the micrographs. This assumption enables us to directly relate the micrograph autocorrelations to the autocorrelations of molecular projections. However, it is preferable in practice to have the molecular projections densely packed in micrographs to maximize the available structural information within limited data collection time. We expect to remove this assumption by considering the cross correlations between neighboring molecular projections. A similar idea was recently demonstrated by Lan et al. (2020 ▸) for the simplified 1D model.
Another practical concern is the amount of required data. As a proof of concept, we reconstruct the molecular structures from simulated micrographs with SNR = 1. For small biological molecules that challenge particle picking, we expect the SNR of the micrographs to be much lower. Since our approach uses autocorrelations up to the third order, the sample complexity would scale as
 . This means that we will need
 times more molecules to estimate the autocorrelations with similar accuracy when the SNR drops from 1 to 0.1. We plan to address this concern in the following ways: first, the third-order correlations contain a large degree of redundancy, as they are 4D functions containing information from a 3D structure. Ideally, with proper denoising, for example, the Noise2Noise scheme (Lehtinen et al., 2018 ▸), the SNR of the correlation function could likely be enhanced by this redundancy factor, ranging from 10 to 100 depending on the resolution. Second, the SNR of the correlation function is proportional to the density of molecular projections present in the micrographs. By enabling the reconstruction from micrographs of densely packed projections, we can boost the SNR of the correlation function by another factor of 10.
In the long run, we would like to extend the approach described here to real cryo-EM data to reconstruct high-resolution structures directly from micrographs, without being restricted to molecules which have a preferred orientation on their substrate.
Acknowledgments
We would like to thank Tamir Bendory, Joe Kileel, Eitan Levin and Nicholas Marshall for productive discussions.
Appendix A. Computational details
The data simulation and structure reconstruction were performed on an Nvidia Tesla P100 GPU, which has 16 GB RAM. The computation of the micrograph autocorrelations for relevant step sizes took 1.5 × 10² s on average for a
 micrograph. As for the structure reconstruction, it took a few hours for an instance with a given value of the regularization parameter λ to converge. Therefore, if one knows the correct λ for some setting, it may be advantageous to use the same λ in a similar case. The code is publicly available at https://github.com/tl578/RCT-without-detection.
Funding Statement
TYL and AS were supported in part by AFOSR awards FA9550-17-1-0291 and FA9550-20-1-0266, the Simons Foundation Math+X Investigator Award, the Moore Foundation Data-Driven Discovery Investigator Award, NSF BIGDATA award IIS-1837992, NSF award DMS-2009753, and NIH/NIGMS award R01GM136780-01.
References
- Abadi, M., Agarwal, A., Barham, P., Brevdo, E., Chen, Z., Citro, C., Corrado, G. S., Davis, A., Dean, J., Devin, M., Ghemawat, S., Goodfellow, I., Harp, A., Irving, G., Isard, M., Jia, Y., Jozefowicz, R., Kaiser, L., Kudlur, M., Levenberg, J., Mané, D., Monga, R., Moore, S., Murray, D., Olah, C., Schuster, M., Shlens, J., Steiner, B., Sutskever, I., Talwar, K., Tucker, P., Vanhoucke, V., Vasudevan, V., Viégas, F., Vinyals, O., Warden, P., Wattenberg, M., Wicke, M., Yu, Y. & Zheng, X. (2015). TensorFlow, software available from https://www.tensorflow.org/.
- Ardenne, B. von, Mechelke, M. & Grubmüller, H. (2018). Nat. Commun. 9, 2375. [DOI] [PMC free article] [PubMed]
- Barnett, A. H. (2021). Appl. Comput. Harmon. Anal. 51, 1–16.
- Barnett, A. H., Magland, J. & af Klinteberg, L. (2019). SIAM J. Sci. Comput. 41, C479–C504.
- Bendory, T., Boumal, N., Leeb, W., Levin, E. & Singer, A. (2018). arXiv:1810.00226.
- Bendory, T., Boumal, N., Leeb, W., Levin, E. & Singer, A. (2019). Inverse Probl. 35, 104003.
- Bendory, T., Boumal, N., Ma, C., Zhao, Z. & Singer, A. (2018). IEEE Trans. Signal Process. 66, 1037–1050. [DOI] [PMC free article] [PubMed]
- Bendory, T., Lan, T.-Y., Marshall, N. F., Rukshin, I. & Singer, A. (2021). arXiv:2101.07709.
- Czapinska, H., Otlewski, J., Krzywda, S., Sheldrick, G. & Jaskólski, J. (2000). J. Mol. Biol. 295, 1237–1249. [DOI] [PubMed]
- Donatelli, J. J., Zwart, P. H. & Sethian, J. A. (2015). Proc. Natl Acad. Sci. USA, 112, 10286–10291. [DOI] [PMC free article] [PubMed]
- Elser, V. (2011). New J. Phys. 13, 123014.
- French, S. & Wilson, K. (1978). Acta Cryst. A34, 517–525.
- Hansen, P. C. (1992). SIAM Rev. 34, 561–580.
- Harauz, G. & Van Heel, M. (1986). Optik (Stuttgart), 73, 146–156.
- Henderson, R. (1995). Q. Rev. Biophys. 28, 171–193. [DOI] [PubMed]
- Kam, Z. (1977). Macromolecules, 10, 927–934.
- Kam, Z. (1980). J. Theor. Biol. 82, 15–39. [DOI] [PubMed]
- Kurta, R. P., Donatelli, J. J., Yoon, C. H., Berntsen, P., Bielecki, J., Daurer, B. J., DeMirci, H., Fromme, P., Hantke, M. F., Maia, F. R. N. C., Munke, A., Nettelblad, C., Pande, K., Reddy, H. K. N., Sellberg, J. A., Sierra, R. G., Svenda, M., van der Schot, G., Vartanyants, I. A., Williams, G. J., Xavier, P. L., Aquila, A., Zwart, P. H. & Mancuso, A. P. (2017). Phys. Rev. Lett. 119, 158102. [DOI] [PMC free article] [PubMed]
- Lan, T.-Y., Bendory, T., Boumal, N. & Singer, A. (2020). IEEE Trans. Signal Process. 68, 1589–1601. [DOI] [PMC free article] [PubMed]
- Lehtinen, J., Munkberg, J., Hasselgren, J., Laine, S., Karras, T., Aittala, M. & Aila, T. (2018). Proceedings of the 35th International Conference on Machine Learning (ICML), pp. 2965–2974. https://proceedings.mlr.press/v80/.
- Marshall, N., Lan, T.-Y., Bendory, T. & Singer, A. (2020). ICASSP 2020–2020 IEEE International Conference on Acoustics, Speech and Signal Processing (ICASSP), pp. 5780–5784. doi: 10.1109/ICASSP40776.2020.9053932.
- Pande, K., Donatelli, J. J., Malmerberg, E., Foucar, L., Bostedt, C., Schlichting, I. & Zwart, P. H. (2018). Proc. Natl Acad. Sci. USA, 115, 11772–11777. [DOI] [PMC free article] [PubMed]
- Pettersen, E. F., Goddard, T. D., Huang, C. C., Couch, G. S., Greenblatt, D. M., Meng, E. C. & Ferrin, T. E. (2004). J. Comput. Chem. 25, 1605–1612. [DOI] [PubMed]
- Radermacher, M. (1988). J. Elec. Microsc. Tech. 9, 359–394. [DOI] [PubMed]
- Radermacher, M., Wagenknecht, T., Verschoor, A. & Frank, J. (1987). J. Microsc. 146, 113–136. [DOI] [PubMed]
- Sadler, B. M. & Giannakis, G. B. (1992). J. Opt. Soc. Am. A, 9, 57–69.
- Saldin, D. K., Poon, H. C., Shneerson, V. L., Howells, M., Chapman, H. N., Kirian, R. A., Schmidt, K. E. & Spence, J. C. H. (2010). Phys. Rev. B, 81, 174105.
- Scheres, S. (2012). J. Mol. Biol. 415, 406–418. [DOI] [PMC free article] [PubMed]
- Sorzano, C. O. S., Alcorlo, M., de la Rosa-Trevín, J. M., Melero, R., Foche, I., Zaldívar-Peraza, A., del Cano, L., Vargas, J., Abrishami, V., Otón, J., Marabini, R. & Carazo, J. M. (2015). Sci. Rep. 5, 14290. [DOI] [PMC free article] [PubMed]
- Tukey, J. (1953). Reprinted in The Collected Works of John W. Tukey, 1, 165–184.
- Watson, H. (1969). Prog. Stereochem. 4, 299–333.
- Wilson, A. J. C. (1949). Acta Cryst. 2, 318–321.


