Abstract
WashU Epigenome Browser (https://epigenomegateway.wustl.edu/browser/) is a web-based genomic data exploration tool that provides visualization, integration, and analysis of epigenomic datasets. The newly renovated user interface and functions have enabled researchers to engage with the browser and genomic data more efficiently and effectively since 2018. Here, we introduce a new integrated panel design in the browser that allows users to interact with 1D (genomic features), 2D (such as Hi-C), 3D (genome structure), and 4D (time series) data in a single web page. The browser can display three-dimensional chromatin structures with the 3D viewer module. The 4D tracks, called ‘Dynamic’ tracks, animatedly display time-series data, allowing for a more striking visual impact to identify the gene or genomic region candidates as a function of time. Genomic data, such as annotation features, numerical values, and chromatin interaction data can all be viewed in the dynamic track mode. Imaging data from microscopy experiments can also be displayed in the browser. In addition to software development, we continue to service and expand the data hubs we host for large consortia including 4DN, Roadmap Epigenomics, TaRGET and ENCODE, among others. Our growing user/developer community developed additional track types as plugins, such as qBed and dynseq tracks, which extend the utility of the browser. The browser serves as a foundation for additional genomics platforms including the WashU Virus Genome Browser (for COVID-19 research) and the Comparative Genome Browser. The WashU Epigenome Browser can also be accessed freely through Amazon Web Services at https://epigenomegateway.org/.
Graphical Abstract
Graphical Abstract.
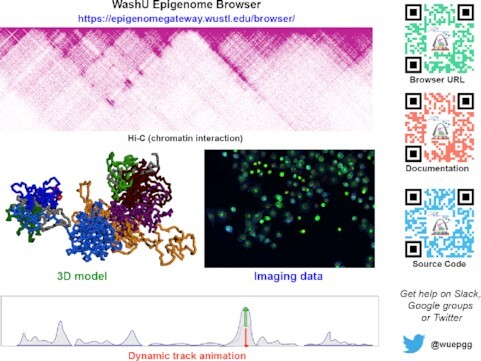
New components of WashU Epigenome Browser: 3D chromatin viewer, imaging data viewer and dynamic tracks.
INTRODUCTION
High-throughput technologies have revolutionized genome sciences. In doing so, they have also generated an unprecedented amount of data in diverse formats. Large scale consortium projects, such as the ENCODE (1–3), Roadmap Epigenomics (4,5), IHEC (6), TaRGET (7) and 4DN (8), have generated tens of thousands of genome-wide data sets of transcription factor binding sites and epigenetic marks, including DNA and histone modifications, and chromatin interactions, across cell types and tissues. Genome browsers have been an essential tool for investigators to access, visualize, integrate, and interpret these massive datasets (9–14), and the rapidly expanding genomics landscape continues to present challenges and opportunities for modern-day genome browsers.
The WashU Epigenome Browser was invented in 2011 to enable interactive explorations of genomic data in a web browser format (13). Over the past decade, we have continued innovating the Browser software architecture and user interface, developing many functions to enhance user experiences, supporting large genomic consortia, and engaging the user and developer community. For example, our Browser was one of the first to support visualization of long-range chromatin interaction data (15). We developed a more expressive track type called methylC (16) for visualizing and analyzing whole-genome bisulfite sequencing data. The Browser continues to serve as the de facto gateway to access data generated by the Roadmap Project (4,5). We developed the Data Hub Cluster concept to host, organize, and display over 200 000 datasets produced by the Roadmap, ENCODE, mouseENCODE, and 4D Nucleome consortia (8). The Data Hub Cluster also facilitates the use of these data sets to annotate genetic variants associated with complex traits (17). A major Browser update was completed in 2018 (14), when we redesigned the Browser software architecture and rewrote the Browser code. The update created a more friendly user interface, enhanced user experience by introducing functions such as live browsing, expanded our data hub collection, and developed a lightweight codebase that streamlined the creation of new Browser contents and functions.
In this update, we describe conceptual and technical advances we have made over the past 3 years, as well as our continued engagement with the user/developer community. Our central goal is to enable biologists to better integrate and understand their genomic data. Biologists often wish to explore vast genome-wide profiles in order to generate and test diverse hypotheses. However, on most conventional genome browsers, they can often only look at one gene or genomic region at a time and visually compare at most several dozen datasets of comparable formats. Our new multi-panel system allows users to explore data in multiple genome browser panels in the same web browser window, enabling simultaneous visualization and comparison of genomic features, epigenomic marks, three-dimensional (3D) chromatin models, and microscopy images. Most current genome browsers display static images, but our new Dynamic track turns static browser track images into animations. This innovation not only provides a more lively experience for users but also allows better appreciation of the variations in genomic data across multiple cellular states, time series, as well as across single cells. Another innovation is a new 3D visualization module to display all genomic information typically shown on a 1D genome browser in a 3D model format. We map genomic coordinates onto 3D models of chromosomes and use the 3D models as a scaffold to display genomic data. Biological information that is difficult to illustrate in 1D becomes more intuitive when displayed in 3D, providing novel and powerful tools for investigators to hypothesize and make connections between biological functions and 3D genome structures (Li et al., bioRxiv, https://doi.org/10.1101/2022.01.18.476849). These new developments continue to attract an ever-growing user and developer community. As a result, more genomes and data are added to the Browser upon community requests, and new functions, including those developed by the community (e.g. qBed (18), dynseq (Nair et al., in preparation)), continue to enrich the Browser. The Browser also serves as a foundation for other genomics visualization tools, such as WashU Virus Genome Browser (19) and WashU Comparative Genome Browser (Zhuo et al., in preparation).
NEW FEATURES
Multi-panel system
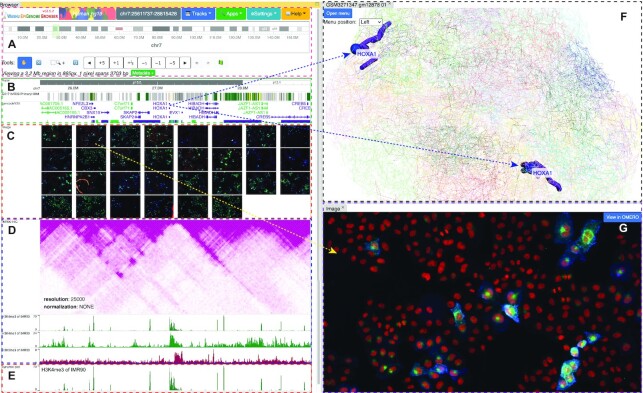
Genomic data are heterogeneous. One of the first steps of data integration is to enable simultaneous, paralleled exploration of data types of very different natures. The new Browser interface splits users’ web browser window into sections called panels to display different types of data (Figure 1). The main browser panel displays a classic linear genome browser, which contains a menu and navigation functions (Figure 1A), genomic data, such as sequence and gene annotations (one-dimension, Figure 1B), Hi-C, and numerical data (2-dimension, Figure 1D) and animated time series data (four-dimension, dynamic track, Figure 1E). A second panel, positioned at the top right of the web browser window, is a 3D viewer and displays a 3D chromatin model. The highlighted region is synchronized with the main browser panel (Figure 1F). A third panel, positioned at the bottom right of the web browser window, is an imaging data viewer (Figure 1G). This panel supports interaction with imaging data, which is displayed in a thumbnail image track of the main browser panel (Figure 1C) and linked to the present genomic coordinates. Users can add or remove panels or rearrange the panels into their preferred configurations. The new multi-panel design system allows intuitive integration of data from multiple dimensions, such as genomic sequence and genome compartments, and different types of data, such as imaging data, thus facilitating visual data integration.
Figure 1.
Browser UI with the multi-panel setting. The browser user interface displays data of different types in each panel, representing different dimensionalities. The panel on the left shows the main, conventional browser window. The panel on the top right is a 3D viewer and shows a 3D genome model. The panel on the bottom right shows an image from a microscopy experiment. (A) The main browser menu, ideogram, and select functions. (B) Ruler, chromHMM, and gene tracks, representing 1D data tracks. (C) Image track in thumbnail mode. (D) Hi-C and wiggle/numerical tracks, representing 2D data tracks. (E) A representative dynamic track, the animation displays the 3 numerical tracks from (D), representing 4D data tracks. (F) 3D viewer, displaying the highlighted gene (HOXA1) as spheres, representing 3D data tracks. (G) One expanded image in its own panel with links to Omero viewer provided by the image source.
Dynamic track
Since current genome browsers display static images, which often represent an ensemble of biological states of many cells, it is not intuitive to understand the variation within the data. For example, classic Hi-C contact maps show contact frequencies averaged across thousands of cells. The current approach to explore and visualize different group/cluster or time series genomic data relies on displaying a stack of static datasets/tracks on genome browsers. The new ‘Dynamic track’ enables the animation of a series of data tracks within the real estate of a single track, giving users an opportunity to watch and appreciate the dynamics and variations in the data series. We designed a new data format called ‘dbedGraph’ for a standard dynamic track. In addition, existing popular numerical track formats such as bigWig and bedGraph can also be used to compose a dynamic track, either from the browser user interface or from a remote data hub. To generalize the dynamic track function, BED formatted genomic annotations, chromatin interactions in ‘long-range’ and Hi-C formats can all be displayed as dynamic tracks. We implemented these new functions using advanced web technology including Pixi.js (https://www.pixijs.com/) and WebGL (https://www.khronos.org/webgl/), enabling dynamic animations based on the series of data representing time points or cell clusters.
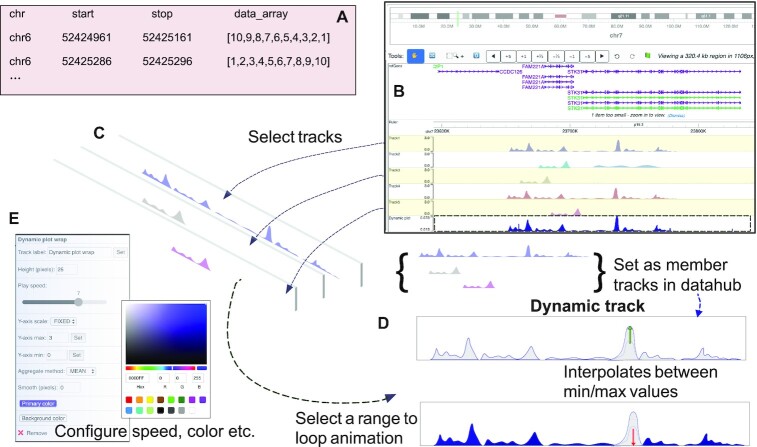
The dynamic bedGraph (‘dbedGraph’) file format is similar to the widely used bedGraph, where the first three columns represent chromosome, start, and end position of a genomic region, the fourth column contains an array of values representing different time points or values from individual clusters from a single cell experiment (Figure 2A). The array describing the dynamic data can be of any arbitrary length. Users can also select multiple numerical tracks (in either bigwig or bedGraph format) using the ‘multiple selection’ function in the browser, then right-click to choose ‘Dynamic plot’ from the popup menu. The Browser will combine the data into a dynamic track based on the selected tracks (Figure 2B–D). Users can further customize the behavior of the track, with options including color, background color, animation play/pause, speed, data configuration methods such as aggregation method, smoothing effect, to name a few (Figure 2E). In addition to numerical tracks, typical genomic annotation features in BED format, chromatin interaction data in ‘long-range’ and Hi-C format can also be selected and configured into a dynamic track after choosing the ‘Dynamic Bed/HiC/Longrange’ function from the right-click popup menu. Any of these dynamic tracks can be customized and submitted using the remote data hub function. Examples and tutorials on how to use dynamic tracks are provided in Supplemental tutorial S1.
Figure 2.
Dynamic tracks. Dynamic track displays an animation of data from different time points or samples. One of the newly developed dynamic track type: dBedgraph in text format (A). Browser views show steps to select multiple tracks and combine them into a dynamic track, and the animation displays each track iteratively (B–D). Dynamic track can be configured to adjust the height, speed, y-axis scale, and color via settings (E).
The Dynamic track allows a more intuitive comparison of data derived from different time points, groups, tissues, or assays. These details in data, when observed in an animated fashion, allow for increased visual impact to spot gene or genomic region candidates among different series or groups of data. Genomic data types including annotation features, numerical values, and chromatin interactions are all supported by viewing as animations. As a user case, we recreated the chromosome folding dynamics through cell cycle reported by Abramo et al. (20). We used the dynamic Hi-C track to reproduce eight Hi-C contact maps as a function of cell cycle and visualized them as animations. The visual effects for a higher resolution view of a region on chr14 and a lower resolution view of the entire chr14 can be seen in Supplemental videos 1 and 2. From the animation, we can fully appreciate the coordinated changes of chromosome folding patterns across cell cycle. In Supplemental tutorial S1, we provide several additional user cases, including making and displaying a dynamic track composed of three cell clusters from a single-cell study (21) and a dynamic track of histone modifications using datasets from the Mouse ENCODE project (22).
3D viewer
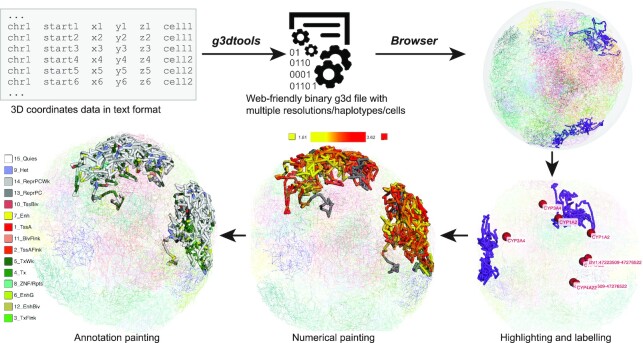
Biological functions are not only encoded by the genome sequence but also regulated by its 3D structure. More and more studies have revealed the importance of 3D chromatin structures in development and diseases; therefore, visualizing the connections between the 1D genome, such as the genome sequence and epigenomic dynamics, and the 3D genome is a pressing need. The new 3D viewer maps all genomic information typically shown on a 1D genome browser onto a 3D model of the genome and is supported by all generic genome browser utilities (Li et al., bioRxiv, https://doi.org/10.1101/2022.01.18.476849). There has been a wave of computational tools developed to predict 3D models of the chromatin using data generated by technologies such as Hi-C and ChIA-PET. In essence, any models depicted by 3D coordinates (x, y, z) can be displayed using the 3D viewer. First, 3D coordinates are converted to a binary g3d format using the g3dtools we developed in conjunction with the 3D viewer. The g3d files can be accessed remotely from a web server or uploaded from users’ computers to the Browser in a manner similar to all generic browser data formats. Since the 1D genomic coordinates are mapped onto the 3D model, the 3D viewer uses this information to decorate the 3D model with genomic data. This includes highlighting the current browser region and customized labeling of genes. Furthermore, users can use numerical data, such as bigwig track, or annotation data, such as chromHMM annotation, to paint the 3D structure (Figure 3). Styles such as color and thickness of highlighting, label, and painting can all be customized to get the desired visualization. Examples and tutorials on how to use the 3D viewer are provided in Supplemental tutorial S2.
Figure 3.
3D viewer. An overview of how 3D data is displayed in the Browser. 3D coordinates in text format are converted to the binary g3d data using g3dtools, then the file is submitted to the browser for visualization. The 3D viewer can highlight current browser regions or specific genes. Users can also use numerical and annotation data to decorate the 3D structure.
Imaging track
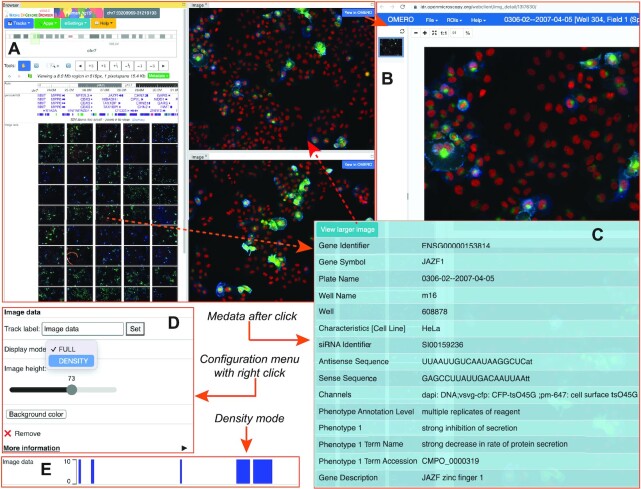
Inspecting images from microscopy experiments is an important and intuitive way to understand biological data. Life sciences are under fast changes brought by advances in light and electron microscopy technology (23). Making connections between imaging data and genomic data provides both challenges and opportunities and has been a major endeavor by projects such as the 4D Nucleome (8). Our browser can display images using the Omero API provided by the image source server. Currently, the browser can display images from both 4DN (4D Nucleome Data Portal) (8) and IDR (Image Data Resource) (24). We also developed a thumbnail image track as part of the regular genome browser, with which we organize all images according to their associated genomic locations (e.g. genomic coordinates of hybridization probes, target genes, etc). Clicking any of the image thumbnails will bring up a popup menu that displays metadata information (Figure 4C). From the metadata popup menu, users can choose to view a larger, higher resolution image in a new panel, which also includes a link to the Omero server by the image source provider (Figure 4B). Display mode and thumbnail height can be configured (Figure 4D). For example, the density mode tells users the number of images associated with each genomic location (Figure 4E). Examples and tutorials on how to view imaging data are in Supplemental tutorial S3.
Figure 4.
Image track. How imaging data is displayed in the browser. Browser view with an image track in thumbnail mode (A). The external image display window by image data source provider (B). The metadata popup menu is associated with one image (C). Configuration menu of the image track in main browser (D). The image track is displayed in density mode (E).
Track plugins and community support
We continue to provide well-documented code and documentation for the Browser, and support for the user community (Figure 5). Our community support enables users to develop their own track types to visualize on the browser. The development of the qBed and dynseq formats provides such examples. qBed is a new track type to display dense and quantitative data from a high-resolution point process (18), and dynseq displays scores over individual nucleotides in the genome, which can be derived from a variety of scoring methods using machine learning models (Nair et al., in preparation). We visualize dynseq as a string of letters with different colors (for each nucleotide) and different heights scaled by the importance scores, including negative values. In both cases, community developers were able to develop the track types and their visualization routines. After our browser quality assurance, these new codes were incorporated into the Browser code base as plugins.
Figure 5.
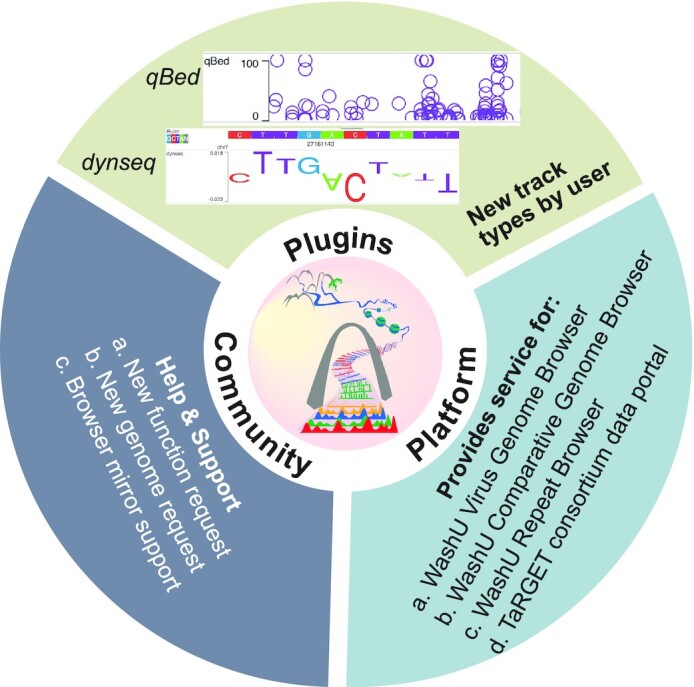
Browser community engagement. Browser users develop new track types for their own visualization. We provide help and support for users with new function/genome requests, as well as technical support for mirror sites. The Browser provides services for many other genomic tools.
We routinely respond to users’ requests for adding new functions and/or new genome assemblies in a timely fashion. Currently, the WashU Epigenome Browser supports 48 genome assemblies across 33 species. This includes the full support of the recently released human telomere-to-telomere CHM13 genome assembly (25). We also provide support for building browser mirror sites. The Browser also provides a platform for other genomic tools, including the WashU Virus Genome Browser (19) which was developed to support research on COVID19, and the recently released WashU Comparative Genome Browser (Zhuo et al., in preparation).
Data hub updates
As an ongoing effort, the data hubs hosted by our Browser continue to be expanded and updated (Table 1). For example, the total number of tracks we host from ENCODE, Roadmap, 4DN, and TaRGET has reached 239,298, most are for human and mouse. We are hosting 11 049 3D models for human, mouse, and other organisms, as well as 1 085 092 images for human (Supplemental table 1) and 124 images for mouse. In addition, we are hosting 2 642 765 data tracks for SARS-COV-2 and counting.
Table 1.
data statistics. Currently hosted track number for each species
| Species | Genome assembly | Number of tracks | Number of 3D models | Number of images |
|---|---|---|---|---|
| Human | hg38 | 76 943 | 540 278 | |
| hg19 | 134 484 | 34 | 544 814 | |
| Mouse | mm10 | 27 681 | 11 011 | 124 |
| Chicken | galGal5 | 103 | ||
| Zebrafish | danRer10 | 66 | ||
| Fruit fly | dm6 | 6 | ||
| Plasmodium falciparum | pfal3d7 | 14 | 3 | |
| Yeast | sacCer3 | 1 | 1 | |
| Virus | SARS-CoV-2 | 2 642 765 | 2 |
OUTLOOK
As genomic technologies and web technologies continue to evolve, we envision continued innovation and development of Genome Browser functions. We strive to serve the genomic community with robust, stable, and innovative functions as well as a rich collection of public datasets to facilitate data exploration, comparison, and interpretation. We will continue to maintain our legacy browser (13) at http://epigenomegateway.wustl.edu/legacy/ for the immediate future. Future work will focus on: (i) testing and developing more robust code, and better serving the community as a platform for innovating new visualization solutions; (ii) improving the 3D viewer and image viewer modules to better integrate genomic data with microscopy data; (iii) making more data types to be compatible with the dynamic track.
DATA AVAILABILITY
The WashU Epigenome Browser source code is open-source on GitHub (https://github.com/lidaof/eg-react). The Browser is available at https://epigenomegateway.wustl.edu/ and https://epigenomegateway.org/ from Amazon Cloud services supported with both HTTP and HTTPS protocol. Dynamic track homepage: https://vizhub.wustl.edu/public/misc/dynamicTrack/.
Supplementary Material
ACKNOWLEDGEMENTS
We thank the PixiJS team (https://www.pixijs.com/) for the amazing 2D computer graphics library. We thank data administrators from ENCODE, Roadmap and 4DN consortia for allowing CORS access to their data. We thank IDR and 4DN for providing the Omero API to access the image data.
Contributor Information
Daofeng Li, Department of Genetics, Washington University School of Medicine, St. Louis, MO, USA; The Edison Family Center for Genome Sciences and Systems Biology, Washington University School of Medicine, St. Louis, MO, USA.
Deepak Purushotham, Department of Genetics, Washington University School of Medicine, St. Louis, MO, USA; The Edison Family Center for Genome Sciences and Systems Biology, Washington University School of Medicine, St. Louis, MO, USA.
Jessica K Harrison, Department of Genetics, Washington University School of Medicine, St. Louis, MO, USA; The Edison Family Center for Genome Sciences and Systems Biology, Washington University School of Medicine, St. Louis, MO, USA.
Silas Hsu, Department of Genetics, Washington University School of Medicine, St. Louis, MO, USA; The Edison Family Center for Genome Sciences and Systems Biology, Washington University School of Medicine, St. Louis, MO, USA.
Xiaoyu Zhuo, Department of Genetics, Washington University School of Medicine, St. Louis, MO, USA; The Edison Family Center for Genome Sciences and Systems Biology, Washington University School of Medicine, St. Louis, MO, USA.
Changxu Fan, Department of Genetics, Washington University School of Medicine, St. Louis, MO, USA; The Edison Family Center for Genome Sciences and Systems Biology, Washington University School of Medicine, St. Louis, MO, USA.
Shane Liu, Department of Computer Science, University of Michigan, Ann Arbor, MI, USA.
Vincent Xu, Department of Genetics, Washington University School of Medicine, St. Louis, MO, USA; The Edison Family Center for Genome Sciences and Systems Biology, Washington University School of Medicine, St. Louis, MO, USA.
Samuel Chen, Ladue Horton Watkins High School, St. Louis, MO, USA.
Jason Xu, Missouri University of Science & Technology, Rolla, MO, USA.
Shinyi Ouyang, University of California San Diego, La Jolla, CA, USA.
Angela S Wu, Department of Genetics, Washington University School of Medicine, St. Louis, MO, USA; The Edison Family Center for Genome Sciences and Systems Biology, Washington University School of Medicine, St. Louis, MO, USA.
Ting Wang, Department of Genetics, Washington University School of Medicine, St. Louis, MO, USA; The Edison Family Center for Genome Sciences and Systems Biology, Washington University School of Medicine, St. Louis, MO, USA; McDonnell Genome Institute, Washington University School of Medicine, St. Louis, MO, USA.
SUPPLEMENTARY DATA
Supplementary Data are available at NAR Online.
FUNDING
NIH [R01HG007175, U01CA200060, U24ES026699, U01HG009391, UM1HG011585, U41HG010972, U24HG012070]. Funding for open access charge: National Institutes of Health.
Conflict of interest statement. None declared.
REFERENCES
- 1. Encode Project Consortium The ENCODE (ENCyclopedia of DNA elements) project. Science. 2004; 306:636–640. [DOI] [PubMed] [Google Scholar]
- 2. Encode Project Consortium An integrated encyclopedia of DNA elements in the human genome. Nature. 2012; 489:57–74. [DOI] [PMC free article] [PubMed] [Google Scholar]
- 3. Encode Project Consortium A user's guide to the encyclopedia of DNA elements (ENCODE). PLoS Biol. 2011; 9:e1001046. [DOI] [PMC free article] [PubMed] [Google Scholar]
- 4. Bernstein B.E., Stamatoyannopoulos J.A., Costello J.F., Ren B., Milosavljevic A., Meissner A., Kellis M., Marra M.A., Beaudet A.L., Ecker J.R.et al.. The NIH roadmap epigenomics mapping consortium. Nat. Biotechnol. 2010; 28:1045–1048. [DOI] [PMC free article] [PubMed] [Google Scholar]
- 5. Roadmap Epigenomics C., Kundaje A., Meuleman W., Ernst J., Bilenky M., Yen A., Heravi-Moussavi A., Kheradpour P., Zhang Z., Wang J.et al.. Integrative analysis of 111 reference human epigenomes. Nature. 2015; 518:317–330. [DOI] [PMC free article] [PubMed] [Google Scholar]
- 6. Stunnenberg H.G., International Human Epigenome C., Hirst M.. The international human epigenome consortium: a blueprint for scientific collaboration and discovery. Cell. 2016; 167:1897. [DOI] [PubMed] [Google Scholar]
- 7. Wang T., Pehrsson E.C., Purushotham D., Li D., Zhuo X., Zhang B., Lawson H.A., Province M.A., Krapp C., Lan Y.et al.. The NIEHS TaRGET II consortium and environmental epigenomics. Nat. Biotechnol. 2018; 36:225–227. [DOI] [PMC free article] [PubMed] [Google Scholar]
- 8. Dekker J., Belmont A.S., Guttman M., Leshyk V.O., Lis J.T., Lomvardas S., Mirny L.A., O'Shea C.C., Park P.J., Ren Bet al.. The 4D nucleome project. Nature. 2017; 549:219–226. [DOI] [PMC free article] [PubMed] [Google Scholar]
- 9. Kent W.J., Sugnet C.W., Furey T.S., Roskin K.M., Pringle T.H., Zahler A.M., Haussler D. The human genome browser at UCSC. Genome Res. 2002; 12:996–1006. [DOI] [PMC free article] [PubMed] [Google Scholar]
- 10. Lee B.T., Barber G.P., Benet-Pages A., Casper J., Clawson H., Diekhans M., Fischer C., Gonzalez J.N., Hinrichs A.S., Lee C.M.et al.. The UCSC genome browser database: 2022 update. Nucleic Acids Res. 2022; 50:D1115–D1122. [DOI] [PMC free article] [PubMed] [Google Scholar]
- 11. Stalker J., Gibbins B., Meidl P., Smith J., Spooner W., Hotz H.R., Cox A.V.. The ensembl web site: mechanics of a genome browser. Genome Res. 2004; 14:951–955. [DOI] [PMC free article] [PubMed] [Google Scholar]
- 12. Cunningham F., Allen J.E., Allen J., Alvarez-Jarreta J., Amode M.R., Armean I.M., Austine-Orimoloye O., Azov A.G., Barnes I., Bennett R.et al.. Ensembl 2022. Nucleic Acids Res. 2022; 50:D988–D995. [DOI] [PMC free article] [PubMed] [Google Scholar]
- 13. Zhou X., Maricque B., Xie M., Li D., Sundaram V., Martin E.A., Koebbe B.C., Nielsen C., Hirst M., Farnham P.et al.. The human epigenome browser at washington university. Nat. Methods. 2011; 8:989–990. [DOI] [PMC free article] [PubMed] [Google Scholar]
- 14. Li D., Hsu S., Purushotham D., Sears R.L., Wang T.. WashU epigenome browser update 2019. Nucleic Acids Res. 2019; 47:W158–W165. [DOI] [PMC free article] [PubMed] [Google Scholar]
- 15. Zhou X., Lowdon R.F., Li D., Lawson H.A., Madden P.A., Costello J.F., Wang T.. Exploring long-range genome interactions using the WashU epigenome browser. Nat. Methods. 2013; 10:375–376. [DOI] [PMC free article] [PubMed] [Google Scholar]
- 16. Zhou X., Li D., Lowdon R.F., Costello J.F., Wang T.. methylC track: visual integration of single-base resolution DNA methylation data on the WashU epigenome browser. Bioinformatics. 2014; 30:2206–2207. [DOI] [PMC free article] [PubMed] [Google Scholar]
- 17. Zhou X., Li D., Zhang B., Lowdon R.F., Rockweiler N.B., Sears R.L., Madden P.A., Smirnov I., Costello J.F., Wang T.. Epigenomic annotation of genetic variants using the roadmap epigenome browser. Nat. Biotechnol. 2015; 33:345–346. [DOI] [PMC free article] [PubMed] [Google Scholar]
- 18. Moudgil A., Li D., Hsu S., Purushotham D., Wang T., Mitra R.D.. The qBED track: a novel genome browser visualization for point processes. Bioinformatics. 2021; 37:1168–1170. [DOI] [PMC free article] [PubMed] [Google Scholar]
- 19. Flynn J.A., Purushotham D., Choudhary M.N.K., Zhuo X., Fan C., Matt G., Li D., Wang T.. Exploring the coronavirus pandemic with the WashU virus genome browser. Nat. Genet. 2020; 52:986–991. [DOI] [PubMed] [Google Scholar]
- 20. Abramo K., Valton A.L., Venev S.V., Ozadam H., Fox A.N., Dekker J.. A chromosome folding intermediate at the condensin-to-cohesin transition during telophase. Nat. Cell Biol. 2019; 21:1393–1402. [DOI] [PMC free article] [PubMed] [Google Scholar]
- 21. Cusanovich D.A., Hill A.J., Aghamirzaie D., Daza R.M., Pliner H.A., Berletch J.B., Filippova G.N., Huang X., Christiansen L., DeWitt W.S.et al.. A single-cell atlas of in vivo mammalian chromatin accessibility. Cell. 2018; 174:1309–1324. [DOI] [PMC free article] [PubMed] [Google Scholar]
- 22. Yue F., Cheng Y., Breschi A., Vierstra J., Wu W., Ryba T., Sandstrom R., Ma Z., Davis C., Pope B.D.et al.. A comparative encyclopedia of DNA elements in the mouse genome. Nature. 2014; 515:355–364. [DOI] [PMC free article] [PubMed] [Google Scholar]
- 23. Sarkans U., Chiu W., Collinson L., Darrow M.C., Ellenberg J., Grunwald D., Heriche J.K., Iudin A., Martins G.G., Meehan T.et al.. REMBI: recommended metadata for biological images-enabling reuse of microscopy data in biology. Nat. Methods. 2021; 18:1418–1422. [DOI] [PMC free article] [PubMed] [Google Scholar]
- 24. Williams E., Moore J., Li S.W., Rustici G., Tarkowska A., Chessel A., Leo S., Antal B., Ferguson R.K., Sarkans U.et al.. The image data resource: a bioimage data integration and publication platform. Nat. Methods. 2017; 14:775–781. [DOI] [PMC free article] [PubMed] [Google Scholar]
- 25. Nurk S., Koren S., Rhie A., Rautiainen M., Bzikadze A.V., A. Mikheenko., Vollger M.R., Altemose N., Uralsky L., Gershman A.et al.. The complete sequence of a human genome. Science. 2022; 376:44–53. [DOI] [PMC free article] [PubMed] [Google Scholar]
Associated Data
This section collects any data citations, data availability statements, or supplementary materials included in this article.
Supplementary Materials
Data Availability Statement
The WashU Epigenome Browser source code is open-source on GitHub (https://github.com/lidaof/eg-react). The Browser is available at https://epigenomegateway.wustl.edu/ and https://epigenomegateway.org/ from Amazon Cloud services supported with both HTTP and HTTPS protocol. Dynamic track homepage: https://vizhub.wustl.edu/public/misc/dynamicTrack/.


