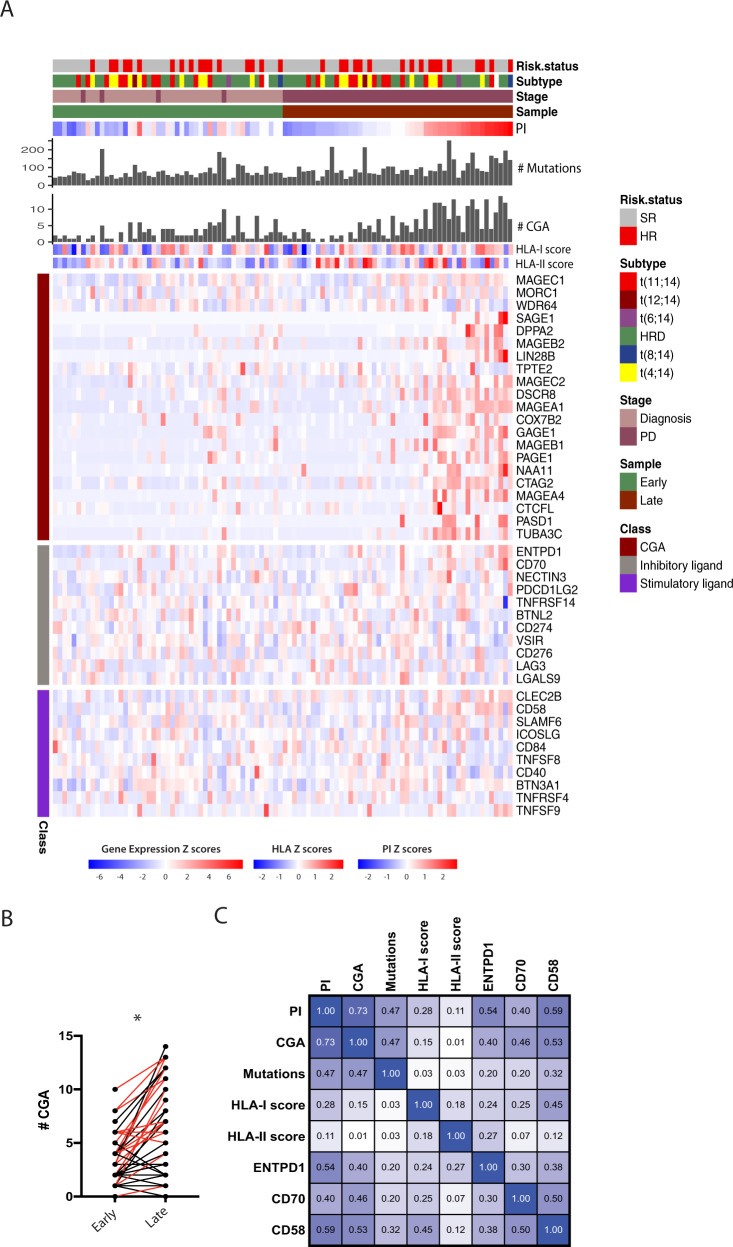
Fig. 6. Cancer Germline Antigens and a few immune regulators increased during disease progression.
A Heatmap showing the number and expression levels of CGAs in early and late samples, HLA scores, and selected inhibitory and stimulatory ligands/receptors. CGAs with expression >10 TPM in >1 sample were included in the heatmap. Patients are sorted horizontally by increasing PI of the late samples (right half) and the same patient order is used for the early samples (left half). B Number of expressed CGAs (TPM > 2) in paired early-late (latest available PD) samples increases significantly in the late samples (p < 0.0001, Wilcoxon rank test). Red color: paired samples including end-stage disease sample. See also Fig S10. C Correlation plot of PI, CGA, mutation load, and HLA scores. Inhibitory and stimulatory receptors from A, with correlation above 0.45 (Spearman r) to either PI or CGA, are included. All correlations >0.45 have p-value <1x10e−5. SR: standard risk according to ISS/R-ISS, HR: High risk.

