

Abstract
Background:
Risk-reducing salpingo-oophorectomy (RRSO) is an effective ovarian cancer risk-reduction strategy. However, bilateral oophorectomy has also been associated with increased long-term non-neoplastic sequelae, effects suggested to be mediated through reductions in systemic sex steroid hormone levels. Currently, it is unclear whether the post-menopausal ovary contributes to the systemic hormonal milieu, or whether post-menopausal ovarian volume or other factors, such as body mass index (BMI) and age, affect systemic hormone levels.
Objectives:
We examined the impact of oophorectomy on sex-steroid hormone levels in post-menopausal women. We also explored how well ovarian volume measured by transvaginal ultrasound (TVUS) correlated with direct ovarian measures obtained during surgical pathology evaluation and investigated the association between hormone levels and ovarian volumes.
Study Design:
Post-menopausal women who underwent RRSO (cases, n=180) or ovarian cancer screening (controls, n=38) enrolled in an international, prospective study of RRSO and risk of ovarian cancer algorithm (ROCA)-based screening among women at increased risk of ovarian cancer (GOG-0199) were included in this analysis. Controls were frequency-matched to the cases on age-at-menopause, age-at-study entry, and time interval between blood draws. Ovarian volume was calculated using measurements obtained from TVUS in both cases and controls, and measurements recorded in surgical pathology reports from cases. Serum hormone levels of testosterone, androstenedione, androstenediol, dihydrotestosterone, androsterone, dehydroepiandrosterone, estrone, estradiol, and sex-hormone binding globulin (SHBG) were measured at baseline and follow-up. Spearman correlation coefficients were used to compare ovarian volumes as measured on TVUS and pathology examinations. Correlations between ovarian volumes by TVUS and measured hormone levels were examined using linear regression models. All models were adjusted for age. Paired t-tests were performed to evaluate individual differences in hormone levels pre- and post-RRSO.
Results:
Ovarian volumes measured by TVUS were only moderately correlated with those reported on pathology reports (Spearman’s rho (ρ)=0.42). The median time interval between RRSO and follow-up for the cases was 13. 3 months (range 6.0–19.3 months) and between baseline and follow-up for the controls was 12.7 months (range 8.7–13.4 months). Sex-steroid levels decreased with age but were not correlated with TVUS ovarian volume, BMI, or time since menopause. Estradiol levels were significantly lower post-RRSO (% change −61.9 post-RRSO vs. +15.2 in controls, p=0.02) but no significant differences were seen for the other hormones.
Conclusion:
Ovarian volumes measured by TVUS were moderately correlated with volumes directly measured on pathology specimens and were not correlated with sex steroid hormone levels in postmenopausal women. Estradiol was the only hormone that declined significantly following RRSO. Thus, it remains unclear whether the limited post-RRSO changes in sex steroid hormones among post-menopausal women impacts long-term adverse outcomes.
Keywords: ovarian volume, post-menopausal sex steroid hormones, risk-reducing salpingo-oophorectomy (RRSO)
Condensation
Transvaginal ultrasound ovarian volume was moderately correlated with volume measured by pathology report and not statistically significantly correlated with sex-steroid hormone levels in post-menopausal women.
Introduction
Specific hereditary cancer predisposition syndromes are associated with significantly increased risks of developing ovarian cancer. Estimated lifetime ovarian cancer risk associate with pathogenic variants in BRCA1 and BRCA2 (BRCA1/2) are as high as 40%-50% and 12–25%, respectively (1, 2). Other hereditary ovarian cancer predisposition genes include the mismatch repair genes associated with Lynch syndrome (3, 4) and several other DNA repair genes (5–8). For females with a BRCA1/2 pathogenic variant, risk-reducing salpingo-oophorectomy (RRSO) reduces ovarian/fallopian tube cancer risk (by 80–90%) and cancer-specific and overall mortality. RRSO is considered the most effective option for ovarian cancer risk management in this setting (9–13). Bilateral oophorectomy for benign indications may induce a risk of non-neoplastic conditions that are likely mediated through reductions in systemic hormone levels. In premenopausal women, most androgens (in the inactive precursors androstenedione, dehydroepiandrosterone (DHEA) and DHEA-sulfate (DHEAS)) are produced largely in the adrenals, and the remaining in the ovary. At menopause, adrenal production of DHEA and ovarian production of DHEA(S), androstenedione, testosterone as well as the estrogens decline dramatically (14). However, the contribution of the ovary to maintaining the postmenopausal hormonal milieu is uncertain (15–21). A meta-analysis of >6,000 postmenopausal women from 13 prospective studies showed that sex hormone levels were lower in older than younger women, with the largest differences in DHEAS and androgens (especially testosterone). Post-menopausal hormones have also been shown to be related to body mass index (BMI), oophorectomy, hysterectomy, cigarette smoking, and alcohol consumption. Hormone levels were lower in women with bilateral oophorectomy compared with naturally postmenopausal women, suggesting a role for the postmenopausal ovary in androgen production (15). Furthermore, free testosterone and free estradiol levels among postmenopausal women undergoing oophorectomy were lower postoperatively (18, 19), further suggesting that the post-menopausal ovary contributed to hormone production. However, an investigation of sex hormone sources in postmenopausal women suggested that androgens were produced mainly by the adrenal glands rather than the ovaries (21). This issue is particularly important for women contemplating RRSO, although previous reports have been inconsistent regarding the relationship between benign oophorectomy and adverse health outcomes including increased mortality (22–27).
Data regarding the relationships between postmenopausal ovarian volume and steroid hormone levels are limited. Previous studies suggested that postmenopausal women with large non-cystic ovaries were at increased risk of breast and endometrial cancer (28, 29). Among women with endometrial cancer, larger ovarian volumes were associated with higher circulating steroid hormone levels (29, 30).
Postmenopausal ovarian volume, as measured by transvaginal ultrasound (TVUS), in healthy women was shown to be positively associated with bone mineral density and negatively associated with sex-hormone binding globulin (SHBG) (31). However, how well the measurements on TVUS correlate with volume measured in pathology specimens is not known.
Similar to women undergoing oophorectomy for benign indications, post-menopausal women at increased ovarian cancer risk who choose RRSO may experience adverse effects secondary to altered post-operative hormone levels. Understanding the impact of oophorectomy on sex-steroid hormone levels and the determinants of these changes might be important in identifying women at risk of adverse consequences who could be targeted for mitigating interventions.
The Prospective Study of Risk-reducing Salpingo-oophorectomy and Longitudinal CA-125 Screening among Women at Increased Risk of Ovarian Cancer (Gynecologic Oncologic Group Protocol 0199 (GOG-0199) was implemented in 2003. All participants had TVUS and serum collected at enrollment and periodically during follow-up. Participants elected to undergo either RRSO or ovarian cancer screening (OCS). Here we evaluated the correlation between the TVUS volume of non-cystic benign ovaries and measurements of circulating androgens and estrogens in post-menopausal women and the effect of oophorectomy on circulating hormone levels. We also sought other possible independent determinants of hormone levels, including age and BMI. This unique patient population also allowed comparing volumes measured on pre-operative TVUS with the gross descriptions in corresponding surgical pathology reports.
Materials and Methods
Study Population
GOG-0199 was a multi-institution, prospective cohort study. Detailed eligibility criteria have been published (32). Eligible women had increased breast and/or ovarian cancer risk based on personal and/or family cancer history, age ≥30, no previous history of ovarian/fallopian tube/peritoneal cancer, and at least one intact ovary. At enrollment, participants chose either RRSO (33) or OCS (34). The GOG-0199 (35) screening algorithm included CA-125 measurements and the Risk of Ovarian Cancer Algorithm (ROCA) score calculations every 3 months, in addition to an annual TVUS. Participants in the RRSO cohort underwent surgery within 90 days of enrollment and had CA-125 measurements and ROCA score calculations every 6 months for the 5 years of follow-up. Participants in the OCS cohort had the option to cross over to the RRSO cohort post-enrollment, either electively or as prompted by screening results or clinical findings.
The analyses reported here utilized a subset of GOG-0199 participants. Individuals were included as cases if they: 1) were postmenopausal at RRSO; 2) had TVUS at baseline; 3) had baseline serum available; 4) had RRSO during study participation (either at baseline or cross-over); 5) were not using exogenous hormones at baseline or after RRSO; 6) had at least one blood draw within 12 months following RRSO; and 7) did not have a malignancy (ovarian, fallopian tube, or peritoneal) diagnosed at the time of RRSO. A smaller group of controls was included to evaluate the possibility that the declines in hormone levels after RRSO were a function of aging and time since menopause, rather than a direct effect of oophorectomy. Eligibility criteria for the control group were the same as the cases except for the RRSO requirement. The control group was frequency-matched to the cases on age at menopause (<44, 45–49, 50–54, 55–59, 60–64, >64), age at baseline (<44, 45–49, 50–54, 55–59, 60–64, >64) and time interval between blood draws (<12 months, ≥12 months).
All participants signed written informed consent for GOG-0199; NCI Protocol 02-C-0268; NCT-00043472. The GOG-0199 protocol was approved by institutional review boards at the National Cancer Institute, GOG, and 151 participating GOG institutions (US, Australia).
Hormone Measurements
Serum hormone levels were measured at baseline for both the RRSO and control groups. Measurements were also obtained approximately 12 months after surgery for the RRSO group and at a matched post-enrollment interval blood draw for the controls. A panel of eight serum hormones (testosterone, androstenedione, androstenediol, dihydrotestosterone, androsterone, dehydroepiandrosterone (DHEA), estrone, and estradiol) were assayed using Gas Chromatography-Mass Spectrometry (GC-MS). SHBG was quantified by radioimmunoassay using the IRMA count SHBG kit (Siemens Healthcare Diagnostics Inc., Mississauga, ON, Canada). All hormone measurements were done in the laboratory of Dr. Chantal Guillemette, at Laval University, Quebec City, Canada (supplemental data).
Samples with levels measured below the lower limits of quantification (LLOQ) were assigned a value equal to half the LLOQ or the actual measured value, whichever was higher.
Ovarian Volume Measurements
Volume by TVUS.
For both the RRSO and control groups, ovarian volume was estimated using the prolate ellipsoid formula (Length×Height×Width×0.523) for each ovary, using dimensions recorded on baseline TVUS. If both ovaries were present, volumes were added to determine total ovarian volume. For participants in the RRSO group with missing measurements on TVUS on one or both ovaries for whom measurements from pathology reports were available, the volume of the ovary with missing values was imputed using measurements from pathology reports and the pathology-to-TVUS volume ratio from all participants with complete data. For participants with only one ovary, the volume measured by either TVUS or imputed was used as the total volume. For participants in the control group with missing TVUS data, measures from TVUS at another time point were used. Ovaries with hypoechoic, hemorrhagic, complex, or septate cysts reported on TVUS (Class 2/3 cysts) were excluded from this analysis (n=14).
Volume by pathology.
Ovarian volume was estimated using the prolate ellipsoid formula (L×H×W×0.523), using the ovary dimensions recorded in the gross surgical pathology report.
Statistical Analysis
Spearman correlation coefficients were used to compare ovarian volumes as measured by TVUS and pathology examination. Fisher’s Exact test was used to assess differences between RRSO and control patients according to baseline characteristics, including sociodemographic and reproductive factors, personal and family history, history of chemopreventive agents or hormonal therapies, and alcohol and cigarette use. The Kruskal-Wallis test was used to assess differences for continuous variables including age at enrollment, BMI, age at menarche, age at menopause, and years since menopause.
Linear regression models were used to assess the relationship between ovarian volume by TVUS (in quartiles and as a continuous variable) and hormones. Analysis of variance models were used to compare hormone concentrations in women pre- and post-RRSO and over time in women who did not undergo surgery. Models were adjusted for age at first blood draw (continuous), BMI (continuous), prior hormone use (ever/never), time since menopause (in years), hysterectomy (yes/no), and personal and family history of cancer. Finally, analyses were stratified by age group, time since menopause, and BMI (normal, overweight, obese).
Paired t-tests were performed to evaluate changes in hormone levels pre- and post-RRSO, and for controls to evaluate hormone changes from baseline to follow-up. The absolute change in hormone levels for each individual was calculated; differences between RRSO participants and controls were explored to assess whether hormone changes following RRSO were due in part to age-related hormonal declines rather than oophorectomy.
Results
A total of 225 participants with RRSO were eligible for inclusion in this study, and 50 controls were selected from the eligible non-surgical participants. Forty-five RRSO participants and 12 controls were excluded due to oral contraceptive use at enrollment, anastrozole, tamoxifen, or raloxifene use within 30 days of enrollment, or inadequate ovarian volume information (Figure 1). Mean ages at baseline hormone measurement were similar between RRSO and controls (54.2 years vs. 56.4 years, p=0.12). Participants in the RRSO group were younger at menopause (46.3 years vs. 49.1 years, p=0.006) and more likely to report prior breast cancer (60% vs. 42.1%, p=0.049). BMI, age at menarche, parity, and tamoxifen and raloxifene use were similar between cases and controls (Table1). The median time interval between RRSO and follow-up for the cases was 13. 3 months (range 6.0–19.3 months) and between baseline and follow-up for the controls was 12.7 months (range 8.7–13.4 months).
Figure 1:

Numbers of cases and controls included
Table 1:
Baseline characteristics
| Patient characteristic | RRSO N=180 | Controls N=38 | P-value |
|---|---|---|---|
|
| |||
| Age at Enrollment, Mean (SD) | 54.2 (6.2) | 56.3 (7.0) | 0.12 |
|
| |||
| Race | |||
| White | 173 (96.1) | 37 (97.4) | 1.0 |
| Black | 6 (3.3) | 1 (2.6) | |
| Other/Not Specified | 1 (0.6) | ||
|
| |||
| BMI, mean (SD) | 28.0 (6.7) | 26.7 (6.1) | 0.23 |
|
| |||
| Age at Menarche, Mean (SD) | 12.5 (1.5) | 12.4 (1.6) | 0.87 |
|
| |||
| Parity | |||
| 0 | 30 (18.2) | 6 (16.7) | 0.70 |
| 1 | 32 (19.4) | 9 (25.0) | |
| 2 | 58 (35.2) | 9 (25.0) | |
| 3 | 30 (18.2) | 9 (25.0) | |
| 4+ | 15 (9.1) | 3 (8.3) | |
|
| |||
| History of contraceptive use | |||
| Yes | 142 (78.9) | 27 (71.1) | 0.29 |
| No | 38 (21.1) | 11 (28.9) | |
|
| |||
| Menopausal Status | |||
| Age at menopause, mean (SD) | 46.3 (6.9) | 49.1 (6.5) | 0.006 |
| Time since menopausal in years, mean (SD) | 8.0 (6.1) | 7.2 (6.8) | 0.22 |
|
| |||
| Post-menopausal hormone use | |||
| No | 80 (44.4) | 17 (44.7) | 1.000 |
| Yes | 100 (55.6) | 21 (55.3) | |
|
| |||
| History of Tamoxifen use | |||
| Yes | 37 (20.6) | 6 (15.8) | 0.655 |
| No | 143 (79.4) | 32 (84.2) | |
|
| |||
| History of Raloxifene use | |||
| Yes | 9 (5.0) | 0 | 0.365 |
| No | 171 (95.0) | 38 (100.0) | |
|
| |||
| Tubal ligation before enrollment | |||
| No | 116 (65.5) | 26 (68.4) | 0.851 |
| Yes | 61 (34.5) | 12 (31.6) | |
|
| |||
| Hysterectomy before enrollment | |||
| No | 146 (82.0) | 33 (86.8) | 0.636 |
| Yes | 32 (18.0) | 5 (13.2) | |
|
| |||
| Hysterectomy at time of RRSO | 67 (37.2) | -- | |
|
| |||
| History of Breast Cancer | |||
| No | 72 (40.0) | 22 (57.9) | 0.049 |
| Yes | 108 (60.0) | 16 (42.1) | |
RRSO: risk-reducing salpingo-oophorectomy
Correlation of ovarian volume measured by TVUS and in pathology reports
Twelve participants had unilateral oophorectomy before enrollment; one RRSO participant had unilateral oophorectomy and part of the contralateral ovary resected previously. Ovarian volume from TVUS was available for 141/180 (78%) RRSO participants and 35/38 (92%) non-surgical participants. RRSO pathology reports provided ovarian volume for 164/180 (91%) women. The proportions of participants with hypoechoic, hemorrhagic, complex, or septated (Class 2/3) cysts reported on TVUS, measured mean ovarian volumes, and mean ovarian volumes based on measured plus imputed values were similar between the RRSO and control groups (Table 2). The Spearman correlation between TVUS-measured and pathology-measured volumes was 0.42 (Figure 2).
Table 2:
Ovarian volume by transvaginal ultrasound and by pathology report at the time of RRSO
| RRSO (N=180) | Controls (N=38) | P-value | |
|---|---|---|---|
|
| |||
| Number of Ovaries | 0.75 | ||
| 1a | 12 (6.7) | 1 (2.6) | |
| 2 | 168 (93.3) | 37 (97.4) | |
|
| |||
| Ovary Cysts | 0.715 | ||
| Class 0/1 | 169 (93.9) | 35 (92.1) | |
| Class 2/3b | 11 (6.1) | 3 (7.9) | |
|
| |||
| Measurements by TVUS, n | 141 | 35 | 0.642 |
| Mean ovarian volume in cm3 (SD) | 5.9 (11.6) | 4.0 (3.7) | |
|
| |||
| Imputed measurements by TVUS, n c | 180 | 38 | 0.708 |
| Mean ovarian volume in cm3 (SD) | 5.7 (10.3) | 4.1 (3.5) | |
|
| |||
| Measurements by pathology records) | 164 | -- | |
| Mean ovarian volume in cm3 (SD) | 5.9 (8.6) | ||
RRSO: risk-reducing salpingo-oophorectomy; TVUS: transvaginal ultrasound
One participant had unilateral oophorectomy and part of the second ovary resected before study enrollment
Excluded from ovarian volume estimates by TVUS and pathology records
Volume was imputed for those with missing values
Figure 2:
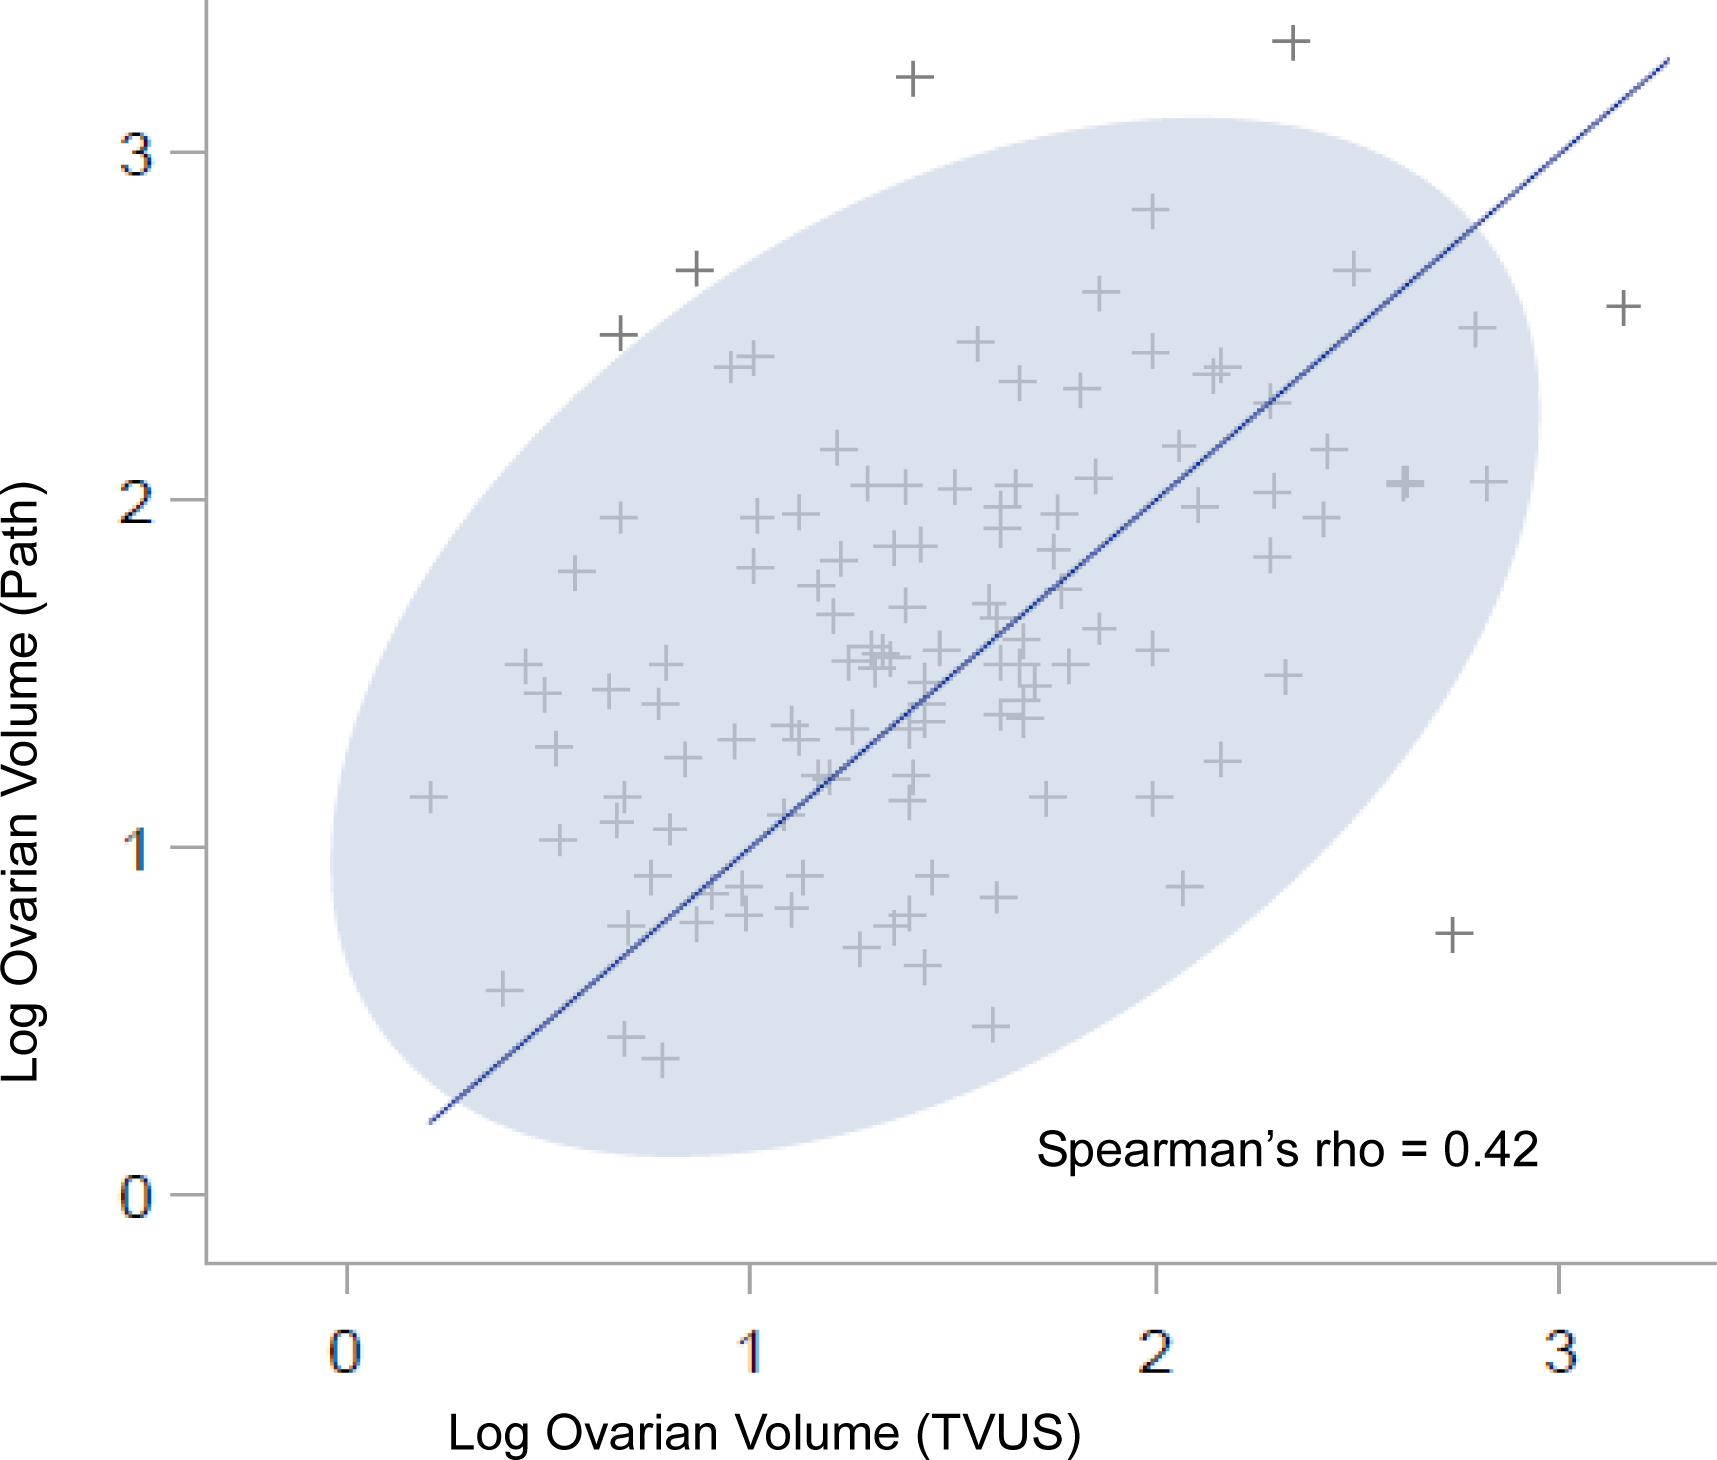
Spearman correlation of log ovarian volume by transvaginal ultrasound (TVUS) and pathology records
Correlations between hormone levels and changes related to surgery and other factors
Most hormone levels were above the LLOQ, except estrone and estradiol, for which baseline values were undetected in 7.2% and 12.5% of RRSO participants (Supplementary Table 1). Correlations between the hormones are shown in Table 3. Except for androstenediol and DHEA (ρ=0.84) and estrone and estradiol (ρ=0.83), the correlations were modest.
Table 3:
Spearman correlations between hormone measurements among all women at baseline
| Testosterone | Androstenedione | Androstenediol | Dihydrotestosterone | Androsterone | Dehydroepiandrosterone | Estrone | Estradiol | SHBG | |
|---|---|---|---|---|---|---|---|---|---|
| Testosterone | 1.00 | 0.51 | 0.52 | 0.56 | 0.46 | 0.44 | 0.36 | 0.26 | 0.28 |
| Androstenedione | 1.00 | 0.53 | 0.5 | 0.53 | 0.64 | 0.48 | 0.36 | 0.16 | |
| Androstenediol | 1.00 | 0.68 | 0.73 | 0.84 | 0.33 | 0.29 | 0.2 | ||
| Dihydrotestosterone | 1.00 | 0.7 | 0.62 | 0.28 | 0.22 | 0.52 | |||
| Androsterone | 1.00 | 0.71 | 0.3 | 0.27 | 0.09 | ||||
| Dehydroepiandrosterone | 1.00 | 0.24 | 0.17 | 0.13 | |||||
| Estrone | 1.00 | 0.83 | −0.01 | ||||||
| Estradiol | 1.00 | −0.13 | |||||||
| SHBG | 1.00 |
p<0.01, p=0.02, p=0.05
Table 4 shows the percentage changes in pre- and post-surgery hormones for the RRSO group and in baseline to follow-up for non-surgical controls. Overall, the patterns of decline in steroid hormones before and after surgery (RRSO) and from baseline to follow-up (controls) were similar.
Table 4:
Percentage change in pre- and post-surgery for RRSO and at baseline and follow up for controls
| RRSO (n=180) | Controls (n=38) | Effect of RRSO | |||||
|---|---|---|---|---|---|---|---|
|
| |||||||
| Hormone (concentration) | Baseline | Post-RRSO | % changea | Baseline | Follow-up | % changea | P-valueb |
|
| |||||||
| Testosterone (ng/ml) | 0.23 | 0.17 | (26.1) | 0.19 | 0.17 | (10.5) | 0.92 |
| Androstenedione (ng/ml) | 0.57 | 0.49 | (14.0) | 0.51 | 0.48 | (5.9) | 0.98 |
| Androstenediol (pg/ml) | 291.4 | 278.9 | (4.3) | 273.8 | 240.8 | (12.1) | 0.72 |
| Dihydrotestosterone (pg/ml) | 39.0 | 37.3 | (4.4) | 40.9 | 37.2 | (9.0) | 0.84 |
| Androsterone (pg/ml) | 128.3 | 128.4 | 0.1 | 127.8 | 121.8 | (4.7) | 0.73 |
| Dehydroepiandrosterone (ng/ml) | 2.23 | 2.28 | 2.2 | 2.21 | 1.86 | (15.8) | 0.28 |
| Estrone (pg/ml) | 30.0 | 28.2 | (6.0) | 23.1 | 24.9 | 7.8 | 0.31 |
| Estradiol (pg/ml) | 14.7 | 5.6 | (61.9) | 9.2 | 10.6 | 15.2 | 0.02 |
| SHBG (nmol/L) | 81.0 | 82.5 | 1.9 | 93.7 | 89.4 | (4.6) | 0.29 |
RRSO: risk-reducing salpingo-oophorectomy
(Negative) % change indicates a decrease from Baseline to post-RRSO or followup measurement.
Partial F-Test for any RRSO effect. OLS model fit the post marker value as a function of main effects for RRSO/Control, marker and the interaction, adjusted for baseline ovarian volume.
Overall, ovarian volume was not statistically significantly correlated with any sex hormone levels (Table 5). Androstenedione, androstenediol, and DHEA levels decreased with increasing age (all p<=0.05) (Table 6). Increasing BMI was correlated with lower SHBG levels (p <0.01) (Table 7). Finally, time since menopause was not associated with any of the hormones (Table 8). In the RRSO group, hormone levels poorly correlated with ovarian volume by pathology reports (supplemental table 2).
Table 5:
Comparison by ovarian volume
| RRSO | Control | ||||||||||||||||||
|---|---|---|---|---|---|---|---|---|---|---|---|---|---|---|---|---|---|---|---|
| Pre-RRSO | Post-RRSO | Baseline | Follow-up | P1 | P2 | P3 | |||||||||||||
| Quartile Ovarian Volume | Quartile Ovarian Volume | Quartile Ovarian Volume | Quartile Ovarian Volume | ||||||||||||||||
| 1 | 2 | 3 | 4 | 1 | 2 | 3 | 4 | 1 | 2 | 3 | 4 | 1 | 2 | 3 | 4 | ||||
| N | 31 | 36 | 36 | 36 | 31 | 36 | 36 | 36 | 7 | 9 | 13 | 6 | 7 | 9 | 13 | 6 | |||
| Testosterone | 0.16 (0.14, 0.19) | 0.21 (0.16, 0.26) | 0.2 (0.16, 0.23) | 0.21 (0.16, 0.26) | 0.12 (0.1, 0.13) | 0.22 (0.15, 0.3 | 0.15 (0.09, 0.21) | 0.14 (0.11, 0.17) | 0.16 (0.14, 0.19) | 0.17 (0.11, 0.24) | 0.22 (0.14, 0.3) | 0.16 (0.1, 0.23) | 0.19 (0.14, 0.23) | 0.14 (0.11, 0.17) | 0.17 (0.11, 0.24) | 0.17 (0.12, 0.23) | 0.41 | <0.01 | 0.89 |
| Androstenedione | 0.51 (0.44, 0.57) | 0.58 (0.46, 0.71) | 0.54 (0.45, 0.63) | 0.57 (0.46, 0.69) | 0.4 (0.35, 0.47) | 0.57 (0.47, 0.67) | 0.48 (0.39, 0.57) | 0.42 (0.34, 0.5) | 0.46 (0.35, 0.59) | 0.35 (0.31, 0.39) | 0.62 (0.46, 0.79) | 0.43 (0.28, 0.6) | 0.55 (0.35, 0.79) | 0.38 (0.3, 0.46) | 0.46 (0.34, 0.6) | 0.54 (0.26, 0.88) | 0.60 | <0.01 | 0.88 |
| Androstenediol | 253.7 (215.6, 298.4) | 258.8 (210.5, 318.2) | 224.9 (186.5, 271.1) | 256.2 (201.7, 325.5) | 227.1 (187.7, 274.9) | 251.1 (199.6, 315.9) | 187.7 (148.1, 237.7) | 229.4 (172.1, 305.8) | 234.1 (154.3, 355.0) | 231.8 (183, 293.5) | 269.4 (177.9, 407.8) | 203.4 (132.7, 311.3) | 243.7 (163.0, 364.1) | 207.5 (136.3, 315.8) | 197.3 (133.1, 292.4) | 191.5 (131.1, 279.4) | 0.57 | <0.01 | 0.71 |
| Dihydrotestosterone | 28.1 (23.2, 33.9) | 34.5 (28.7, 41.5) | 31.1 (25.4, 38.1) | 35.6 (28.0, 45.2) | 25.3 (20.5, 31.3) | 30.2 (24.6, 37.1) | 26.7 (20.5, 34.6) | 28.7 (22.2, 37.0) | 35.2 (21.1, 58.5) | 35.6 (26.1, 48.4) | 31.1 (19.0, 50.6) | 36.7 (18.7, 71.1) | 36.3 (20.3, 64.6) | 33.8 (23.1, 49.2) | 25.3 (16.2, 39.2) | 35.6 (21.3, 59.1) | 0.13 | 0.11 | 0.68 |
| Androsterone | 111.2 (93.1, 132.8) | 119.3 (102.2, 139.3) | 106.8 (90.8, 125.5) | 119.3 (95.9, 148.3) | 108.9 (84.9, 139.7) | 118.1 (98.2, 142.0) | 94.6 (77.8, 114.9) | 107.9 (88.1, 132) | 104.6 (77.0, 142.1) | 114.6 (97.2, 135.1) | 114.6 (77.1, 170) | 133.3 (81.4, 217.8) | 107.9 (78.2, 148.7) | 115.7 (88.3, 151.6) | 94.6 (62.9, 141.9) | 121.7 (74.9, 197.4) | 0.51 | 0.08 | 0.42 |
| Dehydroepiandrosterone | 2.0 ( 1.7, 2.3) | 2.2 1.7, 2.6) | 2.0 (1.7, 2.5) | 1.9 (1.6, 2.4) | 1.7 (1.4, 2.1) | 2.3 (1.8, 2.8) | 1.9 (1.4, 2.3) | 1.9 (1.5, 2.4) | 1.8 (1.2, 2.7) | 1.8 (1.4, 2.2) | 2.3 (1.5, 3.4) | 1.7 (1.0, 2.8) | 1.9 (1.1, 2.8) | 1.7 (1.2, 2.4) | 1.7 (1.1, 2.4) | 1.6 (1.0, 2.5) | 0.89 | <0.01 | 0.75 |
| Estrone | 15.9 (13.0, 19.6) | 18.7 (15.6, 22.4) | 17.4 (13.6, 22.1) | 27.8 (20.4, 37.8) | 14.3 (11.3, 18.1) | 16.5 (13.4, 20.1) | 19.9 (13.9, 28.3) | 15.4 (11.9, 20.0) | 16.3 (9.2, 28.3) | 16.5 (12.3, 22.0) | 21.4 (14.9, 30.6) | 25.6 (16.5, 39.3) | 16.1 (9.5, 26.9) | 16.6 (12.4, 22.2) | 16.8 (11.5, 24.4) | 35.2 (17.7, 69.4) | 0.28 | <0.01 | 0.30 |
| Estradiol | 3.0 (2.2, 4.0) | 4.2 (3.1, 5.6) | 4.0 (2.8, 5.5) | 14.8 (8.7, 24.6) | 2.9 (2.0, 4.2) | 3.2 (2.5, 4.1) | 4.0 (2.7, 5.8) | 3.1 (2.4, 4.1) | 3.2 (1.8, 5.4) | 4.5 (2.5, 7.5) | 6.0 (3.5, 10.1) | 8.4 (2.5, 24.5) | 3.0 (1.7, 4.8) | 3.5 (2.3, 5.2) | 3.3 (2.3, 4.7) | 12.9 (2.3, 56.6) | 0.53 | <0.01 | 0.02 |
| SHBG | 68.4 (54, 86.6) | 69.1 (55.7, 85.7) | 68.4 (54.0, 86.5) | 63.7 (50.8, 79.8) | 74.9 (59.4, 94.5) | 70.5 (58.2, 85.4) | 67.0 (53.3, 84.2) | 57.0 (44.0, 73.8) | 80.5 (43.0, 149.6) | 80.5 (54.4, 118.8) | 73.4 (52.4, 102.7) | 81.3 (42, 156.3) | 95.5 (54, 168.5) | 74.9 (54.9, 102.2) | 65.0 (49.9, 84.7) | 97.5 (75.9, 125.2) | <0.01 | 0.49 | 0.12 |
P1: Ovarian volume; P2: Pre vs. Post; P3: RSSO vs. Controls
Table 6:
Comparison by age at pre-RRSO and baseline blood draw
| Pre-RRSO | Post-RRSO | Baseline | Follow-up | P1 | P2 | P3 | |||||||||||||
|---|---|---|---|---|---|---|---|---|---|---|---|---|---|---|---|---|---|---|---|
| Age at pre-oophorectomy blood draw (years) | Age at pre-oophorectomy blood draw (years) | Age at pre-oophorectomy blood draw (years) | Age at pre-oophorectomy blood draw (years) | ||||||||||||||||
| 40–49 | 50–54 | 55–59 | 60–65 | 40–49 | 50–54 | 55–59 | 60–65 | 40–49 | 50–54 | 55–59 | 60–65 | 40–49 | 50–54 | 55–59 | 60–65 | ||||
| N | 39 | 49 | 57 | 35 | 39 | 49 | 57 | 35 | 7 | 9 | 11 | 11 | 7 | 9 | 11 | 11 | |||
| Testosterone | 0.20 (0.16, 0.24) | 0.18 (0.16, 0.21) | 0.18 (0.15, 0.22) | 0.27 (0.15, 0.40) | 0.16 (0.10, 0.22) | 0.15 (0.11, 0.19) | 0.16 (0.12, 0.20) | 0.16 (0.11, 0.22) | 0.15 (0.10, 0.20) | 0.28 (0.21, 0.26) | 0.17 (0.13, 0.22) | 0.14 (0.08, 0.20) | 0.16 (0.13, 0.20) | 0.18 (0.15, 0.22) | 0.18 (0.13, 0.24) | 0.13 (0.07, 0.19) | 0.81 | <0.01 | 0.91 |
| Androstenedione | 0.62 (0.5, 0.74) | 0.55 (0.47, 0.64) | 0.49 (0.43, 0.56) | 0.49 (0.4, 0.59) | 0.36 (0.3, 0.43) | 0.36 (0.3, 0.43) | 0.36 (0.3, 0.43) | 0.36 (0.3, 0.43) | 0.68 (0.48, 0.91) | 0.58 (0.44, 0.75) | 0.36 (0.28, 0.45) | 0.43 (0.32, 0.56) | 0.67 (0.43, 0.95) | 0.35 (0.27, 0.43) | 0.52 (0.38, 0.68) | 0.36 (0.28, 0.45) | 0.03 | <0.01 | 0.65 |
| Androstenediol | 307.0 (262.2, 359.3) | 280.5 (237,6 331.0) | 222,.6 (186.4 265.8) | 187.7 (157.8, 223.1) | 289.0 (235,.5 354.7) | 248.6 (210.0, 294.3) | 213.9 (172.7, 264.8) | 159.8 (127.8, 199.7) | 280.5 (172.9, 454.6) | 307.0 (239.3, 393.8) | 229.4 (167.5, 314.2) | 173.2 (119.0, 252.7) | 269.4 (173.7, 417.7) | 241.3 (191.7, 303.5) | 224.9 (151.9, 332.6) | 138.8 (98.8, 194.8) | 0.05 | <0.01 | 0.63 |
| Dihydrotestosterone | 39.9 (32.4, 48.9) | 30.8 (25.8, 36.7) | 29.9 (25.6, 34.9) | 30.2 (24.6, 37.0) | 33.5 (26.5, 42.2) | 26.7 (22.2, 32) | 27.8 (22.7, 34.0) | 24.0 (18.3, 31.5) | 41.9 (30.7, 57.2) | 48.4 (32.4, 72.1) | 34.2 (24, 48.5) | 20.3 (12.3, 33.2) | 38.3 (25.1, 58.0) | 36.3 (24.4, 53.9) | 37.1 (25.6, 53.6) | 18.1 (11.8, 27.6) | 0.62 | 0.07 | 0.65 |
| Androsterone | 136.0 (118.3, 156.3) | 123.0 (105., 143.2) | 101.5 (87.9, 117.2) | 92.7 (77.6, 110.7) | 124.2 (104.4, 147.8) | 110.1 (93.9, 128.9) | 105.7 (87.5, 127.6) | 83.8 (71.6, 98.1) | 155.0 (97.6, 246.0) | 133.3. (108.0, 164.5) | 110.1 (80.7, 150.0) | 80.5 (60.3, 107.2) | 150.4 (91.9, 245.9) | 120.5 (96.9, 149.7) | 115.7 (88.0, 152.2) | 68.4 (50.0, 93.4) | 0.52 | 0.06 | 0.48 |
| Dehydroepiandrosterone | 2.3 (2.0, 2.7) | 2.4 (2.0, 2.7) | 1.8 (1.6, 2.1) | 1.5 (1.2, 1.8) | 2.5 (2.0, 3.1) | 2.2 (1.9, 2.6) | 1.8 (1.5, 2.2) | 1.4 (1.1, 1.7) | 2.6 (1.6, 3.9) | 2.5 (1.7, 3.3) | 1.7 (1.1, 2.4) | 1.6 (1.1, 2.2) | 2.6 (1.7, 3.6) | 1.7 (1.3, 2.2) | 1.9 (1.3, 2.6) | 1.1 (0.7, 1.5) | <0.01 | <0.01 | 0.97 |
| Estrone | 22.3 (16.8, 29.6) | 24.0 (18.5, 31.1) | 17.4 (14.8, 20.3) | 15.6 (13.0, 18.7) | 15.1 (11.4, 20.0) | 20.1 (15.6, 25.9) | 16.1 (13.6, 19.1) | 16.3 (13.3, 19.9) | 29.0 (18.1, 46.1) | 20.8 (16.5, 26.0) | 16.6 (10.7, 25.7) | 17.5 (12.1, 25.3) | 34.2 (18.7, 61.7) | 17 (12.2, 23.5) | 18.1 (11.9, 27.2) | 16.3 (11, 23.9) | 0.59 | <0.01 | 0.29 |
| Estradiol | 10.0 (5.9, 16.7) | 6.5 (4.5, 9.2) | 3.8 (2.9, 4.8) | 3.0 (2.4, 3.8) | 3.1 (2.2, 4.3) | 4.5 (3.4, 5.8) | 3.3 (2.7, 4.1) | 2.9 (2.2, 3.7) | 13.2 (5.0, 32.2) | 5.6 (2.9, 9.9) | 3.7 (2.2, 5.9) | 3.8 (2.8, 5.1) | 12.7 (3.4, 42.3) | 2.7 (1.4, 4.7) | 3.8 (2.4, 5.6) | 3.4 (2.4, 4.6) | 0.84 | <0.01 | 0.02 |
| SHBG | 68.4 (54.2, 86.3) | 58.1 (47.3, 71.4) | 70.5 (59.9, 83) | 65.0 (52.6, 80.3) | 65.0 (50.8, 83.1) | 56.4 (45.5, 69.8) | 78.0 (67.2, 90.6) | 61.8 (50.0, 76.4) | 74.9 (41.9, 133.3) | 99.5 (69.2, 142.9) | 82.9 (53.8, 127.4) | 59.3 (43.4, 81) | 78.0 (53.2, 114) | 91.8 (69.5, 121) | 89.0 (62.5, 127) | 57. (42.3, 78.2) | 0.74 | 0.48 | 0.13 |
P1: Age at blood draw; P2: Pre vs. Post; P3: RSSO vs. Controls
Table 7:
Comparison by body mass index
| RRSO | Control | ||||||||||||||||||
|---|---|---|---|---|---|---|---|---|---|---|---|---|---|---|---|---|---|---|---|
| Pre-RRSO | Post-RRSO | Baseline | Follow-up | P1 | P2 | P3 | |||||||||||||
| BMI | BMI | BMI | BMI | ||||||||||||||||
| 18.5–<25kg/m2 | 25–<30kg/m2 | 30–<35kg/m2 | ≥35kg/m2 | 18.5–<25kg/m2 | 25–<30kg/m2 | 30–<35kg/m2 | ≥35kg/m2 | 18.5–<25kg/m2 | 25–<30kg/m2 | 30–<35kg/m2 | ≥35kg/m2 | 18.5–<25kg/m2 | 25–<30kg/m2 | 30–<35kg/m2 | ≥35kg/m2 | ||||
| N | 64 | 65 | 27 | 23 | 64 | 65 | 27 | 23 | 18 | 10 | 6 | 4 | 18 | 10 | 6 | 4 | |||
| Testosterone | 0.22 (0.15, 0.29) | 0.2 (0.17, 0.23) | 0.2 (0.16, 0.24) | 0.2 (0.15, 0.25) | 0.15 (0.12, 0.18) | 0.17 (0.13, 0.22) | 0.16 (0.09, 0.23) | 0.16 (0.09, 0.24) | 0.21 (0.15, 0.27) | 0.16 (0.12, 0.21) | 0.14 (0.08, 0.2) | 0.21 (0.1, 0.33) | 0.19 (0.15, 0.22) | 0.15 (0.12, 0.18) | 0.12 (0.06, 0.17) | 0.21 (0.08, 0.36) | 0.78 | <0.01 | 0.02 |
| Androstenedione | 0.58 (0.51, 0.66) | 0.52 (0.45, 0.59) | 0.49 (0.38, 0.61) | 0.48 (0.38, 0.58) | 0.49 (0.42, 0.56) | 0.46 (0.41, 0.52) | 0.45 (0.36, 0.54) | 0.45 (0.36, 0.55) | 0.54 (0.43, 0.66) | 0.49 (0.32, 0.69) | 0.42 (0.32, 0.53) | 0.38 (0.31, 0.45) | 0.51 (0.37, 0.65) | 0.43 (0.34, 0.53) | 0.36 (0.3, 0.43) | 0.38 (0.15, 0.64) | 0.77 | <0.01 | 0.85 |
| Androstenediol | 241.3 (213.3, 272.8) | 248.6 (210.1, 294.2) | 234.1 (177.5, 308.6) | 264.1 (213.3, 326.8) | 224.9 (191.2, 264.5) | 231.8 (190.2, 282.4) | 227.1 (167.7, 307.5) | 216 (173.0, 269.6) | 253.7 (189.4, 339.7) | 216.0 (157.2, 296.7) | 195.4 (116.7, 326.7) | 274.9 (164.7, 458.3) | 218.2 (165.9, 286.9) | 191.5 (130.9, 279.9) | 180.3 (100.9, 321.5) | 236.5 (129.6, 430.7) | 0.54 | <0.01 | 0.71 |
| Dihydrotestosterone | 36.7 (32.0, 42.0) | 32.1 (27.2, 37.9) | 27.8 (21.9, 35.2) | 26.1 (20.1, 33.8) | 31.8 (27.2, 37.1) | 29.9 (24.4, 36.5) | 23.8 (17.6, 32.0) | 20.1 (15.7, 25.7) | 41.5 (28.9, 59.4) | 28.7 (20.2, 40.5) | 21.6 (11.3, 40.6) | 32.1 (23.7, 43.4) | 38.3 (27.5, 53.0) | 26.7 (19.3, 36.7) | 19.1 (9.4, 37.7) | 28.1 (16.6, 46.9) | 0.14 | 0.05 | 0.69 |
| Androsterone | 115.7 (103.0, 130.0) | 112.3 (97.2, 129.8) | 104.6 (81.7, 134.0) | 113.4 (95.0, 135.4) | 98.5 (85.9, 112.8) | 111.2 (95.5, 129.4) | 116.9 (91.3, 149.7) | 101.5 (77.6, 132.7) | 125.5 (97.5, 161.3) | 92.7 (66.0, 129.9) | 102.5 (63.6, 165.0) | 125.5 (99.9, 157.4) | 105.7 (79.5, 140.4) | 113.4 (80.4, 159.9) | 87.2 (55.4, 137.1) | 112.3 (71.9, 175.1) | 0.75 | 0.06 | 0.39 |
| Dehydroepiandrosterone | 2.1 (1.8, 2.4) | 2.1 (1.8, 2.4) | 1.8 (1.4, 2.3) | 1.9 (1.5, 2.3) | 2.0 (1.7, 2.3) | 2.0 (1.7, 2.4) | 2.0 (1.5, 2.7) | 1.8 (1.4, 2.3) | 2.2 (1.6, 2.9) | 1.8 (1.2, 2.6) | 1.9 (1.2, 2.8) | 1.7 (1.1, 2.5) | 1.8 (1.4, 2.3) | 1.5 (1.0, 2.2) | 1.5 (0.8, 2.6) | 1.9 (1.2, 2.8) | 0.98 | <0.01 | 0.70 |
| Estrone | 16.3 (13.7, 19.4) | 18.7 (15.2, 22.9) | 23.8 (17.8, 31.6) | 28.4 (22.2, 36.2) | 14.0 (11.7, 16.8) | 18.1 (14.5, 22.5) | 16.8 (13.6, 20.8) | 24.0 (19.0, 30.3) | 20.1 (14.7, 27.4) | 15.6 10.3, 23.4) | 22.6 (17.0, 29.9) | 26.1 (15.3, 44.1) | 19.3 (13.5, 27.3) | 19.1 (12.7, 28.5) | 18.5 (10.4, 32.3) | 23.3 (11.4, 46.8) | 0.76 | <0.01 | 0.32 |
| Estradiol | 3.8 (2.7, 5.2) | 5.4 (3.8, 7.5) | 6.2 (3.8, 9.9) | 8.1 (6.0, 10.8) | 2.4 (1.9, 3.0) | 3.9 (3.0, 4.9) | 3.7 (2.9, 4.8) | 6.0 (4.6, 7.7) | 5.7 (3.1, 10.0) | 4.0 (2.6, 5.9) | 5.2 (3.9, 6.7) | 7.6 (3.5, 15.4) | 4.2 (1.9, 8.0) | 4.1 (2.5, 6.2) | 4.1 (2.5, 6.4) | 6.4 (3.3, 11.8) | 0.22 | <0.01 | 0.02 |
| SHBG | 96.5 (85.5, 109) | 62.4 (53.8, 72.4) | 48.4 (37.2, 62.8) | 35.6 (26.4, 47.9) | 98.5 (86.6, 112) | 64.4 (55.2, 75.0) | 44.6 (35.8, 55.5) | 36.7 (27.1, 49.6) | 103.6 (79.4, 135) | 60.6 (42.8, 85.6) | 54.1 (34.2, 85.3) | 65.7 (25.8, 165) | 102.5 (80.8, 130.1) | 59.9 (45.1, 79.6) | 58.1 (39.9, 84.5) | 63.7 (40.6, 99.6) | <0.01 | 0.80 | 0.14 |
P1: Body mass index; P2: Pre vs. Post; P3: RSSO vs. Controls
Table 8:
Comparison by time since menopause
| RRSO | Control | ||||||||||||||||||
|---|---|---|---|---|---|---|---|---|---|---|---|---|---|---|---|---|---|---|---|
| Pre-RRSO | Post-RRSO | Baseline | Follow-up | ||||||||||||||||
| Time since Menopause (years) | Time since Menopause (years) | Time since Menopause (years) | Time since Menopause (years) | P1 | P2 | P3 | |||||||||||||
| <2 | 2–<5 | >5<10 | >10 | <2 | 2–<5 | >5<10 | >10 | <2 | 2–<5 | >5<10 | >10 | <2 | 2–<5 | >5<10 | >10 | ||||
| N | 24 | 41 | 52 | 55 | 24 | 41 | 52 | 55 | 11 | 9 | 5 | 13 | 11 | 9 | 5 | 13 | |||
| Testosterone | 0.16 (0.13, 0.2) | 0.2 (0.17, 0.23) | 0.17 (0.14, 0.21) | 0.26 (0.18, 0.34) | 0.15 (0.07, 0.23) | 0.13 (0.11, 0.14) | 0.15 (0.11, 0.19) | 0.17 (0.13, 0.22) | 0.2 (0.14, 0.26) | 0.15 (0.1, 0.2) | 0.23 (0.13, 0.35) | 0.19 (0.13, 0.24) | 0.17 (0.15, 0.2) | 0.13 (0.08, 0.17) | 0.17 (0.09, 0.26) | 0.19 0.13, 0.24) | 0.90 | <0.01 | 0.59 |
| Androstenedione | 0.54 (0.39, 0.71) | 0.58 (0.49, 0.68) | 0.48 (0.41, 0.54) | 0.55 (0.48, 0.63) | 0.46 (0.35, 0.58) | 0.51 (0.43, 0.58) | 0.46 (0.4, 0.53) | 0.45 (0.38, 0.51) | 0.52 (0.38, 0.68) | 0.42 (0.25, 0.61) | 0.62 (0.42, 0.84) | 0.46 (0.37, 0.56) | 0.54 (0.37, 0.73) | 0.39 (0.26, 0.53) | 0.43 (0.36, 0.51) | 0.45 (0.31, 0.6) | 0.24 | <0.01 | 0.90 |
| Androstenediol | 211.7 (173.2, 258.8) | 274.9 (233.6, 323.5) | 234.1 (196.6, 278.8) | 251.1 (210.2, 300.0) | 207.5 (155.3, 277.1) | 251.1 (208.2, 302.9) | 243.7 (199.7, 297.4) | 203.4 (163.6, 252.8) | 291.9 (214.4, 397.3) | 166.3 (108.4, 254.5) | 303.9 (180.8, 510.4) | 224.9 (171.1, 295.4) | 277.7 (202.7, 380.2) | 155.0 (97.1, 247.1) | 234.1 (117.7, 464.8) | 183.9 (147.0, 230.1) | 0.19 | <0.01 | 0.59 |
| Dihydrotestosterone | 26.9 (21.3, 34) | 35.6 (29.2, 43.4) | 32.8 (27.2, 39.5) | 33.5 (29.0, 38.5) | 23.3 (16.7, 32.3) | 28.7 (23.5, 34.9) | 33.1 (26.2, 41.8) | 25.8 (22.0, 30.4) | 50.9 (41, 63.2) | 21.4 (11.6, 38.8) | 43.7 (21.2, 89.1) | 28.1 (20.7, 38) | 45.5 (35.5, 58.3) | 21.4 (12.2, 37.1) | 32.1 (12.4, 80.7) | 26.4 (20.3, 34.2) | 0.74 | 0.06 | 0.69 |
| Androsterone | 112.3 (91.4, 137.9) | 119.3 (101.6, 140.1) | 114.6 (98.5, 133.2) | 104.6 (90.3, 121.2) | 100.5 (77.3, 130.6) | 112.3 (95.6, 131.8) | 114.6 (94.6, 138.8) | 97.5 (83.7, 113.5) | 156.6 (122.0, 201.0) | 69.8 (49.4, 98.5) | 140.2 (86.2, 227.6) | 108.9 (89.4, 132.7) | 148.9 (109.2, 202.8) | 75.7 (48.8, 117.1) | 124.2 (72.4, 212.7) | 92.7 (78.2, 109.9) | 0.86 | 0.07 | 0.44 |
| Dehydroepiandrosterone | 1.9 (1.5, 2.4) | 2 (1.7, 2.4) | 1.9 (1.6, 2.2) | 2.1 (1.8, 2.4) | 1.8 (1.3, 2.4) | 2.1 (1.7, 2.5) | 2.1 (1.8, 2.6) | 1.9 (1.6, 2.2) | 2.4 (1.8, 3.2) | 1.4 (0.8, 2.2) | 2.7 (1.3, 4.8) | 1.8 (1.5, 2.2) | 2.4 (1.8, 3.1) | 1.2 (0.7, 1.9) | 1.8 (0.8, 3.2) | 1.5 (1.1, 1.8) | 0.09 | <0.01 | 0.90 |
| Estrone | 17.5 (12.3, 24.8) | 24.5 (20.1, 30) | 18.3 (14.3, 23.4) | 18.5 (15.4, 22.2) | 15.6 (9.4, 25.5) | 19.1 (16.2, 22.5) | 16.8 (13.4, 21.0) | 15.4 (13.1, 18.1) | 18.5 (13.8, 24.7) | 15.6 (8.7, 27.4) | 20.3 (14.2, 29) | 24.3 (17.8, 32.9) | 21.2 (13.6, 32.8) | 15.3 (9.6, 24.1) | 13.7 (7.0, 26.2) | 24.5 (17.6, 34.0) | 0.94 | <0.01 | 0.27 |
| Estradiol | 5.5 (2.9, 9.7) | 7.6 (4.9, 11.4) | 4.8 (3.4, 6.8) | 4.3 (3.1, 5.8) | 3.9 (2.1, 6.7) | 3.5 (2.8, 4.3) | 3.5 (2.7, 4.5) | 2.9 (2.4, 3.6) | 4.6 (2.8, 7.5) | 4.5 1.9, 9.3) | 5.6 (2.7, 10.7) | 6.5 (3.5, 11.3) | 4.5 (1.8, 9.5) | 3.4 (2.1, 5.3) | 2.6 (1.3, 4.7) | 5.9 (2.9, 11.1) | 0.70 | <0.01 | 0.02 |
| SHBG | 50.4 (37.7, 67.3) | 71.2 (58.4, 86.9) | 68.4 (57, 82) | 69.1 (57.6, 82.9) | 58.1 (43.5, 77.6) | 67.0 (55.1, 81.5) | 71.2 (58.9, 86.1) | 65.0 (53.4, 79.1) | 98.5 (66.4, 145.9) | 72.0 (48.0, 107.7) | 89.9 (51.8, 155.6) | 62.4 (43.3, 89.8) | 89.0 (73.1, 108.4) | 72.0 (49.3, 104.9) | 93.6 (57.4, 152.3) | 67.7 (47.5, 96.3) | 0.96 | 0.46 | 0.12 |
P1: Time since menopause; P2: Pre vs. Post; P3: RSSO vs. Controls
RRSO was significantly associated with a decline in estradiol levels compared with controls (p=0.02), particularly among women aged 40–49, an observation not seen with any of the other hormones. Levels of testosterone, androstenedione, androstenediol, DHEA, estrone, estradiol were significantly lower (p<0.01) between the first (pre-RRSO or baseline for controls) to second (post-RRSO or follow-up for controls) measurements (Table 5–8), reflecting declining hormone levels over time.
Discussion
Principal findings:
Our data suggest that for non-cystic ovaries, volume measured on TVUS was moderately correlated with volume measured on pathology specimens. Among postmenopausal women, no association between ovarian volume was observed for any of the androgens and estrogens examined. Time since menopause did not correlate with hormone levels, although older women tended to have lower levels of androstenedione, androstenediol, and DHEA. While estradiol declined following RRSO and in follow-up samples for controls, the decrease was significantly more substantial in RRSO participants.
Results:
Previous studies evaluating the relationships between ovarian volume and hormone levels, cancer risk, and health have relied on TVUS volume measurements. To our knowledge, no large studies have evaluated the accuracy of TVUS-measured ovarian volume compared with estimates from gross descriptions on pathology reports. Our study population offered a unique opportunity to examine the correlation between these two measurements, with findings showing a moderate correlation. Visualization of the ovaries on TVUS can be technically challenging, especially among post-menopausal women. Our protocol did not explicitly define an optimal TVUS technique. Each participating center followed its own institutional standards. The rates of ovary visualization on TVUS in large screening studies vary widely (36–39), and visualized ovaries were often not confirmed (40), even with standardized TVUS protocol and built-in quality control measures (41). Thus, TVUS might not be a reliable method tomorphologically examine the ovaries. Improved approaches to better visualize the ovaries and standardize TVUS protocols are needed.
The ovarian contribution to post-menopausal steroid sexhormone production is not fully understood, although it has been suggested that post-menopausal ovaries continue to produce androgens (largely testosterone) and, to some degree, estrogens, early in the postmenopausal period (15–21). If that is true, oophorectomy in early postmenopausal women could result in significantly decreased circulating hormone levels. Our findings showed that RRSO was associated with a significant reduction in estradiol levels compared with the changes occurring over time in controls with intact ovaries, a trend not seen in any of the other hormones measured. Thus, except for estradiol, the ovaries did not appear to be a significant source of sex hormone production in postmenopausal women. The decreases in testosterone, androstenedione, androstenediol, DHEA, and estrone between baseline and at follow-up in both RRSO and control groups were more likely due to the known age-related decline in adrenal hormone production (19).
Our study showed that ovarian volume was not associated with sex hormones. Our data also suggested that sex hormone levels were not associated with BMI or time since menopause. Existing data regarding the biological significance of ovarian volume in postmenopausal women are limited but have suggested that larger ovaries were associated with increased risks of breast and endometrial cancer, hypothesized as likely mediated through higher circulating steroid hormone levels (28–30). However, as we have demonstrated, ovarian volume estimated by TVUS might not be an accurate metric of true ovarian volume. Thus, improved approaches to estimating ovarian volumes are needed to more accurately study the relationship between ovarian volume and its impact on health.
Previous studies have inconsistently suggested that oophorectomy for benign indications was associated with increased adverse health outcomes and mortality, especially when surgery was performed before age 50 or before natural menopause, and without post-menopausal hormone therapy (22–27, 42). The lack of a significant effect of RRSO on circulating sex hormones other than estradiol in our analysis suggests that hormones other than estradiol are produced by the post-menopausal ovaries in negligible amount and unlikely to be responsible for any observed adverse long-term outcomes after RRSO
Research Implications:
Contrary to some previous studies, our findings suggest that in postmenopausal women, ovarian volume might not be an appropriate surrogate for ovarian hormone production. Whether bilateral oophorectomy in postmenopausal women leads to long-term adverse health outcomes requires larger prospective studies. However, our data, which were systematically collected from a large international collaboration, suggested that postmenopausal RRSO probably had minimal negative impact on hormone levels, and might not lead to significant long-term sequelae. This finding is of particular importance in weighing the risks and benefits of RRSO in post-menopausal women with a hereditary ovarian cancer predisposition, for whom RRSO is indicated.
Strengths and Weaknesses:
To our knowledge, this is the first study to assess whether TVUS-measured ovarian volumes are a good proxy for measurements based on pathology specimens. All participants in the RRSO cohort had TVUS at enrollment and underwent surgery within 90 days.
Our study has several limitations. First, hormone measurements were done on aliquots of banked frozen serum which had been stored for different amounts of time. Samples were processed and stored using standard procedures; however, there might be variations due to sample processing and storage. Second, ovarian volumes for ovaries with at least one missing measurement were imputed based on group average (~28% of RRSO participants). If the missing values were not random, this imputation might have introduced deviations to the observed findings. The median volume by pathology reports for those with missing TVUS was 3.3cm3 (range 0.56cm3–12.29cm3), suggesting that the ovaries were non-visualized by TVUS not simply due to very small sizes. Third, the small number of participants included in this analysis and relatively short follow-up preclude the ability to examine the effects of RRSO on long-term health outcomes. In addition, we cannot exclude the possibility that hormone production by the postmenopausal ovaries is different for women at increased risk of developing ovarian cancer from the average risk women. Thus, the findings from this study might not be generalizable to the general population.
Conclusions:
Findings from this study suggested that ovarian volume as measured by TVUS might not be highly representative of the actual volume, and that ovarian volume was not correlated with sex steroid hormone levels in postmenopausal women. Furthermore, RRSO seemed to significantly affect estradiol levels, but not the other sex steroid hormones commonly thought to be related to the risk of cardiovascular disease and other important health outcomes.
Supplementary Material
AJOG at a Glance.
A. Why was this study conducted?
It is unclear how closely ovarian volume measured by transvaginal ultrasound reflects the actual volume or whether post-menopausal ovarian volume correlates with sex hormone levels.
B. What are the key findings?
In post-menopausal women, ovarian volumes by transvaginal ultrasound were moderately correlated with volumes by pathology reports.
Risk-reducing salpingo-oophorectomy was associated with decreased estradiol but not other sex-steroid hormone levels.
Sex-steroid hormone levels were not correlated with ovarian volume, body mass index, or time since menopause.
C. What does this study add to what is already known?
Ovarian volume by transvaginal ultrasound might not reflect the actual volume
Ovarian volume was not correlated with sex-steroid hormone levels in postmenopausal women
Risk-redcuing salpingo-oophorectomy seemed to significantly affect estradiol levels, but not the other sex-steroid hormones
Financial support:
This study was supported by National Institute of Health grants to NRG Oncology (1 U10 CA180822), NRG Operations (U10CA180868), and UG1CA189867 (NCORP).
i) Date of registration: August 9, 2002
ii) Date of initial participant enrollment: June 16, 2003
ii) Clinical trial identification number:NCT00043472
iv) URL of the registration site: Clinicaltrials.gov
v) Data sharing information:
a. Will individual participant data be available (including data dictionaries)? No. GOG-0199 is a collaborative study with multiple primary, secondary, and ancillary objectives. The detail of the study and study materials have been published previously. The data are still being analyzed for other objectives.
b. What data in particular will be shared? Not available
c. What other documents will be available (e.g., study protocol, statistical analysis plan, etc.)? Not available. However, study design, study objectives, study materials, study forms and data collection instruments have been published previously (Greene, MH et al. Cancer Epidemiol Biomarkers Prev 2008;17(3):594–604)
d. When will data be available (start and end dates)? Not applicable
e. How will data be shared (including with whom, for what types of analyses, and by what mechanism)? Not applicable
Footnotes
CONFLICTS OF INTEREST
Phuong Mai, Austin Miller, Amanda Black, Roni Falk, John Boggess, Katherine Tucker, Ashley Stuckey, Gustavo Rodriguez, Cheung Wong, Thomas Amatruda, Susan C. Modesitt, S Diane Yamada, Kristen Bixel, Gretchen Glaser, Peter Rose, Mark Greene and Mark Sherman report no conflicts to report relevant to this study. Kelly Wilkinson would like to report serving as a member of GSK Speaker Bureau for Niraparib from 2019- present.
The following NRG/Gynecologic Oncology Group member institutions participated in this study: University of North Carolina at Chapel Hill, Australia & New Zealand Gynaecological Oncology Group, Women and Infants Hospital, Evanston CCOP-NorthShore University Health System, Gynecologic Oncology Network/Brody School of Medicine, Fletcher Allen Health Care, Metro-Minnesota CCOP, University of Mississippi Medical Center, University of Virginia, University of Chicago, Ohio State University Comprehensive Cancer Center, Mayo Clinic, Case Western Reserve University, Walter Reed National Military Medical Center, University of California at Los Angeles Health System, Memorial Sloan-Kettering Cancer Center, Moffitt Cancer Center and Research Institute, Yale University, Washington University School of Medicine, University of Oklahoma Health Sciences Center, Delaware/Christiana Care CCOP, University of California Medical Center at Irvine – Orange Campus, MD Anderson Cancer Center, Wisconsin NCI Community Oncology Research Program, University of Minnesota Medical Center – Fairview, Tufts-New England Medical Center, University of New Mexico, Fox Chase Cancer Center, University of Massachusetts Memorial Health Care, Tacoma General Hospital, The Hospital of Central Connecticut, Carle Cancer Center, Cancer Research Consortium of West Michigan NCORP, Virginia Commonwealth University, Roswell Park Comprehensive Cancer Center, Duke University Medical Center, Wayne State University/Karmanos Cancer Institute, University of Colorado Cancer Center – Anschutz Cancer Pavilion, University of Cincinnati, University of Iowa Hospitals and Clinics, University of Texas Southwestern Medical Center, Indiana University Hospital/Melvin and Bren Simon Cancer Center, Rush University Medical Center, Cleveland Clinic Foundation, Ellis Fischer Cancer Center, Mark O Hatfield – Warren Grant Magnuson Clinical Center, Scott and White Memorial Hospital, Missouri Cancer Consortium CCOP, Northern Indiana Cancer Research Consortium, and Upstate Carolina CCOP.
Publisher's Disclaimer: This is a PDF file of an unedited manuscript that has been accepted for publication. As a service to our customers we are providing this early version of the manuscript. The manuscript will undergo copyediting, typesetting, and review of the resulting proof before it is published in its final form. Please note that during the production process errors may be discovered which could affect the content, and all legal disclaimers that apply to the journal pertain.
References
- 1.Antoniou AC, Pharoah PDP, Narod S, Risch HA, Eyfjord JE, Hopper JL, et al. Average risks of breast and ovarian cancer associated with BRCA1 or BRCA2 mutations detected in case series unselected for family history: a combined analysis of 22 studies. Am J Hum Genet. 2003;72(5):1117–30. [DOI] [PMC free article] [PubMed] [Google Scholar]
- 2.Kuchenbaecker KB, Hopper JL, Barnes DR, Phillips KA, Mooij TM, Roos-Blom MJ, et al. Risks of breast, ovarian, and contralateral breast cancer for BRCA1 and BRCA2 mutation carriers. JAMA. 2017;317(23):2402–16. [DOI] [PubMed] [Google Scholar]
- 3.Jasperson KW, Tuohy TM, Neklason DW, Burt RW. Hereditary and familial colon cancer. Gastroenterology. 2010;138(6):2044–58. [DOI] [PMC free article] [PubMed] [Google Scholar]
- 4.Moller P, Seppala TT, Bernstein I, Holinski-Feder E, Sala P, Gareth Evans D, et al. Cancer risk and survival in path_MMR carriers by gene and gender up to 75 years of age: a report from the Prospective Lynch Syndrome Database. Gut. 2017. [DOI] [PMC free article] [PubMed] [Google Scholar]
- 5.Toss A, Tomasello C, Razzaboni E, Contu G, Grandi G, Cagnacci A, et al. Hereditary ovarian cancer: not only BRCA 1 and 2 genes. BioMed Res Int. 2015;2015:341723. [DOI] [PMC free article] [PubMed] [Google Scholar]
- 6.Eoh KJ, Kim JE, Park HS, Lee S-T, Park JS, Han JW, et al. Detection of Germline Mutations in Patients with Epithelial Ovarian Cancer Using Multi-gene Panels: Beyond BRCA1/2. J Korean Cancer Assoc. 2017;0(0):0-. [DOI] [PMC free article] [PubMed] [Google Scholar]
- 7.Harter P, Hauke J, Heitz F, Reuss A, Kommoss S, Marme F, et al. Prevalence of deleterious germline variants in risk genes including BRCA1/2 in consecutive ovarian cancer patients (AGO-TR-1). PLoS One. 2017;12(10):e0186043. [DOI] [PMC free article] [PubMed] [Google Scholar]
- 8.Walsh T, Casadei S, Lee MK, Pennil CC, Nord AS, Thornton AM, et al. Mutations in 12 genes for inherited ovarian, fallopian tube, and peritoneal carcinoma identified by massively parallel sequencing. Proceedings of the National Academy of Sciences. 2011;108(44):18032–7. [DOI] [PMC free article] [PubMed] [Google Scholar]
- 9.Domchek SM, Friebel TM, Singer CF, Evans DG, Lynch HT, Isaacs C, et al. Association of risk-reducing surgery in BRCA1 or BRCA2 mutation carriers with cancer risk and mortality. JAMA. 2010;304(9):967–75. [DOI] [PMC free article] [PubMed] [Google Scholar]
- 10.Rebbeck TR, Kauff ND, Domchek SM. Meta-analysis of risk reduction estimates associated with risk-reducing salpingo-oophorectomy in BRCA1 or BRCA2 mutation carriers. J Natl Cancer Inst. 2009;101(2):80–7. [DOI] [PMC free article] [PubMed] [Google Scholar]
- 11.Finch AP, Lubinski J, Moller P, Singer CF, Karlan B, Senter L, et al. Impact of oophorectomy on cancer incidence and mortality in women with a BRCA1 or BRCA2 mutation. J Clin Oncol. 2014;32(15):1547–53. [DOI] [PMC free article] [PubMed] [Google Scholar]
- 12.Kauff ND, Satagopan JM, Robson ME, Scheuer L, Hensley M, Hudis CA, et al. Risk-reducing salpingo-oophorectomy in women with a BRCA1 or BRCA2 mutation. N Engl J Med. 2002;346(21):1609–15. [DOI] [PubMed] [Google Scholar]
- 13.Mavaddat N, Peock S, Frost D, Ellis S, Platte R, Fineberg E, et al. Cancer risks for BRCA1 and BRCA2 mutation carriers: Results from prospective analysis of EMBRACE. J Natl Cancer Inst. 2013;105(11):812–22. [DOI] [PubMed] [Google Scholar]
- 14.Schiffer L, Arlt W, Storbeck KH. Intracrine androgen biosynthesis, metabolism and action revisited. Mol Cell Endocrinol. 2018;465:4–26. [DOI] [PMC free article] [PubMed] [Google Scholar]
- 15.Key TJ, Appleby PN, Reeves GK, Roddam AW, Helzlsouer KJ, Alberg AJ, et al. Circulating sex hormones and breast cancer risk factors in postmenopausal women: reanalysis of 13 studies. British Journal of Cancer. 2011;105(5):709–22. [DOI] [PMC free article] [PubMed] [Google Scholar]
- 16.Laughlin GA, Barrett-Connor E, Kritz-Silverstein D, von Muhlen D. Hysterectomy, oophorectomy, and endogenous sex hormone levels in older women: the Rancho Bernardo Study. J Clin Endocrinol Metab. 2000;85(2):645–51. [DOI] [PubMed] [Google Scholar]
- 17.Chubak J, Tworoger SS, Yasui Y, Ulrich CM, Stanczyk FZ, McTiernan A. Associations between reproductive and menstrual factors and postmenopausal androgen concentrations. J Womens Health (Larchmt). 2005;14(8):704–12. [DOI] [PubMed] [Google Scholar]
- 18.Stanczyk FZ, Chaikittisilpa S, Sriprasert I, Rafatnia A, Nadadur M, Mishell DR. Circulating androgen levels before and after oophorectomy in premenopausal and postmenopausal women. Climacteric. 2019;22(2):169–74. [DOI] [PubMed] [Google Scholar]
- 19.Fogle R, Stanczyk F, Zhang X, Paulson R. Ovarian androgen production in postmenopausal women. J Clin Endocrinol Metab. 2007;92:3040–3. [DOI] [PubMed] [Google Scholar]
- 20.Davison S, Bell R, Donath S, Montalto J, Davis S. Androgen levels in adult females: changes with age, menopause, and oophorectomy. J Clin Endocrinol Metab. 2005;90:3847–53. [DOI] [PubMed] [Google Scholar]
- 21.Couzinet B, Meduri G, Lecce MG, Young J, Brailly S, Loosfelt H, et al. The postmenopausal ovary is not a major androgen-producing gland. J Clin Endocrinol Metab. 2001;86(10):5060–6. [DOI] [PubMed] [Google Scholar]
- 22.Parker WH, Broder MS, Liu Z, Shoupe D, Farquhar C, Berek JS. Ovarian conservation at the time of hysterectomy for benign disease. Obstet Gynecol. 2005;106(2):219–26. [DOI] [PubMed] [Google Scholar]
- 23.Parker WH, Feskanich D, Broder MS, Chang E, Shoupe D, Farquhar CM, et al. Long-term mortality associated with oophorectomy compared with ovarian conservation in the Nurses’ Health Study. Obstet Gynecol. 2013;121(4):709–16. [DOI] [PMC free article] [PubMed] [Google Scholar]
- 24.Hickey M, Ambekar M, Hammond I. Should the ovaries be removed or retained at the time of hysterectomy for benign disease? Hum Reprod Update. 2010;16(2):131–41. [DOI] [PubMed] [Google Scholar]
- 25.Michelsen TM, Pripp AH, Tonstad S, Trope CG, Dorum A. Metabolic syndrome after risk-reducing salpingo-oophorectomy in women at high risk for hereditary breast ovarian cancer: a controlled observational study. Eur J Cancer. 2009;45(1):82–9. [DOI] [PubMed] [Google Scholar]
- 26.Kurita K, Henderson VW, Gatz M, St. John J, Hodis HN, Karim R, et al. Association of bilateral oophorectomy with cognitive function in healthy, postmenopausal women. Fertil Steril. 2016;106(3):749–56.e2. [DOI] [PMC free article] [PubMed] [Google Scholar]
- 27.Gierach GL, Pfeiffer RM, Patel DA, Black A, Schairer C, Gill A, et al. Long-term overall and disease-specific mortality associated with benign gynecologic surgery performed at different ages. Menopause. 2014;21(6):592–601. [DOI] [PMC free article] [PubMed] [Google Scholar]
- 28.Sherman ME, Lacey JV, Buys SS, Reding DJ, Berg CD, Williams C, et al. Ovarian volume: determinants and associations with cancer among postmenopausal women. Cancer Epidemiol Biomarkers Prev. 2006;15(8):1550–4. [DOI] [PubMed] [Google Scholar]
- 29.Elfayomy AK, El Tarhouny SA. Ovarian volume assessment in relation to histologic findings and sex hormone levels in women with postmenopausal bleeding and thickened endometrium. Ann Saudi Med. 2012;32(6):588–92. [DOI] [PMC free article] [PubMed] [Google Scholar]
- 30.Sherman ME, Madigan MP, Lacey JV Jr., Garcia-Closas M, Potischman N, Carreon JD, et al. Ovarian volumes among women with endometrial carcinoma: associations with risk factors and serum hormones. Gynecol Oncol. 2007;107(3):431–5. [DOI] [PMC free article] [PubMed] [Google Scholar]
- 31.Armeni E, Tsitoura A, Aravantinos L, Vakas P, Augoulea A, Rizos D, et al. Ovarian volume is associated with adiposity measures and bone mineral density in postmenopausal women. J Musculoskelet Neuronal Interact. 2018;18(4):501–8. [PMC free article] [PubMed] [Google Scholar]
- 32.Greene MH, Piedmonte M, Alberts D, Gail M, Hensley M, Miner Z, et al. A prospective study of risk-reducing salpingo-oophorectomy and longitudinal CA-125 screening among women at increased genetic risk of ovarian cancer: design and baseline characteristics: a Gynecologic Oncology Group study. Cancer Epidemiol Biomarkers Prev. 2008;17(3):594–604. [DOI] [PMC free article] [PubMed] [Google Scholar]
- 33.Sherman ME, Piedmonte M, Mai PL, Ioffe OB, Ronnett BM, Van Le L, et al. Pathologic findings at risk-reducing salpingo-oophorectomy: primary results from Gynecologic Oncology Group Trial GOG-0199. J Clin Oncol. 2014;32(29):3275–83. [DOI] [PMC free article] [PubMed] [Google Scholar]
- 34.Skates SJ. Ovarian cancer screening: development of the risk of ovarian cancer algorithm (ROCA) and ROCA screening trials. Int J Gynecol Cancer. 2012;22 Suppl 1:S24–6. [DOI] [PMC free article] [PubMed] [Google Scholar]
- 35.Skates SJ, Greene MH, Buys SS, Mai PL, Brown P, Piedmonte M, et al. Early detection of ovarian cancer using the Risk of Ovarian Cancer Algorithm with frequent CA125 testing in women at increased familial risk - Combined results from two screening trials. Clin Cancer Res. 2017;23(14):3628–37. [DOI] [PMC free article] [PubMed] [Google Scholar]
- 36.van Nagell JR Jr., Miller RW, DeSimone CP, Ueland FR, Podzielinski I, Goodrich ST, et al. Long-term survival of women with epithelial ovarian cancer detected by ultrasonographic screening. Obstet Gynecol. 2011;118(6):1212–21. [DOI] [PubMed] [Google Scholar]
- 37.Sharma A, Burnell M, Gentry-Maharaj A, Campbell S, Amso NN, Seif MW, et al. Quality assurance and its impact on ovarian visualization rates in the multicenter United Kingdom Collaborative Trial of Ovarian Cancer Screening (UKCTOCS). Ultrasound Obstet Gynecol. 2016;47(2):228–35. [DOI] [PMC free article] [PubMed] [Google Scholar]
- 38.Sharma A, Burnell M, Gentry-Maharaj A, Campbell S, Amso NN, Seif MW, et al. Factors affecting visualization of postmenopausal ovaries: descriptive study from the multicenter United Kingdom Collaborative Trial of Ovarian Cancer Screening (UKCTOCS). Ultrasound Obstet Gynecol. 2013;42(4):472–7. [DOI] [PubMed] [Google Scholar]
- 39.Bodelon C, Pfeiffer RM, Buys SS, Black A, Sherman ME. Analysis of serial ovarian volume measurements and incidence of ovarian cancer: implications for pathogenesis. J Natl Cancer Inst. 2014;106(10). [DOI] [PMC free article] [PubMed] [Google Scholar]
- 40.Stott W, Campbell S, Franchini A, Blyuss O, Zaikin A, Ryan A, et al. Sonographers’ self-reported visualization of normal postmenopausal ovaries on transvaginal ultrasound is not reliable: results of expert review of archived images from UKCTOCS. Ultrasound Obstet Gynecol. 2018;51(3):401–8. [DOI] [PMC free article] [PubMed] [Google Scholar]
- 41.Sharma A, Burnell M, Gentry-Maharaj A, Campbell S, Amso NN, Seif MW, et al. Quality assurance and its impact on ovarian visualization rates in the multicenter United Kingdom Collaborative Trial of Ovarian Cancer Screening (UKCTOCS). Ultrasound Obstet Gynecol. 2016;47(2):228–35. [DOI] [PMC free article] [PubMed] [Google Scholar]
- 42.Duan L, Xu X, Koebnick C, Lacey JV Jr., Sullivan-Halley J, Templeman C, et al. Bilateral oophorectomy is not associated with increased mortality: the California Teachers Study. Fertil Steril. 2012;97(1):111–7. [DOI] [PMC free article] [PubMed] [Google Scholar]
Associated Data
This section collects any data citations, data availability statements, or supplementary materials included in this article.