

Summary
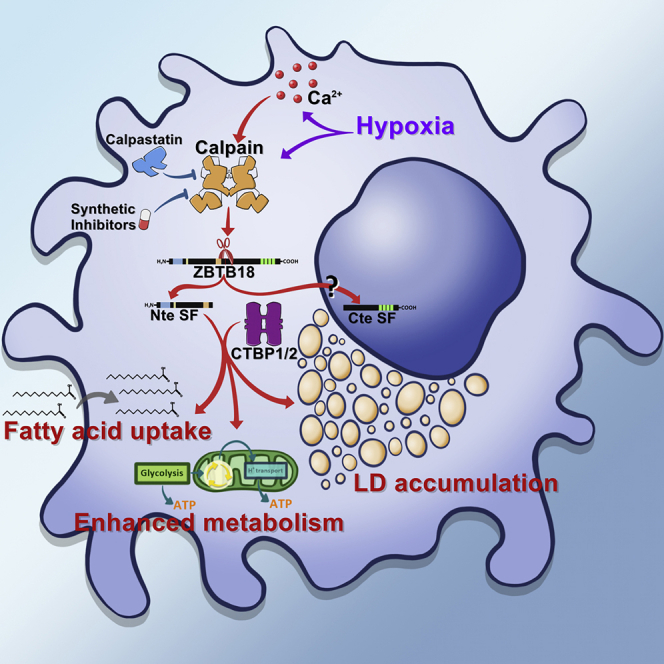
Proteolytic cleavage is an important post-translational mechanism to increase protein variability and functionality. In cancer, this process can be deregulated to shut off tumor-suppressive functions. Here, we report that in glioblastoma (GBM), the tumor suppressor ZBTB18 is targeted for protein cleavage by the intracellular protease calpain. The N-terminal (Nte) ZBTB18 cleaved fragment localizes to the cytoplasm and thus, is unable to exert the gene expression repressive function of the uncleaved protein. Mass spectrometry (MS) analysis indicates that the Nte ZBTB18 short form (SF) interacts with C-terminal (Cte) binding proteins 1 and 2 (CTBP1/2), which appear to be involved in HIF1A signaling activation. In fact, we show that the new ZBTB18 product activates HIF1A-regulated genes, which in turn lead to increased lipid uptake, lipid droplets (LD) accumulation, and enhanced metabolic activity. We propose that calpain-mediated ZBTB18 cleavage represents a new mechanism to counteract ZBTB18 tumor suppression and increase tumor-promoting functions in GBM cells.
Subject areas: Biochemistry, Molecular biology, Cancer, Transcriptomics
Graphical abstract
Highlights
-
•
Calpain mediates ZBTB18 cleavage in GBM cells
-
•
ZBTB18 SF-Nte localizes in the cytoplasm and interacts with CTBP1/2
-
•
ZBTB18 SF-Nte regulates the expression of HIF targets
-
•
ZBTB18 SF-Nte regulates lipid uptake
Biochemistry; Molecular biology; Cancer; Transcriptomics
Introduction
Glioblastoma (GBM) is the most aggressive type of brain tumor with a median survival time of 12–15 months. Former studies have highlighted the existence of gene expression subtypes associated with different patient prognoses (Phillips et al., 2006; Wang et al., 2017). In particular, the mesenchymal subtype appears to be associated with the most aggressive features and the worst tumor outcome (Phillips et al., 2006; Wang et al., 2017). Previously others and we have identified Zinc Finger And BTB Domain Containing 18 protein (ZBTB18) as a transcriptional repressor of mesenchymal genes and showed that ZBTB18 plays a tumor-suppressive role in GBM (Carro et al., 2010; Fedele et al., 2017; Tatard et al., 2010; Xiang et al., 2021).
Proteolytic cleavage plays an important role in many biological processes. In addition to protein degradation, which regulates protein turnover, the targeted cleavage of key protein substrates has proven to be crucial for many biological functions. This activity produces cleaved N- or C-terminal protein products which are often stable and functional (Klein et al., 2018). Calpains are intracellular Ca2+-dependent cysteine proteases that cleave specific substrates giving rise to new proteolytic products (Ono and Sorimachi, 2012; Storr et al., 2011). In particular, CAPN1 and CAPN2 are ubiquitous calpains that are activated by μM or mM Ca2+ concentration, respectively; their activity is tightly controlled by a natural common inhibitor, calpastatin (CAST), which binds only in the presence of calcium (Wendt et al., 2004).
Hypoxia plays an important role in tumorigenesis as it regulates several features that are considered hallmarks of human cancer, such as angiogenesis and metabolic reprogramming (Hanahan and Weinberg, 2011; Ruan et al., 2009). Hypoxia-inducible factor-1α (HIF1A) is stabilized in the hypoxic environment and leads to the activation of glycolytic enzymes and glucose transporters (Lum et al., 2007). In addition, it has been demonstrated that hypoxia induces a HIF1A-dependent accumulation of lipid droplets (LD) through the induction of fatty acid-binding protein 3 and 7 (FABP3 and FABP7), involved in the uptake of fatty acids from the extracellular environment (Bensaad et al., 2014). LD are storage organelles made by a layer of phospholipids coated with proteins that surround a hydrophobic core of neutral lipids. In GBM, LD play a crucial role in supporting cancer cell metabolism. LD are hydrolyzed by autophagy to release free fatty acids that undergo β-oxidation in the mitochondria for energy production (Wu et al., 2020). Interestingly, FABP7 is highly expressed in the brain and is implicated in the transport and uptake of long-chain fatty acids (Xu et al., 1996); moreover, it is associated with the worst properties of GBM and with poor patients’ outcome (Kaloshi et al., 2007).
Recently, we have identified a short ZBTB18 protein product (around 30-35kDa) that is specifically expressed in GBM cell lines but not in normal cortical tissues (Fedele et al., 2017). Here, we report that ZBTB18 short forms (SF-Nte and SF-Cte) are the products of ZBTB18 proteolytic cleavage mediated by the intracellular protease family of calpains; in particular calpain 2 (CAPN2) expression appears to correlate with the presence of ZBTB18 cleaved form in GBM cells. We provide evidence that ZBTB18 SF-Nte positively affects HIF1A target gene expression and consequent fatty acids uptake and LD accumulation in the cytoplasm.
Results
N- terminal or C-terminal truncated forms of ZBTB18 are expressed in glioblastoma samples and glioblastoma-derived cell lines
While studying ZBTB18 function in GBM we previously reported that, on FLAG-ZBTB18 overexpression, a truncated Nte form of ZBTB18 is consistently detected by Western blot using an FLAG antibody directed to the Nte portion of the ectopic protein (Fedele et al., 2017) (Figure 1A). Western blot analysis of GBM and GBM-derived primary cells (brain tumor stem-like cells, BTSC, Table 1 and Table S1), using an antibody directed against ZBTB18 amino acid sequence between position 228 and 498 (Abcam ZBTB18 total antibody, Figure 1B), also evidenced the presence of an endogenous shorter ZBTB18 product (30-35kDa), which is specifically expressed in a subset of GBMs and in BTSCs but not in normal cortical tissues (normal brain, NB) (Fedele et al., 2017) (Figures 1C–1E and S1A–S1C). Of note, ZBTB18 SF expression pattern in GBM biopsies BT611, BT349, and BT348 matched with that of the corresponding derived BTSCs (Figure 1E). As the ZBTB18 total antibody (Abcam) used in our analysis recognizes a portion of the target protein that overlaps with both the putative Nte and C-terminal (Cte) fragments, we sought to clarify whether two distinct truncated ZBTB18 forms existed. Therefore, we performed immunoprecipitation experiments in U3082, which express ZBTB18 SF (Figures 1C and Table 1), by using two different ZBTB18 antibodies: (1) a ZBTB18 polyclonal antibody directed to the Cte region (Proteintech) and 2) the ZBTB18 total antibody (Abcam) (Figures 1B and 1F). The gel regions, in which ZBTB18 full length (FL, above 40 kDa) and ZBTB18 short form (SF, below 40 kDa) were expected to be found, underwent mass spectrometry (MS) (Figure 1F). Peptide mass analysis indicated that, when the antibody directed to the Cte region was used, only peptides corresponding to the Cte region of ZBTB18 were detected in the gel region below 40 kDa (Figure 1F). This suggests that a ZBTB18 Cte short peptide is expressed in U3082. Both cleaved forms were instead present with a 1:1 ratio when the antibody directed to both the Nte and Cte regions was used. Therefore, both ZBTB18 Nte and Cte short forms (SF) (from now on ZBTB18 SF-Nte and -Cte) are present in U3082. As the two protein products are supposed to be similar in size (30kDa), it is possible that they are not resolved in the gel and are, therefore, detected as a single band by Western blot when using an antibody that recognizes both forms. Overall, these experiments confirm the presence of the ZBTB18 SF in GBM biopsies and GBM-derived cells.
Figure 1.

Short ZBTB18 protein products are expressed in GBM
(A) Western blot analysis of BTSC233 on ectopic expression of ZBTB18 FL, using a FLAG antibody (mouse, Sigma) directed to the N-terminal region of the ectopic protein. Both a full length (FL, double band) and an N-terminal truncated protein (short form, SF) are detected.
(B) Schematic representation of ZBTB18 protein structure, including the putative short form variants and the regions detected by the different antibodies used for the experiments.
(C) Western blot analysis of different GBM-derived primary cell lines (BTSCs) and one normal cortical tissue sample (NB), using a ZBTB18 total antibody (Abcam). The analysis shows the presence of ZBTB18 SF in a subset of cells (marked in orange). BTSCs with no or low ZBTB18 SF are labeled in blue.
(D and E) Western blot analysis of different GBM samples (brain tumor, BTs), using a ZBTB18 total antibody (Abcam) showing the presence of ZBTB18 SF in a subset of those. BT385R1 indicates a recurrent tumor. In Figure 1D, the ZBTB18 SF-expressing cell line BTSC349 (Figure 1C) is included as a positive control.
(F) Experimental flow chart of the IP-MS analysis. Different antibodies were used to immune-precipitate ZBTB18 and to highlight the presence of both an N-terminal and C-terminal short form variants in U3082.
(G) Summarized results of peptide mapping of MS data. R1 and R2 refer to two independent experiments where 5 μg or 10 μg of ZBTB18 antibody were used, respectively. See also Figure S1, Table 1 and S1.
Table .1.
Summary of ZBTB18 SF and FL expression status in GBM cell lines, BTSCs and biopsies used for major analyses in the article

The orange label highlights cells and tumor samples with ZBTB18 SF, while the blue color labels those without ZBTB18 SF.
ZBTB18 short forms are generated by CAPN-mediated proteolytic cleavage
As ZBTB18 coding sequence is enclosed in a single exon, we hypothesized that the identified SF might be the result of proteolytic cleavage. Therefore, we treated the ZBTB18-short-form expressing primary GBM cell line, U3082, with various protease inhibitors (Figure S2A). Specifically, we tested E64D, a cysteine peptidases inhibitor, QVDOPH, a potent pan-caspase inhibitor, and leupeptin, which inhibits serine and cysteine proteases. However, none of these inhibitors clearly affected ZBTB18 cleavage (Figure S2A).
As a parallel approach, we performed a significance analysis for microarray (SAM) to detect differences in proteases expression in a set of 8 BTSCs samples (3 expressing ZBTB18 SF and 5 expressing only the full-length form), which revealed that CAPN2 is significantly more expressed in the short-form (SF) group (Figures 2A and 2B and Table 1). CAPN1, another ubiquitous member of the calpain family, did not appear to be differentially expressed (Figure S2B). qPCR confirmed this difference and showed that CAPN2 RNA levels are higher in BTSCs expressing ZBTB18 SF (Figures 2C and Table 1). In addition, Western blot analysis correlated CAPN2 expression with BTSC cell lines expressing ZBTB18 SF (Figures 2D and 2E). Calpains are intracellular proteases, which lead to substrate degradation or modulation and that are implicated in cellular phenomena associated with tumor progression (Moretti et al., 2014). To test the potential involvement of calpain in ZBTB18 cleavage, U3082 cells, which express ZBTB18 SF, were exposed to different concentrations of the calpain inhibitor PD150606 (10 and 100 μM), or to vehicle, for 16 h (Figure 2F). Remarkably, the treatment completely abolished the expression of ZBTB18 short peptides (Figure 2F). The result was corroborated in a time-course experiment, which showed that the PD150606 effect could be already detected after 1 h (Figure 2G). To further verify the possible involvement of CAPN2 in ZBTB18 proteolytic cleavage, we knocked down CAPN2 in U3082 with two different shRNAs; the observed ZBTB18 SF downregulation in association with the altered cell morphology (Figures 2H, S2C, and S2D), further reinforced the notion that CAPN2 mediates ZBTB18 cleavage and induces physiological changes in the tumor cells.
Figure 2.

ZBTB18 is cleaved by calpain
(A) List of protease coding genes, which are differentially expressed between BTSCs with or without ZBTB18 SF. CAPN2 appears to be significantly more expressed in BTSCs with ZBTB18 SF.
(B and C) Box-plot representation of CAPN2 expression extrapolated from RNAseq analysis (B) and from quantitative RT-PCR (C) of BTSC lines with or without ZBTB18 SF. Center lines show the medians; box limits indicate the 25th and 75th percentiles as determined by R software; whiskers extend 1.5 times the interquartile range from the 25th and 75th percentiles, outliers are represented by dots; crosses represent sample means; width of the boxes is proportional to the square root of the sample size. n = 3, five sample points (B) and n = 4, five sample points (C).
(D and E) Western blot analysis (D) and relative quantification (E) of CAPN2 and ZBTB18 levels in LN229 GBM cells and different BTSCs characterized by the presence (marked in orange) or absence (mrked in blue) of ZBTB18 SF. Both ZBTB18 FL and SF were detected with a ZBTB18 total antibody (Abcam).
(F) Western blot analysis of ZBTB18 expression, using a ZBTB18 total antibody (Abcam) in U3082 cells treated with or without different concentrations of calpain inhibitor (PD150606) for 16 h.
(G) Western blot analysis of ZBTB18 expression, detected with a ZBTB18 total antibody (Abcam), in U3082 cells treated with the calpain inhibitor (PD150606, 100μM) in a time-course experiment.
(H) Western blot analysis of CAPN2 and ZBTB18 expression (FL and SF) in U3082 cells on CAPN2 knockdown with two independent shRNAs. ZBTB18 was detected with a ZBTB18 total antibody (Abcam).
(I and J) Anti-FLAG (mouse, Sigma) Western blot analysis (I) and relative quantification (J) of ZBTB18 FL and SF expression in SNB19 cells transduced with ZBTB18 FL, on treatment with cycloheximide (100 μg/mL) for several time points. The level of individual ZBTB18 high and low bands was quantified using the ImageJ software (Bio-Rad) and normalized to αTubulin.
(K and L) Western blot analysis using anti-FLAG antibody (mouse, Sigma) (K) and relative quantification (L) of ZBTB18 FL and SF expression in SNB19 cells transduced with empty vector (EV) or with ZBTB18 FL, and exposed to MG132 (5 μM) or DMSO, for the indicated time points. The quantification of Western blot bands was performed using the ImageJ software (Biorad) and normalized to αTubulin. Either individual ZBTB18 FL and SF (left panel) or total ZBTB18 levels (right panel) were plotted. The asterisks indicate unspecific bands. See also Figure S2.
The experiments presented so far clearly indicate that inhibiting or knocking down calpain reduces ZBTB18 cleavage. However, a corresponding increase in ZBTB18 FL level could not be detected. This suggests that ZBTB18 might be degraded, providing an additional mechanism to turn off its tumor-suppressive function. In line with this idea, we sought to analyze ZBTB18 FL stability in a cycloheximide experiment. SNB19 cells were transduced with either EV or ZBTB18 FL for 72 h and further treated with cycloheximide for several time points (Figures 2I and 2J). Ectopic ZBTB18 FL (lower band) expressed in SNB19 cells appeared to have a shorter half-life compared to ZBTB18 SF (Figures 2I and 2J). We observed that the ZBTB18 FL top band, which is likely a modified form of ZBTB18, appeared to be more stable, suggesting the existence of additional mechanisms to regulate ZBTB18 half-life. Treatment of SNB19 cells, which have been transduced with EV or ZBTB18 FL (72 h), with the proteasome inhibitor MG132 for 8 or 24 h, strongly increased the level of ZBTB18 SF, while ZBTB18 FL level remained more stable (Figures 2K and 2L). These data suggest that ZBTB18 FL, which is no longer degraded by the proteasome, would be rapidly cleaved and fail to accumulate (Figure 2K). Therefore, both ZBTB18 cleavage and degradation by the proteasome seem to be complementary mechanisms to reduce the level of ZBTB18 in tumor cells.
As calpains are known to be activated by calcium, we sought to treat U3047 cells, which do not express ZBTB18 SF, with Ca2+-Ionophore A23187 (Ca-I), a highly selective calcium ionophore, which forms a stable complex with Ca2+ and passes through the cell membrane increasing intracellular Ca2+ levels (Babcock et al., 1976). Ca-I has been shown to consequently induce calpain activity (Kim et al., 2002). The cells were incubated with Ca-I, alone or in combination with the calpain inhibitor PD150606. Interestingly, exposure to Ca-I led to re-expression of the SF, which was counteracted by the addition of the calpain inhibitor (Figure 3A). Calpains are known to be inhibited by the endogenous inhibitor CAST (Hanna et al., 2008); while hypoxia has been shown to increase the intracellular concentration of Ca2+ and to induce calpain (Toescu, 2004; Zheng et al., 2014). Therefore, we transduced BTSC233 cells, which lack ZBTB18 SF, with shCtr or shCAST and further exposed them to Ca-I or CoCl2, which chemically mimics hypoxia (Piret et al., 2002). Remarkably, CAST knockdown in combination with CoCl2 treatment led to a strong upregulation of CAPN2 and ZBTB18 SF (Figures 3B and 3C). In these cells, Ca-I treatment produced a more modest effect, which became evident when used in combination with shCAST. This suggests that CAPN2 regulation involves several mechanisms and at least some of them could be cell dependent. Consistent with this hypothesis, we observed that the expression of CAST strongly varies among BTSCs and is particularly expressed in BTSC233 while is not detected in U3047 (Figure S3A). Thus, in cells where it is present, CAST might counteract the calcium-induced calpain activation. Moreover, as CAST interaction with calpain also requires calcium (Hanna et al., 2008); it is possible that in presence of CAST, the wave of increased intracellular calcium is rerouted toward calpain inhibition rather than toward its activation, as we observed in BTSC233.
Figure 3.

ZBTB18 cleavage is induced on calcium or calpastatin inactivation
(A) Western blot analysis of U3047 cells treated with the calpain inhibitor (PD150606, 100 μM for 24 h) and/or Ca2+-Ionophore (Ca-I, 10 mM for 5 min). ZBTB18 was detected a ZBTB18 total antibody (Abcam).
(B and C) Western blot analysis (B) and relative quantification (C) of BTSC233 cells on CAST knockdown and consequent treatment with either Ca-I (10 mM for 5 min) or Cobalt Chloride (CoCl2, 200 μM for 48h). ZBTB18 was detected a ZBTB18 total antibody (Abcam).
(D) Microphotographs of BTSCs with high or low ZBTB18 SF levels, expressing a GFP reporter of Ca2+ (scale = 200μm). The GFP signal is stronger in BTSC348, BTSC349, and BTSC380, which express high levels of ZBTB18 SF (Figure 1C and Table 1). See also Figure S3.
Our data and previous knowledge on calpain suggest that intracellular levels of calcium are important for its function. Therefore, we transduced various BTSC cell lines with a calcium reporter lentiviral vector that expresses GFP in response to a rise in intracellular levels of calcium. Abundant GFP was detected in cell lines expressing ZBTB18 SF (Figures 3D and S3B) further indicating that Ca2+-dependent calpain activity is important for ZBTB18 cleavage.
A PEST sequence is required for ZBTB18 cleavage by calpain
We then examined in ZBTB18 protein sequence for putative calpain cleavage sites by Calpain for Modulatory Proteolysis Database (CaMPDB) (duVerle et al., 2010; duVerle and Mamitsuka, 2019) and detected a series of potential sites (Figure S4A). A cluster of sites was located close to the amino acid 268 (Asn/N followed by Leu/L and Val/V), which corresponds to the end of the last peptide identified by our previous MS analysis (Fedele et al., 2017). In addition, the predicted molecular weight of this peptide is consistent with the size of the ZBTB18 SF (∼30kDa). Therefore, we sought to determine whether ZBTB18 SF could be blocked by altering the predicted calpain cleavage site. At first, site-directed mutagenesis was used to introduce the desired mutations (N268F, L269W, V270W) to the predicted site based on FLAG/HA-tagged wild-type ZBTB18 template (Figure 4A). Then, we overexpressed either the mutant or the wild-type form of ZBTB18 in SNB19 cells and analyzed ZBTB18 ectopic expression by Western blot (Figures 4B and 4C). The ratio between ZBTB18 SF/FL decreased, although the cleavage was not completely suppressed, suggesting that, on the mutation, the calpain cleavage could shift to other progressively less likely sites, as previously proposed (Conacci-Sorrell et al., 2010). Interestingly, the level of ZBTB18 FL top band increased, which advises that the suppression of the calpain cleavage site might favor a ZBTB18 post-translational modification (i.e., phosphorylation), which seems to be associated with increased protein stability. Protein sequence analysis using the EMBOSS program ePESTfind tool (http://emboss.bioinformatics.nl/cgi-bin/emboss/epestfind) revealed the presence of two PEST sequences (Figures 4A and S4B). PEST regions have been shown to be important for protein stability and calpain cleavage (Conacci-Sorrell et al., 2010; Shumway et al., 1999; Wang et al., 2003); therefore, we attempted to delete the PEST sequence located upstream of the putative cleavage site (PEST1) which had the higher score (15.06) (Figures 4A and S4B). We observed that PEST1 deletion (ΔPEST1), alone or in combination with NLV mutation, strongly affected the ratio of ZBTB18 SF/FL (Figures 4D and 4E). The concomitant mutation of the putative NLV cleavage site (ZBTB18 ΔPEST1-NLV) did not lead to an additional reduction, suggesting that the PEST1 sequence plays a major role in calpain-mediated ZBTB18 cleavage. We also monitored ZBTB18 FL and ZBTB18 FL ΔPEST stability on cycloheximide treatment. The results further suggest that the PEST sequence in ZBTB18 is mostly required for calpain-mediated cleavage and not for ZBTB18 degradation. In fact, the protein half-life is not affected by the removal of the PEST sequence, which mostly impacts the ratio of ZBTB18 FL/SF (Figures S5A and S5B). Overall, these data indicate that calpain-mediated ZBTB18 cleavage likely occurs at/in proximity to the NLV sequence and requires a PEST domain.
Figure 4.

ZBTB18 cleavage is regulated by a specific amino acidic sequence and requires a PEST sequence
(A) Schematic representation of ZBTB18 protein structure in correspondence to the CAPN cleavage site; amino acids in red are those substituted by site-directed mutagenesis.
(B and C) Western blot analysis (B) and corresponding quantification (C) of SNB19 cells transduced with empty vector (EV), wild-type ZBTB18 FL (ZBTB18 FL-wt), or ZBTB18 FL with mutated CAPN cleavage site (NLV-mut). ZBTB18 FL (wt or NLV-mut) was detected with an anti-HA antibody. As the HA tag (at the Cte) is not retained in the cleaved form short form, an anti-FLAG antibody (rabbit, Cell Signaling) was used to detect the cleaved fragment.
(D and E) Western blot analysis (D) and relative quantification (E) of SNB19 cells on ectopic expression of ZBTB18 FL, ZBTB18 FL without the PEST1 sequence (FL-ΔPEST1), or ZBTB18 FL with mutated CAPN cleavage site and deleted PEST1 sequence (FL-ΔPEST1-NLV). Ectopic ZBTB18 variants were detected with an FLAG antibody (mouse, Sigma). The lower molecular weight of FL and SF proteins from FL-ΔPEST1 and FL-ΔPEST1-NLV is owing to the absence of the PEST1 region. See also Figure S4 and S5.
ZBTB18 SF-Nte localizes to the cytoplasm and lacks ZBTB18 tumor-suppressive function
We then sought to characterize ZBTB18 SF-Nte function by performing overexpression studies in SNB19 and BTSC233 cells (Figure 5). We observed that ZBTB18 SF-Nte migrated on SDS-page similarly to the ZBTB18 SF generated by cleavage of ZBTB18 full length (FL) (Figures 5A–5C). Moreover, differently from the long form, ZBTB18 SF-Nte showed a cytoplasmic localization (Figures 5B–5D); this is probably caused by the lack of a nuclear retention signal while a nuclear export signal (NES) is still present (Figure 1B). We then compared the effects of ZBTB18 FL and SF-Nte on cell behavior. Contrary to what was observed with ZBTB18 FL, ZBTB18 SF-Nte did not affect cell migration (Figure 5E). Previous studies from others and we indicate that ZBTB18 can induce apoptosis (Fedele et al., 2017; Tatard et al., 2010). Therefore, we measured casp3/7 cleavage and observed that ZBTB18 FL, but not ZBTB18 SF-Nte expression led to apoptosis (Figure 5F). In addition, ZBTB18 SF-Nte did not affect cell invasion and proliferation, suggesting that the tumor suppressor function of the long-form protein is lost in the short variant (Figures 5G and 5H). Furthermore, in light of the loss of nuclear localization and lack of zinc fingers domains, we hypothesized that ZBTB18 SF-Nte could no longer regulate gene expression. In fact, while ZBTB18 FL overexpression in SNB19 led to the downregulation of previously validated mesenchymal genes (Fedele et al., 2017), no repression was observed on ZBTB18 SF-Nte expression (Figure 5I). Conversely, while ZBTB18 FL led to re-expression of the epithelial marker MUC1, the SF had no effect (Figure 5I). Taken together, these data indicate that the Nte ZBTB18 SF is no longer able to repress the expression of mesenchymal genes nor is able to elicit the cellular alterations induced by the full-length protein, suggesting that ZBTB18 SF-Nte has lost ZBTB18 FL functions as gene expression repressor and tumor suppressor.
Figure 5.

ZBTB18 N-terminal short form localizes in the cytoplasm and no longer functions as a tumor suppressor
(A) Western blot analysis of GBM-derived BTSC233 (left) and SNB19 (right) cells on ectopic expression of ZBTB18 FL or ZBTB18 SF-Nte. Ectopic proteins were detected with a total ZBTB18 antibody (Sigma).
(B and C) Western blot analysis, with anti-FLAG antibody (mouse, Sigma), of nuclear and cytoplasmic fractions of BTSC233 (B) and SNB19 cells (C) on ectopic expression of ZBTB18 FL or ZBTB18 SF-Nte.
(D) Microphotographs showing SNB19 cells labeled with Flag-ZBTB18 on ectopic expression of ZBTB18 FL or ZBTB18 SF-Nte (scale = 100μm).
(E) Microphotographs showing the result of a migration assay in SNB19 cells on ectopic expression of ZBTB18 FL or ZBTB18 SF-Nte (scale = 100μm).
(F) Caspase 3/7 cleavage assay showing apoptotic cells in SNB19 cells on ectopic expression of ZBTB18 FL or ZBTB18 SF-Nte. Values represent mean ± SD, n = 3; ∗∗p < 0.01, n.s. not significant, according to unpaired t-test.
(G) Boyden chamber invasion assay showing invading cells in SNB19 cells on ectopic expression of ZBTB18 FL or ZBTB18 SF-Nte. Values represent mean ± SD, n = 4; ∗∗p < 0.01, n.s. not significant, according to unpaired t-test.
(H) Proliferation assay (EdU labeling) in SNB19 cells on ectopic expression of ZBTB18 FL or ZBTB18 SF-Nte. Values represent mean ± SD, n = 4; ∗∗p < 0.01, ∗∗∗p < 0.001, according to unpaired t-test.
(I) Real-time qPCR of selected genes in SNB19 cells on ectopic expression of ZBTB18 FL or ZBTB18 SF-Nte. Cells were harvested 72 h on transduction. 18S was used as a housekeeping gene. Values represent mean ± SD, n = 3; ∗p < 0.05, ∗∗p < 0.01, according to unpaired t-test.
ZBTB18 SF-Nte interacts with CTBP1/2 and mediates their partial translocation to the cytoplasm
Calpains are peculiar compared to other proteases as they can generate truncated proteins that can acquire new functions (Conacci-Sorrell et al., 2010; Cortesio et al., 2011). In order to get an insight into possible new functions of ZBTB18 SF-Nte, we performed SILAC-based quantitative MS to identify proteins, specifically interacting with ZBTB18 FL or SF-Nte. SNB19 cells were SILAC labeled using Arg0/Lys0 (low, L), Arg6/Lys4 (medium, M), and Arg10/Lys8 (high, H) and afterward, respectively, transduced with pCHMWS-EV (L) pCHMWS-FLAG-ZBTB18 FL (M) or pCHMWS-FLAG-ZBTB18 SF-Nte (H) lentiviral particles (Figure 6A). Results showed that both ZBTB18 FL and SF-Nte interact with the previously identified ZBTB18 partners CTBP2 and CTBP1 (Figure 6B) (Ferrarese et al., 2021). Surprisingly, ZBTB18 SF-Nte appeared to bind to CTBP1/2 even more strongly than ZBTB18 FL (CTBP2 M/L = 3.8, CTBP1 M/L = 2.4, CTBP2 H/L = 46.8, CTBP1 H/L = 46) (Figure 6B). Moreover, KPNB1, a well-known nuclear importin, which plays a role in nuclear localization of multiple proteins, appeared to bind ZBTB18 FL but not ZBTB18 SF-Nte, suggesting that ZBTB18 interaction with KPNB1 could be important for its nuclear localization. To characterize further the ZBTB18 SF-Nte role, we investigated more in detail its interaction with CTBP1/2, which are known co-factors involved in gene expression and therefore, supposed to have a nuclear function, opposed to ZBTB18 SF-Nte that localizes in the cytoplasm. Thus, we generated a mutant variant (ZBTB18 SF-mut) unable to bind to CTBP1/2 through site-directed mutagenesis of the previously validated CTBP1/2 interaction motif (VLDLS) (Ferrarese R., 2021; Nibu and Levine, 2001), in which Leu/L240, Asp/D241, and Leu/L242 amino acids have been substituted with Ser/S, Ala/A, Ser/S amino acids (Figure 6C). Co-immunoprecipitation experiments confirmed the binding of ZBTB18 SF-Nte to CTBP2; on the other hand, the interaction was completely abolished when ZBTB18 SF-mut was expressed (Figure 6D). In light of ZBTB18 SF-Nte localization in the cytoplasm, we examined whether CTBP1/2 resulted in similar compartmentalization. Western blot analysis of CTBP1/2 in BTSC233 and SNB19 nuclear and cytoplasmic extracts showed a reduction of CTBP2 and CTBP1 in the nucleus, suggesting that a fraction of the CTBP1/2 pool could be transferred to the cytoplasm through the interaction with ZBTB18 SF-Nte (Figures 6E and 6F). Similarly, on ZBTB18 SF-Nte expression, an increase in CTBP2 cytoplasmic localization was detected by immunostaining (Figures 6G and 6H), supporting the idea that CTBP1/2 could be retained in the cytoplasm by forming a complex with ZBTB18 SF-Nte.
Figure 6.

ZBTB18 SF-Nte retains the ability to bind CTBP1/2, preventing them to enter the nucleus
(A) Experimental flow chart of the SILAC-based quantitative MS analysis on SNB19 cells labeled using Arg0/Lys0 (low, L), Arg6/Lys4 (medium, M), and Arg10/Lys8 (high, H) and transduced with pCHMWS-EV, pCHMWS-FLAG-ZBTB18 FL, or pCHMWS-FLAG-ZBTB18 SF-Nte, respectively.
(B) Summarizing table showing the results of the SILAC MS.
(C) Schematic representation of ZBTB18 SF-Nte; in the highlighted CTBP1/2 binding site, amino acids in red are those substituted by site directed mutagenesis.
(D) Western blot analysis of CTBP2-ZBTB18 co-immunoprecipitation experiments using a FLAG (rabbit, Cell Signaling) antibody in SNB19 cells expressing ZBTB18 SF-Nte, or ZBTB18 SF-mut. Western blots were performed with mouse anti-CTBP2 or mouse anti-FLAG antibodies (mouse, Sigma).
(E) Western blot analysis of nuclear and cytoplasmic fractions of BTSC233 cells on ectopic expression of ZBTB18 FL or ZBTB18 SF-Nte. ZBTB18 FL and SF were detected with anti-FLAG antibodies (mouse, Sigma).
(F) Western blot analysis of nuclear and cytoplasmic fractions of SNB19 cells on ectopic expression of ZBTB18 FL, ZBTB18 SF-Nte, ZBTB18 FL-mut, or ZBTB18 SF-mut. ZBTB18 FL and SF were detected with anti-FLAG antibodies (mouse, Sigma).
(G and H) Microphotographs (G) and relative quantification (H) showing CTBP2 immunolocalization in SNB19 cells on ectopic expression of ZBTB18 FL or ZBTB18 SF-Nte. Values represent mean ± SD, n = 5; ∗∗∗p < 0.001, n.s. not significant, according to unpaired t-test. Scale bar = 100μm.
ZBTB18 SF-Nte affects the expression of hypoxia genes and HIF targets
To investigate the function of ZBTB18 SF-Nte, we performed RNAseq analysis 72 h on overexpression of ZBTB18 FL and SF-Nte, with or without the CTBP-binding-site mutation in SNB19 cells (Figure S6A). Gene expression changes induced by ZBTB18 forms, which do not bind CTBP1/2 (ZBTB18 FL-mut and ZBTB18 SF-mut) were also examined. Several differently regulated genes on ZBTB18 SF-Nte and ZBTB18 SF-mut were identified (Figure 7A). Given their cytoplasmic localization, ZBTB18 SF-Nte and ZBTB18 SF-mut are likely to affect gene expression through indirect mechanisms. Gene Set Enrichment Analysis (GSEA) indicated that many genes upregulated by ZBTB18 SF-Nte and SF-mut are hypoxia genes and HIF1A/HIF2A targets (Figure S6B). When looking at specific genes (CA9, INSIG2, and HILPDA), we observed that ZBTB18 SF-Nte, but not ZBTB18 FL, and ZBTB18 forms that lack CTBP1/2 interaction (ZBTB18 FL-mut and ZBTB18 SF-mut) caused their upregulation (Figure 7B). Expression analysis in BTSC475 confirmed the activating role of ZBTB18 SF-Nte on HIFs targets. Here, ZBTB18 SF-mut also appeared to mediate gene upregulation although less efficiently compared to ZBTB18 SF-Nte (Figures 7C and S6C). To further confirm the role of ZBTB18 SF-Nte in the regulation of HIF targets, we treated U3082 with the calpain inhibitor PD150606 (Figure 2F). Consistent with our model, we observed that preventing ZBTB18 cleavage through the inhibition of calpain, led to the downregulation of CA9, NDRG1, and EGLN3 under both the tested concentrations of PD150606 (Figure 7D).
Figure 7.

ZBTB18 SF-Nte enhances the hypoxia pathway
(A) Volcano plots showing the statistical significance of ZBTB18 SF-Nte vs. EV (left panel) and ZBTB18 SF-mut vs. EV (right panel). Top 20 UP and DOWN regulated genes are labeled. Color code represents the average normalized intensity (log2). Dash line indicates the significance threshold at 0.05 adjusted p value.
(B) Box-plot representation of the expression of selected genes extrapolated from RNAseq analysis of SNB19 cell line on ectopic expression of ZBTB18 FL, ZBTB18 FL-mut, ZBTB18 SF-Nte, or ZBTB18 SF-mut.
(C) Real-time qPCR of selected hypoxia genes in GBM-derived BTSC475 cells on ectopic expression of ZBTB18 SF-Nte or ZBTB18 SF-mut for 72 h; 18S was used as a housekeeping gene. Values represent mean ± SD, n = 3; ∗p < 0.05, ∗∗p < 0.01, according to unpaired t-test.
(D) Real-time qPCR of selected hypoxia genes in GBM-derived U3082 cells treated with the calpain inhibitor PD150606 (10 or 25 μM) for 16 h. 18S was used as a housekeeping gene. See also Figure S6.
ZBTB18 SF-Nte affects lipid uptake, lipid droplet accumulation, and cell metabolic activity
HIF1A has been shown to induce fatty acid uptake and lipid storage through the regulation of FABP3/7, which mediate fatty acid uptake (Bensaad et al., 2014). Interestingly, we observed that FABP7 is upregulated by ZBTB18 SF-Nte but not by ZBTB18 SF-mut (Figure 8A and S6D). This suggest that ZBTB18 SF-Nte could play a role in lipid uptake. To clarify whether ZBTB18 SF-Nte could drive phenotypic changes associated with deregulated fatty acid uptake, we measured the uptake capability of BTSC475 on ZBTB18 SF-Nte overexpression using Bodipy-C12, a fluorescent lauric acid compound. Cells expressing ZBTB18 SF-Nte incorporated significantly more Bodipy-C12, compared to EV controls and ZBTB18 SF-mut expressing cells (Figures 8B and 8C). In addition, BTSC475 cells expressing ZBTB18 SF-Nte, and to a lesser extent those with SF-mut, were characterized by a more abundant presence of LD in their cytoplasm, compared to EV controls (Figures 8D and 8E). In SNB19 cells, we observed a marked increase of LD, which were completely lost when cells were grown in lipid-depleted serum (Figures S7A and S7B).
Figure 8.

ZBTB18 SF-Nte controls lipid uptake via hypoxia pathway and affects cellular metabolism
(A) Real-time qPCR of FABP7, an HIF1A target involved in lipid metabolism and trafficking, in GBM-derived BTSC233 cells on ectopic expression of ZBTB18 SF-Nte or ZBTB18 SF-mut; 18S was used as a housekeeping gene. n = 3; ∗p < 0.05.
(B and C) Microphotographs (B) and relative quantification (C) showing the uptake of fluorescent lauric acid compound (Bodipy-C12) by GBM-derived BTSC475 cells expressing ZBTB18 SF-Nte or ZBTB18 SF-mut. Values represent mean ± SD, n = 4; ∗∗∗p < 0.001, n.s. not significant, according to unpaired t-test (scale bar = 100 μm).
(D and E) Microphotographs (D) and relative quantification (E) of LD labeled with Bodipy TMR-X in GBM-derived BTSC475 cells expressing ZBTB18 SF-Nte or ZBTB18 SF-mut. Values represent mean ± SD, n = 4; ∗∗∗p < 0.001, according to unpaired t-test (scale bar = 100 μm).
(F)Real-time qPCR of FABP7 and EGLN3 in GBM-derived BTSC475 cells on ectopic expression of ZBTB18 SF-Nte or ZBTB18 SF-mut, with or without treatment with hypoxia pathway inhibitor, LW6. 72 h on transduction cells were treated with LW6 for an additional 16 h before harvesting. TBP was used as a housekeeping gene. Representative experiment, number of repetitions: 3.
(G and H) Microphotographs (G) and relative quantification (H) showing the uptake of fluorescent lauric acid compound (Bodipy-C12) by GBM-derived BTSC475 cells expressing ZBTB18 SF-Nte or ZBTB18 SF-mut, with or without treatment with hypoxia pathway inhibitor, LW6 (scale bar = 100 μm). Cells were treated as in (F). Values represent mean ± SD, n = 4; ∗∗∗p < 0.001, n.s. not significant, according to unpaired t-test.
(I) ATP production rate in GBM-derived BTSC475 cells expressing ZBTB18 SF-Nte or ZBTB18 SF-mut, with or without treatment with hypoxia pathway inhibitor, LW6. Cells were treated as in (F). Values represent mean ± SD, n = 5.
(J) Energetic map based on the ATP production basal rates of GBM-derived BTSC475 cells expressing ZBTB18 SF-Nte or ZBTB18 SF-mut, with or without treatment with hypoxia pathway inhibitor, LW6. Cells were treated as in (F). Values represent mean ± SD, n = 5. See also Figure S7.
In order to get an insight into the metabolism of these cells, we then performed real-time metabolic analysis using the Seahorse XF96 Extracellular Flux analyzer. Interestingly, overexpression of ZBTB18 SF-Nte in SNB19 cells increased both mitochondrial respiration and glycolysis; conversely, especially the glycolytic function was reduced when ZBTB18 FL was overexpressed (Figures S7C and D). In a second test to measure the ATP production rate, ZBTB18 FL overexpression confirmed reduced metabolic capabilities, even though in this assay the mitochondrial respiration seemed more affected than the glycolysis (Figures S7E and S7F). On the other hand, the overexpression of both ZBTB18 SF-Nte and SF-mut showed an increased metabolism compared to the EV control, with a particularly strong enhancement of the glycolytic activity (Figures S7E and S7F). Overall, these data hint at the idea that ZBTB18 SF-Nte enhances the metabolism of tumor cells, possibly implying a role in tumor progression. Moreover, the observed increased glycolytic activity is consistent with the hypothesis that ZBTB18 SF-Nte activates the HIF pathway.
ZBTB18 SF-Nte affects lipid uptake through HIF1A
To confirm whether HIF1A is involved in ZBTB18 SF-mediated transcriptional and phenotypic changes, we treated BTSC475 transduced with either ZBTB18 SF-Nte or ZBTB18 SF-mut with the HIF1A inhibitor (LW6) which upregulates VHL and consequently leads to HIF1A degradation (Lee et al., 2010). Real-time PCR experiments conducted 72 after transduction showed that LW6-mediated HIF pathway blockade halted the ZBTB18 SF-Nte-induced upregulation of FABP7 and EGLN3 (Figure 8F). Of note, as previously observed, overexpression of ZBTB18 SF-mut in these cells did not elicit the same gene upregulation as ZBTB18 SF-Nte and the effect of LW6 produced an effect similar to that on EV controls. Similarly, the treatment of BTSC475 with LW6 reduced the uptake of Bodipy-C12 from the culture medium in ZBTB18 SF-Nte expressing cells, in fact restoring the level to that of the control cells (Figures 8G and 8H). Finally, the ATP production rate assay showed that in presence of LW6 inhibitor, the glycolytic activity of both control and ZBTB18 SF-mut expressing cells was starkly reduced and a mild reduction in the mitochondrial respiration was also observed (Figures 8I and 8J). Conversely, cells expressing ZBTB18 SF-Nte, which already showed the highest metabolic activity compared to the other samples, were only modestly affected by LW6 treatment and showed only a minor shift in their energetic metabolism (Figures 8I and 8J). Thus, according to these results, ZBTB18 SF-Nte seems to exert its role in controlling fatty acid mobilization upstream and at least partially through the HIF pathway. However, ZBTB18 SF-Nte seemed to be able to enhance the cellular metabolism regardless of HIF pathway blockade, suggesting that its role in tumor progression may be more complex. Overall, our data suggest that ZBTB18 cleavage could be a new mechanism to increase the metabolic activity of GBM cells through ZBTB18 SF-mediated activation of HIF1a targets and lipid uptake.
Discussion
Here we report a new mechanism to regulate the tumor suppression function of ZBTB18 in GBM. Our data show that calpains mediate ZBTB18 cleavage in GBM and that this activity generates an Nte and a Cte protein product.
While the role of ZBTB18 SF-Cte has yet to be defined, our results show that ZBTB18 SF-Nte is stable and with functional traits that seemingly support GBM cell tumorigenic activity. Similar to our observation, a previous study has shown that MYC cleavage by CAPN2 generates a new functional protein (MYC-Nick), which localizes in the cytoplasm and plays a role in cell differentiation (Conacci-Sorrell et al., 2010). Importantly, this study also points toward a role of an upstream PEST sequence (PEST1) in calpain-mediated cleavage. ZBTB18 protein half-life is not affected by the removal of PEST1 sequence, which instead shows an effect on the ZBTB18 FL/SF ratio, indicating that it is specifically involved in ZBTB18 cleavage rather than in ZBTB18 degradation. We also identified amino acids Asn/N268 and Leu/L269 as the putative ZBTB18 cleavage site; interestingly, the same sequence was shown to be the cleavage site of CAMK IV, a well-characterized substrate of CAPN2 (McGinnis et al., 1998; Piatkov et al., 2014). Mutagenesis of these amino acids, however, did not completely abolish the cleavage site, consistent with the fact that calpain can use slightly different cleavage sites as they mostly recognize the three-dimensional structure of their protein substrates. Of note, mutagenesis of the NLV putative cleavage site caused the increase of ZBTB18 FL high band, suggesting that when cleavage is inhibited, more ZBTB18 FL accumulates and subsequently, becomes available for post-translational modification. However, another possibility is that a modified form of ZBTB18 (i.e. phosphorylated) is preferentially targeted by calpain and therefore it increases when calpain cleavage is blocked. In the future, further investigation of ZBTB18 post-translational modification, also in relation to calpain cleavage, should be implemented.
Our significance analysis of microarray indicates that CAPN2 is highly expressed in BTSCs with ZBTB18 SF and suggests its major role in ZBTB18 cleavage. However, our experimental validation with the calpain inhibitor PD150606 does not allow us to discriminate between CAPN1 and CAPN2 functions. Therefore, we cannot exclude that also CAPN1, perhaps regulated through different mechanisms other than gene expression, could also be involved in ZBTB18 cleavage. We also observed that, when calpain is inhibited by PD150606, ZBTB18 FL levels do not concomitantly increase, probably as a consequence of proteasomal degradation. Therefore, both ZBTB18 cleavage and degradation by the proteasome seem to be complementary mechanisms to reduce the level of ZBTB18 in tumor cells.
Functional analysis of ZBTB18 SF-Nte revealed that this cleaved product interacts with CTBP1/2 and causes their partial translocation in the cytoplasm. Our data indicate that while ZBTB18 SF-Nte positively regulates HIF1A target expression and lipid uptake, this effect is partially lost in the mutated counterpart, which is no longer able to interact with CTBPs, suggesting that the interaction with these co-factors is important for ZBTB18 SF-Nte function. Notably, CTBP2 has been shown to play a role in the metabolic reprogramming of cancer cells (Wang et al., 2015). Recently, we have reported that ZBTB18 FL interacts with CTBPs by interfering with CTBP-mediated regulation of fatty acid synthesis (Ferrarese R., 2021). In addition, ZBTB18 FL favors CTBP interaction with corepressors and recruits a repressive complex to SREBP gene promoters (Ferrarese R., 2021). Therefore, it is possible that ZBTB18 SF-Nte impairs CTBP1/2 function forcing their translocation to the cytoplasm. In the future, further studies will be required to clarify the role of CTBPs in ZBTB18 SF-Nte functions.
Our data indicate that ZBTB18 SF-Nte activates HIF1A leading to the activation of its downstream targets and HIF1A-mediated functions such as lipid uptake, LD accumulation, and enhanced metabolic activity. The regulation of FABP7 by the ZBTB18 SF-Nte-HIF1A axis is particularly important considering FABP7 role in the uptake of lipids from the extracellular environment (Bensaad et al., 2014). In addition, FABP7 has been associated with low overall survival of patients with GBM (Lewis et al., 2015).
Treatment of GBM cells with hypoxia pathway inhibitor LW6 reduces ZBTB18 SF-Nte effects on gene expression, lipid uptake, and LD, further suggesting that ZBTB18 SF-Nte acts upstream HIF1A. The inhibitor treatment only mildly affected cells expressing ZBTB18 SF-mut, unable to bind to CTBP1/2, thus confirming the involvement of CTBPs in ZBTB18 SF-Nte functions, albeit through yet-to-be elucidated mechanisms.
Metabolic reprogramming of cancer plays an important role in cancer progression, including GBM. The increased lipid uptake together with the observed higher metabolic function is consistent with idea that ZBTB18 SF-Nte promotes tumorigenic activity in GBM cells.
Interestingly, our data suggest the existence of a link between ZBTB18 SF-Nte and hypoxia; in fact, hypoxia plays a role in CAPN2-mediated ZBTB18 cleavage and ZBTB18 SF-Nte consequently promotes HIF1A signaling. Therefore, ZBTB18 SF-Nte could be important to maintain the HIF1A pathway through a positive feedback mechanism. Similar to our proposed model, a previous study has shown that hypoxia induces calpain-mediated cleavage of filamin A (FLNA) and that the resulting FLNA Cte cleavage product positively regulates HIF1A-dependent transcription and function (Zheng et al., 2014).
In conclusion, we describe a new mechanism of calpain-mediated cleavage occurring in GBM, which leads to the expression of ZBTB18 SF products. We have investigated the function of ZBTB18 SF-Nte and shown that it has lost ZBTB18 FL tumor-suppressive functions, acquiring instead a previously unexpected tumor-promoting role. As such, ZBTB18 cleavage could be a novel mechanism to increase the oncogenic activity of GBM cells.
Limitations of the study
Our study reveals that the activity of the transcriptional repressor and tumor suppressor ZBTB18 is impaired in GBM through the activity of calpain. Calpain mediates ZBTB18 proteolytic cleavage, which leads to the reduction of the full-length protein and expression of ZBTB18-cleaved products. Here, we have investigated the role of the Nte cleaved product, which has acquired new oncogenic properties and regulates lipid uptake and metabolism. Our proposed model of ZBTB18 cleavage by calpain has some limitations. In particular, the lack of re-expression of ZBTB18 full length on calpain inhibition could not be fully explained. Our data suggest that ZBTB18 FL is unstable compared to the Nte short product; therefore, we hypothesize that when calpain is inhibited more ZBTB18 FL protein is degraded by the proteasome, as a mechanism to maintain the level of ZBTB18 low. Another aspect is represented by the role of CAPN1 in ZBTB18 cleavage. Although our gene expression analysis identified CAPN2 as the most prominent candidate protease implicated in ZBTB18 cleavage, the experiments using the calpain inhibitor PD150606 do not allow for discrimination between CAPN1 and CAPN2 function. Therefore, CAPN1 could also be involved and perhaps, regulated through other mechanisms.
STAR★Methods
Key resources table
| REAGENT or RESOURCE | SOURCE | IDENTIFIER |
|---|---|---|
| Antibodies | ||
| Mouse monoclonal anti-FLAG M2 | Sigma-Aldrich | Cat#F1804-200UG; RRID: AB_262044 |
| Rabbit monoclonal antibody anti-FLAG | Cell Signaling Technology | Cat#14793; RRID: AB_2572291 |
| Mouse monoclonal anti-HA | Abcam | Cat#18181; RRID: AB_444303 |
| Mouse monoclonal anti-ZBTB18 (total) | Sigma | Cat# SAB1406998; RRID: AB_10741318 |
| Rabbit polyclonal anti-ZBTB18 (total) | Abcam | Cat#ab118471; RRID: AB_10899789 |
| Rabbit polyclonal anti-ZBTB18 (Cte) | Proteintech | cat#12714-1-AP; RRID: AB_2218388 |
| Mouse monoclonal anti-CTBP2 | BD Biosciences | Cat#612044; RRID: AB_399431 |
| Mouse monoclonal anti-CTBP1 | BD Biosciences | Cat#612042; RRID: AB_399429 |
| Rabbit polyclonal anti-CAPN2 | Cell Signaling Technology | Cat#2539S; RRID: AB_2069843 |
| Rabbit polyclonal anti-CAST | Cell Signaling Technology | Cat#4146S; RRID: AB_2244162 |
| Mouse anti alpha tubulin | Abcam | Cat#ab7291; RRID: AB_2241126 |
| Goat polyclonal anti Laminin B | Santa Cruz Biotechnology | Cat# sc-6216, RRID: AB_648156 |
| Mouse monoclonal antibody anti Lamin A/C | Cell Signaling Technology | cat#4777 RRID: AB_10545756 |
| anti-Perilipin-3 rabbit polyclonal antibody | Abcam | Cat#ab47638 RRID: AB_881572 |
| Bacterial and virus strains | ||
| LV-CAG-GCaMP6f | SignaGen Laboratories | Cat# SL100321 |
| pLKO-shCAPN2#1 | Sigma Aldricht | #TRCN0000003543 |
| pLKO-shCAPN2#2 | Sigma Aldricht | #TRCN0000003540 |
| pLKO-CAST | Sigma Aldricht | TRCN0000073638 |
| pLKO-shCtr | Sigma Aldricht | SHC002 |
| PCHMWS | Ibrahimi et al. (2009) | N/A |
| pCHMWS-FLAG-ZBTB18-HA | This paper | N/A |
| pCHMWS-ZBTB18-SF | This paper | N/A |
| pCHMWS-ZBTB18-mut | Ferrarese et al. (2021) | N/A |
| pCHMWS-ZBTB18-NLV-mut | This paper | N/A |
| pCHMWS-ZBTB18-ΔPEST | This paper | N/A |
| pCHMWS-ZBTB18-ΔPEST-NLV-mut | This paper | N/A |
| Biological samples | ||
| GBM specimens | Department of Neurosurgery Tumor Bank | https://www.uniklinik-freiburg.de/neurosurgery/research/genetics-of-brain-tumors.html |
| Human cortical samples | Department of Neurosurgery Tumor Bank | https://www.uniklinik-freiburg.de/neurosurgery/research/genetics-of-brain-tumors.html |
| Chemicals, peptides, and recombinant proteins | ||
| Arg-10 HCl | Silantes | Cat#201604102 |
| Lys-8HCl | Silantes | Cat#211604102 |
| Arg-6 HCl | Silantes | Cat# 201204102 |
| Lys-4D 2HC | Silantes | Cat# 211104113 |
| LW6 | Axon Medchem | Cat#2480 |
| PD150606 | Calbiochem | Cat#CAS426821-41-2 |
| E64D | Sigma | Cat#E8640 |
| Q-VD-OPh | Sigma | Cat#SML0063 |
| Leupeptin | Sigma | Cat#L2884 |
| Cobalt Chloride (CoCl2) | Sigma | Cat# 232696 |
| Calcium Ionophore | Sigma-Aldrich | Cat#A23187 |
| Bodipy TMR-X SE | Thermo Fisher Scientific | Cat# D6117 |
| Bodipy C-12 | Thermo Fisher Scientific | Cat# D3822 |
| Critical commercial assays | ||
| Dynabeads mRNA Purification Kit | Thermo Fisher Scientific | Cat#61006 |
| QuikChange II XL Site-Directed Mutagenesis Kit | Agilent | Cat#200521 |
| Lenti-X™ Concentrator | Clontech | Cat#631232 |
| miRNeasy Mini Kit | Qiagen | Cat# 217004 |
| SuperScript III First-Strand Synthesis System for RT-PCR | Thermo Fisher Scientific | Cat#18080-051 |
| Kapa SYBR Fast | Sigma | Cat#KK4618 |
| Caspase-Glo® 3/7 assay | Promega | Cat#G8090 |
| EdU-Click-549 | Baseclick | Cat# BCK-EdU594 |
| Culture-Inserts 2 well | Ibidi | Cat#80209 |
| BioCoat Matrigel Invasion Chambers | Cornig | Cat#54480 |
| Fetal Bovine Serum (FBS) South America, Lipid Depleted) | Biowest | Cat#S181L-100 |
| Superscript™ IV Reverse Transcriptase | Thermo Fisher Scientific | Cat# 18090010 |
| Low Input by PCR Barcoding Kit | Oxford Nanopore Technologies | Cat# SQK-PBK004 |
| cDNA-PCR Sequencing Kit | Oxford Nanopore Technologies | Cat# SQK-PCS109 |
| Nuclear extraction kit | Active Motif | Cat#40010 |
| Seahorse XF Cell Mito Stress Test Kit | Agilent | Cat#103015-100 |
| Seahorse XF Glycolysis Stress Test Kit | Agilent | Cat#103020-100 |
| Seahorse XF Real-Time ATP Rate Assay | Agilent | Cat#103592-100 |
| Deposited data | ||
| Raw and analyzed gene expression data (RNAseq) | This paper | GEO:GSE184890 https://doi.org/10.17632/gm8322zc72.1 |
| Protein interaction data | This paper | IMEX: IM-29234 |
| Western blots | This paper; Mendeley data | https://doi.org/10.17632/gm8322zc72.1 |
| Experimental models: Cell lines | ||
| SNB19 | Carro lab stock | NCI-DTP Cat# SNB-19, RRID:CVCL_0535 |
| HEK293 | Carro lab stock | CLS Cat# 300192/p777_HEK293, RRID:CVCL_0045 |
| LN229 | Carro lab stock | ATCC Cat# CRL-2611, RRID:CVCL_0393 |
| BTSC233 | Fedele et al. (2017) | N/A |
| U3082 | Xie et al. (2015) | N/A |
| BTSC348 | This paper | N/A |
| BTSC349 | This paper | N/A |
| BTSC380 | This paper | N/A |
| BTSC268 | This paper | N/A |
| BTSC232 | Fedele et al. (2017) | N/A |
| BTSC422 | This paper | N/A |
| U3047 | Xie et al. (2015) | N/A |
| BTSC611 | This paper | N/A |
| BTSC168 | Kling et al. (2016) | N/A |
| BTSC407 | This paper | N/A |
| BTSC482 | This paper | N/A |
| BTSC637 | This paper | N/A |
| BTSC475 | This paper | N/A |
| Oligonucleotides | ||
|
BstXI-flag-hZBTB18v1-for: CAAGGCCCACAACCATGGATGGAC TACAAGGACGACGATGACAAGTGT CCTAAAGGTTATGAAGACAG |
This paper | N/A |
| PmeI-His-hZBTB18-SF-Nte-antisense: GCCTTGGTTTAAACTTAGTGAT GGTGGTGATGGTGTTTCCAAAGTT CTTGAGAGCTA |
This paper | N/A |
| PmeI-HA-hZBTB18-antisense: GCCTTGGTTTAAACTTAAGCGTAATC TGGAACATCGTATGGGTATTTCCAAA GTTCTTGAGAGCTA |
This paper | N/A |
| ZBTB18-NLVmut_for: CTGAAAGGCTGGACTTGACAGACGA GGCCGACACACAGTCAACATCTGC CGAAT |
This paper | N/A |
| ZBTB18-NLVmut_rev: ATTCGGCAGATGTTGACTGTGTGTC GGCCTCGTCTGTCAAGTCCAGCC TTTCAG |
This paper | N/A |
| ZBTB18_NLVmut F: CCTCTTTCTCCACCTTCACCTGCCA CCAGAAGCTTCTCAGCACGTCCTG TGAAG; |
This paper | N/A |
| ZBTB18_NLVmut R: CTTCACAGGACGTGCTGAGAAGCT TCTGGTGGCAGGTGAAGGTGGA GAAAGAGG |
This paper | N/A |
|
BstXI-flag-hZBTB18v1-for: CAAGGCCCACAACCATGGATGGA CTACAAGGACGACGATGACAAGT GTCCTAAAGGTTATGAAGACAG |
This paper | N/A |
| ZBTB18-delPEST-NcoI-rev: CAAGGTCCATGGGTGGCTGCTG CCATCGGAGAG |
This paper | N/A |
| ZNF238-delPEST-for: GCCTTGCCATGGAAATTGAACAT CCTGCCCAGC |
This paper | N/A |
| NCOI and PmeI-His-hZBTB18-antisense: GCCTTGGTTTAAACTTAGTGATGGTGGT GATGGTGTTTCCAAAGTTCTTGAGAGCTA. |
This paper | N/A |
| CA9-for: GGATCTACCTACTGTTGAGGCT | This paper | N/A |
| CA9-rev: CATAGCGCCAATGACTCTGGT | This paper | N/A |
| NDRG1-for: GTCCTTATCAACGTGAACCCTT | This paper | N/A |
| NDRG1-rev: GCATTGGTCGCTCAATCTCCA | This paper | N/A |
| EGLN3-for: CTGGGCAAATACTACGTC AAGG |
This paper | N/A |
| EGLN3-rev: GACCATCACCGTTGGGGTT | This paper | N/A |
| FABP7-for: GGCTTTGCCACTAGGCAGG | This paper | N/A |
| FABP7-rev: TGACACTTTGTCTCCTTCTTGA; | This paper | N/A |
| TBP-for: GAGCTGTGATGTGAAGTTTCC | This paper | N/A |
| TBP-rev: TCTGGGTTTGATCATTCTGTAG. | This paper | N/A |
| 18s-for: CGCCGCTAGAGGTGAAATTC | Fedele et al. (2017) | N/A |
| 18s-rev: CTTTCGCTCTGGTCCGTCTT | Fedele et al. (2017) | N/A |
| SERPINE-for: ATTCAAGCAGCTATGGG ATTCAA |
Fedele et al. (2017) | N/A |
| SERPINE-rev CTGGACGAAGATCGCGTCTG | Fedele et al. (2017) | N/A |
| TNFAIP6-for: TTTCTCTTGCTATGGGA AGACAC |
Fedele et al. (2017) | N/A |
| TNFAIP6-rev: GAGCTTGTATTTGCCA GACCG |
Fedele et al. (2017) | N/A |
| S100A6-for: GGGAGGGTGACAAGCACAC | Fedele et al. (2017) | N/A |
| S100A6-rev: AGCTTCGAGCCAATGGTGAG | Fedele et al. (2017) | N/A |
| LGALS1-for:TCGCCAGCAACCTGAATCTC | Fedele et al. (2017) | N/A |
| LGALS1-rev:GCACGAAGCTCTTAGCGTCA | Fedele et al. (2017) | N/A |
| MUC1-for: TGCCGCCGAAAGAACTACG | Fedele et al. (2017) | N/A |
| MUC1-rev: TGGGGTACTCGCTCATAGGAT | Fedele et al. (2017) | N/A |
| Recombinant DNA | ||
| pLKO-shCAPN2#1 | Sigma Aldricht | #TRCN0000003543 |
| pLKO-shCAPN2#2 | Sigma Aldricht | #TRCN0000003540 |
| pLKO-CAST | Sigma Aldricht | TRCN0000073638 |
| pLKO-shCtr | Sigma Aldricht | SHC002 |
| PCHMWS | Ibrahimi et al. (2009) | N/A |
| pCHMWS-ZBTB18 | This paper | N/A |
| pCHMWS-ZBTB18-SF | This paper | N/A |
| pCHMWS-ZBTB18-SFmut | This paper | N/A |
| pCHMWS-ZBTB18-mut | Ferrarese et al. (2021) | N/A |
| pCHMWS-ZBTB18-NLV-mut | This paper | N/A |
| pCHMWS-ZBTB18-ΔPEST | This paper | N/A |
| pCHMWS-ZBTB18-ΔPEST-NLV-mut | This paper | N/A |
| Software and algorithms | ||
| limma-voom | Ritchie eta l., 2015 | limma-voom |
| MSigDB | Luo et al. (2009); Subramanian et al. (2005) | MSigDB |
| NanoPoreSeq pipeline | Heiland et al., 2018 | https://github.com/heilandd/NanoPoreSeq |
| VisaLab | Heiland et al., 2018 | https://github.com/-heilandd/Vis_Lab1.5 |
| EPESTfind | EMBOSS Explorer | https://emboss.bioinformatics.nl/cgi-bin/emboss/epestfind |
| CaMPDB | duVerle et al., 2009 | http://calpain.org/index.rb?cls=about |
| MinKNOW | Oxford nanopore technologies | https://nanoporetech.com/about-us/news/introducing-new-minknow-app |
| Xcalibur | Thermo Scientific | https://www.thermofisher.com/de/de/home/industrial/mass-spectrometry/liquid-chromatography-mass-spectrometry-lc-ms/lc-ms-software/lc-ms-data-acquisition-software/xcalibur-data-acquisition-interpretation-software.html |
| MaxQuant 1.4.1.2 | https://www.maxquant.org/ | |
| Other | ||
| Seahorse XFe 96 Extraflux Analyzer | Agilent | https://www.agilent.com/en/product/cell-analysis/real-time-cell-metabolic-analysis/xf-analyzers/seahorse-xfe96-analyzer-740879#specifications |
| MinION Sequencing Device | Oxford nanopore technologies | https://nanoporetech.com/products/minion |
| SpotON Flow Cell | Oxford nanopore technologies | https://store.nanoporetech.com/eu/flow-cell-r9-4-1.html |
| LTQ Orbitrap XL | Thermo Scientific | https://www.thermofisher.com/de/de/home/industrial/mass-spectrometry/liquid-chromatography-mass-spectrometry-lc-ms/lc-ms-systems/orbitrap-lc-ms.html |
| Leica SP8 confocal microscope | Leica | https://www.leica-microsystems.com/products/confocal-microscopes/p/leica-tcs-sp8/ |
| Axiovert Fluorescent microscope | Zeiss | https://www.zeiss.com/microscopy/int/products/light-microscopes/axio-vert-a1-for-biology.html |
| FV10i Confocal microscope | Olympus | https://www.olympus-lifescience.com/en/laser-scanning/fv10i-liv/ |
Resource availability
Lead contact
Further information and requests for resources and reagents should be directed to and will be fulfilled by the lead contact, Maria Stella Carro (maria.carro@uniklinik-freiburg.de).
Materials availability
Plasmids generated in this study are available upon request.
Experimental model and subject details
Human tissue samples
GBM biopsies and cortical samples from epilepsy surgery were collected at the Department of Neurosurgery of the University Medical Center Freiburg (Freiburg, Germany) in accordance with an Institutional Review Board–approved protocol. Informed consent was obtained from all patients, in accordance with the declaration of Helsinki. Information about GBM biopsies are listed in Table 1 and Table S1.
Primary glioblastoma cell lines
Primary glioblastoma stem cells-like (BTSCs) were generated in our laboratory in accordance with an Institutional Review Board-approved protocol (Fedele et al., 2017) (Kling et al., 2016). U3082, U3021 and U3047 were generated at the University of Uppsala (Xie et al., 2015) and kindly provided by Dr. Nelander. For BTSCs, for which the gender of the patient is known, we have added this information in the Table 1 and Table S1. All BTSCs were grown in Neurobasal medium (Life Technologies) containing B27 and N2 supplement (Life Technologies), FGF (20 ng/ml, R&D Systems), EGF (20 ng/ml, R&D Systems), LIF (20 ng/ml, Genaxxon Biosciences), Heparin (2 μg/ml, Sigma), and Glutamax (Invitrogen). U3082 were grown adherent on dishes previously coated with laminin (Life Technologies).
Cell lines
Glioblastoma cell lines (LN229, SNB19) and HEK293T cells were cultured in DMEM plus 10% FBS. For lipid starvation, SNB19 cells were grown in DMEM supplemented with 10% lipid-depleted FBS (Biowest). All cells were mycoplasma-free. LN229 and SNB19 have been authenticated on 3/2/2017 and on 11/26/19 (SNB19 and HEK293T) by PCR-single-locus-technology (Eurofins Medigenomix).
Method details
Reagents
For inhibition of HIF1A, the LW6 inhibitor (Axon Medchem # 2480) was diluted in DMSO and added to cells at a concentration of 20μM. The calpain inhibitor PD150606 was purchased from Calbiochem (#CAS426821-41-2) and diluted in the dark with DMSO at a stock concentration of 32.6 mM. Calcium Ionophore was purchased from Sigma (#A23187) and dissolved in DMSO at 10mM. CoCl2 was purchased from Sigma (#232696) and used at 200 μM (dissolved in water). E64D (#E8640), Q-VD-OPh (#SML0063) and Leupeptin (#L2884) were purchased from Sigma.
Vectors and viral infection
To produce FLAG-ZBTB18 SF-Nte-His, and FLAG-ZBTB18-HA, ZBTB18 was PCR amplified from the previously described pCHWMS-eGFP-ZBTB18 lentiviral vector (Fedele et al., 2017) using primers containing a BstXI and PmeI restriction sites. The pCHMWS lentiviral vector has been previously described (Ibrahimi et al., 2009). The following primers were used:
BstXI-flag-hZBTB18v1-for:
CAAGGCCCACAACCATGGATGGACTACAAGGACGACGATGACAAGTGTCCTAAAGGTTATGAAGACAG;
PmeI-His-hZBTB18- SF-Nte-antisense:
GCCTTGGTTTAAACTTAGTGATGGTGGTGATGGTGTTTCCAAAGTTCTTGAGAGCTA.
PmeI-HA-hZBTB18-antisense:
GCCTTGGTTTAAACTTAAGCGTAATCTGGAACATCGTATGGGTATTTCCAAAGTTCTTGAGAGCTA
The reverse primer was designed based on the previous proteomic analysis which defined ZBTB18 SF-Nte (Fedele et al., 2017). Upon restriction digestion the ZBTB18 fragment was cloned into BstXI and PmeI sites by removing the LUC region of the PCHMWS-eGFP-IRES vector. ZBTB18 LDL-mut which no longer interacts with CTBP was obtained by site-directed mutagenesis using pCHWMS-eGFP-FLAG-ZBTB18 SF-Nte-His as template and the QuikChange II XL Site-Directed Mutagenesis kit (Agilent), according to the manufacturer’s instructions. All constructs were sequence validated. The following primers were used:
ZBTB18-LDLmut_for:
CTGAAAGGCTGGACTTGACAGACGAGGCCGACACACAGTCAACATCTGCCGAAT; ZBTB18-LDLmut_rev:
ATTCGGCAGATGTTGACTGTGTGTCGGCCTCGTCTGTCAAGTCCAGCCTTTCAG.
Site-Directed Mutagenesis of the putative calpain cleavage site NLV was carried out using Agilent Technologies QuikChange II XL Site-Directed Mutagenesis Kit.
Lentiviral stocks production and cell infection were performed as previously described (Fedele et al., 2017). Ectopic protein expression was determined by immunoblotting with an anti-Flag M2 antibody (Sigma). Alternatively, rabbit anti-Flag (#14793, Cell Signaling) or anti-HA (#18181, Abcam) were used. For CAPN2 knockdown, the following short hairpins RNA cloned in the pLKO lentiviral vector (Sigma Aldrich) were used: shCAPN2-#1(TRCN0000003543), shCAPN2#2 (#TRCN0000003540). CAST silencing was achieved by lentiviral transfection with pLKO lentiviral vector (Sigma Aldrich) harboring the sequence targeting human CAST (TRCN0000073638). As control a non-targeting shRNA (SHC002, here shCtr) was used.
To observe calcium abundance in different BTSC lines, the lentiviral Calcium reporter LV-CAG-GCaMP6f (SignaGen Laboratories #SL100321) was used. BTSCs were seeded on laminin-coated 6-well plates and infected with 1.5μL of the virus and 2μL of Polybrene. After 3–5 days, images were taken using a live cell imaging confocal microscope (Leica SP8).
Co-immunoprecipitation, mass spectrometry and SILAC
GBM cells were lysed in 1mL of co-IP buffer (150mM NaCl, 50mM TrisHCl pH 7.5, 10% glycerol, 0.2% Igepal, 1mM EDTA) supplemented with HaltTM protease and phosphatase inhibitor cocktail (1mM, Thermo Scientific), and PMSF (1mM, Sigma), vortexed for 30 seconds and kept on ice for 30 minutes. After centrifugation at 13,200 rpm for 20 minutes at 4 °C a pre-clearing step was performed by adding 25 L of Protein A/G PLUS-Agarose beads (Santa Cruz) and incubating the samples for 1 hour at 4 °C in rotation. The supernatant was incubated overnight with anti-FLAG M2 antibodies (Sigma). For ZBTB18 co-IP in U3082, lysates were incubated overnight with rabbit anti-ZBTB18 (Proteintech #12714-1-AP) or rabbit anti-ZBTB18 (Abcam #ab118471) A fraction of the lysate (input) were removed and mixed with equal volume of 2X laemmli buffer for western blot analysis. 20 μL of equilibrated protein A/G beads were added to each lysates and incubated for 2 hours at 4 °C. The beads were then washed for 4 times with 1 mL of co-IP buffer before eluting the co-precipitated proteins with 20 μL of 2X laemmli buffer. Samples were stored at −20 °C or directly analyzed by western blot. and co-IP was performed using For mass spectrometry (MS) analysis, the eluted co-precipitated proteins were separated by gel electrophoresis and gel fragments were processed as described in (Tucci et al., 2018) and then measured on a LTQ Orbitrap XL (Thermo Scientific) instrument. Data acquisition and analysis was performed using Xcalibur (Thermo Scientific, Germany) and MaxQuant 1.4.1.2 software. To investigate and visualize protein domain coverage (e.g. for ZBTB18), tryptic peptide sequences were manually mapped to full-length protein sequences.
For quantitative proteomics, we used SILAC. SNB19 cells were labeled using Arg0/Lys0 (low, L), Arg6/Lys4 (medium, M) and Arg10/Lys8 (high, H) (Silantes). Afterwards cells were transduced with pCHMWS-EV (L), pCHMWS-FLAG-ZBTB18 FL (M) or pCHMWS-FLAG-ZBTB18 SF-Nte (H) lentiviral particles. Transduced SNB19 were mixed and lysed as described above. Total protein extracts were incubated with anti-FLAG M2 antibody (Sigma) and the precipitated fraction subjected to MS to identify interacting proteins and calculate H/L ratios. All measurements and analysis were performed at the Core Facility Proteomics of the Center for Biological System Analysis (ZBSA) at the University of Freiburg, Germany. The protein interactions from this publication have been submitted to the IMEx (www.imexconsortium.org) consortium through IntAct (Orchard et al., 2014) and assigned the identification number IMEX: IM-29234.
RNA extraction and quantitative real-time PCR
Total RNA was extracted from cell culture using miRNeasy Mini Kit (Qiagen) according to the manufacturer’s instructions. First strand cDNA synthesis was generated using the Superscript III First-Strand Synthesis System for RT-PCR (Life Technologies) following the manufacture’s protocol. Quantitative RT-PCR was performed using Kapa SYBR Fast (Sigma). The following primers were used:
CA9-for: GGATCTACCTACTGTTGAGGCT;
CA9-rev: CATAGCGCCAATGACTCTGGT;
NDRG1-for: GTCCTTATCAACGTGAACCCTT;
NDRG1-rev: GCATTGGTCGCTCAATCTCCA;
EGLN3-for: CTGGGCAAATACTACGTCAAGG;
EGLN3-rev: GACCATCACCGTTGGGGTT;
FABP7-for: GGCTTTGCCACTAGGCAGG;
FABP7-rev: TGACCACTTTGTCTCCTTCTTGA;
TBP-for: GAGCTGTGATGTGAAGTTTCC;
TBP-rev: TCTGGGTTTGATCATTCTGTAG.
Primers for SERPINE1, TNFAIP6, S100A6, LGALS1, MUC1 and 18s have been described before (Fedele et al., 2017).
CAPN2 gene expression analysis in BTSCs
Gene expression analysis of BTSCs was described before (Marques et al., 2021). Box plots showing comparison of CAPN2 gene expression levels (from microarray and qPCR analysis) in BTSCs with and without ZBTB18 SF was performed using BoxPlotR (Spitzer et al., 2014).
Long read RNA sequencing
We performed mRNA purification from total RNA samples using the Dynabeads mRNA Purification Kit (Thermo Fisher Scientific, Carlsbad, USA). Reverse transcription reaction was performed using SuperScript IV reverse transcriptase (Thermo Fisher Scientific, Carlsbad, USA). We prepared the libraries using the Low Input by PCR Barcoding Kit and the cDNA-PCR Sequencing Kit (Oxford Nanopore Technologies, Oxford, United Kingdom) as recommended by the manufacturer. RNA sequencing was performed using the MinION Sequencing Device, the SpotON Flow Cell and MinKNOW software (Oxford Nanopore Technologies, Oxford, United Kingdom) according to the manufacturer’s instructions. Samples were sequenced for 48h on two flow-cells. Basecalling was performed by Albacore implemented in the nanopore software. Postprocessing was performed using the NanoPoreSeq pipeline, available at github (https://github.com/heilandd/NanoPoreSeq) (Heiland et al., 2018). Analysis was performed by the VisLab a framework for interactive analysis of RNA-seq data (https://github.com/-heilandd/Vis_Lab1.5). Read-per-gene raw count were normalized to the library size and processed with the limma-voom (Ritchie et al., 2015) RNAseq pipeline to identify differentially expressed genes. Adjusted p value (Benjamini & Hochberg) below 0.05 was considered as significant.
A gene-sets enrichment analysis was performed using the Generally Applicable Gene-set Enrichment (GAGE) R package on the MSigDB (Luo et al., 2009; Subramanian et al., 2005). Two-sample t-test with unpaired design was used to test the differential expression of gene-sets. Significance threshold was set to adjusted p value <0.05. GEO accession number GEO: GSE184890.
Immunoblotting
Total protein extracts were prepared as previously described (Fedele et al., 2017). For lysates preparation from frozen GBM samples, small pieces in the range of 0.02 to 0.05 grams were selected, washed with cold PBS Buffer and then treated with RIPA buffer, containing Phosphatase/Protease Inhibitors and PMSF. The tissues were disrupted using pestles and then processed according to our standard protocol (Fedele et al., 2017). Cytoplasmic and nuclear extracts were prepared using a Nuclear Extract Kit (Active Motif) according to the manufacturer’s instructions. Western blots were performed using the following antibodies: anti-ZBTB18 (Abcam # ab118471); anti-ZNF238 (Sigma # SAB1406998); anti-FLAG M2 (Sigma #F1804); anti-FLAG (Cell Signaling Technologies #14793), anti-HA (Abcam ##18181), anti-CTBP1 (BD Biosciences #612042); anti-CTBP2 (BD Biosciences #612044); anti-CAPN2 (Cell Signaling Technologies #2539S); anti-CAST (Cell Signaling #4146S) anti-alpha Tubulin (Abcam #ab7291) and anti-Laminin B (Santa Cruz #sc-6216), anti Lamin A/C (Cell Signaling Technologies ##4777). The quantification of western blot bands was performed using the ImageJ software (Biorad) and normalized to the level of αTubulin.
Identification of PEST site
Protein sequences were individually loaded in the EMBOSS program ePESTfind tool1using the standard settings.
Site directed mutagenesis and cloning
Site-Directed Mutagenesis was carried out using Agilent Technologies QuikChange II XL Site-Directed Mutagenesis Kit. Primers were designed according to the protocol. The following primers were used:
ZBTB18_NLVmut F:
CCTCTTTCTCCACCTTCACCTGCCACCAGAAGCTTCTCAGCACGTCCTGTGAAG; ZBTB18_NLVmut R:
CTTCACAGGACGTGCTGAGAAGCTTCTGGTGGCAGGTGAAGGTGGAGAAAGAGG.
Deletion of a PEST sequence located upstream the cleavage site was achieved as follows. The two regions flanking the PEST sequence were amplified by PCR using specific primers containing suitable restrictions enzymes. The following primers were used for fragment 1:
BstXI-flag-hZBTB18v1-for:
CAAGGCCCACAACCATGGATGGACTACAAGGACGACGATGACAAGTGTCCTAAAGGTTATGAAGACAG; ZBTB18-delPEST-NcoI-rev:
CAAGGTCCATGGGTGGCTGCTGCCATCGGAGAG.
For fragment 2 the following primers were used:
ZNF238-delPEST-for:
GCCTTGCCATGGAAATTGAACATCCTGCCCAGC; NCOI and PmeI-His-hZBTB18-antisense:
GCCTTGGTTTAAACTTAGTGATGGTGGTGATGGTGTTTCCAAAGTTCTTGAGAGCTA.
The PCR fragments were gel extracted, digested with BstXI and NcoI (fragment 1) or with NcoI and PmeI (fragment 2) and used to perform a three fragments ligation with the pCHMWS vector previously linearized with BstXI and PmeI. The deletion of the PEST sequence was verified by Sanger sequencing. For the PESTdel-NLVmut vector, the ZBTB18-PESTdel construct was used as template for site directed mutagenesis using the NLV mut primers described above.
Invasion, migration, proliferation and apoptosis assay
For migration assay, laminin coated (Invitrogen, 4 μg/mL) 60mm dishes containing a culture insert (Ibidi) were used. The assay was conducted according to the manufacturer’s instruction and images of migrating cells were taken every 24 hours. Cell migration was calculated using the following formula: (Pre-Migration Area – Migration Area)/Pre-Migration Area X100).
For invasion assay, 2.5x10⁴ SNB19 cells were seeded in triplicates in the upper compartment of BioCoat Matrigel Invasion Chambers (Cornig). PDGF-BB (20 ng/mL, R&D) was used as a chemoattractant. Pictures were acquired using an Axioimager 2 Microscope (Zeiss). The assays were validated in two independent experiments.
Cell proliferation was assessed using a commercially available kit for EdU detection (EdU Cell proliferation assay, base click). Cells were plated at a density of 2.0x10⁴ per well in a 24 well microplates containing laminin-coated coverslips. After 24 hours of seeding, cells were incubated with EdU solution overnight following the manufacturer’s instructions. Upon EdU detection, images were acquired using a fluorescent microscope (Axiovert, Zeiss).
For apoptosis assay, transduced SNB19 cells were seeded in a 96 well (dark plate) at a density of 1x10³ per well. The following day activity of caspases 3 and 7 was measured using the Caspase-Glo® 3/7 Assay (Promega), according to the manufacturer’s instruction.
Immunostaining and lipid staining
SNB19 cells were grown in 4-well chamber slides either with 10% FBS DMEM or 10% lipid-depleted FBS (Biowest) DMEM for 48 hours. BTSC cells were grown in 4-well chamber slides in complete Neurobasal medium, as previously described. For lipid starvation SNB19 cells were kept for additional 2 hours either in 10% lipid-depleted FBS DMEM or in 10% FBS DMEM. All cells were then fixed with 4% paraformaldehyde in PBS and processed for the staining. FLAG-ZBTB18 (FL or Nte) was labeled with anti-FLAG M2 monoclonal primary antibody (Sigma #F1804). CTBP2 was labeled with anti-CTBP2 mouse monoclonal antibody (BD Biosciences # 612044). Lipid droplets were stained with anti-Perilipin-3 rabbit polyclonal antibody (Abcam #ab47638) (SNB19 cells), or with 0.5μg/ml Bodipy TMR-X SE (Thermo Fisher Scientific, #D6117) in 150mM NaCl for 10 minutes at room temperature (BTSC475). Nuclei were counterstained with 4′,6-diamidino-2-phenylindole (DAPI, Sigma-Aldrich). Pictures were acquired using a FSL confocal microscope (Olympus).
Lipid uptake
BTSC475 cells were seeded in 4-well chamber slides and infected as described above. The cells were then incubated with 50nM Bodipy-C12 (Thermo Fisher Scientific, #D3822) in PBS for 15 minutes at room temperature. Subsequently, the samples were fixed with 4% paraformaldehyde in PBS, counterstained with DAPI and imaged using a FSL confocal microscope (Olympus).
Metabolic assays
Oxygen consumption rate (OCR) and extracellular acidification rate (ECAR) were measured using the Seahorse XFe 96 Extraflux Analyzer (Agilent Technologies, Lexington, MA) to evaluate mitochondrial respiration and glycolysis, respectively. The assays were carried on according to manufacturer’s instructions. Briefly, the cells (SNB19 expressing EV, ZBTB18 FL, or ZBTB18 SF Nte) were plated at 50,000 cells/well and allowed to adhere overnight. BTSC475 were seeded at 100,000 cells/well Then, the medium was changed over to Seahorse XF DMEM base medium, without phenol red (Agilent) supplemented with 10 mM Glucose (omitted in ECAR samples), 2 mM Glutamine, and 1 mM Sodium Pyruvate pH 7.4. Then, metabolic parameters were measured using the Seahorse XF Cell Mito Stress Test Kit (Agilent, #103015-100), Seahorse XF Glycolysis Stress Test Kit (Agilent, #103020-100), and Seahorse XF Real-Time ATP Rate Assay (Agilent, #103592-100). OCR analysis was performed recording the basal values and then the values after each of the following injections: 3 μM oligomycin (final concentration), 0.5 μM CCCP (final), and 2.5 μM rotenone/2μM antimycin (final). ECAR analysis was performed recording the basal values and then the values after each of the following injections: 10mM glucose (final), 3 μM oligomycin (final), and 50mM 2-deoxy-D-glucose (final). ATP production rate assay was performed recording the basal values and then the values after each of the following injections: 3 μM oligomycin (final concentration), and 2.5 μM rotenone/2μM antimycin (final).
Quantification and statistical analysis
For the statistical analysis of the RT-qPCR data are judged to be statistically significant when p < 0.05 by two-tailed Student’s t test. The number of replicates and the definition of biological versus technical replicates is indicated in each Figure legends.
Acknowledgments
We thank, Elena Sindram, Mahmoud Abdelkarim, Anna Hudek, Jacob Helm, and Jonathan Goldner, for technical assistance. We thank Veronica Dumit and Lisa Winner (University of Freiburg, ZBSA) for MS analysis. We are grateful to Oliver Gorka and Olaf Gross for support with Seahorse analysis and to Anna Kostina for help with cell live imaging. This work was supported by the German’s Cancer Aid grant (Deutsche Krebshilfe, 70113120) to MSC. Additional funding to MB by the Deutsche Forschungsgemeinschaft (DFG, German Research Foundation) – SFB 850 subprojects C9 and Z1 and SFB-1479 – Project ID: 441891347- S1, the German Federal Ministry of Education and Research by MIRACUM within the Medical Informatics Funding Scheme (FKZ 01ZZ1801B).
Author contributions
Conceptualization, MSC; Investigation, APM, RS, RF, SY, IVH, EK, and FD; Formal analysis and data curation, GA, MB, DHH, and OS; Resources, OS; Supervision, MSC, RF; Funding acquisition, MSC, MB; Project administration, MSC; Visualization, RF, MSC; Writing - original draft, MSC, RF; Writing - review & editing, MSC, RF.
Declaration of interests
The authors declare no competing interests.
Published: July 15, 2022
Footnotes
Supplemental information can be found online at https://doi.org/10.1016/j.isci.2022.104625.
Supplemental information
Data and code availability
-
•
Single-cell RNA-seq data have been deposited at GEO and are publicly available as of the date of publication. The protein interactions from this publication have been submitted to the IMEx (www.imexconsortium.org) consortium through IntAct. (Orchard et al., 2014). Accession numbers are listed in the key resources table. Original western blot images have been deposited at Mendeley and are publicly available as of the date of publication. The DOI is listed in the key resources table. Microscopy data reported in this paper will be shared by the lead contact upon request.
-
•
This paper does not report original code.
-
•
Any additional information required to reanalyze the data reported in this paper is available from the lead contact upon request.
References
- Babcock D.F., First N.L., Lardy H.A. Action of ionophore A23187 at the cellular level. Separation of effects at the plasma and mitochondrial membranes. J. Biol. Chem. 1976;251:3881–3886. doi: 10.1016/s0021-9258(17)33330-6. [DOI] [PubMed] [Google Scholar]
- Bensaad K., Favaro E., Lewis C.A., Peck B., Lord S., Collins J.M., Pinnick K.E., Wigfield S., Buffa F.M., Li J.L., et al. Fatty acid uptake and lipid storage induced by HIF-1α contribute to cell growth and survival after hypoxia-reoxygenation. Cell Rep. 2014;9:349–365. doi: 10.1016/j.celrep.2014.08.056. [DOI] [PubMed] [Google Scholar]
- Carro M.S., Lim W.K., Alvarez M.J., Bollo R.J., Zhao X., Snyder E.Y., Sulman E.P., Anne S.L., Doetsch F., Colman H., et al. The transcriptional network for mesenchymal transformation of brain tumours. Nature. 2010;463:318–325. doi: 10.1038/nature08712. [DOI] [PMC free article] [PubMed] [Google Scholar]
- Conacci-Sorrell M., Ngouenet C., Eisenman R.N. Myc-nick: a cytoplasmic cleavage product of Myc that promotes alpha-tubulin acetylation and cell differentiation. Cell. 2010;142:480–493. doi: 10.1016/j.cell.2010.06.037. [DOI] [PMC free article] [PubMed] [Google Scholar]
- Cortesio C.L., Boateng L.R., Piazza T.M., Bennin D.A., Huttenlocher A. Calpain-mediated proteolysis of paxillin negatively regulates focal adhesion dynamics and cell migration. J. Biol. Chem. 2011;286:9998–10006. doi: 10.1074/jbc.m110.187294. [DOI] [PMC free article] [PubMed] [Google Scholar]
- duVerle D., Takigawa I., Ono Y., Sorimachi H., Mamitsuka H. CaMPDB: a resource for calpain and modulatory proteolysis. Genome. Inform. 2010;22:202–213. [PubMed] [Google Scholar]
- duVerle D.A., Mamitsuka H. CalCleaveMKL: a tool for calpain cleavage prediction. Methods. Mol. Biol. 2019;1915:121–147. doi: 10.1007/978-1-4939-8988-1_11. [DOI] [PubMed] [Google Scholar]
- Fedele V., Dai F., Masilamani A.P., Heiland D.H., Kling E., Gätjens-Sanchez A.M., Ferrarese R., Platania L., Soroush D., Kim H., et al. Epigenetic regulation of ZBTB18 promotes glioblastoma progression. Mol. Cancer Res. 2017:998–1011. doi: 10.1158/1541-7786.MCR-16-0494. [DOI] [PMC free article] [PubMed] [Google Scholar]
- Ferrarese R., Izzo A., Andrieux G., Lagies S., Bartmuss J.P., Masilamani A.P., Wasilenko A., Osti D., Faletti S., Schulzki R., et al. ZBTB18 inhibits SREBP-dependent fatty acid synthesis by counteracting CTBPs and KDM1A/LSD1 activity in glioblastoma. BioRxiv. 2021 doi: 10.1101/2020.04.17.046268. Preprint at. [DOI] [PMC free article] [PubMed] [Google Scholar]
- Hanahan D., Weinberg R.A. Hallmarks of cancer: the next generation. Cell. 2011;144:646–674. doi: 10.1016/j.cell.2011.02.013. [DOI] [PubMed] [Google Scholar]
- Hanna R.A., Campbell R.L., Davies P.L. Calcium-bound structure of calpain and its mechanism of inhibition by calpastatin. Nature. 2008;456:409–412. doi: 10.1038/nature07451. [DOI] [PubMed] [Google Scholar]
- Heiland D.H., Gaebelein A., Börries M., Wörner J., Pompe N., Franco P., Heynckes S., Bartholomae M., hAilín D.Ó., Carro M.S., et al. Microenvironment-derived regulation of HIF signaling drives transcriptional heterogeneity in glioblastoma multiforme. Mol. Cancer Res. 2018;16:655–668. doi: 10.1158/1541-7786.mcr-17-0680. [DOI] [PubMed] [Google Scholar]
- Ibrahimi A., Velde G.V., Reumers V., Toelen J., Thiry I., Vandeputte C., Vets S., Deroose C., Bormans G., Baekelandt V., et al. Highly efficient multicistronic lentiviral vectors with peptide 2A sequences. Hum. Gene. Ther. 2009;20:845–860. doi: 10.1089/hum.2008.188. [DOI] [PubMed] [Google Scholar]
- Kaloshi G., Mokhtari K., Carpentier C., Taillibert S., Lejeune J., Marie Y., Delattre J.Y., Godbout R., Sanson M. FABP7 expression in glioblastomas: relation to prognosis, invasion and EGFR status. J. Neuro-Oncol. 2007;84:245–248. doi: 10.1007/s11060-007-9377-4. [DOI] [PubMed] [Google Scholar]
- Kim M.J., Jo D.G., Hong G.S., Kim B.J., Lai M., Cho D.H., Kim K.W., Bandyopadhyay A., Hong Y.M., Kim D.H., et al. Calpain-dependent cleavage of cain/cabin1 activates calcineurin to mediate calcium-triggered cell death. Proc. Natl. Acad. Sci. USA. 2002;99:9870–9875. doi: 10.1073/pnas.152336999. [DOI] [PMC free article] [PubMed] [Google Scholar]
- Klein T., Eckhard U., Dufour A., Solis N., Overall C.M. Proteolytic cleavage-mechanisms, function, and "omic" approaches for a near-ubiquitous posttranslational modification. Chem. Rev. 2018;118:1137–1168. doi: 10.1021/acs.chemrev.7b00120. [DOI] [PubMed] [Google Scholar]
- Kling T., Ferrarese R., Ó hAilín D., Johansson P., Heiland D.H., Dai F., Vasilikos I., Weyerbrock A., Jörnsten R., Carro M.S., Nelander S. Integrative modeling reveals annexin A2-mediated epigenetic control of mesenchymal glioblastoma. EBioMedicine. 2016;12:72–85. doi: 10.1016/j.ebiom.2016.08.050. [DOI] [PMC free article] [PubMed] [Google Scholar]
- Lee K., Kang J.E., Park S.K., Jin Y., Chung K.S., Kim H.M., Lee K., Kang M.R., Lee M.K., Song K.B., et al. LW6, a novel HIF-1 inhibitor, promotes proteasomal degradation of HIF-1α via upregulation of VHL in a colon cancer cell line. Biochem. Pharmacol. 2010;80:982–989. doi: 10.1016/j.bcp.2010.06.018. [DOI] [PubMed] [Google Scholar]
- Lewis C.A., Brault C., Peck B., Bensaad K., Griffiths B., Mitter R., Chakravarty P., East P., Dankworth B., Alibhai D., et al. SREBP maintains lipid biosynthesis and viability of cancer cells under lipid- and oxygen-deprived conditions and defines a gene signature associated with poor survival in glioblastoma multiforme. Oncogene. 2015;34:5128–5140. doi: 10.1038/onc.2014.439. [DOI] [PubMed] [Google Scholar]
- Lum J.J., Bui T., Gruber M., Gordan J.D., DeBerardinis R.J., Covello K.L., Simon M.C., Thompson C.B. The transcription factor HIF-1α plays a critical role in the growth factor-dependent regulation of both aerobic and anaerobic glycolysis. Genes Develop. 2007;21:1037–1049. doi: 10.1101/gad.1529107. [DOI] [PMC free article] [PubMed] [Google Scholar]
- Luo W., Friedman M.S., Shedden K., Hankenson K.D., Woolf P.J. GAGE: generally applicable gene set enrichment for pathway analysis. BMC. Bioinf. 2009;10:161. doi: 10.1186/1471-2105-10-161. [DOI] [PMC free article] [PubMed] [Google Scholar]
- Marques C., Unterkircher T., Kroon P., Oldrini B., Izzo A., Dramaretska Y., Ferrarese R., Kling E., Schnell O., Nelander S., et al. NF1 regulates mesenchymal glioblastoma plasticity and aggressiveness through the AP-1 transcription factor FOSL1. Elife. 2021;10:e64846. doi: 10.7554/elife.64846. [DOI] [PMC free article] [PubMed] [Google Scholar]
- McGinnis K.M., Whitton M.M., Gnegy M.E., Wang K.K. Calcium/calmodulin-dependent protein kinase IV is cleaved by caspase-3 and calpain in SH-SY5Y human neuroblastoma cells undergoing apoptosis. J. Biol. Chem. 1998;273:19993–20000. doi: 10.1074/jbc.273.32.19993. [DOI] [PubMed] [Google Scholar]
- Moretti D., Del Bello B., Allavena G., Maellaro E. Calpains and cancer: friends or enemies? Arch. Biochem. Biophys. 2014;564:26–36. doi: 10.1016/j.abb.2014.09.018. [DOI] [PubMed] [Google Scholar]
- Nibu Y., Levine M.S. CtBP-dependent activities of the short-range Giant repressor in the Drosophila embryo. Proc. Natl. Acad. Sci. USA. 2001;98:6204–6208. doi: 10.1073/pnas.111158298. [DOI] [PMC free article] [PubMed] [Google Scholar]
- Ono Y., Sorimachi H. Calpains: an elaborate proteolytic system. Biochim. Biophys. Acta. 2012;1824:224–236. doi: 10.1016/j.bbapap.2011.08.005. [DOI] [PubMed] [Google Scholar]
- Orchard S., Ammari M., Aranda B., Breuza L., Briganti L., Broackes-Carter F., Campbell N.H., Chavali G., Chen C., del-Toro N., et al. The MIntAct project--IntAct as a common curation platform for 11 molecular interaction databases. Nucleic. Acids. Res. 2014;42:D358–D363. doi: 10.1093/nar/gkt1115. [DOI] [PMC free article] [PubMed] [Google Scholar]
- Phillips H.S., Kharbanda S., Chen R., Forrest W.F., Soriano R.H., Wu T.D., Misra A., Nigro J.M., Colman H., Soroceanu L., et al. Molecular subclasses of high-grade glioma predict prognosis, delineate a pattern of disease progression, and resemble stages in neurogenesis. Cancer. Cell. 2006;9:157–173. doi: 10.1016/j.ccr.2006.02.019. [DOI] [PubMed] [Google Scholar]
- Piatkov K.I., Oh J.H., Liu Y., Varshavsky A. Calpain-generated natural protein fragments as short-lived substrates of the N-end rule pathway. Proc. Natl. Acad. Sci. USA. 2014;111:E817–E826. doi: 10.1073/pnas.1401639111. [DOI] [PMC free article] [PubMed] [Google Scholar]
- Piret J.P., Mottet D., Raes M., Michiels C. CoCl2, a chemical inducer of hypoxia-inducible factor-1, and hypoxia reduce apoptotic cell death in hepatoma cell line HepG2. Ann. N. Y. Acad. Sci. 2002;973:443–447. doi: 10.1111/j.1749-6632.2002.tb04680.x. [DOI] [PubMed] [Google Scholar]
- Ritchie M.E., Phipson B., Wu D., Hu Y., Law C.W., Shi W., Smyth G.K. Limma powers differential expression analyses for RNA-sequencing and microarray studies. Nucleic. Acids. Res. 2015;43:e47. doi: 10.1093/nar/gkv007. [DOI] [PMC free article] [PubMed] [Google Scholar]
- Ruan K., Song G., Ouyang G. Role of hypoxia in the hallmarks of human cancer. J. Cell. Biochem. 2009;107:1053–1062. doi: 10.1002/jcb.22214. [DOI] [PubMed] [Google Scholar]
- Shumway S.D., Maki M., Miyamoto S. The PEST domain of IκBα is necessary and sufficient forin vitro degradation by μ-calpain. J. Biol. Chem. 1999;274:30874–30881. doi: 10.1074/jbc.274.43.30874. [DOI] [PubMed] [Google Scholar]
- Spitzer M., Wildenhain J., Rappsilber J., Tyers M. BoxPlotR: a web tool for generation of box plots. Nat. Methods. 2014;11:121–122. doi: 10.1038/nmeth.2811. [DOI] [PMC free article] [PubMed] [Google Scholar]
- Storr S.J., Carragher N.O., Frame M.C., Parr T., Martin S.G. The calpain system and cancer. Nat. Rev. Cancer. 2011;11:364–374. doi: 10.1038/nrc3050. [DOI] [PubMed] [Google Scholar]
- Subramanian A., Tamayo P., Mootha V.K., Mukherjee S., Ebert B.L., Gillette M.A., Paulovich A., Pomeroy S.L., Golub T.R., Lander E.S., Mesirov J.P. Gene set enrichment analysis: a knowledge-based approach for interpreting genome-wide expression profiles. Proc. Natl. Acad. Sci. USA. 2005;102:15545–15550. doi: 10.1073/pnas.0506580102. [DOI] [PMC free article] [PubMed] [Google Scholar]
- Tatard V.M., Xiang C., Biegel J.A., Dahmane N. ZNF238 is expressed in postmitotic brain cells and inhibits brain tumor growth. Cancer. Res. 2010;70:1236–1246. doi: 10.1158/0008-5472.can-09-2249. [DOI] [PubMed] [Google Scholar]
- Toescu E.C. Hypoxia sensing and pathways of cytosolic Ca2+ increases. Cell. Calcium. 2004;36:187–199. doi: 10.1016/j.ceca.2004.02.019. [DOI] [PubMed] [Google Scholar]
- Tucci S., Mingirulli N., Wehbe Z., Dumit V.I., Kirschner J., Spiekerkoetter U. Mitochondrial fatty acid biosynthesis and muscle fiber plasticity in very long-chain acyl-CoA dehydrogenase-deficient mice. FEBS. Lett. 2018;592:219–232. doi: 10.1002/1873-3468.12940. [DOI] [PubMed] [Google Scholar]
- Wang L., Zhou H., Wang Y., Cui G., Di L.J. CtBP maintains cancer cell growth and metabolic homeostasis via regulating SIRT4. Cell Death Dis. 2015;6 doi: 10.1038/cddis.2014.587. [DOI] [PMC free article] [PubMed] [Google Scholar]
- Wang N., Chen W., Linsel-Nitschke P., Martinez L.O., Agerholm-Larsen B., Silver D.L., Tall A.R. A PEST sequence in ABCA1 regulates degradation by calpain protease and stabilization of ABCA1 by apoA-I. J. Clin. Invest. 2003;111:99–107. doi: 10.1172/jci200316808. [DOI] [PMC free article] [PubMed] [Google Scholar]
- Wang Q., Hu B., Hu X., Kim H., Squatrito M., Scarpace L., deCarvalho A.C., Lyu S., Li P., Li Y., et al. Tumor evolution of glioma-intrinsic gene expression subtypes associates with immunological changes in the microenvironment. Cancer. Cell. 2017;32:42–56.e6. doi: 10.1016/j.ccell.2017.06.003. [DOI] [PMC free article] [PubMed] [Google Scholar]
- Wendt A., Thompson V.F., Goll D.E. Interaction of calpastatin with calpain: a review. Biol. Chem. 2004;385:465–472. doi: 10.1515/bc.2004.054. [DOI] [PubMed] [Google Scholar]
- Wu X., Geng F., Cheng X., Guo Q., Zhong Y., Cloughesy T.F., Yong W.H., Chakravarti A., Guo D. Lipid droplets maintain energy homeostasis and glioblastoma growth via autophagic release of stored fatty acids. iScience. 2020;23 doi: 10.1016/j.isci.2020.101569. [DOI] [PMC free article] [PubMed] [Google Scholar]
- Xiang C., Frietze K.K., Bi Y., Li Y., Dal Pozzo V., Pal S., Alexander N., Baubet V., D'Acunto V., Mason C.E., et al. RP58 represses transcriptional programs linked to nonneuronal cell identity and glioblastoma subtypes in developing neurons. Mol. Cell. Biol. 2021;41 doi: 10.1128/mcb.00526-20. [DOI] [PMC free article] [PubMed] [Google Scholar]
- Xie Y., Bergström T., Jiang Y., Johansson P., Marinescu V.D., Lindberg N., Segerman A., Wicher G., Niklasson M., Baskaran S., et al. The human glioblastoma cell culture resource: validated cell models representing all molecular subtypes. EBioMedicine. 2015;2:1351–1363. doi: 10.1016/j.ebiom.2015.08.026. [DOI] [PMC free article] [PubMed] [Google Scholar]
- Zhong Xu L., Sánchez R., Sali A., Heintz N. Ligand specificity of brain lipid-binding protein. J. Biol. Chem. 1996;271:24711–24719. doi: 10.1074/jbc.271.40.24711. [DOI] [PubMed] [Google Scholar]
- Zheng X., Zhou A.X., Rouhi P., Uramoto H., Borén J., Cao Y., Pereira T., Akyürek L.M., Poellinger L. Hypoxia-induced and calpain-dependent cleavage of filamin A regulates the hypoxic response. Proc. Natl. Acad. Sci. USA. 2014;111:2560–2565. doi: 10.1073/pnas.1320815111. [DOI] [PMC free article] [PubMed] [Google Scholar]
Associated Data
This section collects any data citations, data availability statements, or supplementary materials included in this article.
Supplementary Materials
Data Availability Statement
-
•
Single-cell RNA-seq data have been deposited at GEO and are publicly available as of the date of publication. The protein interactions from this publication have been submitted to the IMEx (www.imexconsortium.org) consortium through IntAct. (Orchard et al., 2014). Accession numbers are listed in the key resources table. Original western blot images have been deposited at Mendeley and are publicly available as of the date of publication. The DOI is listed in the key resources table. Microscopy data reported in this paper will be shared by the lead contact upon request.
-
•
This paper does not report original code.
-
•
Any additional information required to reanalyze the data reported in this paper is available from the lead contact upon request.