

Abstract
Invasive cancer growth and metastasis account for the poor prognosis of high‐grade breast cancer. Recently, we reported that kinectin 1 (KTN1), a member of the kinesin‐binding protein family, promotes cell invasion of triple‐negative breast cancer and high‐grade breast cancer cells by augmenting the NF‐κB signaling pathway. However, the upstream mechanism regulating KTN1 is unknown. Therefore, this functional study was performed to decipher the regulatory cohort of KTN1 in high‐grade breast cancer. Bioinformatic analysis indicated that transcription factor Yin Yang 1 (YY1) was a potential transactivator of KTN1. High YY1 expression correlated positively with pathological progression and poor prognosis of high‐grade breast cancer. Additionally, YY1 promoted cell invasive growth both in vitro and in vivo, in a KTN1‐dependent manner. Mechanistically, YY1 could transactivate the KTN1 gene promoter. Alternatively, YY1 could directly interact with a co‐factor, DEAD‐box helicase 3 X‐linked (DDX3X), which significantly co‐activated YY1‐mediated transcriptional expression of KTN1. Moreover, DDX3X augmented YY1‐KTN1 signaling‐promoted invasive cell growth of breast cancer. Importantly, overexpression of YY1 enhanced tumor aggressive growth in a mouse breast cancer model. Our findings established a novel DDX3X‐assisted YY1‐KTN1 regulatory axis in breast cancer progression, which could lead to the development novel therapeutic targets for breast cancer.
Keywords: breast cancer, DDX3X, growth, invasion, KTN1, YY1
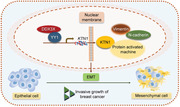
Invasive cancer cell growth and metastasis accounts for the poor prognosis of high‐grade breast cancer. The transcription factor Yin Yang 1 (YY1) is upregulated in high‐grade breast cancer. YY1 interacted with DEAD‐box protein (DDX3X) via binding to DDX3X. YY1 transactivated KTN1 gene via direct binding its promoter together with the DDX3X. Herein, our findings established a novel YY1‐assisted DDX3X‐KTN1 regulatory axis, which would shed some light on the signaling involved in cell invasion and progression in breast cancer and open an avenue in finding novel therapeutic targets for breast cancer.
1. INTRODUCTION
Despite of the marked improvement in the targeted therapy in recent decades, breast cancer (BCa) remains an incurable disease in its advanced stage. 1 Pathologically, BCa grade depends on the degree of differentiation of cancer tissues, and invasive tumor growth and metastasis accounts for the progression and relapse of most BCa. 2 Recent studies have uncovered multiple genes and signaling pathways that regulate the progression of BCa. 3 , 4
Kinectin (KTN1) is a kinesin‐binding protein that can modulate the reorganization of micro‐tubules and intracellular organelle transport. 5 , 6 Studies have demonstrated that elevated KTN1 expression correlates positively with disease progression in many cancer types, such as bladder cancer, cutaneous squamous cell carcinoma, and BCa. 7 , 8 , 9 Moreover, KTN1 overexpression could promote cell proliferation and migration in cutaneous squamous cancer cells, indicating a functional role of KTN1 in invasive tumor growth. Our previous findings also confirmed that KTN1 can phosphorylate NF‐kappa B (NF‐κB) p65 subunit by combining specifically with p65, and the complex accelerated BCa growth via transactivating C–X–C motif chemokine ligand 8 (CXCL8). 9 Additionally, high KTN1 expression correlated positively with the expression levels of mesenchymal biomarkers, whereas it inhibited the expression of epithelial biomarkers in BCa. However, the molecular mechanism needs to be further determined.
Yin Yang 1 (YY1), a zinc finger protein, is a member of the GLI‐Kruppel family. 10 As a transcription factor, its downstream target genes are involved in series of the cellular process in tumor progression, including cell proliferation, invasion, metastasis, and angiogenesis. 11 Structurally, YY1 has an activation or inhibition domain, which is in N‐terminus or C‐terminus, respectively. 11 Therefore, YY1 can activate or repress the transcription of its downstream genes depending on the binding of its interacting co‐factor to the promoters of these targeted genes. 12 Increasing evidence suggests that YY1 can promote the development and progression of many cancers. 13 However, its functional role in BCa progression is controversial. 14 YY1 can promote Erb‐B2 receptor tyrosine kinase 2 (ERBB2) subtype of BCa invasion by upregulating the expression of ERBB2 in co‐operation with its transcriptional co‐activator activator protein 2 (AP‐2). 15 , 16 Alternatively, YY1 can suppress cell proliferation via breast cancer type 1 susceptibility protein (BRCA1) expression in BCa. YY1 can bind to and regulate the BRCA1 promoter positively. 11 However, the exact function of YY1 in high‐grade BCa, especially in the invasive growth of BCa, needs to be clarified.
DDX3X (encoding DEAD‐box helicase 3X‐linked, also known as DDX3X, DDX3, DBX) belongs to the DEAD‐box helicase gene family. Accumulating evidence indicates that DDX3X plays an essential role in embryonic development and cancer progression, modulating multiple biological processes, such as gene transcription, pre‐mRNA splicing, and protein translation. 17 Recent studies revealed that upregulated expression of DDX3X in BCa could promote tumorigenesis and cell proliferation by accelerating the cell cycle. 18 Moreover, depletion of DDX3X in BCa cells inhibited its lung metastasis. 19 These findings suggested a pro‐oncogenic role of DDX3X in BCa progression. 20
In our study, we aimed to determine whether YY1 is a key transcription factor and positive regulator of KTN1 transcription. Upregulated YY1 expression was linked strongly to poor outcome of high‐grade BCa. We also identified that DDX3X could augment YY1‐KTN1 signaling‐mediated BCa invasive growth by interacting with YY1 and co‐activating YY1‐induced transcription of KTN1 in BCa cells. These findings clarified a pro‐oncogenic role of YY1 in high‐grade BCa, in which it binds to DDX3X to promote the aggressive growth of BCa by activating KTN1. Our findings could facilitate unraveling the molecular basis of BCa progression and the development novel treatment strategies to overcome this disease.
2. RESULTS
2.1. YY1 is a potential upstream transcription factor of KTN1 in high‐grade BCa
A previous study suggested that upregulation of KTN1 promoted BCa malignancy. 9 To explore the upstream regulatory mechanism of KTN1 regulation, the expression levels of KTN1 were analyzed in different pathologically grades of BCa using immunohistochemistry (IHC) staining [Grade I (a total score of 3–5, well differentiated), Grade II (a total score of 6–7, moderately differentiated), and Grade III (a total score of 8–9, poorly differentiated)]. The results showed that KTN1 protein levels were high in Grade I‐III BCa tissues compared with that in adjacent normal tissues, particular among Grade III samples. Furthermore, KTN1 protein staining was confirmed to increase gradually with histological grade (Figure 1A).
FIGURE 1.
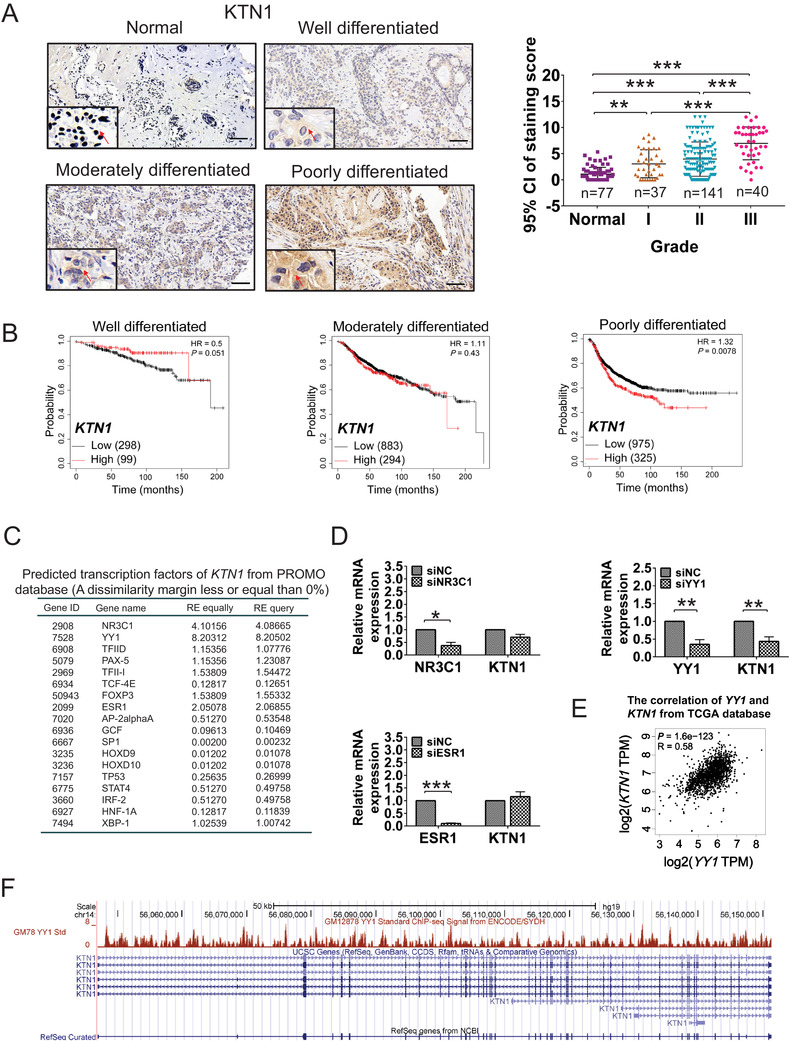
YY1 was an underlying transcription factor that regulates KTN1 expression in high‐grade breast cancer (BCa). (A) Immunohistochemistry (IHC) staining of KTN1 in BCa tissues. Grade I (a total score of 3–5, well differentiated), Grade II (a total score of 6–7, moderately differentiated), and Grade III (a total score of 8–9, poorly differentiated). Positive signals (brown staining) of KTN1 are indicated by arrow heads. The number of cases is indicated below. All data were plotted as the means of the 95% confidence interval plus the s.d. (B) Kaplan–Meier analysis of well differentiated, moderately differentiated, and poorly differentiated tumors for relapse‐free survival (RFS) with high versus low expression levels of KTN1 mRNA. (C) Bioinformatic analysis of predicted upstream transcription factors of KTN1 from the PROMO database. (D), NR3C1, ESR1, YY1, and KTN1 expression was identified by qRT‐PCR in MDA‐MB‐231 cells treated with siRNA oligonucleotides and negative control group (siNC) oligonucleotides, respectively. (E) The correlation analysis between YY1 and KTN1 expression from the GEPIA database (R = 0.58, P = 1.6e−123). (F) Coverage plot analysis of the transcription start site and promoter site of the KTN1 gene based on Chromatin Immunoprecipitation‐sequencing (ChIP‐seq) assay from Richard Myers data from the UCSC database. Error bars are shown with the s.d., n ≥ 3. * P < 0.05, ** P < 0.01 and *** P < 0.001 compared with the negative control groups. A two‐tailed t‐test or ANOVA was used to assess the P‐values. Scale bars, 100 μm
To reveal the interrelation between KTN1 and histological grades in clinical prognosis of BCa, we performed the outcomes of BCa patients through the Kaplan–Meier plotter online. The results identified that upregulated expression of KTN1 mRNA was associated with poor clinical prognosis accompanied by progression of BCa (Grade I, P = 0.051; Grade II, P = 0.43; Grade III, P = 0.0078, Figure 1B). These findings indicated that KTN1 might be a prognostic biomarker for high‐grade BCa and promotes BCa tumorigenesis.
To investigate the upstream transcription factors that modulate the KTN1 gene, we predicted transcription factors that might bind to the KTN1 promoter by the PROMO database (http://algge n.lsi.upc.es/cgi‐bin/promo_v3/promo/promoinit.cgi?dirDB = TF8.3) to screen for known transcription factor binding sites. 21 The score from random expectation (RE) analysis identified the top ranked genes as NR3C1, YY1, and ESR1 (conforming to RE equally ≥ 2 & RE query ≥ 2, Figure 1C). Next, quantitative real‐time reverse transcription (qRT‐PCR) analysis showed that knockdown of NR3C1 using NR3C1 siRNA oligonucleotides (siNR3C1) had no significant effect on the regulation KTN1 expression compared with the negative control group (siNC). Primer sequences are listed in Table S3. Similar results were observed in the cell line with ESR1 knockdown using siESR1 oligonucleotides. By contrast, YY1 knockdown led to markedly reduced KTN1 expression (Figure 1D). We also performed that the mRNA expression of YY1 correlated positively with the mRNA expression of KTN1 based on GEPIA data (http://gepia.cancer‐pku.cn/, R = 0.58, P = 1.6e−123, Figure 1E). 22 Non‐significant correlations between NR3C1 or ESR1 and KTN1 were observed (Figure S1A).
Furthermore, we analyzed approximately 2000 bp of the KTN1 promoter binding region by the UCSC genome browser (http://genome.ucsc.edu/) [Data obtained from Richard Myers data (GEO:GSM803535, UCSC‐ENCODE‐hg19: wgEncodeEH001573)], which was found to recruit YY1 at multiple binding sites (Figure 1F). These results revealed that YY1 might be a pivotal regulator of KTN1 expression in high‐grade BCa.
2.2. Elevated expression of YY1 correlates positively with poorly clinical outcomes in high‐grade BCa
The transcription factor YY1 is elevated in various types of cancers and promotes tumor growth and metastasis. 23 However, the regulatory mechanism of YY1 in high‐grade BCa is poorly understood. An IHC assay using a tissue microarray showed that YY1 was increased in BCa tissues compared to that in adjacent normal tissues. YY1 protein levels were higher in poorly differentiated BCa tissues compared to those in well differentiated BCa tissues (Figure 2A). Additionally, qRT‐PCR analysis was confirmed that the expression of YY1 was increased observably in BCa tissues compared with that in paracancerous tissues (n = 36) (Figure 2B). Analogous results were obtained from BCa cell lines using western blotting. As shown in Figure 2C, the level of YY1 was higher in BCa cell lines, especially basal cells, MDA‐MB‐231 and BT549, compared with that in the human mammary epithelial cell line MCF10A. A previous study showed that patients with triple negative BCa exhibited higher histological grade and worse prognosis than other subtypes of BCa. 24 The correlation between YY1 expression and clinical outcomes was analyzed according to Kaplan–Meier plotter dataset online. The results showed that high YY1 expression correlated positively with decreased RFS along with BCa malignancy (well differentiated, P = 0.94; moderately differentiated, P = 0.56; poorly differentiated, P = 0.0065, respectively, Figure 2D). However, high ESR1 and NR3C1 levels were not associated with poor outcome of high‐grade BCa (Figure S1B). Thus, these findings suggested that YY1 acts as an oncogene, and is highly expressed and correlated with poor outcomes in high‐grade BCa.
FIGURE 2.
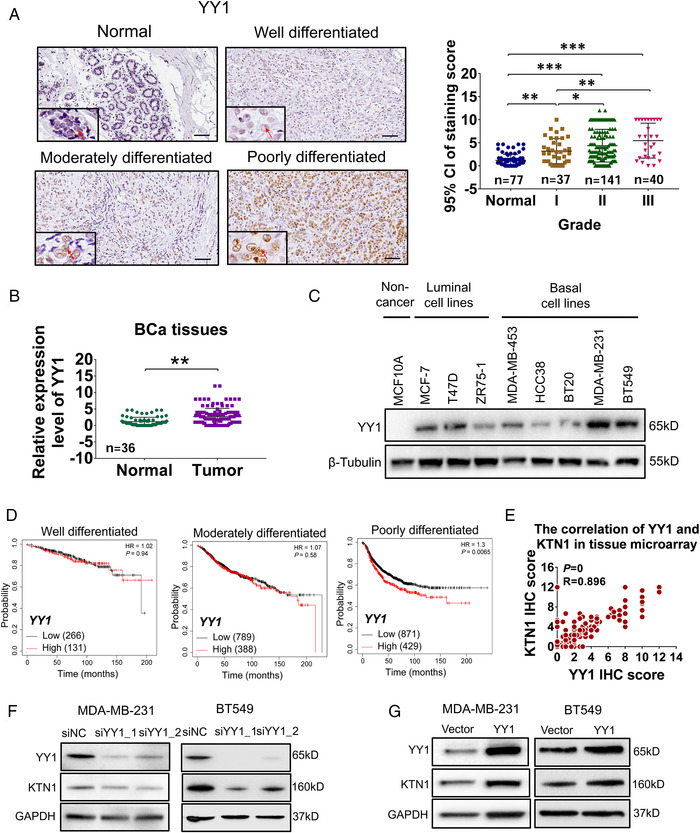
High YY1 expression was associated with poor clinical prognosis. (A) Immunohistochemistry (IHC) staining of YY1 in breast cancer (BCa) tissues. All data are shown as the means of the 95% confidence interval plus the s.d. (B) The expression level of YY1 mRNA was examined by qRT‐PCR in 36‐paired BCa tissues compared to adjacent normal tissues. (C) Western blotting analysis of the level YY1 protein in MCF10A, MCF‐7, T47D, ZR75‐1, MDA‐MB‐453, HCC38, BT20, MDA‐MB‐231, and BT549 cell lines. (D) Kaplan–Meier analysis of well differentiated, moderately differentiated, and poorly differentiated for relapse‐free survival (RFS) with high versus low expression levels of YY1 mRNA from the GEPIA database. (E) Correlation analysis between YY1 and KTN1 from the tissue microarray (R = 0.896, P = 0). (F) Knockdown of YY1 in MDA‐MB‐231 and BT549 cell lines treated with negative control (siNC), YY1_1 and YY1_2 siRNA oligonucleotides was determined using western blotting assays. (G) Overexpression of YY1 in both BCa cell lines transfected with empty vector or YY1 overexpression plasmid was detected using western blotting analysis. The P‐value of data showed significant differences as indicated using * P < 0.05, ** P < 0.01 and *** P < 0.001
Next, a similar positive correlation of YY1 protein levels was observed in the tissue microarray data (R = 0.896, P = 0, Figure 2E). Moreover, to verify whether YY1 regulates the expression of KTN1, YY1 was knocked down using siRNA oligonucleotides in both cell lines (Figure 2F, Figure S2A). The results showed that the expression of the KTN1 decreased markedly in cells treated with siYY1 compared to that siNC group. By contrast, overexpression of YY1 increased the level of the KTN1 protein in both BCa cell lines (Figure 2G, Figure S3A). Taken together, these findings suggested that upregulated YY1 expression resulted in poor clinical prognosis of high‐grade BCa by regulating KTN1 expression.
2.3. YY1 promotes the growth and epithelial–mesenchymal transition of BCa cells in a KTN1‐dependent manner in vitro and in vivo
To analyze the oncogenic character of YY1 in BCa, we knocked down YY1 expression in both BCa cell lines (Figure 3A, Figure S2A). The results showed that deficiency of YY1 decreased the number of colony formation compared with that in the siNC group in MDA‐MB‐231 cells (Figure 3B), whereas cells transfected with the YY1 overexpression vector produced more colonies in MDA‐MB‐231 cells (Figure S3C). Additionally, knockdown of YY1 attenuated cell proliferation, as assessed using a CCK‐8 assay in MDA‐MB‐231 cells (Figure 3C), while overexpression of YY1 had the opposite effect (Figure S3B). Furthermore, knockdown of YY1 suppressed migration and invasion of MDA‐MB‐231 cells (Figure 3D), whereas overexpression of YY1 promoted cell migration and invasion (Figure S3D). Similar results were obtained using BT549 cells (Figure S2). Besides, to assess whether YY1 modulated the cell invasive growth by a KTN1dependent manner, MDA‐MB‐231 cells were treated with siKTN1 in the YY1 overexpression cells, which resulted in a fractional reduction of cell migration and invasion contrasted with YY1 overexpression alone group (Figure 3E, 3F). These results suggested that inhibition of YY1 could repress the proliferation and invasion of BCa.
FIGURE 3.
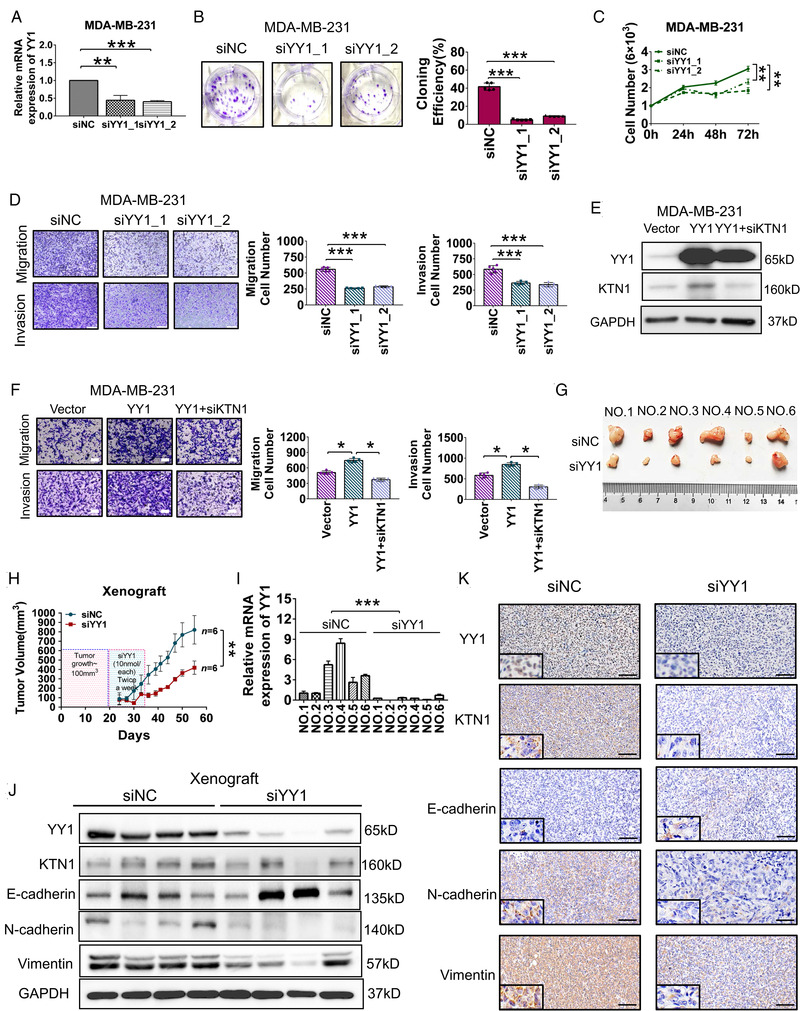
Depletion of YY1 blocked the invasive growth of breast cancer (BCa) cells in vitro and in vivo. (A) Knockdown of YY1 in MDA‐MB‐231 cells treated with siYY1_1 or siYY1_2 oligonucleotides compared with the siNC group as assessed by a qRT‐PCR assay. (B) CCK‐8 assay showing the proliferation of MDA‐MB‐231 cells treated with siNC and siYY1 oligonucleotides. (C) Monolayer colony formation assay showing the colony forming efficiencies of MDA‐MB‐231 cells treated with siNC and siYY1 oligonucleotides. (D) Transwell assay showing the migration and invasion of MDA‐MB‐231 cells treated with siNC and siYY1 oligonucleotides. (E) Western blotting analysis of protein levels in YY1‐overexpressing MDA‐MB‐231 cells treated with siKTN1 oligonucleotides. (F) Migration and invasion analysis in ‐overexpressing MDA‐MB‐231 cells treated with siKTN1 oligonucleotides using a Transwell assay. (G) Knockdown of YY1 with siYY1 oligonucleotides attenuated MDA‐MB‐231 cell growth in a mouse xenograft model compared with that in the siNC group. (H) Tumor volumes were measured after injection of MDA‐MB‐231 cells with siYY1 oligonucleotides in the xenograft mouse model; n = 6. (I) The expression levels of YY1 mRNA in the xenograft tumors. (J) Western blotting assay to detect the protein levels of YY1, KTN1, and epithelial‐to‐mesenchymal transition (EMT) markers. (K) Immunohistochemistry (IHC) staining of YY1, KTN1, and EMT marker in xenograft tumors. Error bars are shown with the s.d., n ≥ 3. * P < 0.05, ** P < 0.01 and *** P < 0.001 compared with the negative control groups. A two‐tailed t‐test or ANOVA was used to assess the P‐values. Scale bars, 100 μm
To verify the pro‐carcinogenic YY1/KTN1 axis in vivo, tumor‐bearing mice were injected with 5′ cholesterol‐ and 2′ methoxyethyl‐modified YY1 siRNA oligos (10 nmol each) twice every week, and tumor volumes were recorded from 24 to 55 days after the injections. The results suggested that the volume of xenograft tumors treated with siYY1 oligos were significantly smaller than those injected with siNC oligos (n = 6 each, Figure 3G, 3H).
The mice were executed humanely, and their tumors were harvested for further assessment. Total RNA and protein were extracted to analyze their expression. The expression level of YY1 was effectively inhibited using siYY1 oligos treatment compared with that in the siNC group (Figure 3I). Next, Western blotting and IHC staining analysis showed that silencing of YY1 markedly decreased the expression of KTN1 and mesenchymal markers, whereas it increased the expression of epithelial markers (Figure 3J, 3K). These data demonstrated that YY1 plays a pro‐carcinogenic role in invasive BCa. Targeting YY1 with siRNA oligos might serve for a novel therapeutic approach to alleviate BCa progression.
2.4. The promoter of KTN1 gene is directly transactivated by YY1
Given that high YY1 expression promoted the expression of KTN1 in BCa cells, we identified putative YY1 binding sites through the JASPAR database (http://jaspardev.genereg.net), and also verified that the putative binding sites for YY1 could be matched with promoter regions of the KTN1 gene for “CCAT” or “ATGG” sites by the UCSC genome browser database (http://genome.ucsc.edu/, Figure 4A). Next, to explore whether YY1 transcriptionally modulated KTN1 gene expression, electrophoretic mobility shift (EMSA) assays were used to performe the direct interactions between the purified YY1 protein and the predicted KTN1 promoter motifs, which was revealed by a super‐shift upon binding with the anti‐YY1 antibody. However, mutation of the YY1‐binding motifs within the KTN1 promoter abolished the interaction, indicating the specificity of the binding sites for YY1 (Figure 4B, Figure S4A).
FIGURE 4.
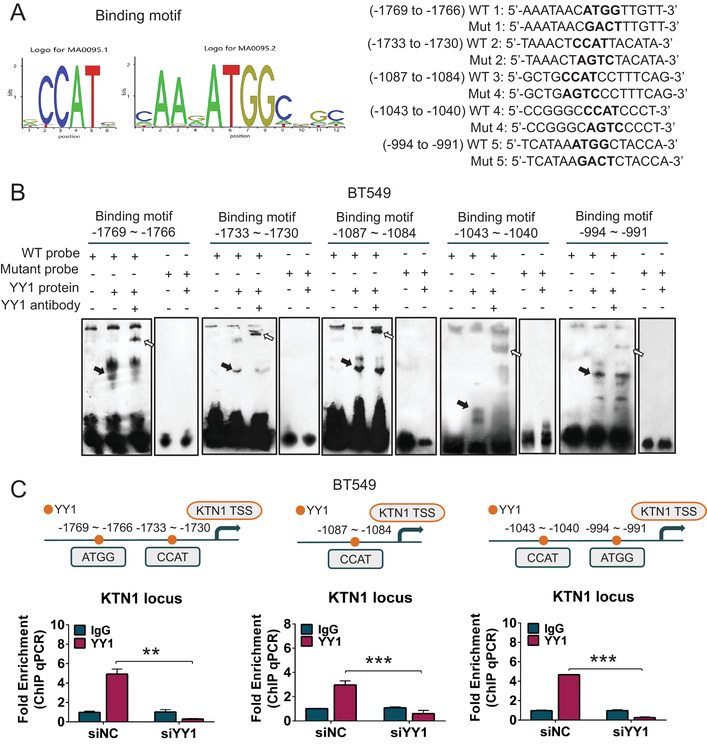
YY1 directly transactivated KTN1 via binding to its promoter n BCa. (A) Using the UCSC and JASPAR databases analysis of predicted binding sites, including wild‐type (WT) and mutant (Mut) versions of these binding motifs. (B) Electrophoretic mobility shift (EMSA) assay analysis of the direct binding between the purified YY1 protein and the KTN1 promoter. The black arrow represents the binding complex between YY1 and a probe, and the white arrow represents the supershift generated by the association of the anti‐YY1 antibody with YY1 and the probe. (C) ChIP assay analysis of YY1 enrichment on the promoter of KTN1 in MDA‐MB‐231 cells compared with that using the immunoglobulin G mouse antibody. The different regions containing different putative YY1‐binding sites from left to right are shown. The binding enrichment of YY1 at the above binding sites on the promoter region was detected after knockdown of YY1. Error bars are shown with the s.d., n ≥ 3. * P < 0.05, ** P < 0.01, and *** P < 0.001. A two‐tailed t‐test or ANOVA was used to assess the P‐values
Additionally, a ChIP‐qPCR assay verified that the YY1 protein was recruited to the KTN1 promoter at binding sites located at –1769 to –1766, –1733 to –1730, –1087 to –1084, –1043 to –1040, and –994 to –991, whereas signals was not detected at –1398 to –1395, –1379 to –1376, and –608 to –605 (Figure 4C, Figure S4B). Importantly, silencing of YY1 decreased the recruitment of YY1 to the KTN1 promoter markedly. Hence, these results indicated that YY1 specifically induced the transcriptional activity of the KTN1 promoter at the above loci.
2.5. YY1‐mediated transactivation of KTN1 gene promoter is co‐activated by DDX3X
YY1 is defined as a dual functional transcription factor, regulating downstream target genes via transcriptional activation or inhibition. This dual role of YY1 depends on its interacting partners. 13 Considering the dual character of YY1, and to investigate the mechanistic role of its oncogenicity in BCa, co‐IP assays in combination with high‐performance liquid chromatography–mass spectrometry (HPLC–MS) analysis was performed to identify the proteins of interacting with YY1. In total, 72 (MDA‐MB‐231 cells, H/L ratio > 2.0) and 51 (BT549 cells, H/L ratio > 2.0) differentially abundant proteins were distinguished in the pull‐down assay using the YY1 protein as compared with the negative IgG group (Figure 5A). According to these candidate proteins, 28 (H/L ratio > 2.0) proteins were shared between MDA‐MB‐231 and BT549 cells. Potential YY1 cross‐linking proteins, including DDX3X, PTPN11, PAK2, and ATP6V1A proteins, were filtered through protein localization and outcome analysis using the human protein atlas online (https://www.proteinatlas.org/) and GEPIA databases (Figure 5B, Figure S5A, B). Western blotting analysis showed that DDX3X was verified as pulled down by YY1 (Figure 5C, Figure S5C) in both BCa cell lines. Therefore, the results suggested that DDX3X was a potential binding partner of YY1, corroborating its hypothetical role as a YY1 interaction co‐partner.
FIGURE 5.
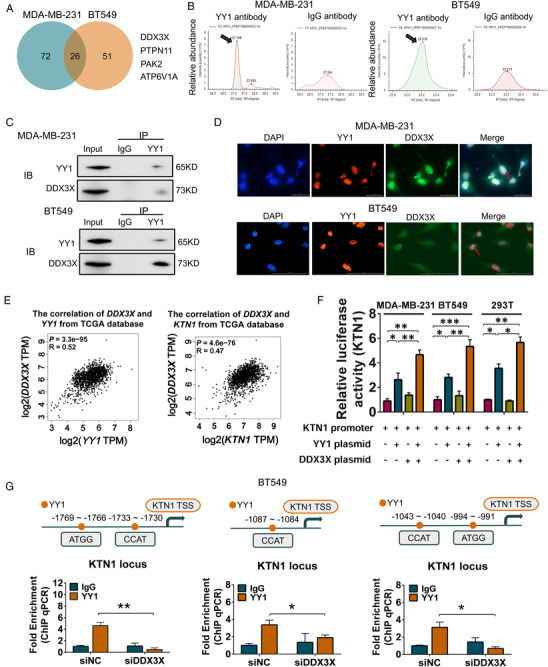
YY1 regulated the downstream target gene KTN1 in a DDX3X‐dependent manner in BCa. (A) Chromatographic analysis of the proteins immunoprecipitated using anti‐YY1 antibodies or control IgG antibodies. (B) Black arrows indicate the DDX3X peptide peaks in the YY1‐pulldown samples from MDA‐MB‐231 and BT549 cells compared with those from control IgG samples. (C) Western blotting and co‐immunoprecipitation assays analysis of co‐factors of YY1. (D) Immunofluorescence chemistry assay analysis of the co‐location and co‐expression in both BCa cell lines. (E) The correlation analysis between DDX3X and YY1 expression from the GEPIA database (R = 0.52, P = 3.3e−95), and the correlation analysis between DDX3X and KTN1 expression from the GEPIA database (R = 0.47, P = 4.6e−76). (F) Activity of a reporter containing four canonical YY1‐binding sites and binding of YY1 to the KTN1 promoter in MDA‐MB‐231, BT549, and 293T cells transfected with the KTN1 promoter reporter, the full‐length DDX3X plasmid, and the full‐length YY1 plasmid (n = 4) as determined by a dual‐luciferase assays. (G) ChIP‐qPCR analysis showing the binding enrichment of YY1 at the binding sites on the promoter region of KTN1 detected after knockdown of DDX3X. Error bars are showed with the s.d., n ≥ 3. *P < 0.05, **P < 0.01, and ***P < 0.001. A two‐tailed t‐test or ANOVA was used to assess the P‐values
Knockdown of DDX3X inhibited lung metastasis in BCa, 19 and DDX3X promoted cancer cells survival by modulating mRNA metabolism, the stress response, hypoxia, apoptosis, and the cell cycle. 25 Immunofluorescence analysis showed that YY1 was co‐localized and co‐expressed with DDX3X in the nucleus of both BCa cell lines (Figure 5D). Consistently, we performed the correlation analysis of DDX3X, and YY1 or KTN1 in the TCGA database. The results suggested that the mRNA expression of DDX3X was related positively with the mRNA expression of YY1 (R = 0.52, P = 3.3e−95, Figure 5E) and KTN1 (R = 0.47, P = 4.6e−76, Figure 5E).
Next, to identify that whether DDX3X acted as a co‐activator of YY1 to regulate KTN1 transactivation, we conducted the luciferase reporter assays including the binding motif of KTN1 promoter. The data showed that the KTN1 signal was excessively activated after co‐transfection of YY1 and DDX3X overexpression plasmids in three cell lines compared with other groups: the negative control group, the YY1 overexpression only group, and the DDX3X overexpression only group (Figure 5F). Using an anti‐YY1 antibody, we showed that depletion of DDX3X contributed to decreasing at the binding motifs of the KTN1 promoter in YY1‐dependent manner (Figure 5G). These data suggested that DDX3X was required for YY1 transactivation the promoter of KTN1.
2.6. DDX3X augments YY1‐KTN1 signaling axis‐promoted cell growth in high‐grade breast cancer
To demonstrate the oncogenic characteristics of DDX3X in BCa, the IHC results uncovered that the expression of DDX3X was increased in BCa tissues compared to patacancerous tissues (Figure S6A). Besides, high DDX3X expression was associated with poor RFS (P = 4.8e−06) in patients with invasive BCa, as indicated by Kaplan–Meier analysis (Figure S6B). QRT–PCR analysis also showed that the expression of DDX3X was increased in cancer cells compared to that in human mammary epithelial cells (Figure S6C). Furthermore, knockdown of DDX3X led to significantly downregulation of the levels of DDX3X and KTN1 proteins in MDA‐MB‐231 cell line (Figure S6D). To confirm if DDX3X blockade impacted the expression of KTN1, BT549 cells were treated with different concentrations of RK‐33 that was DDX3X inhibitor, and the expression of YY1, DDX3X, or KTN1 was assessed. We found that inhibition of DDX3X decreased the expression of KTN1 in no significant dose‐dependent manner, the reason was probably that decreasing of DDX3X activity weakened the capacity of YY1 at binding of KTN1 promoter. Moreover, the addition of YY1 overexpression was sufficient to partially rescue RK‐33 repressed expression of KTN1 (Figure S7). In addition, inhibiting the expression of DDX3X repressed the growth and invasion of MDA‐MB‐231 cells (Figure S6E, 6F).
Next, to evaluate whether YY1 regulated the cell invasive growth of BCa in a DDX3X‐dependent manner, BT549 cells with treated with siYY1 were transfected with the DDX3X overexpression plasmid, which resulted in a fractional rescue of cell migration and invasion contrasted to the siYY1 alone group (Figure S6G, S6H). Analogously, in DDX3X knockdown cells, we observed increased migration and invasion of cells following YY1 overexpression contrasted to those in the siDDX3X alone group (Figure S6I, S6J). These results suggested that DDX3X was involved in YY1‐mediated BCa aggressive growth.
2.7. YY1 facilitates the aggressive growth of BCa tumors in vivo
To demonstrate whether YY1 promoted the aggressive growth of BCa tumors in vivo, we first evaluated the influence of YY1 overexpression on BCa xenograft tumors using a NOD/SCID/IL2rγ null mice model (n = 3 each). When tumor bulk reached 100 mm3, the xenograft tumors were injected with YY1 overexpression plasmids twice every week. The results suggested that the volume of xenografts treated with YY1 overexpression plasmids were increased significant compared with those injected with the negative control vector (Figure 6A, 6B). In addition, overexpression of YY1 in xenograft mice enhanced the expression of KTN1 and the mesenchymal markers (Vimentin and N‐cadherin), whereas it inhibited the epithelial protein expression (E‐cadherin) by western blotting (Figure 6C, 6D). IHC analysis indicated that the levels of mesenchymal markers were increased, whereas those of the epithelial marker decreased (Figure 6F). Importantly, H&E staining assessed the aggressive effects of YY1 overexpression in vivo. The results indicated that YY1 overexpression markedly promoted more tumor cells infiltration in adjacent fatty, nerve, and muscular tissues in contrast to that of the negative control vector groups (Figure 6E). Therefore, these findings demonstrated that YY1 promoted KTN1‐mediated the cell invasive growth of BCa, and YY1 transactivated the KTN1 gene in a DDX3X‐dependent manner (Figure 6G).
FIGURE 6.
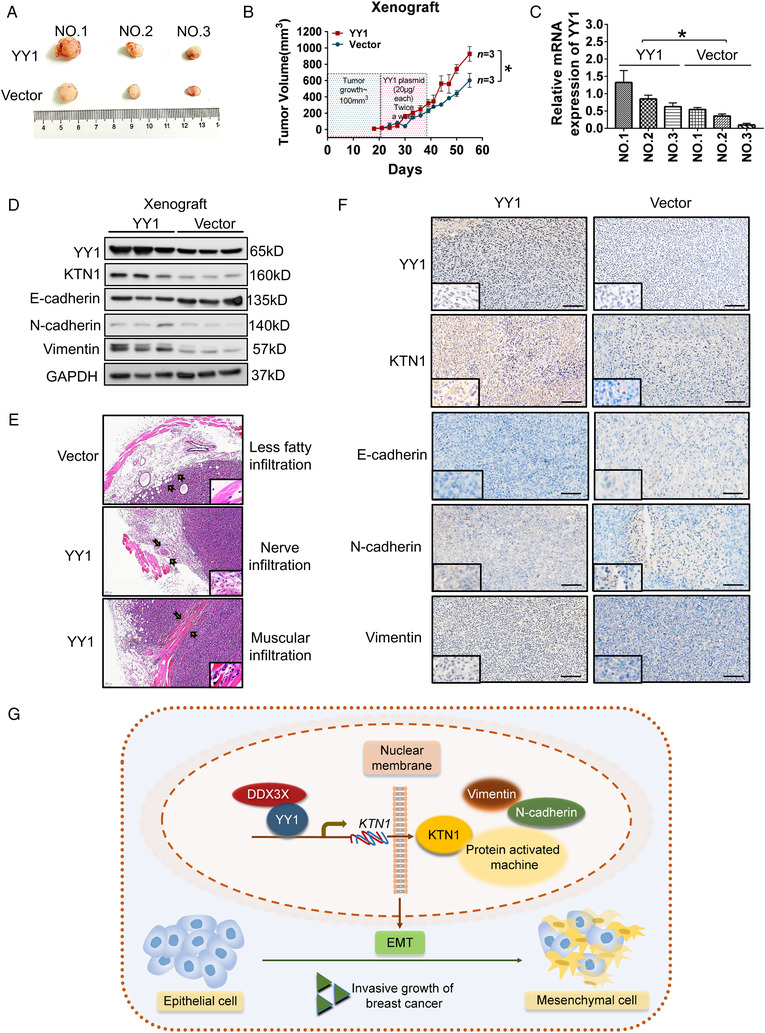
Overexpressed YY1 induced tumor aggressive growth in breast cancer (BCa). (A) Overexpression of YY1 promoted MDA‐MB‐231 cell growth in mice xenograft models compared with that in the vector only group. (B) Tumor volumes were measured after injected MDA‐MB‐231 cells treated with the YY1 overexpression plasmid in the xenograft mouse model (n = 3). (C) qRT‐PCR analysis of the expression levels of YY1 mRNA in the xenograft tumors. (D) Western blotting analysis of the levels of YY1, KTN1, and epithelial‐to‐mesenchymal transition (EMT) markers. (E) Hematoxylin and eosin (HE) staining analysis of the effects on tumor cell aggression of YY1 overexpression in vivo; a black arrow represents the range of infiltrating of tumor cells. (F) Immunohistochemistry (IHC) staining of YY1, KTN1, and EMT marker proteins in xenograft tumors. (G) A model of the YY1/DDX3X/KTN1‐regulatory axis in BCa development. Error bars are shown with the s.d., n ≥ 3. *P < 0.05, **P < 0.01, and ***P < 0.001 compared with the negative control group. A two‐tailed t‐test or ANOVA was used to assess the P‐values. Scale bars, 100 μm
3. DISCUSSION
As the most common cancer in women, high‐grade BCa often relapses, which is mainly attributed to the enhanced metastasis and invasive growth of cancer cells. 26 Therefore, a comprehensive understanding of the molecular mechanisms modulating the process of cell invasion and metastasis is fundamental to improving the clinical outcome of BCa. The histological scores of BCa are assigned to three grades: Grade I, Grade II, and Grade III. Histological Grade III BCa tends to demonstrate an aggressive molecular biological signature, manifested as a “basal cluster”‐like gene expression profile, including high‐expression levels of EGFR (encoding epidermal growth factor receptor), CK5 (cytokeratin 5), CK14, CK17, and vimentin. 27 , 28 Furthermore, patients with positive estrogen receptor (ER) expression are defined as Grade I to II and have a better prognosis for survival, while the patients with triple‐negative BCa usually suffer from Grade III BCa. 29 Our previous study suggested that KTN1 promoted epithelial‐to‐mesenchymal transition (EMT) progression in triple negative BCa, whereas inhibition of KTN1 expression could repress tumor EMT in vitro and in vivo. 9
During cell development, proliferation, and oncogenicity, EMT progression represses epithelial characteristics and enhances the expression of certain genes that are characteristic of mesenchymal cells. In addition, EMT contributes to cancer occurrence and highly aggressive cancers. 30 KTN1 acts as a membrane receptor that binds to kinesin protein. The KTN1–kinesin complex is involved in microtubule movement and organelle transport. Previous studies revealed that kinesin family members [Kinesin family member C1 (KIFC1), Kinesin family member 5B (KIF5B), and Kinesin light chain 1 (KLC1)] play important roles in accelerating epithelial−mesenchymal plasticity in bladder cancer and breast tumors. 31 , 32 High expression of KLFC1 promoted the phosphorylation of glycogen synthase kinase 3 beta (GSK3β) and enhanced the expression of SNAI1 (encoding snail family transcriptional repressor 1) via protein kinase B (AKT) activation, which induced bladder cancer cell growth and EMT. Besides, in BCa, KIF5B and KLC1 promote epithelial−mesenchymal plasticity and tumorigenesis through regulating TGFB (encoding transforming growth factor beta) expression. 31 , 32 In the present study, we found that KTN1 could interact with KIF5B and KLC1 by analyzing data in the String database (https://string‐db.org/, Figure S7A). In addition, gene ontology (GO) analysis of the proteins interacting with KTN1 identified the “Kinesin complex” function (Figure S8). In addition, a Co‐IP assay analysis demonstrated that KIFC1 and KLC1 proteins could be pulled down by KTN1 antibody compared with negative control IgG groups in both types BCa cells (Figure S9). Thus, our results demonstrated that KTN1 might promote EMT progression of BCa by binding kinesin family members, which should be further explored in the future.
Accumulating evidence indicates that YY1 is involved in cancer progression. Patten et al. considered that YY1 acts a key element of ER alpha (ERα) transcriptional activity involving in luminal BCa growth, and could contribute to resistance to endocrine therapy. 33 However, whether YY1 and its regulatory axis could promote cell invasion in advanced BCa was unknown. A previous report showed that oncogenic mechanistic target of rapamycin 2 (mTOR2)‐mediated AKT signaling was activated by YY1. 34 In our study, YY1 was revealed as a crucial transcription factor that activates KTN1 expression. In addition, upregulated YY1 correlated positively with pathological progression and poor clinical outcome, which strongly indicated a pro‐oncogenic role of this gene in BCa. Gene loss‐of‐function and gain‐of‐function experiments further verified that YY1 was able to enhance the invasive cell growth of BCa both in vitro and in vivo. These results clarified that YY1 promotes BCa progression and might be a potential therapeutic target to treat advanced BCa. However, the molecular mechanisms of YY1‐induced EMT progression are not clear. Shu et al. found that overexpression of YY1 promoted vascular endothelial growth factor (VEGFA) and SNAI1 expression, and enhanced high glucose‐stimulated EMT progression and cell permeability. 35 However, our findings suggested that increased YY1 expression expedited tumor cell EMT and aggressive growth in high‐grade BCa by transactivating the KTN1 gene.
Interestingly, as a transcription factor, YY1 exhibits bidirectional transcription regulation in certain tumor contexts. It can activate or repress the transcription of its target gene depending on the interacting transcriptional co‐factors. 14 Therefore, we sought to clarify the regulatory axis of YY1 in BCa progression by identifying its specific interacting protein in advanced BCa cells. Co‐IP combined with HPLC–MS analysis identified that transcription factor DDX3X could be an important cofactor of YY1. We verified that these two proteins interact in BCa cells. DDX3X is encoded on the X chromosome and is widely expressed in human tissues. 36 A previous study showed that DDX3X was modulated by hypoxia‐inducible factor 1 alpha (HIF‐1α) directly and thus promotes tumorigenesis of BCa. 37 Our rescue experiments demonstrated that overexpression of DDX3X in YY1‐silenced BCa cells increased their cell proliferation and invasion, suggesting that DDX3X might endow a pro‐oncogenic role on YY1 in advanced BCa. Additionally, our findings identified that YY1 positively modulated the expression of KTN1 in a DDX3X‐dependent manner in BCa.
In conclusion, we identified that the YY1‐DDX3X‐KTN1 signaling axis was markedly upregulated in BCa, which correlated positively with its pathological grading and poor prognosis. Gene loss‐of‐function and gain‐of‐function studies suggested that the YY1‐KTN1 signaling pathway accelerated the aggressive growth of BCa cells both in vitro and in vivo, which could be augmented by DDX3X, the specific transcriptional coactivator of YY1. These findings highlighted a progression‐promoting function of the YY1‐DDX3X‐KTN1 transcription regulatory axis in BCa and indicated potential therapeutic targets to overcome this disease.
4. MATERIALS AND METHODS
4.1. Clinical samples, immunohistochemistry, and survival curve according to BCa pathological grades
For clinical samples, three commercial tissue microarrays of BCa were purchased and obtained from Shanghai Outdo Biotech Co., Ltd (#HBreD140Su03, #HBreD077Su01 406, and #HBreD075Bc01). The expression of KTN1 in different pathological grades of BCa was reanalyzed based on tissue microarray immunostaining, as reported previously. 9 Briefly, a total of 206 tissue samples of BCa, from low‐grade to high‐grade pathology, were diagnosed in the clinic (stage I = 37; stage II = 141; and stage III = 40) and 77 adjacent normal tissue samples were acquired. All tissue samples were paraffin‐embedded and cut into slices for IHC. All tissue samples were performed to dehydrate with ethanol after deparaffinizi with xylene. After washing in phosphate buffer, the antigen retrieval was performed by the sodium citrate buffer (pH 6.0). Endogenous peroxidase activity was quenched using hydrogen peroxide solution. And nonspecific crosslinking was covered with avidin biotin blocking solution (Abcam, avidin biotin blocking kit, ab64212). The tissue microarrays were incubated with primary antibodies at 4°C overnight. Next day, these samples were performed in the corresponding secondary antibodies labeled with horseradish peroxidase for 30 min–1 h after washing with phosphate buffer saline (PBS) at room temperature. The samples were stained by 3,3′‐diaminobenzidine (DAB) staning (Abcam, DAB substrate kit, ab64238). In the end, all microarrays were counterstained with hematoxylin after washing by ultrafiltration water.
For the mouse experiments, xenograft masses were excised and fixed by 4% paraformaldehyde. The paraffin‐embedded slices were staining for IHC or hematoxylin and eosin (H&E) assays. The IHC staining score was plotted as mean of 95% confidence interval (95% CI) ± s.d., which used to estimate the range of parameters (* P < 0.05, ** P < 0.01, *** P < 0.001). In the comparison of normal, well differentiated, moderately differentiated, and poorly differentiated tissues, the combinative sensitivity (intensity score) and specificity (proportion score) of targeted protein IHC was 95%CI (0, 3), 95%CI (4, 6), 95%CI (7, 9), and 95%CI (10, 12). 38 , 39 The staining score was determined as follows: intensity score (0, none; 1, weak; 2, intermediate; 3, strong), a proportion score (0, 0%; 1, 1%–25%; 2, 26%–50%; 3, 51%–75%; and 4, 76%–100%). The intensity score multiplied by the proportion score was defined as the total positive staining score. 40
The mRNA correlation analysis was obtained from GEPIA online. Spearman rank analysis was performed to calculate the correlation between KTN1 and YY1 protein levels in the tissue microarrays. The survival prognosis of BCa was plotted by the Kaplan–Meier survival plotter online (www.kmplot.com).
4.2. Western blotting, antibodies, and reagents
Total cell lysates were isolated and subjected to western blotting as described previously. 41 For western blotting assays, the antibodies comprised: the primary antibodies used were: anti‐YY1 [(Cell Signalling Technology (CST), Danvers, MA, USA, #63227, 1:3000), anti‐KTN1 (CST, #13243, 1:2000), anti‐DDX3X (Abcam, Cambridge, MA, USA, ab196032, 1:2000), anti‐β‐tubulin (CST, #2128, 1:2000), anti‐β‐actin (CST, #3700, 1:2000), anti‐glyceraldehyde‐3‐phosphate dehydrogenase (GAPDH; CST, #5174, 1:2000), anti‐Vimentin (CST, #5741, 1:2000), anti‐E‐cadherin (CST, #3195, 1:2000), anti‐N‐cadherin (CST, #13116, 1:2000), anti‐KIFC1 [Abclonal Technology (Abclonal), #A3304, 1:1000], and anti‐Kinesin light chain 1 (KLC1; Abclonal, #A3304, 1:1000). The following secondary antibodies were used: anti‐mouse IgG‐horseradish peroxidase (HRP, CST, #7076, 1:2000) and anti‐rabbit IgG‐HRP (CST, #7074, 1:2000). For chromatin immunoprecipitation‐quantitative real‐time PCR (ChIP‐qPCR), the antibodies comprised: anti‐YY1 (CST, Danvers, MA, USA, #63227, 10 μg), normal mouse IgG (Merck, Kenilworth, NJ, USA; #12‐371, 10 μg)) and normal rabbit IgG (Merck, #12‐370, 10μg). For double immunofluorescence, the antibodies comprised: goat anti‐Rabbit IgG (H+L) secondary antibody, dylight 488 (ThermoFisher, 35552), goat anti‐Mouse IgG (H+L) secondary antibody, dylight 594 (ThermoFisher, 35510). For immunoprecipitation (IP) assays, the antibodies comprised: anti‐YY1 (CST, Danvers, MA, USA, #63227, 10 μg), normal mouse IgG (Merck, Kenilworth, NJ, USA; #12‐371, 10 μg) and normal rabbit IgG (Merck, #12‐370, 10 μg). For immunofluorescence, the antibodies comprised: anti‐YY1 (CST, Danvers, MA, USA, #63227, 1:200), anti‐DDX3X (Abcam, Cambridge, MA, USA, ab196032, 1:200). The DDX3X inhibitor used was: RK‐33 (Selleck.cn, #S8246).
4.3. Xenograft model in vivo
The xenograft experiments were performed as previously described. 42 For RNA interfering treatment, female BALB/c‐nude mice at 4–6 weeks old were purchased and obtained from the Medical Laboratory Centre of Guangdong Province (Guangzhou, China). Untreated MDA‐MB‐231 cells were surgically injected into the mammary fat pad of mice (1 × 10⁷ cells in Matrigel). Three to four weeks after cancer cell injection, cholesterol‐conjugated negative control small interfering RNA (siNC) or YY1 siRNA oligonucleotide (siYY1) was delivered into the xenograft tumor, respectively (All siRNA oligonucleotide were purchased from RiboBio Co. Ltd., Guangzhou, China). siNC or siYY1 (10 nmol) in 50 μl saline was used to treat the xenograft tumor mass once every 3 days for 4 weeks. For the invasive experiment of BCa, MDA‐MB‐231 cells (2×10⁶ in Matrigel) were delivered into the mammary fat pad of NOD/SCID/IL2rγ null mice. When tumor mass reached 100 mm3, these mice were executed treatment with 20 μg YY1 overexpression vector or equal control empty vector once every 3 days for 4 weeks. All tumor volumes were measured using the following formula: volume (mm3) = (length × width 2 )/2. The animals were sacrificed humanely, and the xenograft tumors were isolated, fixed with 4% paraformaldehyde for IHC staining.
4.4. Immunoprecipitation assay and high‐performance liquid chromatography–mass spectrometry analysis
The IP assay and HPLC–MS analysis were performed as previously described. 43 Briefly, the cell lysates were extracted using a Pierce™ Classic Magnetic IP/Co‐IP kit (Thermo Fisher Scientific, Waltham, MA, USA) and performed to IP using 20 μg of YY1 antibodies. The sodium dodecyl sulfate polyacrylamide gel electrophoresis assay was used to detect precipitated protein complex that interacting with YY1. After band excision in silver staining and extraction and digestion, the digest was used to perform HPLC–MS analysis by the EASY‐nLC™ 1200 UHPLC system (Thermo Fisher Scientific) on an Orbitrap Q Exactive HF‐X mass spectrometer (Thermo Fisher Scientific). Each fraction was analyzed by Proteome Discoverer 2.2 (Thermo Fisher Scientific). The raw data reported in this article had been deposited in the OMIX, China National Center for Bioinformation/Beijing Institute of Genomics, Chinese Academy of Sciences (https://ngdc.cncb.ac.cn/omix/preview/MUpyKOZZ: accession no. OMIX979). 44 The precipitated protein complex was also separated and identified by western blotting assay.
4.5. Electrophoretic mobility shift assay
The EMSA assay was conducted using a LightShift™ Chemiluminescent RNA EMSA kit (Thermo Fisher) following the manufacturer's instructions. Briefly, EMSA was performed using 5′ biotin‐labeled dsDNA probes (Thermo Fisher). EMSA was carried out using annealed DNA probes, purified YY1 protein (Abcam, ab152809, 3 μg), and anti‐YY1 antibodies (CST, Danvers, MA, USA, #63227, 1 μg). The images were acquired by the imaging system (Bio‐Rad, Hercules, CA, USA). The probes sequences are listed in the Supporting information (Table S4).
4.6. Chromatin immunoprecipitation and qPCR assay (ChIP–qPCR)
ChIP assay was tested using an EZ ChIP™ kit (Merck Millipore, Billerica, MA, USA) following the manufacturer's instructions, using 20 μg antibody against YY1 or negative control IgG (Merck Millipore). Total DNA was purified by phenol chloroform extraction and ethanol precipitation, and then diluted in nuclease‐free water. qPCR was performed using 1 μl of the immunoprecipitated samples and the SYBR Select Master Mix (Thermo Fisher). The fold enrichments of DNA signals were calculated compared with the IgG signals. Primers sequences are listed in Table S2.
4.7. Dual‐luciferase reporter assay
Dual‐luciferase reporter assay was performed using the manufacturer's instructions (Promega, Madison, WI, USA). In brief, the KTN1 promoter sequence was obtained from genomic DNA and subcloned into vector pPRO‐RB‐Report (Ribobio Biotech Co., Ltd.), generating a pPRO‐RB‐Report‐KTN1 construct. Cells were cultured in 96‐well plates and transfected with pPRO‐RB‐Report‐KTN1 vector and/or pCMV‐YY1 plasmid, and/or pCMV‐DDX3X plasmid. The cells were extracted using lysis buffer after 48 h. The firefly luciferase activity and the Renilla luciferase activity were detected by the BioTek citation 5 system (BioTek, Winooski, VT, USA).
4.8. Statistics
All statistical analyses were performed by SPSS 21.0 software (IBM Corp., Armonk, NY, USA). Correlations between the expression levels of YY1, KTN1, or DDX3X and clinical prognosis of BCa patients were analyzed using the Pearson correlation test. Survival curves were plotted and analyzed by the Kaplan–Meier plotter by GraphPad Prism Software 7.0 (GraphPad Inc, La Jolla, CA, USA). All data were showed as the mean ± standard deviation (s.d.). All data were performed for normal distribution and homogeneity of variance. Means were compared using independent‐samples two‐tailed t‐tests or one‐way analysis of variance (ANOVA). *P < 0.05, ** P < 0.01, ***P < 0.001. Further detailed methods are provided in the Supporting information.
CONFLICT OF INTERESTS
The authors declare that there is no conflict of interest that could be perceived as prejudicing the impartiality of the research reported.
ETHICS STATEMENT
For the use of clinical tissues, this study was approved by the ethics committee of the Shenzhen People's Hospital and the tissues were obtained from patients of BCa who provided written informed consent for the surgical operation (Statement number: LL‐KY‐2020356). All the mouse experiments were approved by the ethics committee of the Second Clinical Medicine College of Jinan University (approval number 20200316‐23). The mice were handled in accordance with animal welfare regulations. All mice were sacrificed by cervical dislocation to avoid unnecessary pain.
AUTHOR CONTRIBUTIONS
Lin Gao and N. Xie contributed to the design of this work, analysed the data, and drafted the manuscript. Junying Qiu, Jingyi Huang, Malin Hong, and Pan Zhao performed the experiments. Jingyi Huang, Zhe Zhang, and Jinquan Xia took charge of analysing the bioinformatic data. Yong Dai, Yuwei Luo, and Wenbin Zhou provided breast cancer specimens. Jing Jiang, Hui Gong, Jing Xu, Li Fu, and Jigang Wang supported the acquisition of the clinical and pathological information. Yong Dai, Dixian Luo, and Chang Zou designed and supervised this work and revised the manuscript.
Supporting information
Supporting Information
ACKNOWLEDGMENTS
We thank the Cancer Genome Atlas for providing their data platform. The manuscript was proofread by an English‐speaking professional with science background at Elixigen Corporation. Graphic images were created by GraphPad Prism Software 7.0 (GraphPad Inc, La Jolla, CA, USA). This work was supported by grants from the Science and Technology Foundation of Shenzhen City, Grant Numbers: JCYJ20190806154610953 to Lin Gao, JCYJ20180305164128430 to Chang Zou, JCYJ20180507182025817 to Ni Xie; the International Cooperation Foundation of Shenzhen, Grant Number: GJHZ20180928171602104 to Chang Zou; the Shenzhen Economic and Information Committee “Innovation Chain and Industry Chain” Integration Special Support Plan Project, Grant Number: 20180225112449943 to Chang Zou; the Discipline Leadership Fund of Huazhong University of Science and Technology Union Shenzhen Hospital, Grant Number: YN2021002 to Dixian Luo; the National Natural Science Foundation of China, Grant Numbers: 82002929 to Lin Gao, 32070748 to Lingyun Dai, 81972003 to Ni Xie; the Basic and Applied Basic Research Foundation of Guangdong Province, Grant Number: 2020A1515111072 to Lin Gao, 2020B1515120032 to Chang Zou, 2020A1515011303 to Hui Gong; the Shenzhen Key Medical Discipline Construction Fund, Grant Number: SZXK053); the Natural Science Foundation of Guangdong, Grant Number: JCYJ20180507182025817 to Ni Xie
Gao L, Zhou W, Xie Ni, et al. Yin Yang 1 promotes aggressive cell growth in high‐grade breast cancer by directly transactivating kinectin 1. MedComm. 2022;3:e133. 10.1002/mco2.133
Lin Gao, Wenbin Zhou and Ni Xie contributed equally to this work.
Contributor Information
Dixian Luo, Email: luodixian_2@163.com.
Chang Zou, Email: zouc2020@mail.sustech.edu.cn.
DATA AVAILABILITY STATEMENT
The dataset generated during the current study is available from the corresponding author on reasonable request.
REFERENCES
- 1. Jiang YZ, Ma D, Suo C, et al. Genomic and transcriptomic landscape of triple‐negative breast cancers: Subtypes and treatment strategies. Cancer Cell. 2019;35(3):428‐440 e5. [DOI] [PubMed] [Google Scholar]
- 2. Bardia A, Parton M, Kummel S, et al. Paclitaxel with inhibitor of apoptosis antagonist, LCL161, for localized triple‐negative breast cancer, prospectively stratified by gene signature in a biomarker‐driven neoadjuvant trial. J Clin Oncol. 2018:JCO2017748392. [DOI] [PubMed] [Google Scholar]
- 3. Liu YR, Jiang YZ, Xu XE, Hu X, Yu KD, Shao ZM. Comprehensive transcriptome profiling reveals multigene signatures in triple‐negative breast cancer. Clin Cancer Res. 2016;22(7):1653‐1662. [DOI] [PubMed] [Google Scholar]
- 4. Waks AG, Winer EP. Breast cancer treatment. JAMA. 2019;321(3):316. [DOI] [PubMed] [Google Scholar]
- 5. Ong LL, Lin PC, Zhang X, Chia SM, Yu H. Kinectin‐dependent assembly of translation elongation factor‐1 complex on endoplasmic reticulum regulates protein synthesis. J Biol Chem. 2006;281(44):33621‐33634. [DOI] [PubMed] [Google Scholar]
- 6. Kumar J, Yu H, Sheetz MP. Kinectin, an essential anchor for kinesin‐driven vesicle motility. Science. 1995;267(5205):1834‐1837. [DOI] [PubMed] [Google Scholar]
- 7. Hu X, Xiang L, He D, et al. The long noncoding RNA KTN1‐AS1 promotes bladder cancer tumorigenesis via KTN1 cis‐activation and the consequent initiation of Rho GTPase‐mediated signaling. Clin Sci. 2021;135(3):555‐574. [DOI] [PubMed] [Google Scholar]
- 8. Zhang Y, Gao L, Ma S, et al. MALAT1–KTN1–EGFR regulatory axis promotes the development of cutaneous squamous cell carcinoma. Cell Death Differ. 2019;26(10):2061‐2073. [DOI] [PMC free article] [PubMed] [Google Scholar]
- 9. Gao L, Chen S, Hong M, et al. Kinectin 1 promotes the growth of triple‐negative breast cancer via directly co‐activating NF‐kappaB/p65 and enhancing its transcriptional activity. Signal Transduct Target Ther. 2021;6(1):250. [DOI] [PMC free article] [PubMed] [Google Scholar]
- 10. Shi Y, Seto E, Chang LS, Shenk T. Transcriptional repression by YY1, a human GLI‐Kruppel‐related protein, and relief of repression by adenovirus E1A protein. Cell. 1991;67(2):377‐388. [DOI] [PubMed] [Google Scholar]
- 11. Khachigian LM. The Yin and Yang of YY1 in tumor growth and suppression. Int J Cancer. 2018;143(3):460‐465. [DOI] [PubMed] [Google Scholar]
- 12. Thomas MJ, Seto E. Unlocking the mechanisms of transcription factor YY1: Are chromatin modifying enzymes the key? Gene. 1999;236(2):197‐208. [DOI] [PubMed] [Google Scholar]
- 13. Sarvagalla S, Kolapalli SP, Vallabhapurapu S. The two sides of YY1 in cancer: A friend and a foe. Front Oncol. 2019;9:1230. [DOI] [PMC free article] [PubMed] [Google Scholar]
- 14. Wottrich S, Kaufhold S, Chrysos E, Zoras O, Baritaki S, Bonavida B. Inverse correlation between the metastasis suppressor RKIP and the metastasis inducer YY1: Contrasting roles in the regulation of chemo/immuno‐resistance in cancer. Drug Resist Updat. 2017;30:28‐38. [DOI] [PubMed] [Google Scholar]
- 15. Begon DY, Delacroix L, Vernimmen D, Jackers P, Winkler R. Yin Yang 1 cooperates with activator protein 2 to stimulate ERBB2 gene expression in mammary cancer cells. J Biol Chem. 2005;280(26):24428‐24434. [DOI] [PubMed] [Google Scholar]
- 16. Harbeck N, Huang CS, Hurvitz S, et al. Afatinib plus vinorelbine versus trastuzumab plus vinorelbine in patients with HER2‐overexpressing metastatic breast cancer who had progressed on one previous trastuzumab treatment (LUX‐Breast 1): An open‐label, randomised, phase 3 trial. Lancet Oncol. 2016;17(3):357‐366. [DOI] [PubMed] [Google Scholar]
- 17. Mo J, Liang H, Su C, Li P, Chen J, Zhang B. DDX3X: Structure, physiologic functions and cancer. Mol Cancer. 2021;20(1):38. [DOI] [PMC free article] [PubMed] [Google Scholar]
- 18. Tantravedi S, Vesuna F. Targeting DDX3 in medulloblastoma using the small molecule inhibitor RK‐33. Transl Oncol. 2019;12(1):96‐105. [DOI] [PMC free article] [PubMed] [Google Scholar]
- 19. Xie M, Vesuna F, Botlagunta M, et al. NZ51, a ring‐expanded nucleoside analog, inhibits motility and viability of breast cancer cells by targeting the RNA helicase DDX3. Oncotarget. 2015;6(30):29901‐29913. [DOI] [PMC free article] [PubMed] [Google Scholar]
- 20. Chen HH, Yu HI, Cho WC, Tarn WY. DDX3 modulates cell adhesion and motility and cancer cell metastasis via Rac1‐mediated signaling pathway. Oncogene. 2015;34(21):2790‐2800. [DOI] [PubMed] [Google Scholar]
- 21. Netanely D, Stern N, Laufer I, Shamir R. PROMO: An interactive tool for analyzing clinically‐labeled multi‐ohmic cancer datasets. BMC Bioinform. 2019;20(1):732. [DOI] [PMC free article] [PubMed] [Google Scholar]
- 22. Tang Z, Li C, Kang B, Gao G, Li C, Zhang Z. GEPIA: A web server for cancer and normal gene expression profiling and interactive analyses. Nucleic Acids Res. 2017;45(W1):W98‐W102. [DOI] [PMC free article] [PubMed] [Google Scholar]
- 23. Wu S, Wang H, Li Y, et al. Transcription factor YY1 promotes cell proliferation by directly activating the pentose phosphate pathway. Cancer Res. 2018;78(16):4549‐4562. [DOI] [PubMed] [Google Scholar]
- 24. Chacon RD, Costanzo MV. Triple‐negative breast cancer. Breast Cancer Res. 2010;12(Suppl 2):S3. [DOI] [PMC free article] [PubMed] [Google Scholar]
- 25. Bol GM, Xie M, Raman V. DDX3, a potential target for cancer treatment. Mol Cancer. 2015;14:188. [DOI] [PMC free article] [PubMed] [Google Scholar]
- 26. Liang Y, Zhang H, Song X, Yang Q. Metastatic heterogeneity of breast cancer: Molecular mechanism and potential therapeutic targets. Semin Cancer Biol. 2020;60:14‐27. [DOI] [PubMed] [Google Scholar]
- 27. Irvin WJ Jr, Carey LA. What is triple‐negative breast cancer?. Eur J Cancer. 2008;44(18):2799‐2805. [DOI] [PubMed] [Google Scholar]
- 28. Takahashi H, Oshi M, Asaoka M, Yan L, Endo I, Takabe K. Molecular biological features of nottingham histological grade 3 breast cancers. Ann Surg Oncol. 2020;27(11):4475‐4485. [DOI] [PMC free article] [PubMed] [Google Scholar]
- 29. Adani‐Ife A, Amegbor K, Doh K, Darre T. Breast cancer in togolese women: Immunohistochemistry subtypes. BMC Womens Health. 2020;20(1):261. [DOI] [PMC free article] [PubMed] [Google Scholar]
- 30. Derynck R, Weinberg RA. EMT and Cancer: More than meets the eye. Dev Cell. 2019;49(3):313‐316. [DOI] [PMC free article] [PubMed] [Google Scholar]
- 31. Xiao KH, Teng K, Ye YL, et al. Kinesin family member C1 accelerates bladder cancer cell proliferation and induces epithelial–mesenchymal transition via Akt/GSK3beta signaling. Cancer Sci. 2019;110(9):2822‐2833. [DOI] [PMC free article] [PubMed] [Google Scholar]
- 32. Moamer A, Hachim IY, Binothman N, Wang N, Lebrun JJ, Ali S. A role for kinesin‐1 subunits KIF5B/KLC1 in regulating epithelial mesenchymal plasticity in breast tumorigenesis. EBioMedicine. 2019;45:92‐107. [DOI] [PMC free article] [PubMed] [Google Scholar]
- 33. Patten DK, Corleone G, Gyorffy B, et al. Enhancer mapping uncovers phenotypic heterogeneity and evolution in patients with luminal breast cancer. Nat Med. 2018;24(9):1469‐1480. [DOI] [PMC free article] [PubMed] [Google Scholar]
- 34. Lin J, He Y, Wang B, et al. Blocking of YY1 reduce neutrophil infiltration by inhibiting IL‐8 production via the PI3K‐Akt‐mTOR signaling pathway in rheumatoid arthritis. Clin Exp Immunol. 2019;195(2):226‐236. [DOI] [PMC free article] [PubMed] [Google Scholar]
- 35. Fu SH, Lai MC, Zheng YY, et al. MiR‐195 inhibits the ubiquitination and degradation of YY1 by Smurf2, and induces EMT and cell permeability of retinal pigment epithelial cells. Cell Death Dis. 2021;12(7):708. [DOI] [PMC free article] [PubMed] [Google Scholar]
- 36. Cannizzaro E, Bannister AJ, Han N, Alendar A, Kouzarides T. DDX3X RNA helicase affects breast cancer cell cycle progression by regulating expression of KLF4. FEBS Lett. 2018;592(13):2308‐2322. [DOI] [PMC free article] [PubMed] [Google Scholar]
- 37. Bol GM, Raman V, van der Groep P, et al. Expression of the RNA helicase DDX3 and the hypoxia response in breast cancer. PLoS One. 2013;8(5):e63548. [DOI] [PMC free article] [PubMed] [Google Scholar]
- 38. Yang Y, Zhou L, Lu L, et al. A novel miR‐193a‐5p‐YY1‐APC regulatory axis in human endometrioid endometrial adenocarcinoma. Oncogene. 2013;32(29):3432‐3442. [DOI] [PubMed] [Google Scholar]
- 39. Pyo JS, Kim DH, Yang J. Diagnostic value of CD56 immunohistochemistry in thyroid lesions. Int J Biol Markers. 2018;33(2):161‐167. [DOI] [PubMed] [Google Scholar]
- 40. Li RH, Tian T, Ge QW, et al. A phosphatidic acid‐binding lncRNA SNHG9 facilitates LATS1 liquid–liquid phase separation to promote oncogenic YAP signaling. Cell Res. 2021.31 (10):1088–1105. [DOI] [PMC free article] [PubMed] [Google Scholar]
- 41. Verma N, Muller AK, Kothari C, et al. Targeting of PYK2 synergizes with EGFR antagonists in basal‐like TNBC and circumvents HER3‐associated resistance via the NEDD4‐NDRG1 axis. Cancer Res. 2017;77(1):86‐99. [DOI] [PubMed] [Google Scholar]
- 42. Hou J, Zhou Y, Zheng Y, et al. Hepatic RIG‐I predicts survival and interferon‐alpha therapeutic response in hepatocellular carcinoma. Cancer Cell. 2014;25(1):49‐63. [DOI] [PubMed] [Google Scholar]
- 43. Wilson ID. High‐performance liquid chromatography–mass spectrometry (HPLC–MS)‐based drug metabolite profiling. Methods Mol Biol. 2011;708:173‐190. [DOI] [PubMed] [Google Scholar]
- 44. Chen T, Chen X, Zhang S, et al. The Genome Sequence Archive Family: Toward explosive data growth and diverse data types. Genom Proteom Bioinform. 2021.19(4):578–583. [DOI] [PMC free article] [PubMed] [Google Scholar]
Associated Data
This section collects any data citations, data availability statements, or supplementary materials included in this article.
Supplementary Materials
Supporting Information
Data Availability Statement
The dataset generated during the current study is available from the corresponding author on reasonable request.