

Abstract
Tight control of glycemia is a major treatment goal for type 2 diabetes mellitus (T2DM). Clinical studies indicated that factors other than poor glycemic control may be important in fostering T2DM progression. Increased levels of methylglyoxal (MGO) associate with complications development, but its role in the early steps of T2DM pathogenesis has not been defined. Here, we show that MGO accumulation induces an age‐dependent impairment of glucose tolerance and glucose‐stimulated insulin secretion in mice knockdown for glyoxalase 1 (Glo1KD). This metabolic alteration associates with the presence of insular inflammatory infiltration (F4/80‐positive staining), the islet expression of senescence markers, and higher levels of cytokines (MCP‐1 and TNF‐α), part of the senescence‐activated secretory profile, in the pancreas from 10‐month‐old Glo1KD mice, compared with their WT littermates. In vitro exposure of INS832/13 β‐cells to MGO confirms its casual role on β‐cell dysfunction, which can be reverted by senolytic treatment. These data indicate that MGO is capable to induce early phenotypes typical of T2D progression, paving the way for novel prevention approaches to T2DM.
Keywords: aging, dicarbonyl stress, glyoxalase 1, insulin secretion, methylglyoxal
Subject Categories: Metabolism
Methylglyoxal accumulation promotes a pro‐inflammatory microenvironment in pancreatic islets of mice, leading to an age‐dependent impairment of glucose‐stimulated insulin secretion (GSIS) and glucose tolerance in mice.

Introduction
Tight control of blood glucose levels is still used as a major goal for treatment of diabetes mellitus (DM). Nonetheless, while most of the literature claims an indisputable role of good glycemic control in the prevention of vascular complications, clinical studies have indicated that lowering glycated hemoglobin (HbA1c) only partially reduces the risk of cardiovascular events in diabetic patients (Action to Control Cardiovascular Risk in Diabetes Study et al, 2008; Currie et al, 2010; Lind et al, 2010, 2014; DCCT/EDIC Research Group, 2014), suggesting that factors other than poor glycemic control are important in inducing vascular complications (Fleming & Nawroth, 2014; Bots et al, 2016).
Among the biochemical mechanisms by which hyperglycemia affects cellular function, the increase in reactive dicarbonyls, including methylglyoxal (MGO), has been identified as an important player (Nigro et al, 2017; Schalkwijk & Stehouwer, 2019). MGO is the major source of intra‐ and extracellular advanced glycation end products (AGEs; Brownlee, 2001), which lead to cellular dysfunction and the progression of tissue damage (Rabbani & Thornalley, 2014a; Nigro et al, 2019). MGO is mainly formed by the non‐enzymatic dephosphorylation of triose phosphates, as a byproduct of the glycolytic flux (Sousa Silva et al, 2013). However, its increase may be additionally raised by the oxidation of ketone bodies, protein catabolism, glyceroneogenesis, or by impaired detoxification by the glyoxalase system or depletion of available glutathione (GSH) (Rabbani et al, 2016). Indeed, physiological levels of MGO are guaranteed by efficient detoxification in D‐lactate by the glyoxalase 1 and 2, requiring GSH as cofactor (Sousa Silva et al, 2013). A decrease in Glo1 activity and transcription has been described to occur physiologically with aging (Xue et al, 2011; Fleming et al, 2013), and in other pathological conditions, such as oxidative stress, inflammation, and senescence (Bierhaus et al, 2001; Ikeda et al, 2011; Rabbani et al, 2016).
Methylglyoxal levels have been estimated to be twofold to fivefold higher in type 2 and type 1 diabetic patients, respectively, compared with healthy individuals (Lapolla et al, 2003; Schalkwijk & Stehouwer, 2019). However, it has been shown that MGO formation remains increased in diabetic patients even after normalization to glucose concentrations (Fleming et al, 2012). A recent investigation performed in newly diagnosed type 2 diabetes (T2D) patients demonstrated a significant increase in MGO plasma levels already at an early stage in diabetes and in the absence of diabetic complications (Kong et al, 2014). Furthermore, an increase in MGO adducts, that is, methylglyoxal‐derived hydroimidazolone (MG‐H1), has been observed in the pre‐diabetic state, irrespective of unaltered fasting blood glucose, in spontaneously diabetic rats (Chen et al, 2015). This evidence supports the hypothesis that alterations in MGO metabolism may precede the onset of DM. We further hypothesize that this metabolic unbalance is crucial to the pathogenesis of the disease, acting not only as a result of hyperglycemia but more importantly as an upstream event in the alteration of glucose homeostasis. Indeed, previous studies have proved a damaging effect of MGO and its derived AGEs on micro and macrovascular function (Dobler et al, 2006; Dhar et al, 2010; Nigro et al, 2017), on insulin sensitivity (Jia & Wu, 2007; Engelbrecht et al, 2014; Mey & Haus, 2018) and β‐cell function (Dhar et al, 2011; Fiory et al, 2011; Elmhiri et al, 2014). The majority of these studies have been carried out in models of hyperglycemia where MGO scavenging demonstrated to be effective in reducing damage or under exogenous administration of MGO. In more recent studies, the modulation of the Glo1 gene in non‐mammal models has demonstrated that MGO elevations induce metabolic defects, namely insulin resistance, obesity, and hyperglycemia in Glo1 knockout (Glo1KO) Drosophila (Moraru et al, 2018), and the progression toward hyperglycemia and blood vessel alterations in Glo1KO Zebrafish under overfeeding conditions (Lodd et al, 2019). In rodents, the silencing of Glo1 is sufficient to cause hyperalgesia and alterations in kidney morphology, similar to those induced by diabetes, in mice knockdown for Glo1 (Glo1KD; Bierhaus et al, 2012; Giacco et al, 2014).
However, the impact of the endogenous increase in MGO on glucose metabolism in mammals is still uncertain. The aim of this study is to prove the specific role of MGO accumulation, in the absence of other metabolic hits, on glucose homeostasis in Glo1KD mice.
Results
Glo1KD mice show reduced Glo1 expression and increased MGO plasma levels
Glo1KD mice and their WT littermates (WT mice) have been used to evaluate the effect of MGO accumulation on glucose homeostasis. As expected, Glo1 expression was lower in tissues from Glo1KD mice than WT mice. In detail, mRNA levels were reduced by 90%, 40%, and 62% in skeletal muscle, white adipose tissue, and liver, respectively, of Glo1KD mice compared with WT mice at 10 months of age (Fig 1A–C). The expression levels of the alternative enzymes for MGO detoxification, aldo‐keto reductase family 1 member B3 (Akr1b3) and aldehyde dehydrogenase family 1 member A3 (Aldh1a3), were not different in skeletal muscle, white adipose tissue, and liver from WT and Glo1KD mice (Fig 1D–I). The partial deletion of Glo1 expression is sufficient to induce with age the endogenous accumulation of MGO in this model. Indeed, MGO levels became increased by ca. 50% in the serum from Glo1KD mice compared with WT mice at 10 months of age, but not earlier at 5 months of age (Table 1).
Figure 1. mRNA tissue expression of MGO‐detoxifying enzymes and MGO serum levels.

-
A–IData distribution of the absolute quantification of Glo1 (A–C), Akr1b3 (D–F), and Aldh1a3 (G–I) gene expression measured by qRT–PCR in skeletal muscle (quadriceps) (A, D, and G), white adipose tissue (WAT, epididymal fat) (B, E, and H) and liver (C, F, and I) of 10‐month‐old Glo1KD (n = 5 in D; n = 6 in F and I; n = 7 in C and G; n = 8 in A and H; n = 9 in B and E) and WT mice (n = 6 in E, F and I; n = 7 in B–D, G and H; n = 8 in A). Cyclophilin A was used as reference gene. Gene expression is shown as the ratio of Glo1, Akr1b3, or Aldh1a3 to Cyclophilin A copy number (arbitrary units, AU).
Data information: Bars in the scatter plots show the mean ± SEM. ***P ≤ 0.05 (Mann–Whitney test in A, Student’s t‐test in B–I).
Table 1.
Metabolic parameters in WT and Glo1KD mice.
| Variable | WT mice | Glo1KD mice | WT mice | Glo1KD mice |
|---|---|---|---|---|
| 5 months | 10 months | |||
| Body weight (g) | 25.4 ± 0.8 | 24.6 ± 0.8 | 32.6 ± 1.5### | 35.9 ± 2.0### |
| Food intake (g/day) | 2.88 ± 0.06 | 3 ± 0.12 | 3 ± 0.12 | 2.8 ± 0.24 |
| Fasting glycemia (mg/dl) | 105.9 ± 5.3 | 98.1 ± 3.5 | 114.6 ± 8.4 | 110.4 ± 7.4 |
| Fed glycemia (mg/dl) | 129.7 ± 6.4 | 134.8 ± 6.4 | 149.3 ± 8.5 | 153.1 ± 6.1 |
| Serum Insulin (ng/ml) | 0.75 ± 0.14 | 0.88 ± 0.14 | 0.68 ± 0.12 | 0.89 ± 0.05 |
| Serum Glucagon (pg/ml) | 285.4 ± 20 | 275.1 ± 42.7 | 285.4 ± 35.8 | 290.1 ± 32.2 |
| Plasma MGO (nM) | 197.6 ± 6.4 | 185.4 ± 13.7 | 182.6 ± 15.6 | 267.2 ± 5.7***,### |
Body weight, food intake, fasting and fed glycemia, serum insulin, glucagon, and plasma MGO were measured in Glo1KD mice and their WT littermates at 5 and 10 months of age (body weight, food intake, and fasting glycemia: 5 months n = 19, 10 months n = 15; fed glycemia, plasma insulin, glucagon and MGO: 5 months n = 6, 10 months n = 8). Data are reported as mean ± SEM values. Statistical analysis was performed by Student’s t‐test for data with a normal distribution, or with Mann–Whitney test for data with a not normal distribution, where P ≤ 0.05 was considered statistically significant (***P < 0.001, age‐matched Glo1KD vs. WT mice; ### P < 0.001, 10 months vs. 5 months).
Glo1KD mice develop an impairment of glucose tolerance with aging
Metabolic characteristics of Glo1KD mice and their WT littermates have been monitored during lifespan. As reported in Table 1, there was no significant difference in body weight, food intake, fed and fasting glycemia, serum insulin, and glucagon levels in age‐matched WT and Glo1KD mice. As expected, body weight increased at 10 months of age compared with 5 months in both genotypes (Table 1). Differently, glucose tolerance was impaired with age, as demonstrated by higher glycemic levels observed during an intraperitoneal glucose tolerance test (ipGTT) in Glo1KD mice at 10 months (Fig 2B) but not at 5 months of age (Fig 2A), as compared to WT mice. Insulin sensitivity was evaluated by an ITT and appeared not to be significantly compromised in Glo1KD mice either at 5 (Fig 2C) or at 10 months of age (Fig 2D), as shown in Fig 2 by both the glycemic trend (line graphs) and the inverse area under the curve (iAUC) calculation (bar graphs). These results indicate that the impairment of glucose tolerance developed by Glo1KD mice with age was not associated with peripheral insulin resistance.
Figure 2. Evaluation of glucose tolerance and insulin sensitivity.

-
A, BEvaluation of glucose tolerance in 5‐month‐old (A, WT n = 19 and Glo1KD n = 20) and 10‐month‐old mice (B, n = 15) by ipGTT. Line graphs show the trend of blood glucose levels within 120 min after intraperitoneal administration of a glucose bolus (2 g/kg). Bar graphs on the right side of panels A and B show the GTT IAUC of Glo1KD and WT mice.
-
C, DEvaluation of insulin sensitivity in 5‐month‐old (C, WT n = 8 and Glo1KD n = 7) and 10‐month‐old mice (D, WT n = 5 and Glo1KD n = 7) by ITT. Line graphs show the trend of blood glucose levels within 120 min after intraperitoneal administration of an insulin bolus (0.75 U/kg). Blood glucose was measured by the use of a portable blood glucometer at the indicated time points (X axes). Bar graphs on the right side of panels C and D show the ITT iAUC of Glo1KD and WT mice.
Data information: Data are presented as mean ± SEM. **P ≤ 0.01 (Mann–Whitney test for line graph in B, Student’s t‐test for scatter plots in B); *P ≤ 0.05 (Student’s t‐test).
Interestingly, while insulin secretion was similar in Glo1KD mice and WT mice at 5 months of age (Fig 3A), it was strongly impaired in Glo1KD mice at 10 months (Fig 3B). In detail, 10‐month‐old WT mice showed a 2.7‐fold increase in insulinemia in the early phase of secretion, which was significantly reduced to 1.3‐fold increase in Glo1KD mice. The age‐dependent impairment of glucose‐stimulated insulin secretion in Glo1KD mice was also evident by analyzing the incremental area under the curve (IAUC, bar graphs in Fig 3).
Figure 3. Evaluation of glucose‐stimulated insulin secretion (GSIS).

-
A, BLine graphs show the serum insulin levels at 0, 3, and 30 min following the administration of an intraperitoneal glucose bolus (3 g/kg) in mice at 5 months (A, WT n = 6 and Glo1KD n = 4) and 10 months of age (B, n = 6). Bar graphs on the right side of panels show the IAUC monitored during the insulin secretion test in Glo1KD and WT mice.
Data information: Data are presented as mean ± SEM. *P ≤ 0.05, **P ≤ 0.01: 3 and 30 min vs. time 0 of WT mice; # P ≤ 0.05, ## P ≤ 0.01: 3 and 30 min vs. time 0 of Glo1KD mice; $ P ≤ 0.05: Glo1KD vs. WT mice (Student’s t‐test).
Pancreas from Glo1KD mice reveals macrophage infiltration and impaired GSIS of isolated islets
Hematoxylin and eosin staining and immunohistochemistry analysis performed in pancreatic sections from 10‐month‐old mice (Fig 4A) showed no differences in the number (Fig 4D), the morphometry (Fig 4E–G), and the insulin (Fig 4H) and glucagon staining (Fig 4I) of the islets from WT and Glo1KD mice. The measurement of insulin and glucagon content in the isolated islets confirmed no differences in the two genotypes (Fig 4 K and L). As shown in panel 4b, the presence of insular inflammatory infiltration was visible with an incidence mean value of 6% at different severity degree (Fig 4C) in the pancreatic sections from Glo1KD mice but not in the sections from WT mice (Fig 4B and C, and Table EV1). More in detail, insular macrophage marker F4/80 was present with a median value of 5% in the pancreatic sections from Glo1KD mice, while no F4/80‐positive cells were found in the sections from WT mice (Fig 4 J and A, right panels). The tissue levels of MGO were 2.5‐fold increased in the pancreas from 10‐month‐old Glo1KD mice compared with WT mice (Fig 4M).
Figure 4. Immunohistochemistry evaluations and hormones measurement in pancreatic islets of 10‐month‐old WT and Glo1KD mice.

-
APancreatic sections (20× magnification) from 10‐month‐old WT and Glo1KD mice stained with hematoxylin and eosin (H&E), anti‐insulin, anti‐glucagon, and anti‐F4/80 antibodies are representative of sections from 7 mice each group.
-
B, CInsular inflammatory infiltration indicated as incidence (% of infiltrated islets) (B) and severity score (C). Severity of infiltration has been graded as follows: absent (0), low (1), moderate (2), and high (3) (n = 7 mice for each genotype).
-
D–GMorphometric analysis of islets indicated as the number of islets per sections (D) and the size of islets, calculated as the area (E), the major diameter (F), and the minor diameter (G) of the islets per mouse (n = 7 mice for each genotype).
-
H–JInsulin and glucagon IS, calculated as the intensity score multiplied with percentage of positive cells (H, I) and the percentage of islets area stained with F4/80 (J) (n = 7 mice for each genotype).
-
K, LQuantification of insulin (K) and glucagon (L) content in islet extracts by immunoenzymatic assay (n = 7 WT mice vs. n = 10 Glo1KD mice).
-
MMGO content in pancreatic lysates by LC‐MS/MS (n = 6 mice for each genotype).
Data information: In (B–M), box plots show the minimum and maximum values (ends of the whiskers), interquartile range (length of the box), median (line through the box), and mean (+) values. *P ≤ 0.05, **P ≤ 0.01 (Mann–Whitney test).
Source data are available online for this figure.
mRNA levels of F4/80 and CD68 have been used as macrophage markers. Pancreatic expression levels of both F4/80 encoding gene, adhesion G protein‐coupled receptor E1 (Adgre1), and Cd68 were not different in the two genotypes at 5 months of age (Fig 5A and B), while pancreatic Glo1 expression was reduced by about 50% in Glo1KD mice compared with WT mice (Fig 5C). Ten‐month‐old Glo1KD mice showed increased expression in both Adgre1 and Cd68 in the pancreas, compared with age‐matched WT mice (Fig 5A and B), consistently with the immunohistochemistry analysis. The reduction in Glo1 expression found in 5‐month‐old Glo1KD mice was maintained in these mice at 10 months of age, compared with age‐matched WT mice (Fig 5C). As shown in some insulin target tissues in Fig 1, the expression of both Aldh1a3 (Fig EV1A) and Akr1b3 (Fig EV1B) was unaltered in the pancreas from WT and Glo1KD mice.
Figure 5. Macrophage markers gene expression in pancreatic tissue, isolated islets, and ex vivo GSIS.

-
A–CData distribution of the absolute quantification of Adgre1 (A), Cd68 (B), and Glo1 (C) gene expression measured by qPCR in pancreatic tissue from WT and Glo1KD mice at 5 (upper panels, WT n = 9, Glo1KD n = 7 in A, C and n = 8 in B) and 10 months of age (lower panels, WT n = 7, Glo1KD n = 9 in A, B and n = 10 in C).
-
D, EData distribution of the absolute quantification of Adgre1 (D) and Cd68 (E) gene expression measured by qPCR in the isolated islets from WT and Glo1KD mice at 5 (upper panels, WT n = 7 in D and 6 in E, Glo1KD n = 7) and 10 months of age (lower panels, WT n = 7, Glo1KD n = 7 in D and 6 in E). Cyclophilin A was used as reference gene. Gene expression is shown as the ratio of Adgre1, Cd68, or Glo1 to Cyclophilin A copy number (AU).
-
F, GEx vivo GSIS showed as fold of increase (F) and as insulin concentration released into the secretion media (G) in response to the basal condition at 2.8 mM glucose and to the stimulated condition at 16.7 mM glucose, of pancreatic islets from WT (n = 8) and Glo1KD mice (n = 9) at 10 months of age. Insulin concentration was normalized on DNA islets content.
Data information: Bars in the scatter plots show the mean ± SEM. *P ≤ 0.05, **P ≤ 0.01, ***P ≤ 0.001: WT vs. Glo1KD mice; ##P ≤ 0.01, ###P ≤ 0.001: 16.7 mM glucose vs. 2.8 mM glucose (Mann–Whitney test).
Figure EV1. Expression levels of alternative detoxification enzymes of MGO in the pancreatic tissue.
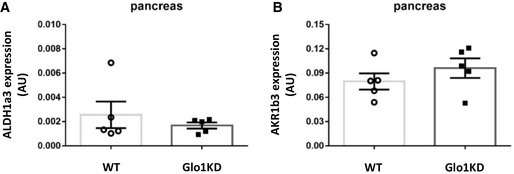
-
A, BData distribution of the absolute quantification of Aldh1a3 (A) and Akr1b3 (B) gene expression measured by qRT–PCR in the pancreas of WT and Glo1KD mice (n = 5). Cyclophilin A was used as reference gene. Gene expression is shown as the ratio of Aldh1a3 or Akr1b3 to Cyclophilin A copy number (AU).
Data information: Bars in the scatter plots show the mean ± SEM. Statistical analysis was performed by Mann–Whitney test (A) or Student’s t‐test (B), where P ≤ 0.05 was considered statistically significant.
Increased Adgre1 and Cd68 expression was confirmed in the isolated islets from 10‐month‐old WT and Glo1KD mice, while no difference was revealed in the islets from 5‐month‐old mice (Fig 5D and E). The expression of integrin subunit alpha x (Itgax) has been evaluated in the isolated islets as further marker of M1 macrophages. Its expression was increased in the islets from Glo1KD vs. WT mice at 10 months of age (Fig EV2B), but not at 5 months of age (Fig EV2A).
Figure EV2. Gene expression of the macrophage marker Itgax in isolated islets.

-
A, BData distribution of the absolute quantification of Itgax gene expression measured by qPCR in the isolated islets from WT and Glo1KD mice at 5 (A, WT n = 6 and Glo1KD n = 8) and 10 months of age (B, WT n = 7 and Glo1KD n = 6).
Data information: Cyclophilin A was used as reference gene. Gene expression is shown as the ratio of Itgax to Cyclophilin A copy number (AU). Bars in the scatter plots show the mean ± SEM. **P ≤ 0.01 (Mann–Whitney test).
Differently from the pancreas, no differences in Adgre1 expression were detected in other tissues involved in maintaining of glucose homeostasis, namely liver (Fig EV3A), white adipose tissue (Fig EV3B), and skeletal muscle (Fig EV3C).
Figure EV3. Adgre1 gene expression in other tissues.

-
A–CData distribution of the absolute quantification of Adgre1 gene expression measured by qRT–PCR in liver (A), white adipose tissue (WAT, perigonadal fat) (B), and skeletal muscle (C) of WT (n = 7 in A, C and n = 6 in B) and Glo1KD mice (n = 7) at 10 months of age. Cyclophilin A was used as reference gene.
Data information: Gene expression is shown as the ratio of Adgre1 to Cyclophilin A copy number (arbitrary units, AU). Bars in the scatter plots show the mean ± SEM. Statistical analysis was performed by Mann–Whitney test (A, B) or Student’s t‐test (C), where P ≤ 0.05 was considered statistically significant.
In addition to the cellular components, pancreatic inflammation has also been tested by the local presence of inflammatory soluble factors, which are known to be involved in the cross talk between β‐cells and macrophages and to be associated with β‐cell dysfunction (Donath et al, 2013; Butcher et al, 2014). Multiplex immunoassays revealed a 40% increase in both MCP‐1 and TNF‐α concentration in the pancreas lysate of 10‐month‐old Glo1KD mice, compared with WT mice. IL‐1β pancreatic levels were not found to be significantly higher in Glo1KD mice than WT mice (Table 2). The expression levels of MCP‐1, TNF‐α, and IL‐1β mRNA were significantly increased in the pancreatic islets isolated from 10‐month‐old Glo1KD mice, compared with WT mice (Fig EV4).
Table 2.
Cytokine levels in pancreatic tissue.
| WT mice | Glo1KD mice | |
|---|---|---|
| IL‐1β (pg/ml × 1/mg of proteins) | 80.39 ± 3.68 | 90.47 ± 6.08 |
| MCP‐1 (pg/ml × 1/mg of proteins) | 845.48 ± 55.64 | 1212.01 ± 137.88* |
| TNF‐α (pg/ml × 1/mg of proteins) | 678.22 ± 46.54 | 955.57 ± 94.84* |
Mean ± SEM values of IL‐1β, MCP‐1, and TNF‐α in pancreatic lysate from 10‐month‐old WT (n = 7) and Glo1KD (n = 10) mice are reported in table. Statistical analysis was performed by Student’s t‐test for data with a normal distribution, or with Mann–Whitney test for data with a not normal distribution (*P < 0.05, 10‐month‐old Glo1KD vs. WT mice).
Figure EV4. Expression levels of IL‐1β, MCP‐1, and TNF‐α in the isolated islets.

-
A–CData distribution of the absolute quantification of IL‐1β (A), MCP‐1 (B), and TNF‐α gene expression measured by qRT–PCR in the islets isolated from WT and Glo1KD mice (n = 6).
Data information: Cyclophilin A was used as reference gene. Gene expression is shown as the ratio IL‐1β, MCP‐1, or TNF‐α to Cyclophilin A copy number (AU). Bars in the scatter plots show the mean ± SEM. *P ≤ 0.05 (Student’s t‐test).
The observed pro‐inflammatory microenvironment associates with an impaired GSIS ex vivo of the isolated islets (Fig 5F and G). A 2.5‐fold increase in insulin secretion in response to glucose stimulation, observed in the islets from WT mice, was decreased to 1.2‐fold increase in the islets from 10‐month‐old Glo1KD mice.
Glo1KD isolated islets express senescence markers
Unveiled by aging, the phenotype observed in Glo1KD mice recalls typical traits described by Aguayo‐Mazzucato et al (2017, 2019) in senescent islets induced by aging and metabolic stress. To test whether senescence may be the mechanism sustained by MGO accumulation in our model, we tested the expression of the senescence markers transformation‐related protein 53 (Trp53) and cyclin‐dependent kinase inhibitor 1A (Cdkn1a) (Rufini et al, 2013), besides two novel markers of age‐related β‐cell functional decline, insulin‐like growth factor 1 receptor (Igf1r) and fibroblast growth factor receptor 1 (Fgfr1) (Aguayo‐Mazzucato et al, 2017). mRNA levels of Trp53, Cdkn1a, and Igf1r were not significantly different in pancreatic islets isolated from both 5‐month‐old WT and Glo1KD mice (Fig 6A, C and E). Conversely, the expression of Trp53, Cdkn1a, and Igf1r was increased by 48%, 88%, and 39%, respectively, in the pancreatic islets isolated from 10‐month‐old Glo1KD mice, compared with WT islets (Fig 6B, D and F). The expression of Fgfr1 was reduced by 37% in the islets from both 5‐ and 10‐month‐old Glo1KD mice, compared with the islets from age‐matched WT mice (Fig 6G and H).
Figure 6. Trp53, Cdkn1a, Igf1r, and Fgfr1 gene expression in isolated islets.

-
A–HData distribution of the absolute quantification of Trp53 (A, B), Cdkn1a (C, D), Igf1r (E, F), and Fgfr1 (G, H) gene expression measured by qPCR in pancreatic islets of WT and Glo1KD mice at 5 months (A, C, E, and G; WT n = 7, Glo1KD n = 7 in C and n = 8 in A, E and G) and 10 months of age (B, D, F, and H; WT n = 6 in D and n = 8 in B, F, and H, Glo1KD n = 6). β‐Actin was used as reference gene. Gene expression is shown as the ratio of Trp53, Cdkn1a, Igf1r, or Fgfr1 to β‐Actin copy number (AU).
Data information: Bars in the scatter plots show the mean ± SEM. *P ≤ 0.05, **P ≤ 0.01 (Student’s t‐test).
MGO impairs GSIS in vitro in a β‐cell line through a senescence‐mediated mechanism
To confirm that the β‐cell dysfunction found in the Glo1KD model was an effect mediated by: (i) the MGO increase and (ii) a consequent induction of senescence, we exposed INS‐1 832/13 cells to MGO in vitro and looked at some functional and senescence markers. Forty‐eight hours of exposure to MGO induced an increase in both the mRNA (Fig 7A and B) and protein levels (Fig 7C) of two canonical inducers of cellular senescence: p53 and p21. In detail, an increase of 35% of Trp53 expression resulted in a twofold increase of p53 protein levels, and an increase of 30% of Cdkn1a expression resulted in a 2.5‐fold increase of p21 protein levels in INS‐1 832/13 cells exposed to MGO, as compared to not‐treated control cells. Further 24 h of cell treatment with dasatinib (31 nM) and quercetin (6 μM), used in combination as senolytic agents (Aguayo‐Mazzucato et al, 2019), were able to reduce both the mRNA and protein expression of p53 and p21 at levels comparable to controls (Fig 7A–C). Several cells entering senescence lost nuclear high mobility group box 1 (HMGB1), depending on p53 activity (Davalos et al, 2013). The exposure to MGO also induced the nuclear exclusion of HMGB1 in INS‐1 832/13, while the nuclear protein levels were rescued by the senolytics treatment (Fig 7D). Furthermore, the senescence‐activated β‐galactosidase (β‐Gal) activity was tested as marker of senescence in our experimental model. Under MGO treatment, the percentage of β‐Gal+ cells increased from 1.9% to 5.4% and was reversed by senolytics (Fig 7E).
Figure 7. Senolytics effect on MGO‐treated INS‐1 832/13 β‐cell line.

-
A, BmRNA levels of Trp53 and Cdkn1a in INS‐1 832/13 cells treated with MGO 0.05 mM for 48 h or with MGO plus 24 h of dasatinib 31 nM and quercetin 6 μM (D/Q) (n = 6 biological replicates for each group). Gene expression is measured by qPCR as relative quantification to Cyclophilin A, used as reference gene.
-
CWhole cell protein lysates of INS‐1 832/13 β‐cells analyzed by Western Blot with anti‐p53 and anti‐p21 antibodies; anti‐vinculin antibody was used as loading control (n = 9 biological replicates for each treatment group).
-
DNuclear protein lysates of INS‐1 832/13 β‐cells analyzed by Western Blot with anti‐HMGB1 antibody; anti‐histone H3 antibody was used as loading control (n = 5 biological replicates for each treatment group).
-
EProportion of β‐Gal+ β‐cells analyzed by a fluorescence‐based assay using flow cytometry (n = 4 biological replicates for each treatment group).
-
FCytokine levels measured in the β‐cell culture medium by a multiplex immunoassay are shown as fold increase over not‐treated control cells (n = 6 biological replicates for each treatment group).
-
GGSIS measured in the β‐cell culture medium by an ELISA assay. Insulin concentration is reported at basal condition (2.5 mM glucose) and in response to glucose stimulation (16.7 mM) (n = 4 biological replicates for each treatment group).
Data information: Data in bar graphs are presented as mean ± SEM. In C and D, blots show representative image of replicate experiments; protein levels were quantified by the densitometric analysis of independent experiments and showed in the bar graphs as the percentage over not‐treated control cells. *P ≤ 0.05, **P ≤ 0.01, ***P ≤ 0.001: MGO vs. CTR; #P ≤ 0.05, ##P ≤ 0.01, ###P ≤ 0.001: D/Q vs. MGO (Mann–Whitney test in A–D and F, Student’s t‐test in E and G).
INS‐1 832/13 cells treated with MGO showed an increased secretion of the senescence‐associated secretory profile (SASP) cytokines: IL‐1β, MCP‐1, and TNF‐α, by 40%, 35%, and 30%, respectively (Fig 7F). This increase was blunted in MGO‐exposed cells by dasatinib and quercetin combined treatment (Fig 7F).
The observed effects associate with the modulation of GSIS. Indeed, while not‐treated INS‐1 832/13 cells showed a sevenfold increase in insulin secretion in response to glucose, MGO‐treated cells showed a fourfold increase, which was significantly lower than the insulin secretion observed in not‐treated control cells (Fig 7G). Interestingly, treatment with dasatinib and quercetin was able to rescue the GSIS in INS‐1 832/13 cells exposed to MGO (Fig 7G).
A decline in mtDNA has been reported in human pancreatic islets with aging (Cree et al, 2008) and its depletion in β‐cells directly decreases GSIS (Nile et al, 2014). Levels of mitochondrial transcription factor A (mtTFA), which plays a key role in regulating of mtDNA replication, are proportional to mtDNA (Choi et al, 2001). Here, we found a 30% reduction in both mtDNA content and mtTFA expression in INS832/13 exposed to MGO (Fig EV5).
Figure EV5. MGO effect on mtDNA content and mtTFA expression.

- Quantitative RT–PCR detection of mtDNA content relative to nuclear DNA (nucDNA) in INS832/13 β‐cells exposed or not to MGO (n = 10 biological replicates for each group).
- Quantitative RT–PCR detection of mtTFA expression levels in INS832/13 β‐cells exposed or not to MGO. Gene expression data are shown as relative to Cyclophilin A, used as reference gene (n = 7 biological replicates for each group).
Data information: Data are presented as mean ± SEM. In A, **P ≤ 0.01 (Student’s t‐test). In B, ***P ≤ 0.001 (Mann–Whitney test).
These data provide the proof of concept that the β‐cell dysfunction induced by MGO is mediated by a senescence‐associated phenotype.
Discussion
Our work demonstrates that a metabolic unbalance promoting MGO accumulation is able to alter glucose homeostasis. This study shows for the first time, indeed, that the knockdown of Glo1 induces the development of glucose intolerance and β‐cell dysfunction in C57BL/6 mice. We also demonstrate that the β‐cell dysfunction associates with the presence of a senescence‐related pro‐inflammatory microenvironment both in the pancreas of Glo1KD mice and in MGO‐treated β‐cells in vitro.
Methylglyoxal levels are elevated in diabetic patients and animal models of diabetes (Rabbani & Thornalley, 2015; Huang et al, 2016; Maessen et al, 2016). Most studies analyzing the consequences of dicarbonyl stress have been carried out in their complex metabolic milieu. The advantage of using the Glo1KD mouse is the opportunity to evaluate whether and which alterations result from the MGO increase by itself, excluding the presence of confounding factors deriving from hyperglycemia and obesity. Previous works on the Glo1KD mice have proved the onset of diabetes‐like kidney morphological alterations (Giacco et al, 2014) and both thermal and mechanical hyperalgesia (Bierhaus et al, 2012) as a consequence of protein modifications by MGO. However, no evidence on the role of Glo1 knockdown in mouse glucose metabolism is presently available.
Differently from the Glo1KO model (Schumacher et al, 2018), partial deletion of Glo1 causes the accumulation of endogenous MGO with age but not the increase in the alternative enzymes for MGO detoxification, ALDH and AKR. These data suggest that when Glo1 is decreased but not completely abolished, it fails to keep down MGO levels with age, and compensatory mechanisms of MGO detoxification are not activated.
In the current study, we demonstrate that the knockdown of Glo1 does not have an effect either on feeding behavior or on body weight, confirming previous findings by Wortmann et al (2016). In their work, no difference in body composition (i.e., total body weight, relative fat and lean mass) and energy expenditure in 5‐month‐old Glo1KD mice compared with WT mice was reported (Wortmann et al, 2016). Here, we have further expanded the monitoring of glucose metabolism until 10 months. While no significant difference occurs in both fasting and fed glycemia, in serum insulin and glucagon levels of Glo1KD mice compared with WT mice, either at 5 or 10 months of age, Glo1KD mice develop an impairment of glucose tolerance with age.
This study has been performed in age‐matched male mice. While the use of both sexes would give additional insight in the potential impact of sex differences on the observed phenotype, we chose to use male mice to reduce the variability due to the known sex‐dependent biological difference in glucose metabolism (Mauvais‐Jarvis et al, 2017; Dockman et al, 2022). Our analyses are based on the comparison of age‐matched WT and Glo1KD mice; therefore, the age‐related impairment of glucose tolerance in the mouse strain C57bl/6 does not impact on genotype‐related phenotype.
We have previously demonstrated that MGO administration impairs insulin sensitivity in C57BL/6 mice (Nigro et al, 2014). However, Glo1KD mice do not show systemic insulin resistance, either at 5 or at 10 months of age. The difference in the insulin sensitivity between mice exposed to MGO and the genetically modified Glo1KD mice may depend on the intrinsic differences of the two models. Mice exposed to chronic exogenous administration of MGO showed a large 2.5‐fold increase in serum MGO (Nigro et al, 2014). A smaller increase has been measured in the serum of Glo1KD mice, better reflecting the in vivo conditions established when the endogenous accumulation of MGO occurs (Skapare et al, 2013; Giacco et al, 2014; Masania et al, 2016; Nigro et al, 2017).
Studies in experimental models have demonstrated that MGO causes pancreatic β‐cell dysfunction (Dhar et al, 2011; Fiory et al, 2011; Elmhiri et al, 2014; Bo et al, 2016) and, therefore, may contribute to the pathogenesis of diabetes. The Glo1KD model gave us the possibility to investigate the glucose homeostasis in a nondiabetic condition where the endogenous increase in MGO is the only trigger of metabolic imbalance. As expected, insulin secretion in response to glucose physiologically decreases with age in WT C57BL/6 mice. However, consistent with the impairment of glucose tolerance, in this study, we demonstrate that Glo1KD mice develop a significant defect in glucose‐stimulated insulin secretion, tested both in vivo and ex vivo in isolated islets at 10 months of age. Both glucose tolerance and insulin secretion were not impaired in younger animals at 5 months of age. These results, together with the unaltered insulin sensitivity, support the hypothesis that glucose intolerance is a result of age‐related impairment of β‐cell function developed by Glo1KD mice.
Although ipGTT and GSIS are impaired in 10‐month‐old Glo1KD mice, but not in 5‐month‐old mice, neither fast nor fed blood glucose levels are significantly different in Glo1KD compared with WT mice. One can suggest that Glo1KD mice metabolic phenotype recapitulates with age some endophenotypes of diabetes; however, they do not feature overt diabetes, as shown by normal levels of fed and fast glycemia.
Unveiled by aging, this phenotype suggests a potential role for a senescence‐associated mechanism triggered by MGO.
Immunohistochemistry analysis has revealed an association between the impaired insulin secretion and the presence of inflammatory infiltration in the islets from Glo1KD mice. The immune system plays a significant role in the regulation of metabolism (Osborn & Olefsky, 2012). A large number of immune cells, predominantly macrophages, have been detected in the islets of patients with T2D and in animal models in conjunction with increased levels of cytokines and chemokines (Ehses et al, 2007; Donath et al, 2013). The contribution of other immune cells besides macrophages to islet cell infiltration in T2D is less clear (Marchetti, 2016). We found the presence of macrophages in the islets of Glo1KD mice. As described in T2D patients, macrophages are dispersed through and around the pancreatic islets of Glo1KD mice (Donath et al, 2013). Besides the histological staining for the macrophage marker F4/80, the mRNA expression levels of F4/80 (Adgre1) and the other macrophage markers, CD68 and Itgax, are higher in the isolated islets from Glo1KD mice compared with WT mice. Although these are extensively used as macrophage markers (Marchetti, 2016; Chan et al, 2019; He et al, 2019; Mukhuty et al, 2021), CD68 has been found to be increased in aged and β‐Gal+ β‐cells (Aguayo‐Mazzucato et al, 2017, 2019; Ebrahimi et al, 2020). In line with this, CD68 gene expression increases with aging also in the islets of our control WT mice (Fig EV6B). Conversely, neither Adgre1 (Fig EV6A) nor Itgax (Fig EV6C) expression is increased in the islets of older (10‐month‐old) versus younger (5‐month‐old) WT mice, as also reported in a previous work by Aguayo‐Mazzucato et al (2017), where Adgre1 and Itgax expression is even reduced in old β‐cells. This evidence suggests that, in our experimental condition, while CD68 could be expressed by both the senescent cells and macrophages in the islets of aging mice, the source of Adgre1 and Itgax is derived from the macrophagic but not the senescent component. The increased expression of both Adgre1 and Itgax confirms the macrophage infiltration in the islets from Glo1KD compared with WT mice at 10 months of age. These data indicate that, similarly to the impairment of insulin secretion, this inflammatory phenotype is fostered by Glo1 knockdown during aging.
Figure EV6. Gene expression of Adgre1, CD68, and Itgax in isolated islets from old versus young WT mice.

-
A–CData distribution of the absolute quantification of Adgre1 (A), CD68 (B), and Itgax (C) gene expression measured by qPCR in the isolated islets from WT mice at 5 (n = 7 in A and n = 6 in B, C) and 10 months (n = 7) of age.
Data information: Cyclophilin A was used as reference gene. Gene expression is shown as the ratio of Adgre1, CD68, or Itgax to Cyclophilin A copy number (AU). Bars in the scatter plots show the mean ± SEM. *P ≤ 0.05 (Student’s t‐test).
Data obtained in other tissues crucial to the regulation of glucose tolerance suggest that macrophage infiltration is specific to pancreas. Indeed, we found no difference in the expression of the F4/80 coding gene, Adgre1, in the liver, adipose tissue, and skeletal muscle of Glo1KD mice compared with WT mice.
Cytokine and chemokine levels were previously identified as molecular signature of islet inflammation in T2D (Marchetti, 2016). Among these, we focused on those associated with β‐cell failure. It is known that IL‐1β is produced by β‐cells exposed to high glucose, contributing to islet glucotoxicity and impaired β‐cell function (Maedler et al, 2002; Mahdi et al, 2012). Furthermore, IL‐1β sustains the autocrine and paracrine activation of both β‐cells and macrophages, exacerbating the chronic inflammatory responses in the islets (Donath et al, 2013). Butcher et al (2014) demonstrated that TNF‐α and MCP‐1 expression is higher in leucocyte‐infiltrated islets of T2D subjects and negatively correlates with first‐phase glucose‐stimulated insulin secretion of the isolated islets.
In this study, we show that TNF‐α and MCP‐1 levels are higher in the pancreas from Glo1KD mice compared with WT mice, confirming an association between the local increase in these cytokines and the impaired insulin secretion ability by β‐cells in response to glucose. Low levels of IL‐1β were detected in the pancreatic lysates, and the increase is not statistically different in the Glo1KD compared with WT tissues. However, the mRNA expression of IL‐1β, TNF‐α, and MCP‐1 was specifically measured in the isolated islets and resulted to be higher in the islets from Glo1KD mice compared with WT mice. In accordance with the study by Butcher M.J. et al. in the islets from T2D patients (Butcher et al, 2014), we provide evidence that the accumulation of MGO is sufficient to increase TNF‐α and MCP‐1, suggesting a causal role of the pro‐inflammatory microenvironment in the β‐cell dysfunction.
TNF‐α and IL‐1β are known to be primary cytokines regulating the function of several other cytokines and chemokines, including MCP‐1, thereby contributing to the recruitment of immune cells. Furthermore, both β‐cells and macrophages are potential sources of pro‐inflammatory cytokines within the islets of patients with T2D (Maedler et al, 2002; Morris, 2015).
The experiments performed in vitro in INS‐1 832/13 cells confirm that MGO is able to induce the β‐cell secretion of all the three cytokines analyzed, TNF‐α, MCP‐1, and IL‐1β. In light of these in vitro data, it is conceivable that in the analysis performed ex vivo from the whole pancreas of mice, the IL‐1β increase could be hidden by the contribution of other tissue components.
The aging‐dependent onset of β‐cell dysfunction in Glo1KD mice highlights a potential role of senescence as mechanism induced by MGO. In support of our evidence, different islet phenotypes have been identified in T2D and are characterized by the differential expression of novel senescence markers. The latter can also be induced by both aging and metabolic stress (Aguayo‐Mazzucato et al, 2017). These findings were followed by the description of a SASP actively produced by senescent β‐cells, which plays not only an autocrine but also a paracrine effect on surrounding cells. It is worth noting that the cytokines analyzed in our models: TNF‐α, MCP‐1, and IL‐1β are part of the SASP secreted by senescent β‐cells (Aguayo‐Mazzucato et al, 2019).
We hypothesized that the dicarbonyl stress induced by the knockdown of Glo1 acts as the metabolic hit leading to the senescence of pancreatic islets, which foster the onset of a pro‐inflammatory condition, increasing macrophage infiltration and thereby resulting in impaired GSIS. Indeed, aged islets have been described to have impaired GSIS, but still maintain their insulin‐producing capability and β‐cell number. As a matter of fact, no difference in the number and size of islets nor in the islet insulin storage was found in Glo1KD and WT mice. To prove this hypothesis, we have demonstrated that isolated islets from 10‐month‐old Glo1KD mice show a higher expression of the senescence markers Trp53 and Cdkn1a, together with the modulation of the novel β‐cell age markers Igf1r and Fgfr1 (Rufini et al, 2013; Aguayo‐Mazzucato et al, 2017). A lower expression of Fgfr1 is already evident at 5 months of age in the islets of Glo1KD mice compared with the WT littermates.
It has been described that the β‐cell expression of Igf1r associates with senescence and dysfunctional insulin secretion (Aguayo‐Mazzucato et al, 2017). As the reduced expression of Fgfr1 has been associated with β‐cell age but not with impaired insulin secretion, it is conceivable that Fgfr1 modulation may precede the functional alteration found later at 10 months of age. In mesenchymal stem cells, the FGFR1 activation prevents cellular senescence acting upstream MDM2 and its mediated degradation of p53 (Coutu et al, 2011).
Upregulation of p53 by MGO and Glo1 depletion has been extensively documented in vitro (Zhou et al, 2015; Chen et al, 2017; Braun et al, 2019; Lai et al, 2020). Our data in INS‐1 832/13 cells demonstrate that MGO itself leads to the β‐cell dysfunction developed by Glo1KD mice. Indeed, β‐cells exposed to MGO show an impairment of GSIS and higher levels of the senescence inducers p53 and the downstream effector p21, together with the nuclear exclusion of HMGB1 and the increase in the SA‐β‐Gal‐positive cells. Although the increase in SA‐β‐Gal‐positive INS‐1 cells may look to be modest in response to MGO, previous evidence from our group and others demonstrated how a similar increase (threefold or less) in the percentage of senescent cells is sufficient to impair cell function and interfere with tissue homeostasis (Chen et al, 2002; Xu et al, 2018; Spinelli et al, 2022). Interestingly, β‐cell treatment with a combination of senolytic agents (dasatinib and quercetin) (Aguayo‐Mazzucato et al, 2019) demonstrates that the clearance of senescent cells is able not only to dampen pro‐inflammatory cytokines secretion but also to rescue the MGO‐impaired GSIS. We and others have previously identified GSK3 and mitochondrial dysfunction as mediators of MGO‐induced effect on GSIS impairment in INS‐1 cells (Fiory et al, 2011; Bo et al, 2016). Both of them can drive the senescent phenotype (Souder & Anderson, 2019; Vasileiou et al, 2019). Besides being reduced by aging, a decrease in mtDNA copy number has been shown to precede the T2D development, suggesting that the decrease in mtDNA content might be related to the disease pathogenesis (Lee et al, 1998; Cree et al, 2008). We gained data on the effect of MGO on the reduction of both mtDNA content and its transcription regulator, mtTFA, expression in INS‐1 832/13.
Our results demonstrate for the first time that the MGO harmful effect on insulin secretion is mediated, at least in part, by cellular senescence. Further studies involving the use of senolytic agents in vivo will be useful to draw the clinical implications of the phenotype described here for the Glo1KD mouse. The clearance of senescent cells would reduce the SASP factors release, which contributes to the related inflammation and metabolic dysregulation, acting at paracrine level, thus affecting tissue function (Kirkland & Tchkonia, 2017). Therefore, alleviating the senescent cells burden in vivo will result in a beneficial effect on the senescent β‐cell microenvironment and the whole tissue function.
Conclusions
We have used a unique model in which the increase in MGO levels is due to the partial deletion of Glo1 to demonstrate that MGO accumulation induces a pancreatic damage similar to that observed in T2D. While Glo1KD mice are not hyperglycemic, they develop an age‐dependent glucose intolerance due to a senescence‐associated pro‐inflammatory phenotype of islets resulting in GSIS impairment. These data provide new evidence for an active role of MGO in the etiology of T2D, paving the way for novel prevention approaches to T2D progression.
Materials and Methods
Mice
The transgenic Glo1KD were a kind gift of the laboratory of Prof. Peter Nawroth (Department of Medicine I and Clinical Chemistry, Heidelberg University Hospital, Heidelberg, Germany) and were generated on a C57BL/6 background, as previously described (El‐Osta et al, 2008). Mice were housed in a specific pathogen free facility, in a temperature‐controlled (22°C) room with a 12‐h light/dark cycle. All the experiments were conducted in age‐matched male mice with the approval of the local ethics committee of the Ministry of Education, University and Research (MIUR) [approval n° 252/2018‐PR]. Three mice were allocated per cage to minimize distress and potential confounders in the evaluation of metabolic parameters. This research has been performed in adherence of ARRIVE guidelines 2.0.
Cell culture and reagents
INS‐1 832/13 rat insulinoma cells (cod. SCC207, Sigma‐Aldrich, St Luis, MO, USA) were cultured in T75 tissue culturing flasks at 37°C in a humidified atmosphere containing 5% CO2 in RPMI 1640 with sodium bicarbonate, supplemented with 10% (vol/vol) fetal calf serum (Gibco, Thermo Fisher Scientific, Waltham, MA USA), 10 mm HEPES (pH 7.4), 2 mm l‐glutamine, 1 mm sodium pyruvate, and 50 μm β‐mercaptoethanol (Sigma‐Aldrich, St Luis, MO, USA). Cells were authenticated and tested for mycoplasma contamination. Where indicated, cells were exposed to MGO (Sigma‐Aldrich, St Luis, MO, USA) 0.05 mM as previously described (Fiory et al, 2011) for 48 h and treated or not with dasatinib (31 nM) and quercetin (6 μM) in combination (Sigma‐Aldrich, St Luis, MO, USA), for additional 24 h.
Measurement of MGO
The MGO content in the pancreas tissue and plasma was determined by isotope dilution and tandem mass spectroscopy, following derivatization with 1,2‐diaminobenzene (Rabbani & Thornalley, 2014b). Briefly, 20 µl of serum were precipitated by the addition of 10 µl of ice‐cold 20% (wt/vol) trichloroacetic acid in 0.9% (wt/vol) sodium chloride (20 µl) and water (40 µl). For the pancreas tissue, pre‐weighted amounts (ca.10 mg) were homogenized in ice‐cold 20% (wt/vol) trichloroacetic acid in 0.9% (wt/vol) sodium chloride (20 µl) and water (80 µl). An aliquot (5 µl) of the internal standard ([13C3]‐methylglyoxal) was then added and the samples vortexed mixed. Following centrifugation (14,000 rpm; 5 min @ 4°C), 35 µl of the supernatant was transferred to HPLC vials containing a 200 µl glass interest. An aliquot (5 µl) of 3% sodium azide (wt/vol) was then added to each sample followed by 10 µl of 0.5 mM DB in 200 mM HCl containing 0.5 mM diethylenetriaminepentaacetic acid (DETAPAC) in water. The samples were then incubated for 4 h at room temperature, protected from the light. Samples were then analyzed by LC‐MS/MS using an ACQUITY™ ultra‐high‐performance liquid chromatography system with a Xevo‐TQS LC‐MS/MS mass spectrometer (Waters, Manchester, UK). The column was a Waters BEH C18 (100 × 2.1 mm) and guard column (5 × 2.1 mm). The mobile phase was 0.1% formic acid in water with a linear gradient of 0–100% 0.1% formic acid in 50% Acetonitrile:water over 0–10 min; the flow rate was 0.2 ml/min, and column temperature was 5°C. The capillary voltage was 0.5 kV, the cone voltage 20 V, the interscan delay time 100 ms, the source and desolvation gas temperatures 150 and 350°C, respectively, and the cone gas and desolvation gas flows were 150 and 800 l/h, respectively. Mass transitions (parent ion > fragment ion; collision energy), retention time, limit of detection, and recoveries were as follows: 145.0 > 77.1; 24 eV, 5.93 min, 0.52 pmol and 98%. Acquisition and quantification were completed with MassLynx 4.1 and TargetLynx 2.7 (Waters®).
Reverse transcription and quantitative Real‐Time PCR (qPCR)
RNA was isolated from mouse tissues (skeletal muscle, perigonadal adipose tissue, liver, brain, pancreas, and pancreatic islets) or INS‐1 832/13 cells using miRNeasy mini kit (QIAGEN, Hilden, Germany) according to the manufacturer’s instructions. After quantification with NanoDrop 2000 spectrophotometer (Thermo Scientific, Waltham, MA, USA), reverse transcription of 1 μg of total RNA was performed using Super Script III (Life Technologies, Carlsbad, CA, USA), according to the manufacturer's instructions. RNA samples which did not meet the quality cut‐off (e.g., 260/280 ratio < 1.8) were excluded from the analysis of gene expression. qPCR was performed in triplicate by using iQ SYBR Green Super mix on iCycler Real‐Time Detection System (Bio‐Rad Laboratories, Hercules, CA, USA). Cyclophilin A and β‐Actin were used as reference genes. Gene expression data from cells are shown as relative quantification by the use of the 2−ΔΔ C t method. Gene expression data from mice are shown as the absolute quantification normalized on reference gene expression (ratio of gene of interest copy number to reference gene copy number; Schmittgen & Livak, 2008).
Primer‐Blast (http://www.ncbi.nlm.nih.gov/tools/primer‐blast/) was used to design primers specific, which were then purchased from Sigma‐Aldrich (St Louis, MO, USA). Primers used for qPCR are as follows:
| β‐Actin mouse | Forward: 5’‐ACCGTGAAAAGATGACCCAG‐3’ |
| Reverse: 5’‐GTACGACCAGAGGCATACAG‐3’ | |
| Adgre1 mouse | Forward: 5’‐ACAGTACGATGTGGGGCTTT‐3’ |
| Reverse: 5’‐GTGTGGTCATCCCCCATCTG‐3’ | |
| Akr1b3 mouse | Forward: 5’‐GGCCGTGAAAGTTGCTATTG‐3’ |
| Reverse: 5’‐ATGCTCTTGTCATGGAACGTG −3’ | |
| Aldh1a3 mouse | Forward:: 5’‐GGGTCACACTGGAGCTAGGA‐3’ |
| Reverse:: 5’‐CTGGCCTCTTCTTGGCGAA‐3’ | |
| Cdkn1a mouse | Forward: 5’‐ GCAGACCAGCCTGACAGATTT‐3’ |
| Reverse: 5’‐ CTGACCCACAGCAGAAGAGG‐3’ | |
| Cdkn1a rat | Forward: 5’‐TCGTACCCCGATACAGGTGA‐3’ |
| Reverse: 5’‐ TGTCTAGGAAGCCCTCCCG‐3’ | |
| Cd68 mouse | Forward:: 5’‐ GCTAGGACCGCTTATAGCCC‐3’ |
| Reverse:: 5’‐ GGATGGCAGGAGAGTAACGG‐3’ | |
| Cyclophilin A mouse/rat | Forward: 5'‐GCAGACAAAGTTCCAAAGACAG‐ 3' |
| Reverse: 5'‐CACCCTGGCACATGAATCC‐ 3' | |
| Glyoxalase 1 mouse | Forward: 5’‐CCCTCGTGGATTTGGTCACA‐3′ |
| Reverse: 5′‐AGCCGTCAGGGTCTTGAATG‐3′ | |
| Fgfr1 mouse | Forward: 5’‐CCTGAACAAGATGCACTCCCA‐3’ |
| Reverse: 5′‐TCTGGGGATGTCCAGTAGGG‐3’ | |
| Igf1r mouse | Forward: 5’‐ATTCTGATGTCTGGTCCTTCG‐3’ |
| Reverse: 5′‐AGCATATCAGGGCAGTTGTC‐3’ | |
| Il‐1β mouse | Forward: 5’‐CCTCATCCTGGAAGGTCCAC‐3’ |
| Reverse: 5′‐AACCTTTGACCTGGGCTGTC‐3’ | |
| Itgax mouse | Forward: 5’‐ GCAGAGCCAGAACTTCCCAA −3’ |
| Reverse: 5’‐ TGCTACCCGAGCCATCAATC −3’ | |
| Mcp‐1 mouse | Forward: 5’‐CTGTAGTTTTTGTCACCAAGCTCA‐3’ |
| Reverse: 5′‐GTGCTGAAGACCTTAGGGCA‐3’ | |
| mtTFA rat | Forward: 5’‐GATGAGTCAGCTCAGGGGAA‐3’ |
| Reverse: 5’‐CACACTGCGACGGATGAGAT‐3’ | |
| Tnf‐α mouse | Forward: 5’‐AGCCCCCAGTCTGTATCCTT‐3’ |
| Reverse: 5′‐CTCCCTTTGCAGAACTCAGG‐3’ | |
| Trp53 mouse | Forward: 5’‐CCTCTCCCCCGCAAAAGAAA‐3’ |
| Reverse: 5’‐GACTCCTCTGTAGCATGGGC‐3’ | |
| Trp53 rat | Forward: 5’‐ GTGATATGTACCAGCCACAGG‐3’ |
| Reverse: 5’‐ CGAACAGACGACGGCATACT‐3’ |
Glucose tolerance test (GTT)
Mice were overnight‐fasted, and glucose levels were determined at 0, 15, 30, 45, 60, 90, and 120 min after the administration of a 20% w/v d‐glucose solution (2 g/kg body weight) by intraperitoneal injection. Whole blood was obtained from the tail vein and glucose levels assessed by the use of a portable glucometer One Touch® Verio (Lifescan, MI, Italy).
Insulin tolerance test (ITT)
Mice were 4 h‐fasted, and then insulin (Humulin R, Eli Lilly Italia S.p.A., Italy) was administrated by an intraperitoneal injection (0.75 U/kg body weight). Whole blood samples were obtained from mice tail at 0, 15, 30, 45, 60, 90, and 120 min following insulin injection and were used for glucose levels measurement by the use of a portable glucometer One Touch® Ultra (Lifescan MI, Italy). Mice whose blood glucose levels dropped below 45 mg/dl were excluded from the analysis.
Pancreatic islets isolation
Islets of Langerhans were isolated by collagenase digestion (Li et al, 2009). Mice were killed by cervical dislocation, and an incision around the upper abdomen was made to expose the liver and the intestine. Once located the ampulla, it was clamped on the duodenum wall and the pancreas was perfused by injecting 3 ml of Collagenase P (Roche Applied Sciences, Penzberg, Germany) solution (1,000 U ml−1) in Krebs (NaCl 120 mM, KCl 4.8 mM, CaCl2 2.5 mM, MgCl2·6H2O 1.2 mM, NaHCO3 24 mM, Hepes 5 mM, penicillin/streptomycin 50 U/ml, pH 7.35). Digestion was completed in a shaking water bath (37°C) for 8–10 min. The digested pancreas was treated with DNase I (QIAGEN, Hilden, Germany). The islets were hand‐picked under a stereomicroscope using a syringe with a 25‐gauge needle and then pelleted for RNA extraction, homogenization, or incubated overnight in RPMI for ex vivo glucose‐stimulated insulin secretion (GSIS). Independent islets samples were isolated and processed for each different use. One mouse each group was in parallel processed to minimize potential confounders.
Glucose‐stimulated insulin secretion (GSIS)
Overnight‐fasted mice were injected with a 30% w/v D‐glucose solution (3 g/kg body weight), and whole blood glucose was collected from mandibular vein at 0, 3, and 30 min after glucose injection. Blood samples were allowed to clot for 30 min and then centrifuged at 4,500 rpm for 5 min at room temperature for serum collection. One mouse each group a time was in parallel analyzed to minimize potential confounders. Ex vivo GSIS was performed as previously described (Lombardi et al, 2012). Briefly, batches of 20 size‐matched islets were preincubated at 37°C for 30 min in glucose‐free Krebs–Ringer bicarbonate HEPES buffer (KRBH) and then incubated for 1 h in a thermomixer at 37°C; incubation was with 1 ml KRBH medium containing 2.8 mmol/l glucose or 16.7 mmol/l glucose. Islets were then pelleted, supernatant fractions were collected to measure insulin secretion, and the genomic DNA was extracted from pellets to normalize insulin secretion. DNA extraction was performed using Wizard Genomic DNA purification kit (Promega, Milan, Italy), according to the manufacturer’s protocol. In vitro GSIS was analyzed in INS‐1 832/13 as previously described (Fiory et al, 2011). Briefly, at the end of treatments, cells were maintained for 1 h in KRBH with 0.25% (w/v) BSA and then incubated in KRBH with 2.8 mM (basal condition) or 16.7 mM glucose (stimulated condition). Incubation was stopped by putting the plates on ice, the supernatants were collected for insulin measurement, and cells solubilized for protein extraction as previously reported (Mirra et al, 2017) for insulin normalization. Insulin levels in serum, islets, or cell supernatants were measured by the use of an ELISA assay (EMD Millipore Corporation, Billerica, MA, USA), according to the manufacturer’s protocol.
Histological analysis
Sections of formalin‐fixed, paraffin‐embedded (FFPE) pancreas were cut into 4 μm sections, deparaffinized, rehydrated through graded alcohols and stained with hematoxylin and eosin for the evaluation of islets morphology. Seven mice each phenotype were analyzed, and 3 sections per mouse were evaluated to determine number, size, morphology, and infiltration of islets, by the use of Olympus DP21 software (Olympus, Center Valley, PA, USA). Immunohistochemical staining was carried out on whole sections from FFPE tissues to evaluate the expression of insulin, glucagon, and F4/80 markers. For insulin and glucagon, we performed a manual procedure. Primary antibodies were Rabbit anti‐glucagon (clone EP3070‐ 1:6,500) and Rabbit anti‐insulin (clone EPR17359‐ 1:8,000) from Abcam (Cambridge, UK). Secondary reagent was Dako EnVision+ System‐ HRP Labelled Polymer Anti‐Rabbit (Dako; Agilent Technologies, Santa Clara, CA, USA). Peroxidase reactivity was visualized using 3,3’‐diaminobenzidine (DAB). F4/80 immunohistochemical staining was carried out using the BOND III slide stainer (Leica Biosystems, Wetzlar, Germany) in accordance with the manufacturer’s instructions. Staining was achieved using NBP2‐12506 F4/80 antibody (Clone SP115, Novus Biologicals, Centennial, CO, USA) and visualized using the Bond™ Polymer Refine Detection kit (Leica Biosystems, Wetzlar, Germany) using 3,3′‐diaminobenzidine tetrahydrochloride chromogen as substrate.
Using a semi‐quantitative scoring system microscopically, an observer (P.I.) performed a blind evaluation of the intensity, extent, and subcellular distribution of the markers by Olympus BX43 light microscope and Olympus DP21 microscope camera and software (Olympus, Center Valley, PA, USA). For each sample, ten fields and at least > 500 cells were analyzed. There are no standardized criteria for insulin, glucagon, and F4‐80 markers staining evaluation. For insulin and glucagon, the staining intensity was graded as follows: 0, negative; 1, weak; 2, moderate; and 3, intense. The intensity score was multiplied with percentage of positive cells in order to generate an immunoreactive score (IS). For insulin, high expression is defined as an IS ≥ 150, for glucagon ≥ 93, which represent the average value of the IS.
F4/80 stain showed for all positive samples the same staining intensity. For this reason, we evaluated the percentage of immunostained cells and we scored it as follows: high when positivity was ≥ 1%.
Multiplex immunoassay
Whole pancreata or isolated islets from wild‐type (WT) and Glo1KD mice were treated with Bio‐Plex Cell Lysis kit (Bio‐Rad, Hercules, CA, Stati Uniti) and homogenized by TissueLyser LT (QIAGEN, Hilden, Germany) accordingly to the manufacturer’s instructions. At the end of treatments, INS‐1 832/13 were cultured in serum‐free RPMI medium with 0.25% (w/v) BSA for 16 h. Mouse pancreatic lysates and cell‐conditioned medium were used to measure, respectively, the tissue and secreted concentration of interleukin‐1 beta (IL‐1β), tumor necrosis factor‐alpha (TNF‐α) and monocyte chemoattractant protein‐1 (MCP‐1) by the use of a custom‐blended ELISA multiplex assay (Bio‐Plex ProTM, Bio‐Rad) according to manufacturer's protocol. Islets lysates and serum samples were used to measure insulin and glucagon content by the use of an immunoassay in multiplex (Bio‐Plex Pro mouse diabetes immunoassay, Bio‐Rad) according to manufacturer's protocol. Data were acquired using a Bio‐Plex 200 system equipped with Bio‐Plex Manager software v5.0 (Bio‐Rad). The standard curves optimization and the calculation of analyte concentrations were performed by using the Bio‐Plex Manager software.
Western blot analysis
For whole cell proteins extraction, cells were solubilized in lysis buffer (50 mmol/l HEPES, pH 7.5, 150 mmol/l NaCl, 10 mmol/l EDTA, 10 mmol/l Na2P2O7, 2 mmol/l Na3VO4, 100 mmol/l NaF, 10% glycerol, 1% Triton X‐100) for 2 h at 4°C. Cell lysates were clarified by centrifugation at 16,000 g for 20 min. Nuclear proteins were isolated using the NE‐PER Nuclear and Cytoplasmic Extraction Kit purchased from Thermo Fisher (Waltham, Massachusetts, USA), according to the manufacturer's instructions. Protein samples were separated by SDS–PAGE and transferred into 0.45‐μm Immobilon‐P PVDF membranes (Merck, Darmstadt, Germany). Upon incubation with primary and secondary antibodies, immunoreactive bands were detected by electrochemiluminescence according to the manufacturer's instructions (Pierce, Thermo Scientific, Rockford, IL, USA) and densitometric analysis was performed using ImageJ software. The antibodies used were anti‐p53 (cod. 2524, Cell Signaling Technology, Danvers, MA, USA), anti‐p21 (cod. sc397), anti‐HMGB1 (cod. Sc 56698, Santa Cruz Biotechnology, Santa Cruz, CA, USA), anti‐histone H3 (cod. ab 1791, Abcam, Cambridge, UK), and anti‐vinculin (cod. sc73614, Santa Cruz Biotechnology, Santa Cruz, CA, USA).
Detection of Senescence‐associated beta‐galactosidase (SA‐βgal) activity
SA‐βgal activity has been evaluated in vitro by a fluorescence‐based assay using flow cytometry, as described in (Debacq‐Chainiaux et al, 2009). Briefly, at the end of treatments, INS‐1 832/13 were exposed to 100 nM bafilomycin A1 for 1 h in fresh cell culture medium to induce lysosomal alkalinization. Subsequently, cells were incubated in 33 µM C12FDG (5‐dodecanoylaminofluorescein di‐β‐D‐galactopyranoside) for 2 h and then washed twice with PBS, harvested by trypsinization, and resuspended in ice‐cold PBS. Cell suspension was run in a BD FACS and the acquisition and analysis performed by BD FACSDiva Software (BD Bioscience). Once selected the analysis region which excludes dead cells and cellular debris, the percentage of positive cells were estimated by dividing the number of events within the bright fluorescence compartment (set at fluorescence intensity > 104) by the total number of events.
Determination of mitochondrial DNA (mtDNA) content
Quantification of the mtDNA content was obtained using real‐time PCR amplification on a Quant Studio 7 Flex instrument (Applied Biosystem), according to the previously published protocol (https://doi.org/10.1007/978‐1‐4939‐1875‐1_3). The mtDNA amount was carried out by qPCR amplification of a mtDNA fragment tRNA‐Leu (NC_012374.1) and comparison with an endogenous reference. The nuclear‐encoded Gapdh gene (Gene ID: 24383) was used as a nuclear reference (nucDNA). Each sample was amplified in duplicate. The mitochondrial DNA content, relative to nuclear DNA, was calculated using the following equations: ΔCT = (nucDNA CT – mtDNA CT); Relative mitochondrial DNA content = 2 × 2ΔCT.
Statistic procedures
Data are expressed as means ± SEM. Data distribution was tested for normality by Shapiro–Wilk test. Comparison between groups was performed using Student’s t‐test (unpaired) or Mann–Whitney U test for comparison of non‐parametric data. Fisher’s exact test was performed for categorical variables. A P‐value of < 0.05 was considered statistically significant. Statistical analysis was performed with GraphPad Prism (version 7.0; San Diego, CA, USA) or R studio software (version 3.5.3; R studio, Boston, MA, USA). Outlier values were calculated by performing Grubb’s test and excluded from the analysis. During the performance of the experiments, the authors were not aware of the group allocation.
Author contributions
Immacolata Prevenzano: Formal analysis; Investigation; Writing—original draft. Alessia Leone: Formal analysis; Investigation; Writing—original draft. Michele Longo: Data curation; Formal analysis; Investigation; Writing—original draft. Antonella Nicolò: Investigation; Methodology. Serena Cabaro: Investigation. Francesca Collina: Formal analysis; Investigation. Iacopo Panarese: Formal analysis; Investigation. Gerardo Botti: Formal analysis. Pietro Formisano: Writing—review and editing. Raffaele Napoli: Writing—review and editing. Francesco Beguinot: Funding acquisition; Writing—review and editing. Claudia Miele: Data curation; Project administration; Writing—review and editing. Cecilia Nigro: Conceptualization; Data curation; Supervision; Writing—original draft; Project administration.
In addition to the CRediT author contributions listed above, the contributions in detail are:
IPr, AL, and ML performed the experiments, analyzed the data, and wrote the manuscript. AN performed the in vitro experiments, the sample collection and prepared figures. SC performed the multiplex immunoassay. FC, IPa, and GB performed the histological examination, acquired microscopy images, and analyzed the data. CM, FB, PF, and RN provided intellectual input on the project and revised the manuscript. CN conceived the study, supervised the overall project, and revised the manuscript.
Disclosure and competing interests statement
The authors declare that they have no conflict of interest.
Supporting information
Expanded View Figures PDF
Table EV1
Source Data for Figure 4
Acknowledgements
We thank Prof. Peter Nawroth and Dr Thomas Fleming (Department of internal medicine I and clinical chemistry, University Hospital Heidelberg, Heidelberg, Germany) for kindly providing the Glo1KD mouse model and the SFB1118‐S01 project which performed the MGO measurements. We thank Mrs Daniela Rastelli for administrative support and Mr Salvatore Sequino and Mrs Mariarosaria Montagna for technical support. The authors wish to dedicate this work to the memory of Dr Anna Maria Cirafici (IEOS/CNR, Naples, Italy). Funded, in part, by the Ministero dell’Istruzione, Università e della Ricerca Scientifica (FundRef Doi: 10.13039/501100003407; PRIN 2017‐2017CPLH32, PRIN 2020‐2020N5WK98 and PON “RICERCA E INNOVAZIONE” 2014–2020 E FSC‐progetto “Innovative Devices For SHAping the RIsk of Diabetes” (IDF SHARID)—ARS01_01270), and by the Regione Campania (FundRef Doi: 10.13039/501100003852; POR FESR 2014‐2020—Obiettivo specifico 1.2.—Manifestazione di Interesse per la Realizzazione di Technology Platform nell’ambito della Lotta alle Patologie Oncologiche”—Projects COEPICA, RARE PLAT NET and SATIN).
EMBO reports (2022) 23: e52990.
Data availability
No data were deposited in a public database.
References
- Action to Control Cardiovascular Risk in Diabetes Study G , Gerstein HC, Miller ME, Byington RP, Goff DC Jr, Bigger JT, Buse JB, Cushman WC, Genuth S, Ismail‐Beigi F et al (2008) Effects of intensive glucose lowering in type 2 diabetes. N Engl J Med 358: 2545–2559 [DOI] [PMC free article] [PubMed] [Google Scholar]
- Aguayo‐Mazzucato C, Andle J, Lee TB Jr, Midha A, Talemal L, Chipashvili V, Hollister‐Lock J, van Deursen J, Weir G, Bonner‐Weir S (2019) Acceleration of beta cell aging determines diabetes and senolysis improves disease outcomes. Cell Metab 30: 129–142 [DOI] [PMC free article] [PubMed] [Google Scholar]
- Aguayo‐Mazzucato C, van Haaren M, Mruk M, Lee TB Jr, Crawford C, Hollister‐Lock J, Sullivan BA, Johnson JW, Ebrahimi A, Dreyfuss JM et al (2017) Beta cell aging markers have heterogeneous distribution and are induced by insulin resistance. Cell Metab 25: 898–910 [DOI] [PMC free article] [PubMed] [Google Scholar]
- Bierhaus A, Fleming T, Stoyanov S, Leffler A, Babes A, Neacsu C, Sauer SK, Eberhardt M, Schnölzer M, Lasitschka F et al (2012) Methylglyoxal modification of Nav1.8 facilitates nociceptive neuron firing and causes hyperalgesia in diabetic neuropathy. Nat Med 18: 926–933 [DOI] [PubMed] [Google Scholar]
- Bierhaus A, Schiekofer S, Schwaninger M, Andrassy M, Humpert PM, Chen J, Hong M, Luther T, Henle T, Kloting I et al (2001) Diabetes‐associated sustained activation of the transcription factor nuclear factor‐kappaB. Diabetes 50: 2792–2808 [DOI] [PubMed] [Google Scholar]
- Bo J, Xie S, Guo Y, Zhang C, Guan Y, Li C, Lu J, Meng QH (2016) Methylglyoxal impairs insulin secretion of pancreatic beta‐cells through increased production of ROS and mitochondrial dysfunction mediated by upregulation of UCP2 and MAPKs. J Diabetes Res 2016: 2029854 [DOI] [PMC free article] [PubMed] [Google Scholar]
- Bots SH, van der Graaf Y, Nathoe HMW, de Borst GJ, Kappelle JL, Visseren FLJ, Westerink J (2016) The influence of baseline risk on the relation between HbA1c and risk for new cardiovascular events and mortality in patients with type 2 diabetes and symptomatic cardiovascular disease. Cardiovasc Diabetol 15: 101 [DOI] [PMC free article] [PubMed] [Google Scholar]
- Braun JD, Pastene DO, Breedijk A, Rodriguez A, Hofmann BB, Sticht C, von Ochsenstein E, Allgayer H, van den Born J, Bakker S et al (2019) Methylglyoxal down‐regulates the expression of cell cycle associated genes and activates the p53 pathway in human umbilical vein endothelial cells. Sci Rep 9: 1152 [DOI] [PMC free article] [PubMed] [Google Scholar]
- Brownlee M (2001) Biochemistry and molecular cell biology of diabetic complications. Nature 414: 813–820 [DOI] [PubMed] [Google Scholar]
- Butcher MJ, Hallinger D, Garcia E, Machida Y, Chakrabarti S, Nadler J, Galkina EV, Imai Y (2014) Association of proinflammatory cytokines and islet resident leucocytes with islet dysfunction in type 2 diabetes. Diabetologia 57: 491–501 [DOI] [PMC free article] [PubMed] [Google Scholar]
- Chan JY, Lee K, Maxwell EL, Liang C, Laybutt DR (2019) Macrophage alterations in islets of obese mice linked to beta cell disruption in diabetes. Diabetologia 62: 993–999 [DOI] [PubMed] [Google Scholar]
- Chen J, Brodsky SV, Goligorsky DM, Hampel DJ, Li H, Gross SS, Goligorsky MS (2002) Glycated collagen I induces premature senescence‐like phenotypic changes in endothelial cells. Circ Res 90: 1290–1298 [DOI] [PubMed] [Google Scholar]
- Chen SJ, Aikawa C, Yoshida R, Matsui T (2015) Methylglyoxal‐derived hydroimidazolone residue of plasma protein can behave as a predictor of prediabetes in Spontaneously Diabetic Torii rats. Physiol Rep 3: e12477 [DOI] [PMC free article] [PubMed] [Google Scholar]
- Chen Y, Fang L, Zhang J, Li G, Ma M, Li C, Lyu J, Meng QH (2017) Blockage of glyoxalase I inhibits colorectal tumorigenesis and tumor growth via upregulation of STAT1, p53, and bax and downregulation of c‐Myc and Bcl‐2. Int J Mol Sci 18: 570 [DOI] [PMC free article] [PubMed] [Google Scholar]
- Choi YS, Kim S, Pak YK (2001) Mitochondrial transcription factor A (mtTFA) and diabetes. Diabetes Res Clin Pract 54(Suppl 2): S3–S9 [DOI] [PubMed] [Google Scholar]
- Coutu DL, Francois M, Galipeau J (2011) Inhibition of cellular senescence by developmentally regulated FGF receptors in mesenchymal stem cells. Blood 117: 6801–6812 [DOI] [PubMed] [Google Scholar]
- Cree LM, Patel SK, Pyle A, Lynn S, Turnbull DM, Chinnery PF, Walker M (2008) Age‐related decline in mitochondrial DNA copy number in isolated human pancreatic islets. Diabetologia 51: 1440–1443 [DOI] [PubMed] [Google Scholar]
- Currie CJ, Peters JR, Tynan A, Evans M, Heine RJ, Bracco OL, Zagar T, Poole CD (2010) Survival as a function of HbA(1c) in people with type 2 diabetes: a retrospective cohort study. Lancet 375: 481–489 [DOI] [PubMed] [Google Scholar]
- Davalos AR, Kawahara M, Malhotra GK, Schaum N, Huang J, Ved U, Beausejour CM, Coppe JP, Rodier F, Campisi J (2013) p53‐dependent release of Alarmin HMGB1 is a central mediator of senescent phenotypes. J Cell Biol 201: 613–629 [DOI] [PMC free article] [PubMed] [Google Scholar]
- DCCT/EDIC Research Group (2014) Effect of intensive diabetes treatment on albuminuria in type 1 diabetes: long‐term follow‐up of the Diabetes Control and Complications Trial and Epidemiology of Diabetes Interventions and Complications study. Lancet Diabetes Endocrinol 2: 793–800 [DOI] [PMC free article] [PubMed] [Google Scholar]
- Debacq‐Chainiaux F, Erusalimsky JD, Campisi J, Toussaint O (2009) Protocols to detect senescence‐associated beta‐galactosidase (SA‐betagal) activity, a biomarker of senescent cells in culture and in vivo . Nat Protoc 4: 1798–1806 [DOI] [PubMed] [Google Scholar]
- Dhar A, Dhar I, Desai KM, Wu L (2010) Methylglyoxal scavengers attenuate endothelial dysfunction induced by methylglyoxal and high concentrations of glucose. Br J Pharmacol 161: 1843–1856 [DOI] [PMC free article] [PubMed] [Google Scholar]
- Dhar A, Dhar I, Jiang B, Desai KM, Wu L (2011) Chronic methylglyoxal infusion by minipump causes pancreatic beta‐cell dysfunction and induces type 2 diabetes in Sprague‐Dawley rats. Diabetes 60: 899–908 [DOI] [PMC free article] [PubMed] [Google Scholar]
- Dobler D, Ahmed N, Song L, Eboigbodin KE, Thornalley PJ (2006) Increased dicarbonyl metabolism in endothelial cells in hyperglycemia induces anoikis and impairs angiogenesis by RGD and GFOGER motif modification. Diabetes 55: 1961–1969 [DOI] [PubMed] [Google Scholar]
- Dockman RL, Carpenter JM, Diaz AN, Benbow RA, Filipov NM (2022) Sex differences in behavior, response to LPS, and glucose homeostasis in middle‐aged mice. Behav Brain Res 418: 113628 [DOI] [PMC free article] [PubMed] [Google Scholar]
- Donath MY, Dalmas E, Sauter NS, Boni‐Schnetzler M (2013) Inflammation in obesity and diabetes: islet dysfunction and therapeutic opportunity. Cell Metab 17: 860–872 [DOI] [PubMed] [Google Scholar]
- Ebrahimi AG, Hollister‐Lock J, Sullivan BA, Tsuchida R, Bonner‐Weir S, Weir GC (2020) Beta cell identity changes with mild hyperglycemia: Implications for function, growth, and vulnerability. Mol Metab 35: 100959 [DOI] [PMC free article] [PubMed] [Google Scholar]
- Ehses JA, Perren A, Eppler E, Ribaux P, Pospisilik JA, Maor‐Cahn R, Gueripel X, Ellingsgaard H, Schneider MKJ, Biollaz G et al (2007) Increased number of islet‐associated macrophages in type 2 diabetes. Diabetes 56: 2356–2370 [DOI] [PubMed] [Google Scholar]
- Elmhiri G, Barella LF, Vieau D, Camous S, Mathias PC, Abdennebi‐Najar L (2014) Acute exposure to a precursor of advanced glycation end products induces a dual effect on the rat pancreatic islet function. Int J Endocrinol 2014: 378284 [DOI] [PMC free article] [PubMed] [Google Scholar]
- El‐Osta A, Brasacchio D, Yao D, Pocai A, Jones PL, Roeder RG, Cooper ME, Brownlee M (2008) Transient high glucose causes persistent epigenetic changes and altered gene expression during subsequent normoglycemia. J Exp Med 205: 2409–2417 [DOI] [PMC free article] [PubMed] [Google Scholar]
- Engelbrecht B, Mattern Y, Scheibler S, Tschoepe D, Gawlowski T, Stratmann B (2014) Methylglyoxal impairs GLUT4 trafficking and leads to increased glucose uptake in L6 myoblasts. Horm Metab Res 46: 77–84 [DOI] [PubMed] [Google Scholar]
- Fiory F, Lombardi A, Miele C, Giudicelli J, Beguinot F, Van Obberghen E (2011) Methylglyoxal impairs insulin signalling and insulin action on glucose‐induced insulin secretion in the pancreatic beta cell line INS‐1E. Diabetologia 54: 2941–2952 [DOI] [PubMed] [Google Scholar]
- Fleming T, Cuny J, Nawroth G, Djuric Z, Humpert PM, Zeier M, Bierhaus A, Nawroth PP (2012) Is diabetes an acquired disorder of reactive glucose metabolites and their intermediates? Diabetologia 55: 1151–1155 [DOI] [PubMed] [Google Scholar]
- Fleming T, Nawroth PP (2014) Reactive metabolites as a cause of late diabetic complications. Biochem Soc Trans 42: 439–442 [DOI] [PubMed] [Google Scholar]
- Fleming TH, Theilen T‐M, Masania J, Wunderle M, Karimi J, Vittas S, Bernauer R, Bierhaus A, Rabbani N, Thornalley PJ et al (2013) Aging‐dependent reduction in glyoxalase 1 delays wound healing. Gerontology 59: 427–437 [DOI] [PubMed] [Google Scholar]
- Giacco F, Du X, D'Agati VD, Milne R, Sui G, Geoffrion M, Brownlee M (2014) Knockdown of glyoxalase 1 mimics diabetic nephropathy in nondiabetic mice. Diabetes 63: 291–299 [DOI] [PMC free article] [PubMed] [Google Scholar]
- He W, Yuan T, Maedler K (2019) Macrophage‐associated pro‐inflammatory state in human islets from obese individuals. Nutr Diabetes 9: 36 [DOI] [PMC free article] [PubMed] [Google Scholar]
- Huang Q, Chen Y, Gong N, Wang YX (2016) Methylglyoxal mediates streptozotocin‐induced diabetic neuropathic pain via activation of the peripheral TRPA1 and Nav1.8 channels. Metabolism 65: 463–474 [DOI] [PubMed] [Google Scholar]
- Ikeda Y, Inagi R, Miyata T, Nagai R, Arai M, Miyashita M, Itokawa M, Fujita T, Nangaku M (2011) Glyoxalase I retards renal senescence. Am J Pathol 179: 2810–2821 [DOI] [PMC free article] [PubMed] [Google Scholar]
- Jia X, Wu L (2007) Accumulation of endogenous methylglyoxal impaired insulin signaling in adipose tissue of fructose‐fed rats. Mol Cell Biochem 306: 133–139 [DOI] [PubMed] [Google Scholar]
- Kirkland JL, Tchkonia T (2017) Cellular senescence: a translational perspective. EBioMedicine 21: 21–28. [DOI] [PMC free article] [PubMed] [Google Scholar]
- Kong X, Ma MZ, Huang K, Qin L, Zhang HM, Yang Z, Li XY, Su Q (2014) Increased plasma levels of the methylglyoxal in patients with newly diagnosed type 2 diabetes 2. J Diabetes 6: 535–540 [DOI] [PubMed] [Google Scholar]
- Lai MC, Liu WY, Liou SS, Liu IM (2020) The protective effects of moscatilin against methylglyoxal‐induced neurotoxicity via the regulation of p38/JNK MAPK pathways in PC12 neuron‐like cells. Food Chem Toxicol 140: 111369 [DOI] [PubMed] [Google Scholar]
- Lapolla A, Flamini R, Dalla Vedova A, Senesi A, Reitano R, Fedele D, Basso E, Seraglia R, Traldi P (2003) Glyoxal and methylglyoxal levels in diabetic patients: quantitative determination by a new GC/MS method. Clin Chem Lab Med 41: 1166–1173 [DOI] [PubMed] [Google Scholar]
- Lee HK, Song JH, Shin CS, Park DJ, Park KS, Lee KU, Koh CS (1998) Decreased mitochondrial DNA content in peripheral blood precedes the development of non‐insulin‐dependent diabetes mellitus. Diabetes Res Clin Pract 42: 161–167 [DOI] [PubMed] [Google Scholar]
- Li DS, Yuan YH, Tu HJ, Liang QL, Dai LJ (2009) A protocol for islet isolation from mouse pancreas. Nat Protoc 4: 1649–1652 [DOI] [PubMed] [Google Scholar]
- Lind M, Oden A, Fahlen M, Eliasson B (2010) The shape of the metabolic memory of HbA1c: re‐analysing the DCCT with respect to time‐dependent effects. Diabetologia 53: 1093–1098 [DOI] [PubMed] [Google Scholar]
- Lind M, Svensson AM, Kosiborod M, Gudbjornsdottir S, Pivodic A, Wedel H, Dahlqvist S, Clements M, Rosengren A (2014) Glycemic control and excess mortality in type 1 diabetes. N Engl J Med 371: 1972–1982 [DOI] [PubMed] [Google Scholar]
- Lodd E, Wiggenhauser LM, Morgenstern J, Fleming TH, Poschet G, Buttner M, Tabler CT, Wohlfart DP, Nawroth PP, Kroll J (2019) The combination of loss of glyoxalase1 and obesity results in hyperglycemia. JCI Insight 4: e126154 [DOI] [PMC free article] [PubMed] [Google Scholar]
- Lombardi A, Ulianich L, Treglia AS, Nigro C, Parrillo L, Lofrumento DD, Nicolardi G, Garbi C, Beguinot F, Miele C et al (2012) Increased hexosamine biosynthetic pathway flux dedifferentiates INS‐1E cells and murine islets by an extracellular signal‐regulated kinase (ERK)1/2‐mediated signal transmission pathway. Diabetologia 55: 141–153 [DOI] [PubMed] [Google Scholar]
- Maedler K, Sergeev P, Ris F, Oberholzer J, Joller‐Jemelka HI, Spinas GA, Kaiser N, Halban PA, Donath MY (2002) Glucose‐induced beta cell production of IL‐1beta contributes to glucotoxicity in human pancreatic islets. J Clin Invest 110: 851–860 [DOI] [PMC free article] [PubMed] [Google Scholar]
- Maessen DE, Brouwers O, Gaens KH, Wouters K, Cleutjens JP, Janssen BJ, Miyata T, Stehouwer CD, Schalkwijk CG (2016) Delayed intervention with pyridoxamine improves metabolic function and prevents adipose tissue inflammation and insulin resistance in high‐fat diet‐induced obese mice. Diabetes 65: 956–966 [DOI] [PubMed] [Google Scholar]
- Mahdi T, Hänzelmann S, Salehi A, Muhammed S, Reinbothe T, Tang Y, Axelsson A, Zhou Y, Jing X, Almgren P et al (2012) Secreted frizzled‐related protein 4 reduces insulin secretion and is overexpressed in type 2 diabetes. Cell Metab 16: 625–633 [DOI] [PubMed] [Google Scholar]
- Marchetti P (2016) Islet inflammation in type 2 diabetes. Diabetologia 59: 668–672 [DOI] [PubMed] [Google Scholar]
- Masania J, Malczewska‐Malec M, Razny U, Goralska J, Zdzienicka A, Kiec‐Wilk B, Gruca A, Stancel‐Mozwillo J, Dembinska‐Kiec A, Rabbani N et al (2016) Dicarbonyl stress in clinical obesity. Glycoconj J 33: 581–589 [DOI] [PMC free article] [PubMed] [Google Scholar]
- Mauvais‐Jarvis F, Arnold AP, Reue K (2017) A guide for the design of pre‐clinical studies on sex differences in metabolism. Cell Metab 25: 1216–1230 [DOI] [PMC free article] [PubMed] [Google Scholar]
- Mey JT, Haus JM (2018) Dicarbonyl stress and glyoxalase‐1 in skeletal muscle: implications for insulin resistance and type 2 diabetes. Front Cardiovasc Med 5: 117 [DOI] [PMC free article] [PubMed] [Google Scholar]
- Mirra P, Nigro C, Prevenzano I, Procopio T, Leone A, Raciti GA, Andreozzi F, Longo M, Fiory F, Beguinot F et al (2017) The role of miR‐190a in methylglyoxal‐induced insulin resistance in endothelial cells. Biochim Biophys Acta Mol Basis Dis 1863: 440–449 [DOI] [PubMed] [Google Scholar]
- Moraru A, Wiederstein J, Pfaff D, Fleming T, Miller AK, Nawroth P, Teleman AA (2018) Elevated levels of the reactive metabolite methylglyoxal recapitulate progression of type 2 diabetes. Cell Metab 27: 926–934 [DOI] [PubMed] [Google Scholar]
- Morris DL (2015) Minireview: emerging concepts in islet macrophage biology in type 2 diabetes. Mol Endocrinol 29: 946–962 [DOI] [PMC free article] [PubMed] [Google Scholar]
- Mukhuty A, Fouzder C, Kundu R (2021) Fetuin‐A secretion from beta‐cells leads to accumulation of macrophages in islets, aggravates inflammation and impairs insulin secretion. J Cell Sci 134: jcs258507 [DOI] [PubMed] [Google Scholar]
- Nigro C, Leone A, Raciti GA, Longo M, Mirra P, Formisano P, Beguinot F, Miele C (2017) Methylglyoxal‐glyoxalase 1 balance: the root of vascular damage. Int J Mol Sci 18: 188 [DOI] [PMC free article] [PubMed] [Google Scholar]
- Nigro C, Leone A, Fiory F, Prevenzano I, Nicolo A, Mirra P, Beguinot F, Miele C (2019) Dicarbonyl stress at the crossroads of healthy and unhealthy aging. Cells 8: 749 [DOI] [PMC free article] [PubMed] [Google Scholar]
- Nigro C, Raciti GA, Leone A, Fleming TH, Longo M, Prevenzano I, Fiory F, Mirra P, D’Esposito V, Ulianich L et al (2014) Methylglyoxal impairs endothelial insulin sensitivity both in vitro and in vivo . Diabetologia 57: 1485–1494 [DOI] [PubMed] [Google Scholar]
- Nile DL, Brown AE, Kumaheri MA, Blair HR, Heggie A, Miwa S, Cree LM, Payne B, Chinnery PF, Brown L et al (2014) Age‐related mitochondrial DNA depletion and the impact on pancreatic Beta cell function. PLoS One 9: e115433 [DOI] [PMC free article] [PubMed] [Google Scholar]
- Osborn O, Olefsky JM (2012) The cellular and signaling networks linking the immune system and metabolism in disease. Nat Med 18: 363–374 [DOI] [PubMed] [Google Scholar]
- Rabbani N, Thornalley PJ (2014a) Dicarbonyl proteome and genome damage in metabolic and vascular disease. Biochem Soc Trans 42: 425–432 [DOI] [PubMed] [Google Scholar]
- Rabbani N, Thornalley PJ (2014b) Measurement of methylglyoxal by stable isotopic dilution analysis LC‐MS/MS with corroborative prediction in physiological samples. Nat Protoc 9: 1969 [DOI] [PubMed] [Google Scholar]
- Rabbani N, Thornalley PJ (2015) Dicarbonyl stress in cell and tissue dysfunction contributing to ageing and disease. Biochem Biophys Res Commun 458: 221–226 [DOI] [PubMed] [Google Scholar]
- Rabbani N, Xue M, Thornalley PJ (2016) Methylglyoxal‐induced dicarbonyl stress in aging and disease: first steps towards glyoxalase 1‐based treatments. Clin Sci (Lond) 130: 1677–1696 [DOI] [PubMed] [Google Scholar]
- Rufini A, Tucci P, Celardo I, Melino G (2013) Senescence and aging: the critical roles of p53. Oncogene 32: 5129–5143 [DOI] [PubMed] [Google Scholar]
- Schalkwijk C, Stehouwer CD (2019) Methylglyoxal, a highly reactive dicarbonyl compound, in diabetes, its vascular complications and other age‐related diseases. Physiol Rev 100: 407–461 [DOI] [PubMed] [Google Scholar]
- Schmittgen TD, Livak KJ (2008) Analyzing real‐time PCR data by the comparative C(T) method. Nat Protoc 3: 1101–1108 [DOI] [PubMed] [Google Scholar]
- Schumacher D, Morgenstern J, Oguchi Y, Volk N, Kopf S, Groener JB, Nawroth PP, Fleming T, Freichel M (2018) Compensatory mechanisms for methylglyoxal detoxification in experimental & clinical diabetes. Mol Metab 18: 143–152 [DOI] [PMC free article] [PubMed] [Google Scholar]
- Skapare E, Konrade I, Liepinsh E, Strele I, Makrecka M, Bierhaus A, Lejnieks A, Pirags V, Dambrova M (2013) Association of reduced glyoxalase 1 activity and painful peripheral diabetic neuropathy in type 1 and 2 diabetes mellitus patients. J Diabetes Complications 27: 262–267 [DOI] [PubMed] [Google Scholar]
- Souder DC, Anderson RM (2019) An expanding GSK3 network: implications for aging research. Geroscience 41: 369–382 [DOI] [PMC free article] [PubMed] [Google Scholar]
- Sousa Silva M, Gomes RA, Ferreira AE, Ponces Freire A, Cordeiro C (2013) The glyoxalase pathway: the first hundred years.. and beyond. Biochem J 453: 1–15 [DOI] [PubMed] [Google Scholar]
- Spinelli R, Florese P, Parrillo L, Zatterale F, Longo M, D'Esposito V, Desiderio A, Nerstedt A, Gustafson B, Formisano P et al (2022) ZMAT3 hypomethylation contributes to early senescence of preadipocytes from healthy first‐degree relatives of type 2 diabetics. Aging Cell 21: e13557 [DOI] [PMC free article] [PubMed] [Google Scholar]
- Vasileiou PVS, Evangelou K, Vlasis K, Fildisis G, Panayiotidis MI, Chronopoulos E, Passias PG, Kouloukoussa M, Gorgoulis VG, Havaki S (2019) Mitochondrial homeostasis and cellular senescence. Cells 8: 686 [DOI] [PMC free article] [PubMed] [Google Scholar]
- Wortmann M, Hakimi M, Fleming T, Peters AS, Sijmonsma TP, Herzig S, Nawroth PP, Bockler D, Dihlmann S (2016) A glyoxalase‐1 knockdown does not have major short term effects on energy expenditure and atherosclerosis in mice. J Diabetes Res 2016: 2981639 [DOI] [PMC free article] [PubMed] [Google Scholar]
- Xu M, Pirtskhalava T, Farr JN, Weigand BM, Palmer AK, Weivoda MM, Inman CL, Ogrodnik MB, Hachfeld CM, Fraser DG et al (2018) Senolytics improve physical function and increase lifespan in old age. Nat Med 24: 1246–1256 [DOI] [PMC free article] [PubMed] [Google Scholar]
- Xue M, Rabbani N, Thornalley PJ (2011) Glyoxalase in ageing. Semin Cell Dev Biol 22: 293–301 [DOI] [PubMed] [Google Scholar]
- Zhou WJ, Gui QF, Wu Y, Yang YM (2015) Tanshinone IIA protects against methylglyoxal‐induced injury in human brain microvascular endothelial cells. Int J Clin Exp Med 8: 1985–1992 [PMC free article] [PubMed] [Google Scholar]