

Abstract
G‐quadruplexes (G4s) are unusual stable DNA structures that cause genomic instability. To overcome the potential barriers formed by G4s, cells have evolved different families of proteins that unfold G4s. Pif1 is a DNA helicase from superfamily 1 (SF1) conserved from bacteria to humans with high G4‐unwinding activity. Here, we present the first X‐ray crystal structure of the Thermus oshimai Pif1 (ToPif1) complexed with a G4. Our structure reveals that ToPif1 recognizes the entire native G4 via a cluster of amino acids at domains 1B/2B which constitute a G4‐Recognizing Surface (GRS). The overall structure of the G4 maintains its three‐layered propeller‐type G4 topology, without significant reorganization of G‐tetrads upon protein binding. The three G‐tetrads in G4 are recognized by GRS residues mainly through electrostatic, ionic interactions, and hydrogen bonds formed between the GRS residues and the ribose‐phosphate backbone. Compared with previously solved structures of SF2 helicases in complex with G4, our structure reveals how helicases from distinct superfamilies adopt different strategies for recognizing and unfolding G4s.
Keywords: G4‐Recognizing Surface, G‐quadruplexes, structures, ToPif1, X‐ray
Subject Categories: DNA Replication, Recombination & Repair; Structural Biology
The crystal structure of ToPif1 complexed with a G4 shows that ToPif1 recognizes the entire native G4 via a G4‐Recognizing Surface. It reveals how helicases from distinct superfamilies use different strategies for recognizing and unfolding G4s.

Introduction
G‐quadruplexes (G4s) are higher order DNA/RNA structures formed from nucleic acid sequences that contain four stretches of three or more guanines interspaced by at least one random nucleotide (Burge et al, 2006; Castillo Bosch et al, 2014). The G‐tetrad module, composed of four guanines, forms a planar structure stabilized by non‐canonical Hoogsteen hydrogen bonds in the presence of monovalent cations, such as sodium or potassium (Castillo Bosch et al, 2014; Griffin & Bass, 2018). Genome‐wide bioinformatics analyses have revealed the prevalence of G4 motifs in key regulatory regions of the human genome, such as promoters, gene bodies, and untranslated regions (Huppert & Balasubramanian, 2005; Todd et al, 2005; Eddy & Maizels, 2006, 2008; Varshney et al, 2020). Following this prediction, a tremendous increase in cell experimental data has demonstrated that G4 structures indeed exist under physiological conditions and are involved in a variety of biological processes, including telomere maintenance, gene expression, epigenetic regulation, and DNA replication (Schierer & Henderson, 1994; Maizels & Gray, 2013). The high thermodynamic stability of G4s in cells can erect significant barriers to replication fork progression. Therefore, failing to resolve the folded G4s during DNA transactions can cause replication to stall and thus may trigger the rampant genomic instability characteristic of certain cancer cells (De & Michor, 2011; Edwards et al, 2014; Eddy et al, 2015; Fontana & Gahlon, 2020). Cells have evolved the capability of resolving stable G4s with a group of helicases that play important roles in the maintenance of genomic stability in many organisms (Mendoza et al, 2016). Pif1 family helicases, belonging to the superfamily 1 (SF1), are conserved across evolution from bacteria to humans and have been shown to unfold G4, being critical for DNA replication, telomere maintenance, and genome stability (Li et al, 2016; Dahan et al, 2018; Wang et al, 2018). For instance, a recent study has demonstrated that Pif1 helicase promotes break‐induced replication in mammalian cells (Li et al, 2021). DNA G4‐resolving helicases are also found in superfamily 2 (SF2) in groups such as the XPD family (FANCJ and RTEL1) and the RecQ family of helicases (BLM, WRN, and RecQ). FANCJ bearing G4‐resolving activity is necessary for DNA replication and has shown a unique substrate specificity for G4 architecture (Bharti et al, 2013; Lee et al, 2021). RecQ helicases have been found to efficiently unfold a variety of G4 DNA structures and play essential roles in DNA repair and telomere maintenance (Singh et al, 2012). Furthermore, mutations in FANCJ, BLM, or WRN are associated with human diseases (Levitus et al, 2005; Budhathoki et al, 2014; Zimmer et al, 2020). Though G4 resolvases have attracted much attention, few solved co‐crystal structures in which helicase complexed with G4 are available. The X‐ray crystal structure of DHX36 in complex with a Myc‐promoter‐derived G4 was firstly reported and shows that G4 is captured by a specific DHX36‐specific motif (DSM) which bears a signature peptide AKKQ found in FANCJ (Wu & Spies, 2016). Based on DHX36‐G4 crystal structures, it was suggested that DSM, in coordination with the helicase core, unfolds the G4 one base at a time in an ATP‐hydrolysis‐independent manner. Recently, a crystal structure (Voter et al, 2018) solved from a helicase core of a RecQ family helicase (CsRecQ) complexed with oligonucleotides harboring a human telomere sequence revealed that a guanine base within the putative G‐tetrad is located at the 5′‐gate of the electropositive channel, where the G‐base is flipped and sequestrated in a guanine‐specific pocket (GSP) (Voter et al, 2018). This structure is interpreted to represent a post‐catalytic complex of CsRecQ bound to unfolded G4. Therefore, SF2 helicases may use a DSM/AKKQ motif or GSP site for G4 binding/unfolding, but these motifs are not found in Pif1.
Though crystal structures of Pif1 helicases from Homo sapiens, Saccharomyces cerevisiae, Bacteroides sp., and Thermus oshimai have been recently solved with different DNA substrates including a ssDNA or a DNA substrate that mimics a stalled replication fork, little is known about how Pif1 helicases interact with G4 (Zhou et al, 2016; Lu et al, 2018; Dehghani‐Tafti et al, 2019; Dai et al, 2021). Elucidating the molecular mechanism by which Pif1 helicase recognizes and unfolds G4 molecules largely depends on the knowledge of crystal structures. Access to structures that represent a “substrate” complex, intermediates, and a “product” complex provides very valuable mechanistic information. Although the helicase‐G4 DNA complex structures of DHX36 (Chen et al, 2018) and CsRecQ (Voter et al, 2018) can be considered as representations of an intermediate substrate complex (Chen et al, 2018) and a final product complex of helicases (Voter et al, 2018), respectively, the remaining challenge is to obtain the structure in which the helicases interact with an intact G4 (initial substrate complex) or to capture the structure of the very first steps leading to the transition state.
In this study, we report the X‐ray crystal structures solved from the Pif1‐family helicase from T. oshimai (ToPif1) bound to a prefolded G4 bearing 6–8 nt on both sides of the G‐tetrads, thereby mimicking the physiological G4 state formed during DNA replication. This is the first structural snapshot of a helicase complexed with an integral G4. In combination with bulk and single‐molecular fluorescent resonance energy transfer assays (smFRET), our studies provide new mechanistic insight into how a Pif1‐family helicase recognizes, binds, and unfolds G4s.
Results
ToPif1 unfolds G‐quadruplexes in an ATP‐dependent manner without topological preference
Parallel and antiparallel intramolecular G4s, 12 nt‐ssDNA, and 24 bp blunt‐end DNA were titrated with increasing concentrations of ToPif1 under equilibrium conditions. The apparent dissociation constant (K d,app) determined from the titration curves (Fig 1A and Table 1) demonstrated that ToPif1 binds both antiparallel (G4Tel) and parallel G4s (G4CEB) (Fig EV1A) with similar affinity (K d,app antipara ≈ 29.63 nM (G4Tel); K d,app para ≈ 23.27 nM (G4CEB)) without any topological preference. Furthermore, although both the G4 and ssDNA (T12) were bound with essentially the same affinities (K d,app antipara ≈ 29.63 nM versus K d,app ssDNA ≈ 29.12 nM) (Fig 1A (insert) and Table 1), blunt‐end DNA bounds ToPif1 very weakly (K d,app > 250.00 nM; Fig 1A (insert) and Table 1). The fact that the apparent dissociation constant of G4 and ssDNA is nearly identical suggests that ToPif1 possesses two independent binding sites for ssDNA and G4, respectively. Indeed, competitive binding assays between the labeled G4 and unlabeled ssDNA demonstrated that labeled G4 binding was not influenced by increasing unlabeled ssDNA and vice versa (Fig EV1B). We then investigated ToPif1‐mediated G4‐unfolding activities by stopped‐flow assay according to the previous report (Liu et al, 2020) with both parallel and antiparallel G4 substrates (Cheng et al, 2018) in the absence or the presence of ATP. The kinetic data were fit to equation (2) to determine the unfolding amplitude (A m) and unfolding rate (k cat) measured with different G4 DNAs (Fig 1B and Table 1). Although unfolding activity is undetectable in the absence of ATP or the presence of the non‐hydrolyzable ATP analog (Fig EV1C), the values of unfolding amplitudes (A m) and unwinding rates (kcat (s−1)) determined with antiparallel G4s were 1.31‐fold and 1.39‐fold higher than those determined with parallel G4s, respectively (Fig 1B and Table 1). The calculated P‐value (0.001) from the above data is less than 0.01, indicating that the observed differences between parallel and anti‐parallel are statistically significant.
Figure 1. Binding and unwinding activities of ToPif1 for different configurations of antiparallel and parallel G4s.

-
AComparison of the binding activity of ToPif1 for different configurations of antiparallel (G4Tel, black points) and parallel (G4CEB, red points) G4s. (Insert: Comparison of the binding activity of ToPif1 to single‐stranded DNA (T12, black points) with G4Tel, red points), the blue points represent the double‐strand DNA (D24)). The binding activity was measured using steady‐state fluorescence anisotropy assays; 5 nM of fluorescein‐labeled DNA substrate and 0.5 mM ADP·AlF4 were titrated with increasing protein concentrations at 37 °C. The different binding curves represent an average of three to four independent experiments for each substrate with standard deviations. The solid line represents the fit of data according to equation (1).
-
BStopped‐flow DNA unwinding kinetics of ToPif1 for different configurations of G4 DNA (G4AP‐424, 4G4AP‐333, G4P‐214) under multiple turnover conditions. All curves represent the average of at least 10 individual traces and the plots are representative of three independent experiments. 4 nM G4 DNA and 100 nM ToPif1 were used under experimental conditions as described in ‘Materials and Method’.
-
C, DThe typical smFRET trajectories of antiparallel (smG4AP‐424, sm4G4AP‐333) and parallel (smG4P‐111) G4 unwinding catalyzed by 50 nM ToPif1 and 150 μM ATP. Black arrows in the solid style indicate the time of adding proteins. Dashed arrows in black represent the unwinding time of ToPif1 with different G4 DNA substrates.
Table 1.
Binding and unwinding activities of ToPif1 for different DNA substrates 1 .
| Substrate | Binding 2 | Unwinding 3 | |
|---|---|---|---|
| K d,app (nM) | A m | kcat (s−1) | |
| Parallel G4 | |||
| G4CEB | 23.27 ± 3.12 | ND 4 | ND |
| G4P‐214 | ND | 0.55 ± 0.02 | 1.57 ± 0.07 |
| G4P‐241 | ND | 0.35 ± 0.02 | 1.23 ± 0.05 |
| G4P‐124 | ND | 0.22 ± 0.01 | 1.17 ± 0.04 |
| Antiparallel G4 | |||
| G4Tel | 29.63 ± 2.64 | ND | ND |
| G4AP‐424 | ND | 0.72 ± 0.06 | 2.18 ± 0.02 |
| 4G4AP‐333 | ND | 0.70 ± 0.03 | 0.57 ± 0.01 |
| ssDNA | |||
| T12 | 29.12 ± 4.19 | - | - |
| dsDNA | |||
| S26D17 | ND | 0.59 ± 0.02 | 3.53 ± 0.02 |
| Blunt‐end DNA | |||
| D24 | 250~280 | - | - |
Data were determined from 2–3 independent experiments under the experimental conditions as described in Materials and Methods.
Data obtained from Fig 1A.
Parameters were fitted from Figs 1B and 6B. The original curve of ToPif1 unwinding substrate S26D17 were not shown.
ND, not determined.
To gain mechanistic insight into G4 unfolding and understand the molecular basis underlying the differences in G4 unfolding between the parallel and antiparallel G4s, smFRET assays were performed with G4 DNAs in which the bases near the 5′ and 3′ sides of G4 were fluorescently labeled. Therefore, its unfolding activity could be sensitively recorded by smFRET time traces. The smFRET time trajectories recorded with antiparallel G4s comprising three or four G‐tetrads (smG4AP‐424 and sm4G4AP‐333, respectively) were characterized by a stepwise unfolding procedure, in which the smFRET level successively decreased from E ≈ 0.90 to E ≈ 0.12 and then finally disappeared due to the escape of the unwound DNA from the coverslip (Fig 1C). This phenomenon has been observed previously in studies of ScPif1 by two different laboratories (Zhou et al, 2014; Hou et al, 2015) and was interpreted as that Pif1 helicase first unfolds G4 from the 5′‐lateral G‐column, resulting in a G‐triplex (G3), then further transforms G3 into a G‐hairpin structure and finally completely unwinds the duplex. Interestingly, for parallel G4 and under the same experimental conditions, although 30–35% time traces (type I) recorded were essentially the same as those observed with antiparallel G4, ~65% smFRET time traces (type II) for parallel G4 oscillated between E ≈ 0.90 and E ≈ 0.60 without further decrease before the fluorescence signal bleaching (Fig 1D). Thus, the smFRET assays confirmed that ToPif1 unfolds both parallel and antiparallel G4 using the same mechanism but with different G4 unfolding efficiencies. The reduced unfolding efficiency in parallel G4 may simply result from the higher thermal stability in the parallel G4 compared with the antiparallel G4 (Fig EV1D and E). We then experimentally address this possibility by determining T m values of antiparallel (G4AP‐424) and parallel (G4P‐214) G4 DNAs using a CD melting assay. The results (Fig EV1D and E) show that T m values determined with antiparallel G4 (G4AP‐424) and parallel G4 (G4P‐214) are 40.1 °C and 43.8 °C, respectively, indicating that the reduced unfolding efficiency in parallel G4 may simply result from the higher thermal stability of parallel G4.
The overall structure of ToPif1 in complex with G4
To probe the structural basis of ToPif1‐mediated G4 unfolding, ToPif1 was complexed with parallel and antiparallel G4 DNAs flanked at their 5′‐ and 3′‐ ends with 6 and 8 nt poly(dT), respectively, mimicking G4s formed at a replication fork (Lemmens et al, 2015; Lee et al, 2021). Only parallel G4 (G4T6/T8) in complex with ToPif1 in a 1:2 ratio in the presence of ADP·AIF4 was crystallized and diffracted to 2.58 Å. The asymmetric unit of the crystal structure contained one G4 that was sandwiched between two ToPif1 molecules (named as molecules a and b) bound to ssDNAs with 5′‐3′ polarity. The two protein molecules in the asymmetric unit were linked through the DNA substrate and related by a rotation of 102.8°, forming a dumbbell‐shaped structure (Fig 2A and B). Molecule a anchored close to the 5′‐most G‐tetrad and molecule b was bound downstream of the 3′‐most G‐tetrad. The distance between the binding/unwinding surface constituted by domains 1B/2B and the nearest G‐tetrad in the molecule a is ≈ 3.00 Å with the 5′‐most G‐tetrad, whereas in molecule b, the distance with the last G‐tetrad at the 3′ end is greater than 12.0 Å (Fig 2A and B). Therefore, molecule a in 5′ is in an active unwinding state during G4 processing, establishing many interactions with G4, whereas molecule b in 3′ is not positioned for G4 unwinding and establishes few contacts with G4 (Fig 2A and B). The domain folding and the spatial arrangement of the modules in ToPif1 adopt a similar architecture as those observed in the solved crystal structures of ToPif1 (Dai et al, 2021) and other Pif1 family helicases from yeast (Lu et al, 2018) and Bacteroides species (Zhou et al, 2016). Domains 1A and 2A constitute a deep cleft where ADP·AIF4 is bound, and domain 2B is composed of an SH3‐like domain and a prominent β‐hairpin (loop3) (Figs 2A and B and Fig EV1, EV2, EV3, EV4, EV5F–I). Each ToPif1 molecule binds a 6 nt poly(dT) stretch. Molecule a binds T1–T6, and molecule b binds T22–T27. The conformation of T2–T5 and T24–T27 are conserved, and they superpose with a root mean square deviation (RMSD) of 1.20 Å, as already shown for ToPif1 complexed with several ligands, ssDNA, and ss/dsDNA (Dai et al, 2021); thus, domain 2B exhibits high conformational flexibility. Structural superposition between molecule a and the previously determined ToPif1 complexed with ss/dsDNA (Dai et al, 2021) on domain 1A demonstrated that the center of mass of domain 2B moves upward by 5.40 Å and rotates 25.70° upon G4 binding. The domains 2A/1B, the configurations of bound ssDNA, and the amino acid residues involved in ssDNA binding overlap substantially (RMSD = 0.28 Å over 103 residues) (Fig EV2, EV3, EV4, EV5A–F), indicating that domain 2B assumes different conformations to accommodate G4 and double‐stranded DNA (dsDNA) binding, respectively. Similarly, superposing molecules a and b on domain 1A shows that G4 binding induced a stable β‐hairpin (loop3) formation, and the center of mass of domain 2B in the molecule a moved upward 5.70 Å, accompanied by 22.90° rotation (Fig 2C), suggesting that domain 2B undergoes a significant conformational adjustment before and after G4 unfolding. G4 is complexed with three K+ ions: two are located inside G4 between the tetrads and an extra K+ is on top of the 3′ side of G4. This K+ ion is stabilized by the last tetrad (tetrad III: G9·G13·G17·G21), T22, and R448 of ToPif1 molecule b. The overall topology of the G4 structure solved in this work is consistent with G4s previously reported in complexed with other proteins. They are characterized by a stack of three G‐tetrads, and the three short loops containing single thymine cross the grooves of the parallel G4 helix, joining the top and bottom G‐tetrads in the stack (Fig 2D). ToPif1‐G4T6/T8 crystal structure exhibits a good fit with SAXS data (Figs EV3, EV4, EV5A–E and Table EV3) with a χ 2 of 1.91, confirming that the conformation observed in the crystal state is also the one found in the solution.
Figure 2. Structure analysis of ToPif1 complexed with G‐quadruplex (G4) DNA and ADP·AlF4 .

- Overall structure of ToPif1‐G4T6/T8‐ADP·AlF4 ternary complex in cartoon mode with the conserved domains 1A (green), 1B (orange), 2A (pink), 2B (blue), and C‐terminal (CTD, brown). G4 DNA (G4T6/T8) is colored in red and ADP·AlF4 is shown as a black stick. ToPif1 molecules binding at the 5′‐ and 3′‐ends of G4 DNA are labeled as molecule a and molecule b, respectively.
- Surface view after cutting the crystal structure ToPif1‐G4T6/T8‐ADP·AlF4 ternary complex and the domains are colored as in (A).
- Structural superposition for the structures of molecules a and b with the mass centers of domain 2B shown as a sphere (mass centers of molecules a colored in blue and that of molecules b colored in cyan).
- Residues of the molecule a that interact with G4 layers in the ToPif1‐G4T6/T8‐ADP·AlF4 ternary complex; G4 DNA (G4T6/T8) is shown in red and the interacting residues are represented as sticks.
Figure EV1. ToPif1 recognition for G4 and ssDNA.

- CD experiments of G4 DNA.
- Left panel: DNA binding of ToPif1 to G4CEB with 1 μM T12 (black line) or 1 μM G4CEB (blue line) or none of them (red line). The binding of fitting of the data to the equation (1) yields a K d,app value for ToPif1‐G4CEB of 30.30 ± 1.17 nM, a K d,app value for ToPif1‐G4CEB (added with 1 μM T12) of 30.91 ± 2.32 nM. Right panel: DNA binding of ToPif1 to T12 with 1 μM G4CEB (red line) or 1 μM T12 (blue line) or none of them (black line). Fitting of the data to the equation (1) yields a K d,app value for ToPif1‐T12 of 29.10 ± 0.53 nM, a K d,app value for ToPif1‐T12 (added with 1 μM G4CEB) of 26.50 ± 0.71 nM. DNA binding assays were carried out in buffer A (25 mM Tris–HCl (pH 7.5), 50 mM NaCl, 2 mM MgCl2, and 2 mM DTT) with 0.5 mM ADP·AlF4.
- Stopped‐flow unwinding kinetic curves of ToPif1 unwinding G4 DNA (G4AP‐424, G4P‐214, 4G4AP‐333) in buffer A with 1 mM ADP·AlF4.
- CD analysis of G4AP‐424 and G4P‐214.
- Normalized melting curves from CD melting assays for G4AP‐424 and G4P‐214 at different temperatures (20–75 °C).
- Cartoon representation of ToPif1 (molecule a) with G4T6/T8 in the presence of ADP·AlF4 shown as a black stick and loop3 highlighted in magenta.
- Cartoon representation of ToPif1‐dT15‐ADP·AlF4 (PDB: 6S3 M; Dai et al, 2021) with ADP·AlF4 shown as a black stick and loop3 highlighted in magenta.
- Cartoon representation of BaPif1‐dT10‐ ADP·AlF4 (PDB: 5FHE; Zhou et al, 2016) with ADP·AlF4 shown as a black stick and loop3 highlighted in magenta.
- Cartoon representation of ScPif1p‐poly (G3T5)‐ADP·AlF4 (PDB: 5O6B; Lu et al, 2018) with ADP·AlF4 shown as a black stick and loop3 highlighted in magenta.
Figure EV2. Comparison of domain 2B of the molecule a of the ToPif1‐G4T6/T8‐ADP·AlF4 ternary complex and the previously determined ToPif1‐ss/dsDNA structure (PDB: 6S3H; Dai et al, 2021).

- Cartoon representation of molecule a in the ToPif1‐G4T6/T8‐ADP·AlF4 structure with domain 2B and the center mass (sphere) of domain 2B is highlighted in blue. G‐quadruplex (G4) DNA is shown in red.
- Cartoon representation of the ToPif1‐S7D11‐ADP·AlF4 structure (PDB: 6S3H; Dai et al, 2021) with domain 2B shown in magenta. The center mass of domain 2B is shown as a red sphere.
- Superposition on domain 1A of the structures in (A) and (B).
- Domain 2B and G4 DNA of molecule a in the ToPif1‐G4T6/T8‐ADP·AlF4 structure with the close‐up view of interactions between ToPif1 and the G4 tetrad I.
- Domain 2B and modeled duplex DNA in the ToPif1‐S7D11‐ADP·AlF4 structure (PDB: 6S3H; Dai et al, 2021).
- Superposition on domain 1A of the structure in (C) with only domain 2B and G4 DNA being shown.
Figure EV3. SAXS results of ToPif1‐G4T6/T8‐ADP·AlF4 .

- Fit curve of the SAXS data of ToPif1‐ G4T6/T8‐ADP·AlF4 with two modeled ToPif1 molecules bound to the substrate G4T6/T8 calculated with Crysol.
- The model of ToPif1‐G4T6/T8‐ADP·AlF4 superimposed on the ab initio envelope calculated with DAMMIF.
- The SAXS Model of ToPif1‐G4T6/T8 ‐ADP·AlF4.
- Crystal structure of ToPif1‐G4T6/T8 ‐ADP·AlF4.
- Superposition for SAXS model and crystal structure of ToPif1‐G4T6/T8‐ADP·AlF4.
Figure EV4. Functional validation of ToPif1 mutants and ligand interaction diagram of T6/G7 in the ToPif1 complex compared with the guanine‐specific pocket (GSP) in the CsRecQ structure.

- CD results of ToPif1 and its mutants.
- ATP hydrolysis of ToPif1 and its mutants with or without DNA effector (S18H11).
- Ligand interaction between T6 and ToPif1 in the ToPif1‐G4T6/T8‐ ADP·AlF4 structure.
- Ligand interaction between G7 and ToPif1 in the ToPif1‐GR17‐ ADP·AlF4 structure (PDB: 7BIL; Dai et al, 2021).
- Ligand interaction between G21 and CsRecQ in CsRecQ‐ssDNA structure (PDB: 6CRM; Voter et al, 2018).
Figure EV5. Sequence alignment of Pif1 helicase from bacteria, humans, and yeast.
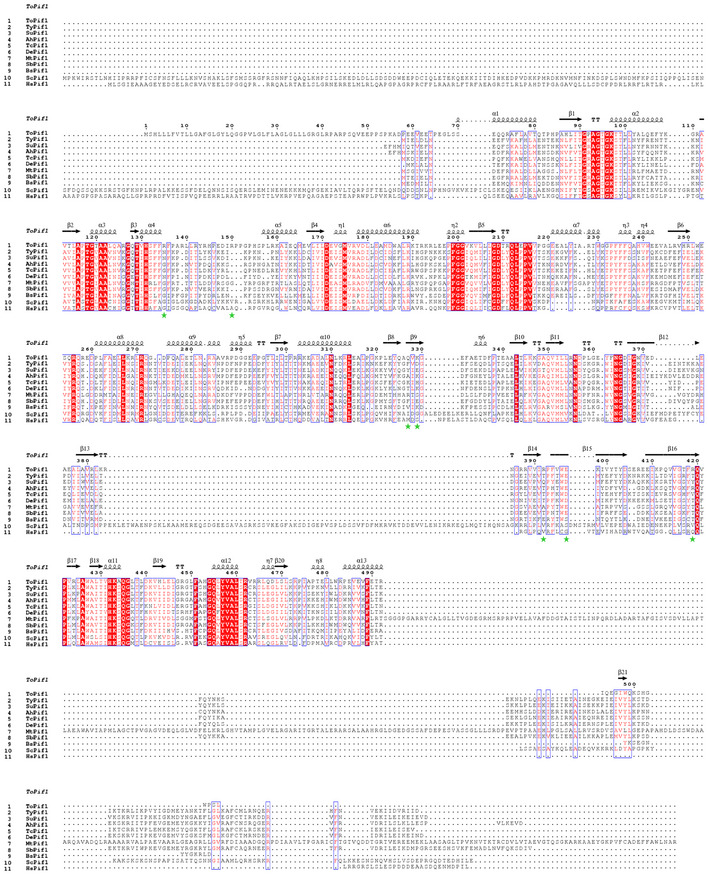
Thermus bacteria Pif1 (1–8) are from Thermus oshimai (ToPif1), Thermodesulfovibrio yellowstonii (TyPif1), Sulfurihydrogenibium sp (SuPif1), Anaerobaculum hydrogeniformans (AhPif1), Thermodesulfobacterium commune (TcPif1), Deferribacter desulfuricans (DePif1), Mycolicibacterium thermoresistibile (MtPif1), and Synergistales bacterium (SbPif1). Bacteria at room temperature are from Bacteroides sp (BsPif1). Homo sapiens and Saccharomyces cerevisiae are labeled as HsPif1 and ScPif1. Residues involved in G4‐Recognizing Surface (GRS) are shown with green stars.
Structural basis of recognitions and interactions of the entire G‐quadruplex and the presumed G‐base from the unwound G4
ToPif1 recognizes the entire G4 through a cluster of amino acids at domains 1B/2B, constituting G4‐Recognizing Surfaces (GRS; Fig 2E). Although R419 and R392 interact with G11 and G19 in the 5′‐most G‐tetrad (G7·G11·G15·G19) through cation‐π interactions, respectively, the side chain amino group of Q327 interacts with the deoxyribose group of G11 through nonbonded contacts (Figs 3A and EV2D). Intriguingly, the negatively charged carboxyl group of E397 against the negatively charged oxygen atom on the ribose‐phosphate backbone near G7 will exert a repulsion force, which may influence the global conformation of the G4 (Fig 3B). Furthermore, the phosphate group of G20 in the middle tetrad (G8·G12·G16·G20) is stabilized by R135 (Fig 3C). Two positively charged residues, K329 and R150, interact with G9 and G21 in 3′‐G‐tetrad (G9·G13·G17·G21) through ionic and cation‐π interactions (Fig 3D). Thus, the residues of GRS form structural clusters which differentially recognize the guanine bases from three different tetrads in the G4. It is, therefore, plausible that the spatial conformation of G4 is destabilized by these interactions, and G4 is efficiently unfolded in coordination with translocation forces derived from ATP hydrolysis.
Figure 3. Atomic interactions between the integral G‐quadruplex (G4) DNA and ToPif1.

-
AInteractions of ToPif1 and the G4 layer I.
-
BThe negative–negative repulsion interaction between E397 and the G7 of G4T6/T8 in the ToPif1 ternary complex structure. The electrostatic potential at ± 5 kTe −1 was colored in blue (basic/positive), white (neutral), and red (acidic/negative).
-
C, DInteraction of ToPif1 and G4 layers II and III, respectively. Molecular electrostatic potential map calculated with G4 DNA omitted from the co‐crystal structure (blue to red, ± 5 kTe −1).
In our ToPif1‐G4 complex structure (ToPif1‐G4T6/T8), the T6 just upstream of the 5′‐tetrad is interacting with a cluster of amino acids (Fig 4A). T6 also stacks against G19 in the flat 5′‐G‐tetrad (G7·G11·G15·G19) through a π–π interaction. R392 and V395 are specifically involved in thymine base recognition through hydrogen bonds (R392‐T6 = 2.50 Å and V395‐T6 = 2.80 Å). Furthermore, the base configuration is further stabilized by π–π stacking between F394 and T6. The residues R355 and R135 interact with the ribose and the phosphodiester of T6 but not its thymine base. To determine whether the binding of a guanine base at the T6 position can remodel the conformation of GRS to accommodate G‐base‐specific binding, an ssDNA bearing a G4‐forming sequence (GR17) was directly complexed with ToPif1 without prefolding (Dai et al, 2021). The crystal structure at a resolution of 2.21 Å demonstrated that the global conformation of ToPif1‐GR17 (Dai et al, 2021) is similar to the complex ToPif1‐G4T6/T8 (Fig 4B), except that the G4 structure is absent. Structural superposition between the two structures revealed three remarkable features: (i) the G7 in binary complex (ToPif1‐GR17) occupies the equivalent spatial position of T6 in ToPif1‐G4T6/T8 (Fig 4C); (ii) both G7 and T6 flip to the same degree (Fig 4D, ≈113.0°); (iii) both the bases and ribose groups of G7 and T6 are bound by the same residues (R392, V395, and R335) with essentially the same conformation, except that residue N356 establishes an additional hydrogen bond with the phosphate group of G7 upon its binding (Fig 4D). Therefore, if base G7 is considered as the first G base from an unfolded G‐tetrad, there is no striking structural reorganization to accommodate the binding of G rather than T. Although G7 in GR17 described previously provides a conformation for G4 being unwound in the first base, other mechanisms may also exist.
Figure 4. Structural superposition of ToPif1 with the G4T6/T8 and the GR17 .

- Interaction between ToPif1 and the T6 of G4T6/T8 in the ToPif1‐G4T6/T8‐ADP·AlF4 ternary complex.
- Superposition on domain 1A of structures in ToPif1‐G4T6/T8 and ToPif1‐GR17.
- Interaction between ToPif1 and the G7 of GR17 in the ToPif1‐GR17‐ADP·AlF4 ternary complex.
- Structural superposition of interacting residues for ToPif1 with the T6 of G4T6/T8 and the G7 of GR17.
Mutational analysis of the residues involved in G4 binding and unfolding
According to the potential functions of certain residues in G4 binding or/and unfolding, structurally guided single alanine substitution variants of ToPif1 were purified to homogeneity, including (i) the mutants R392A, R135A, and R355A, which interact with the T6/G7 base and/or the ribose/phosphodiester moieties; (ii) four variants (Q327A, E397A, R419A, and K329A) involved in the 5′‐most G‐tetrad; and (iii) R135 and R150 involved in the interactions with middle G‐tetrad and the 3′‐most G‐tetrad, respectively (Table 2). To make sure that the each given residue mutation does not result in a global conformational change, which will affect ascertain the distinct role of the given residue in G4 binding/unfolding, we first performed circular dichroism (CD) spectroscopy and dynamic light scattering (DLS) assays, which will provide the secondary structure information and hydrodynamic behavior (monomer or aggregation) of the variants. The results show that the variants displayed the same CD spectra as ToPif1, and the determined DLS parameters are essentially the same between ToPif1 and variants (Fig EV4A and Table EV4). The DNA‐dependent ATPase activities of the ToPif1 variants were measured using a coupled spectrophotometric ATPase assay. Fig EV4B and Table EV4 demonstrated that the determined K m and k cat values with the variants are not significantly different from those determined with the wild‐type ToPif1.
Table 2.
Parameters of binding and unwinding activities of ToPif1 and its variants 1 .
| Variants | G4 (G4Tel) binding | G‐quadruplex (AP‐S16‐TelG4) unwinding | ssDNA (T12) binding | dsDNA (S26D17) unwinding | ||||
|---|---|---|---|---|---|---|---|---|
| K d,app (nM) | A m | k cat (s−1) | k cat/K d,app 2 | K d,app (nM) | A m | k cat (s−1) | k cat/K d,app 3 | |
| ToPif1 | 29.63 ± 2.64 | 0.53 ± 0.01 | 0.48 ± 0.01 | 0.0162 ± 0.0012 | 30.20 ± 1.41 | 0.59 ± 0.02 | 3.53 ± 0.02 | 0.1169 ± 0.0031 |
| R392A | 28.50 ± 2.20 | 0.40 ± 0.01 | 0.27 ± 0.02 | 0.0095 ± 0.0001 | 28.30 ± 1.80 | 0.32 ± 0.01 | 3.50 ± 0.02 | 0.1237 ± 0.0067 |
| R355A | 133.00 ± 18.04 | 0.38 ± 0.02 | 0.07 ± 0.01 | 0.0005 ± 0.0001 | 38.10 ± 1.15 | 0.34 ± 0.01 | 1.27 ± 0.01 | 0.0333 ± 0.0005 |
| R135A | 119.00 ± 10.67 | 0.34 ± 0.02 | 0.05 ± 0.01 | 0.0004 ± 0.0001 | 30.90 ± 0.47 | 0.47 ± 0.01 | 1.42 ± 0.02 | 0.0460 ± 0.0010 |
| Q327A | 51.50 ± 3.23 | 0.48 ± 0.01 | 0.41 ± 0.02 | 0.0080 ± 0.0002 | 63.40 ± 9.42 | 0.43 ± 0.03 | 6.14 ± 0.03 | 0.0968 ± 0.0121 |
| R419A | 38.50 ± 2.25 | 0.24 ± 0.02 | 0.21 ± 0.01 | 0.0055 ± 0.0001 | 38.20 ± 5.47 | 0.32 ± 0.02 | 2.46 ± 0.01 | 0.0644 ± 0.0016 |
| K329A | 48.70 ± 2.65 | 0.37 ± 0.01 | 0.29 ± 0.02 | 0.0060 ± 0.0001 | 30.00 ± 1.38 | 0.39 ± 0.02 | 3.38 ± 0.01 | 0.1127 ± 0.0040 |
| R150A | 152.00 ± 12.97 | 0.28 ± 0.01 | 0.06 ± 0.01 | 0.0004 ± 0.0001 | 31.30 ± 1.76 | 0.43 ± 0.03 | 2.50 ± 0.01 | 0.0799 ± 0.0039 |
| E397A | 28.30 ± 2.21 | 1.00 ± 0.01 | 1.19 ± 0.01 | 0.0420 ± 0.0027 | 29.40 ± 1.36 | 0.49 ± 0.02 | 3.79 ± 0.02 | 0.1289 ± 0.0050 |
| E397L | 33.00 ± 3.24 | 0.88 ± 0.01 | 1.18 ± 0.01 | 0.0358 ± 0.0020 | 36.00 ± 2.84 | 0.48 ± 0.01 | 2.36 ± 0.02 | 0.0656 ± 0.0043 |
| E397H | 44.60 ± 1.68 | 0.78 ± 0.03 | 1.32 ± 0.01 | 0.0296 ± 0.0009 | 50.90 ± 3.45 | 0.31 ± 0.02 | 2.64 ± 0.02 | 0.0519 ± 0.0030 |
| E397D | 38.80 ± 8.07 | 0.45 ± 0.01 | 0.35 ± 0.02 | 0.0090 ± 0.0011 | 28.00 ± 3.18 | 0.49 ± 0.01 | 3.27 ± 0.01 | 0.1168 ± 0.0116 |
The reported data are the average values determined from 3‐4 independent assays as performed under experimental conditions as described in ‘Materials and Methods’.
The values are the equivalent ratios of k cat (G‐quadruplex unwinding) and K d,app (G4 binding) comes from the data of Figs 1A, 5A and 6A.
The values are the equivalent ratios of k cat (dsDNA S26D17 unwinding) and K d,app (ssDNA T12 binding).
To ascertain qualitatively how the modified residues affect the unfolding activities, the K d,app values, and the steady‐state kinetic parameters, including the unfolding magnitude (A m) and the unfolding rate (k cat), were determined with fluorescent‐labeled ssDNA (T12), partial duplex DNA (S26D17), and G4 DNA substrates as described above. Several representative G4 unfolding kinetic curves are shown in Fig 5A, and the kinetic parameters of all variants are summarized in Table 2. The parameters (K d,app, A m, and k cat) determined with G4 and ssDNA substrates showed a range of variability. To best understand the mutation results, the ratio of k cat/K d,app, a useful index for comparing the catalytic efficiency (Barlow et al, 2009), was determined (Table 2). Arranging the G4 k cat/K d,app values in ascending numerical order shows that the relative increase in G4 k cat/K d,app values can be roughly classified into three categories (Fig 5B): (i) group I (R355A, R135A, and R150A) is characterized by zero values in k cat/K d,app for G4 unfolding, while their k cat/K d,app values determined from dsDNA unwinding are reduced by 32% (R150A) and 72% (R355A); (ii) group II (R392A, Q327A, K329A, and R419A) is marked by about 41–66% reduction in k cat/K d,app values for G4 unfolding and the corresponding values determined with dsDNA are essentially the same as these determined with ToPif1, except that k cat/K d,app value determined with R419A for dsDNA is reduced to 45%; (iii) group III (E397A, E397L, and E397H) displays surprising results in which k cat/K d,app values determined with G4 are increased to 2–2.6 folds, whereas the k cat/K d,app values for dsDNA are inversely reduced to 50% compared with that of ToPif1. Taken together, these results indicate that alteration of the residues in groups I–II, particularly the residues in group I, significantly impair G4 unfolding but only moderately reduces dsDNA unwinding. Consistently, smFRET time trajectories recorded with the mutants in group III revealed that in sharp contrast to ToPif1, the curves only oscillate between 0.90 and 0.60 but scarcely attain a completely unfolded level, indicating that the variants can just release the 5′‐most lateral G column from G4 DNA but is unable to unfold the integral G4 DNA completely (Fig 5C–F).
Figure 5. G‐quadruplex (G4) unwinding activity of wild‐type ToPif1 (ToPif1) and its mutants.

-
AStopped‐flow kinetics of the G4 (AP‐S16‐TelG4) unwinding activity of ToPif1 and the various modified proteins. The different unwinding curves represent an average of three to four independent experiments for each substrate. The solid line represents the fit of data according to equation (2).
-
BBar plot of k cat/K d,app values in Table 2 (n = 3 biological replicates). The k cat/K d,app values of G4 in descending numerical order (front panel), and these are determined with the dsDNA (S26D17, back panel). Data are presented as means ± SD.
-
C–FThe typical smFRET trajectories of antiparallel G4 (smG4AP‐424) unwinding catalyzed by different ToPif1 mutants based on single‐molecular FRET assays. The dashed magenta, black, and red lines represent the states of G4: fully folded, incompletely folded, and fully unfolded, respectively. The concentrations of the R355A (C), R135A (D), R150A (E), and R419A (F) mutants were 50 nM with 150‐μM ATP. The experimental conditions are described in Methods. Black arrows in the solid style indicate the time of adding proteins.
In group III, the kinetic parameters determined with E397A were significantly higher in terms of unfolding amplitude (A m) and rate (k cat), respectively (Figs 5B and 6A and Table 2). Compared with ToPif1, the k cat/K d,app value of E397A determined for G4 unfolding increased by 2.5‐fold, although that for dsDNA remained unchanged (Table 2). This stimulating effect was also observed with parallel G4s (Fig 6B). To confirm the observation, residue E397 was, therefore, replaced with a hydrophobic (E397L), a positively charged (E397H), and a negatively charged (E397D) residue. As expected, G4 unfolding activities determined with the first two variants were systematically higher than those of ToPif1. E397D bearing a negative charge displayed activity comparable to the wild type (Fig 6A). To gain in‐depth mechanistic insight into how residue E397 affects G4‐unfolding activity, all of the variants were further studied with smFRET techniques. Analysis of the smFRET time traces demonstrated that the unfolding times (t(s)) determined with the three typical variants were significantly reduced, except those for E397D, whose unfolding time remained essentially the same as that of ToPif1 (Fig 6C–F). The mutation‐stimulating G4‐resolution activity is surprising and raises the question of whether this may be a general autoregulatory mechanism by which the activity of G4 unfolding is regulated both in vitro and in vivo.
Figure 6. Stimulating effect upon mutation of E397.

-
AStopped‐flow kinetics of the antiparallel G4 (AP‐S16‐TelG4) unwinding activity of ToPif1 and its mutants. The different curves represent an average of three to four independent experiments for each substrate. The solid line represents the fit of data according to equation (2).
-
BE397A mutant‐stimulating effect determined with parallel G4 DNA.
-
C–EThe typical FRET trajectories of antiparallel G4 (smG4AP‐424) unwinding catalyzed by different point mutations on E397 using single‐molecular FRET assays. The dashed magenta and red lines represent the fully folded and unfolded states of G4, respectively. The different unwinding curves represent an average of three to four independent experiments for each substrate. Black arrows in the solid style indicate the time of adding proteins.
-
FError bar plot of unwinding time of E397A, E397L, and E397H determined from unfolding curves of (C), (D), and (E), respectively (n = 3 biological replicates). The experimental conditions are described in Materials and Methods and data are presented as means ± SD.
Discussion
While increasing evidence has demonstrated that helicase‐mediated G‐quadruplex unfolding plays an essential role in preserving genome stability, the lack of structural information on G4‐processing helicases still hampers our mechanistic understanding of G4 resolution. With a wide array of approaches ranging from bulk/smFRET assays to structural biology analyses, our results reported here provide in‐depth insight into the currently largely unknown, but mechanistically important issue of how the Pif1 helicase family recognizes the integral G4 structure.
To our best knowledge, the structure reported here is the first co‐crystal structure of SF1 helicase bound to G4, whereas crystal structures of SF2 helicase‐G4 complexes available are DHX36 and CsRecQ proteins. Thus, a structural comparison between SF1 and SF2 helicase‐mediated G4 binding/unfolding may provide the common and distinct mechanism underlying G4 unfolding.
DHX36 protein, one of the most extensively studied G4‐unfolding helicases, is characterized by a DHX36‐specific motif (DSM), which specifically binds parallel G4s (Hossain et al, 2021). Interestingly, the X‐ray crystal structure of DHX36 (Chen et al, 2018) in complex with a Myc promoter‐derived G4 demonstrates a rearrangement of the 5′‐G‐tetrad with a one‐base translocation upon DSM binding (Chen et al, 2018). Because an NMR study shows that G4 keeps its integral state upon the binding of an isolated DSM (Heddi et al, 2015), it was, therefore, suggested that DSM, in coordination with the helicase core, unfolds the G4 one base at a time in an ATP‐hydrolysis‐independent manner (Chen et al, 2018). Recently, a crystal structure solved from a helicase core of a RecQ family helicase (CsRecQ) complexed with oligonucleotides harboring a human telomere sequence (Voter et al, 2018) revealed that a guanine base within the putative G‐tetrad is located at the 5′‐gate of the electropositive channel where the G‐base is flipped and sequestrated (Voter et al, 2018). This structure is interpreted to represent “a product complex of CsRecQ‐unwound G4 rather than a folded quadruplex” (Voter et al, 2018), although the complexed ssDNA was not prefolded to form a stable G4 before the preparation of the G4‐CsRecQ complex.
DHX36 uses DSM to bind and unfold G4s, and some G4‐resolving helicases as FANCJ also possess a motif equivalent to DSM (Chen et al, 2018; Lee et al, 2021). However, not all the SF2 helicases bear DSM. An intriguing and unresolved question is how the G4‐resolving helicases generally recognize and unfold G4s. We demonstrated that the 1B/2B domains in ToPif1 constitute a G4‐Recognizing Surface (GRS) in which the residues recognize the whole G4 structure, not just a tetrad, and differentially interact with the ribose and phosphate units in different tetrads. Superposition of the structural conformation of G4 complexed with ToPif1 with that of the DHX36‐Myc complex (Chen et al, 2018) demonstrated that, when the G4s well superposed, loop3 in ToPif1 occupies the spatial position of the DSM motif in DHX36, binding on the 5′ side of the G4. Given that Pif1 and DHX36 have opposite polarity for ssDNA translocation, it appears that helicase binding on the 5′ side of G4 is a critical feature for G4 unwinding. Furthermore, it appears that the previously identified GSP in the RecQ helicase family is not conserved in ToPif1 because the residues involved in the first base downstream of 5′‐G‐tetrad are not selective for guanine and do not form the equivalent hydrogen bonds that stabilize the guanines within G4s as observed in GSPs (Figs 1, 2, EV1, EV2, EV3, EV4, EV5, 3, 4, 5, 6A–D and EV4C–E). If base G7 is considered as the first G base from an unfolded G‐tetrad, there is no striking structural reorganization to accommodate the binding of G rather than T. Compared with the previously identified GSP, the cluster of residues surrounding the base (T6/G7) upstream of the G‐tetrad in ToPif1 is not bound with the equivalent residues identified in the GSP in CsRecQ (Fig EV4, EV5C–E). Of note, the G‐rich ssDNA including GR17 used by Dai et al (2021) and that by Voter et al (2018) were not prefolded to form stable G4 DNA in the ToPif1 and CsRecQ structures; it, therefore, remains to be determined whether these structures (ToPif1‐GR17; Dai et al, 2021 and CsRecQ‐ssDNA; Voter et al, 2018) represent an intermediate or/and a product complex of helicases bound to unwound G4 DNA or just ssDNA bound to the proteins.
Our binding studies demonstrated that ToPif1 possesses strong G4‐binding activity without any topological preference. This is not surprising because ToPif1 does not bear a DSM motif which was reported exclusively bind parallel G4 (Hossain et al, 2021). The smFRET time trajectory feature of ToPif1‐mediated G4 unfolding is mainly characterized by a stepwise unfolding procedure, without a long oscillation period, which is consistent with the previously recorded smFRET time trajectory with ScPif1 (Zhou et al, 2014; Hou et al, 2015). These results imply that ToPif1 translocates along the DNA lattice and sequentially unfolds G4 into G‐triplexes and then into G‐hairpins. ToPif1‐mediated G4 processing is radically different from previous reports on DHX36 (Chen et al, 2018) and the RecQ (Voter et al, 2018) helicase family, which were proposed to use a common mechanism of ATP‐independent repetitive unfolding to resolve G4s: binding of these helicases triggers the reorganization and destabilization of G4 with a one‐at‐a‐time type base translocation, and ATP is only needed for releasing the unfolded G4 (Chen et al, 2018; Voter et al, 2018). Therefore, it appears that SF1 helicases unfold G4 in a stepwise manner, whereas SF2 helicases unfold G4 repetitively; however, establishing these observations as a general rule needs further studies. Another interesting finding is that two negative charges between E397 and the oxygen atom on the DNA backbone near G7 repel one another. A series of mutations at E397 demonstrated that replacement of the negative residue by any non‐negative residue stimulates G4‐unfolding activity, raising the question that whether an autoinhibitory mechanism applies to other ToPif1 helicases. A sequence alignment of Pif1 family helicases revealed that a negative residue (E/D) is highly conserved in thermophilic gram‐negative bacteria (Fig EV5). However, there is a tendency toward replacing negative residue (E/D) with no‐negative residues (S/G) in evolutionarily advanced species (Fig EV5). Therefore, it appears that ToPif1 has not evolved with an optimum efficiency, but this could be due to growth conditions, G4 frequency in the genome, or a yet unknown regulatory mechanism stimulating ToPif1 activity.
The relation between growth temperature, G4 frequency, and Pif1 efficiency is not straightforward. Analysis of the occurrence of putative G4 sequences (PQS) in bacteria has recently been conducted. Though thermophile bacteria have genomes with higher GC content, the distribution of PQS is higher than expected by random chance in bacteria groups Deinococcales and Thermales while using either quadparser (Ding et al, 2018) or G4Hunter (Bartas et al, 2019) algorithms. In a later study, it was shown that T. oshimai had the highest frequency of PQS among all bacterial genomes explored (Table EV5). Surprisingly, the same study showed that Thermotogae, which are also extremely thermophilic gram‐negative bacteria, have the lowest frequency of PQS (Table EV5). Therefore, G4 occurrence does not seem to be linked to thermal conditions of growth. Bacteria from the Thermotoga group possess also a Pif1 helicase which exhibits G4 activity (Andis et al, 2018). The biochemical activities of Pif1 from Thermotoga elfi (TePif1) have been measured, and TePif1 exhibits a C‐terminal WYL domain with ssDNA‐binding function (Andis et al, 2018) necessary for substrate binding and helicase activity of TePif1. WYL domain is shared by Pif1 from other groups, such as Deferribacteres, but ToPif1 does not have one. Since Pif1 from other thermophilic bacteria such as Thermotoga elfii possessed an extra WYL domain (Andis et al, 2018), modulation of Pif1 activity in cis (WYL domain) and a regulatory effect on Pif1 in trans by unidentified co‐factor proteins can be hypothesized.
It was recently reported that the proteins Mgs1 and Mms1 in S. cerevisiae binding to G4 motifs in vivo partially depends on the helicase ScPif1 (Schwindt & Paeschke, 2018; Paeschke & Burkovics, 2021). Using the sequence similarity search tool, we identified the Mgs1‐like protein in the Thermus oshimai genome (ToMgs1 like, GeneBank: WP_018462088.1) which shares 29% identity with ScMgs1 across their lengths. ToMgs1 could be a co‐factor regulating ToPif1 in trans.
Though Pif1 is conserved from bacteria to humans, Pif1 has very diverse functions in bacteria, yeast, and human. Pif1 sequence exhibits variations with the insertion domain 2C in budding yeast (Lu et al, 2018, 2021) and accessory domains as WYL (Andis et al, 2018). Furthermore, sequence alignments show that some of the key residues identified in GRS are shared with other bacteria but not with Pif1 from eukaryotes (for an alignment, see fig S1 in Dai et al, 2021). We show here that ToPif1 can rely only on its helicase core domain to recognize and unfold G4 DNA, whereas the activity of TePif1 needs a WYL accessory domain (Andis et al, 2018). Therefore, it appears that Pif1 from different species adopts different solutions for enhancing its activity. Thus, co‐factors acting in cis or trans may enhance Pif1 activity for certain species, and the situation is far from being universal even in the bacteria domain. Further studies, instigated by the work reported here, are needed to complete our understanding of the general mechanism underlying how G4‐resolving helicases recognize and unfold G4s.
Materials and Methods
Reagents and buffers
All chemicals were reagent grade and all buffers were prepared in high‐quality deionized water from a Milli‐Q ultrapure water purification system (Millipore) with a resistivity of > 18.2 MΩ.cm and were filtered again on a 0.20‐μm filter before use. All DNA unwinding and binding assays were performed in buffer A (20 mM Tris–HCl (pH 7.5 at 37 °C), 50 mM NaCl, 2 mM MgCl2, and 2 mM DTT) which was optimized previously by our group (Dai et al, 2021).
DNA substrate preparation
All the DNA substrates used in this study were chemically synthesized and HPLC‐purified by Sangon Biotech (Shanghai) as listed in Table EV1. The oligonucleotides used in binding and unwinding assays were prepared at a 2 μM working concentration. The duplex or G4 DNA used in the stopped‐flow and smFRET assays was heated to 95 °C for 5 min in stocking buffer (20 mM Tris–HCl, pH 7.5, 100 mM NaCl) and annealed by slow cooling to room temperature. The DNA substrates in crystallization were dissolved in 20 mM Tris–HCl (pH 7.5) with 100 mM KCl, heated to 95 °C, and allowed to cool slowly to room temperature in a water bath. After purification on a Mono Q column, the formation of G4 structures was checked using circular dichroism (CD) spectropolarimetry.
Protein expression and purification
ToPif1 (residues 64‐507) and its mutants (R355A, R135A, R150A, R419A, R392A, Q327A, K329A, E397A, E397L, E397H, and E397D) were all cloned into pET15b‐SUMO and then transformed into the C2566H E. coli strain (New England Biolabs), respectively. When the culture reached the early stationary phase (OD600 = 0.55–0.6) at 37 °C, 0.3 mM IPTG was added and the protein expression was induced at 18 °C over 16 h. Cells were harvested by centrifugation (4,500 g, 4 °C, 15 min) and pellets were suspended in lysis buffer (20 mM Tris–HCl pH 7.5, 500 mM NaCl, 10 mM imidazole, and 5% glycerol (v/v)). Cells were broken with a French press and then further sonicated two to three times to shear DNA. After centrifugation at 12,000 rpm for 40 min, the supernatants were filtered through a 0.45 μm filter and loaded onto a Ni2+ charged IMAC column (GE Healthcare). After washing twice, the SUMO‐ToPif1 was then eluted from the Ni2+ affinity column with elution buffer (20 mM Tris–HCl, pH 7.5, 500 mM NaCl, 300 mM imidazole, and 5% glycerol (v/v)) at 4 °C. The eluted protein was treated with SUMO protease (Invitrogen, Beijing). Then, the SUMO digested protein was further purified by a HiTrap Heparin column (GE Healthcare) to remove the SUMO‐tag and other protein impurities. The eluted fraction containing ToPif1 was collected and concentrated. The final purified protein was dialyzed against the storage buffer (20 mM Tris–HCl, pH 7.5, 500 mM NaCl, 1 mM DTT) and concentrated to approximately 10 mg/ml for crystallization and was about 95% pure as determined by SDS–PAGE. Mutations and truncations were engineered by PCR overlapping‐PCR protocol.
Equilibrium binding assays
The isothermal binding curves were determined using a fluorescence polarization assay on an Infinite F200 plate reader (Tecan). FAM‐labeled DNA substrates were used in this study. Varying amounts of protein were added to a 150 μl aliquot of buffer A containing 5 nM FAM‐labeled DNA. Each sample was allowed to equilibrate in solution for 5 min at 37 °C, and then fluorescence polarization was measured. Less than 5% change was observed between the 5 and 10 min measurements, indicating that equilibrium was reached in 5 min. The equilibrium dissociation constants were determined by fitting the binding curves using equation (1):
| (1) |
where ∆r max is the maximal amplitude of the anisotropy (i.e., r max – r free,DNA), P is the helicase concentration, and K d,app is the midpoint of the curve corresponding to the apparent dissociation constant.
Crystallization of ToPif1‐nucleic acid complexes
For crystallization, purified ToPif1 was incubated with the G4T6/T8 after dissolving and folding in 20 mM Tris–HCl (pH 7.5) with 100 mM KCl at a molar ratio of 2:1 in the presence of ATP analog ADP·AlF4. The resulting ToPif1‐G4T6/T8‐ADP·AlF4 complex was purified using size‐exclusion chromatography and then concentrated at approximately 10 mg/ml. Crystallization trials on ToPif1 and its complexes with DNA (Table EV1) and ADP·AlF4 were performed at 20 °C using the sitting‐drop vapor diffusion method. Crystallization screening was carried out at 20 °C using commercial screening kits (Hampton Research, Molecular Dimensions, and Rigaku Reagents), where the ToPif1‐DNA complex was mixed at a 1:1 ratio with the reservoir solution. Crystals of ToPif1‐G4T6/T8‐ADP·AlF4 were obtained using 0.1 M Bis‐Tris (pH = 6.5), 10% PEG20000. All these conditions were optimized with a grid search using 48 well Linbro plates at 20 °C, where 1 μl of protein sample and 1 μl of precipitant were mixed and equilibrated with 60 μl of precipitant.
X‐ray data collection, phasing, and refinement
All X‐ray diffraction data were collected on beamline BL19U1 (Zhang et al, 2019) at the Shanghai Synchrotron Radiation Facility (China) using a Pilatus 6 M detector (Dectris) and were processed using XDS (Kabsch, 2010). ToPif1‐G4T6/T8‐ADP·AlF4 structures were solved by molecular replacement, performed in the PHENIX software suite (Adams et al, 2010) with Phaser (McCoy et al, 2007), using the ToPif1 apo structure (PDB: 6S3E; Dai et al, 2021) as the search model (Lovelace et al, 2005). Manual rebuilding was done using the Coot (Emsley et al, 2010) and further refinement was performed in PHENIX. Cell parameters and data collection statistics are reported in Table EV2.
Small‐angle X‐ray scattering assay
SEC‐SAXS experiment was carried out at beamline SWING (SOLEIL Synchrotron, Saint‐Aubin, France) with SEC‐HPLC coupled to SAXS. The sample of ToPif1‐G4 complex was injected at a concentration of 10 mg/ml on a Superdex 200 5/150 Increase column (Cytiva) at a flow rate of 0.2 ml/min equilibrated in buffer 25 mM Hepes (pH = 7.5), 150 mM KCl, and 5% glycerol. Scattering data were collected at 20 °C using a Pilatus 1 M detector (Dectris), and the data reduction and processing of images were done with Foxtrot (David & Pérez, 2009). Further analysis was done with ATSAS 2.8 suite (Petoukhov et al, 2012). Experimental R g, I(0), and D max values were calculated with PRIMUS and GNOM4 programs, respectively. Ab initio envelopes for isolated complexes were determined using DAMMIF with the pair distance distribution function calculated with GNOM4. Full atomic models derived from crystal structure were modeled with MODELLER and adjusted to SAXS data with DADIMODO. In this modeling procedure, only the missing parts from the X‐ray structure were kept flexible. Profiles of atomic models were calculated and fitted to the experimental data using CRYSOL and aligned on ab initio bead models with SUPCOMB. All the SAXS parameters are summarized in Table EV3.
Stopped‐flow unwinding assay
Briefly, unwinding kinetics were measured in a two‐syringe mode, where ToPif1 and fluorescently labeled DNA substrate were preincubated at 37 °C in one syringe for 5 min and the unwinding reaction was initiated by rapidly mixing with ATP from another syringe. Each syringe contained unwinding reaction buffer A (25 mM Tris–HCl (pH 7.5), 50 mM NaCl, 2 mM MgCl2, and 2 mM DTT). All concentrations listed are after mixing, unless otherwise noted. For converting the output data from volts to percentage unwinding, a calibration experiment was performed in a four‐syringe mode, where the helicase, the hexachlorofluorescein‐labeled single‐stranded oligonucleotides, the fluorescein‐labeled single‐stranded oligonucleotides, and ATP were in four syringes, respectively. The fluorescent signal of the mixed solution from the four syringes corresponded to 100% unwinding. The standard reaction was performed with 4 nM DNA substrates, 1 mM ATP, and 100 nM ToPif1 in buffer A.
All stopped‐flow kinetic traces were averages of ≥ 10 individual traces. The kinetic traces were analyzed using Biokine (version 4.26, BioLogic, France) using equation (2):
| (2) |
where A(t) represents the fraction of DNA unwound at time t, A 1 and A 2 are the unwinding amplitudes, k 1 and k 2 are the unwinding rate constants of the two phases, and t 0 is the time at which the fraction of DNA unwound starts to rise. From the four parameters obtained through the fitting, we can determine the total unwinding amplitude A m = A 1 + A 2 and the initial unwinding rate (i.e., the slope of the kinetic unwinding curve at early times) k cat = k 1 A 1 + k 2 A 2.
Single‐molecule fluorescence data acquisition
Fifty picomolar fluorescently labeled DNA was added to the chamber containing imaging buffer composed of 20 mM Tris–HCl (pH 7.5), 1 mM MgCl2, 50 mM NaCl, 1 mM DTT, and an oxygen scavenging system (0.8% D‐glucose, 1 mg/mL glucose oxidase, 0.4 mg/mL catalase, and 1 mM Trolox). After immobilization for 10 min, free DNA molecules were removed by washing with the imagining buffer. We used an exposure time of 100 ms for all recordings at a constant temperature of 22 °C. FRET efficiency was calculated using I A/(I D + I A), where I D and I A represent the intensities of donor and acceptor, respectively. Basic data analysis was carried out by scripts written in MATLAB, and all data fitting were generated using Origin 9.0. Histograms were fitted to Gaussian distributions, with the peak positions unrestrained.
Circular dichroism spectropolarimetry
Circular dichroism (CD) experiments were performed with a BioLogic MOS450/AF‐CD optical system (BioLogic Science Instruments, France) equipped with a temperature‐controlled cell holder, using a quartz cell with a 1 mm path length. A 2.5 μM solution of G4 DNA was prepared in 25 mM Tris–HCl (pH 7.5) and 100 mM NaCl. CD spectra were recorded in the UV (220–320 nm) regions in 0.75 nm increments with an averaging time of 2 s at 25 °C.
Dynamic light scattering (DLS) assay
Dynamic light scattering measurements were performed at 37 °C using a DynaPro NanoStar instrument (Wyatt Technology Europe GmbH, Germany) equipped with a thermostated cell holder and disposable cuvettes (UVette, Eppendorf). All solutions were filtered using 0.22 μm filters. Purified ToPif1 or its mutants (10 μM) were dialyzed in buffer A (final volume, 30 μl). The scattered light was collected at an angle of 90°. Recording times were typically between 3 and 5 min (20−30 cycles on average, 10 s in each cycle). The analysis was performed with the Dynamics 7.0 software using the regularization method (Wyatt Technology). The molecular weight was calculated from the hydrodynamic radius using the following empirical equation (3),
| (3) |
where Mw and R H represent the molecular weight (in kDa) and the hydrodynamic radius (in nm), respectively.
ATP hydrolysis measurement
The malachite green assay (MAK113; Sigma‐Aldrich) was used to test the ATP hydrolysis activity of ToPif1 and its mutants by measuring the release of inorganic phosphate as previously described (Liu et al, 2021). Briefly, 100 nM purified protein and ATP (concentrations ranging from 0 μM to 400 μM) were incubated with or without a 1 mM DNA effector (S18H11, sequence were shown in Table EV1) using a VICTOR Nivo Multimode Microplate Reader (PerkinElmer, Waltham, MA, USA). All reactions were performed in triplicates of 150 μl each at 25 °C in buffer A. The parameters of K m and k cat were calculated by fitting the experimental data to the Michaelis–Menten equation using Origin 9.0 (OriginLab Corporation, Northampton, MA, USA).
Author contributions
Conceived and designed study: X‐GX, X‐MH, and SR. Experiments: Y‐XD, H‐LG, N‐NL, W‐FC, XA, and H‐HL. Data processing: Y‐XD, N‐NL, W‐FC, and H‐LG. Discussion and interpretation of data: X‐GX, X‐MH, W‐FC, and SR. Manuscript writing and editing: X‐GX, Y‐XD, N‐NL, BS, and SR, with input from all authors.
Disclosure and competing interests statement
The authors declare that they have no conflict of interest.
Supporting information
Expanded View Figures PDF
Table EV1
Table EV2
Table EV3
Table EV4
Table EV5
Acknowledgments
We are grateful for Dr. Javier Perez and his team for SAXS data collection at the SWING beamline (SOLEIL Synchrotron, France). We thank the staff from BL17U1/BL18U1/BL19U1 beamline of the National Facility for Protein Science in Shanghai (NFPS) at Shanghai Synchrotron Radiation Facility, for assistance during data collection. This work was supported by the National Natural Science Foundation of China [31870788, 11574252, 11774407]; the Natural Science Basic Research Program of Shaanxi (2020JQ‐251); CNRS LIA (“Helicase‐mediated G‐quadruplex DNA unwinding and genome stability”).
EMBO reports (2022) 23: e53874.
Contributor Information
Xi‐Miao Hou, Email: houximiao@nwafu.edu.cn.
Stephane Rety, Email: stephane.rety@ens-lyon.fr.
Xu‐Guang Xi, Email: xxi01@ens-cachan.fr.
Data availability
Accession codes: The atomic coordinate and structure factors have been deposited in the Protein Data Bank (https://www.rcsb.org/) with the following accession numbers: 7OAR (ToPif1‐G4T6/T8‐ADP·AlF4).
References
- Adams PD, Afonine PV, Bunkoczi G, Chen VB, Davis IW, Echols N, Headd JJ, Hung LW, Kapral GJ, Grosse‐Kunstleve RW et al (2010) PHENIX: a comprehensive Python‐based system for macromolecular structure solution. Acta Crystallogr D Biol Crystallogr 66: 213–221 [DOI] [PMC free article] [PubMed] [Google Scholar]
- Andis NM, Sausen CW, Alladin A, Bochman ML (2018) The WYL domain of the PIF1 helicase from the thermophilic bacterium Thermotoga elfii is an accessory single‐stranded DNA binding module. Biochemistry 57: 1108–1118 [DOI] [PubMed] [Google Scholar]
- Barlow JN, Conrath K, Steyaert J (2009) Substrate‐dependent modulation of enzyme activity by allosteric effector antibodies. Biochem Biophys Acta 1794: 1259–1268 [DOI] [PubMed] [Google Scholar]
- Bartas M, Cutova M, Brazda V, Kaura P, Stastny J, Kolomaznik J, Coufal J, Goswami P, Cerven J, Pecinka P (2019) The presence and localization of G‐Quadruplex forming sequences in the domain of bacteria. Molecules 24: 1711 [DOI] [PMC free article] [PubMed] [Google Scholar]
- Bharti SK, Sommers JA, George F, Kuper J, Hamon F, Shin‐ya K, Teulade‐Fichou MP, Kisker C, Brosh RM Jr (2013) Specialization among iron‐sulfur cluster helicases to resolve G‐quadruplex DNA structures that threaten genomic stability. J Biol Chem 288: 28217–28229 [DOI] [PMC free article] [PubMed] [Google Scholar]
- Budhathoki JB, Ray S, Urban V, Janscak P, Yodh JG, Balci H (2014) RecQ‐core of BLM unfolds telomeric G‐quadruplex in the absence of ATP. Nucleic Acids Res 42: 11528–11545 [DOI] [PMC free article] [PubMed] [Google Scholar]
- Burge S, Parkinson GN, Hazel P, Todd AK, Neidle S (2006) Quadruplex DNA: sequence, topology and structure. Nucleic Acids Res 34: 5402–5415 [DOI] [PMC free article] [PubMed] [Google Scholar]
- Castillo Bosch P, Segura‐Bayona S, Koole W, van Heteren JT, Dewar JM, Tijsterman M, Knipscheer P (2014) FANCJ promotes DNA synthesis through G‐quadruplex structures. Embo J 33: 2521–2533 [DOI] [PMC free article] [PubMed] [Google Scholar]
- Chen MC, Tippana R, Demeshkina NA, Murat P, Balasubramanian S, Myong S, Ferré‐D'Amaré AR (2018) Structural basis of G‐quadruplex unfolding by the DEAH/RHA helicase DHX36. Nature 558: 465–469 [DOI] [PMC free article] [PubMed] [Google Scholar]
- Cheng M, Cheng Y, Hao J, Jia G, Zhou J, Mergny JL, Li C (2018) Loop permutation affects the topology and stability of G‐quadruplexes. Nucleic Acids Res 46: 9264–9275 [DOI] [PMC free article] [PubMed] [Google Scholar]
- Dahan D, Tsirkas I, Dovrat D, Sparks MA, Singh SP, Galletto R, Aharoni A (2018) Pif1 is essential for efficient replisome progression through lagging strand G‐quadruplex DNA secondary structures. Nucleic Acids Res 46: 11847–11857 [DOI] [PMC free article] [PubMed] [Google Scholar]
- Dai YX, Chen WF, Liu NN, Teng FY, Guo HL, Hou XM, Dou SX, Rety S, Xi XG (2021) Structural and functional studies of SF1B Pif1 from Thermus oshimai reveal dimerization‐induced helicase inhibition. Nucleic Acids Res 49: 4129–4143 [DOI] [PMC free article] [PubMed] [Google Scholar]
- David G, Pérez J (2009) Combined sampler robot and high‐performance liquid chromatography: a fully automated system for biological small‐angle X‐ray scattering experiments at the Synchrotron SOLEIL SWING beamline. J Appl Crystallogr 42: 892–900 [Google Scholar]
- De S, Michor F (2011) DNA secondary structures and epigenetic determinants of cancer genome evolution. Nat Struct Mol Biol 18: 950–955 [DOI] [PMC free article] [PubMed] [Google Scholar]
- Dehghani‐Tafti S, Levdikov V, Antson AA, Bax B, Sanders CM (2019) Structural and functional analysis of the nucleotide and DNA binding activities of the human PIF1 helicase. Nucleic Acids Res 47: 3208–3222 [DOI] [PMC free article] [PubMed] [Google Scholar]
- Ding Y, Fleming AM, Burrows CJ (2018) Case studies on potential G‐quadruplex‐forming sequences from the bacterial orders Deinococcales and Thermales derived from a survey of published genomes. Sci Rep 8: 15679 [DOI] [PMC free article] [PubMed] [Google Scholar]
- Eddy J, Maizels N (2006) Gene function correlates with potential for G4 DNA formation in the human genome. Nucleic Acids Res 34: 3887–3896 [DOI] [PMC free article] [PubMed] [Google Scholar]
- Eddy J, Maizels N (2008) Conserved elements with potential to form polymorphic G‐quadruplex structures in the first intron of human genes. Nucleic Acids Res 36: 1321–1333 [DOI] [PMC free article] [PubMed] [Google Scholar]
- Eddy S, Maddukuri L, Ketkar A, Zafar MK, Henninger EE, Pursell ZF, Eoff RL (2015) Evidence for the kinetic partitioning of polymerase activity on G‐quadruplex DNA. Biochemistry 54: 3218–3230 [DOI] [PMC free article] [PubMed] [Google Scholar]
- Edwards DN, Machwe A, Wang Z, Orren DK (2014) Intramolecular telomeric G‐quadruplexes dramatically inhibit DNA synthesis by replicative and translesion polymerases, revealing their potential to lead to genetic change. PLoS One 9: e80664 [DOI] [PMC free article] [PubMed] [Google Scholar]
- Emsley P, Lohkamp B, Scott WG, Cowtan K (2010) Features and development of Coot. Acta Crystallogr D Biol Crystallogr 66: 486–501 [DOI] [PMC free article] [PubMed] [Google Scholar]
- Fontana GA, Gahlon HL (2020) Mechanisms of replication and repair in mitochondrial DNA deletion formation. Nucleic Acids Res 48: 11244–11258 [DOI] [PMC free article] [PubMed] [Google Scholar]
- Griffin BD, Bass HW (2018) Review: plant G‐quadruplex (G4) motifs in DNA and RNA; abundant, intriguing sequences of unknown function. Plant Sci 269: 143–147 [DOI] [PubMed] [Google Scholar]
- Heddi B, Cheong VV, Martadinata H, Phan AT (2015) Insights into G‐quadruplex specific recognition by the DEAH‐box helicase RHAU: solution structure of a peptide‐quadruplex complex. Proc Natl Acad Sci USA 112: 9608–9613 [DOI] [PMC free article] [PubMed] [Google Scholar]
- Hossain KA, Jurkowski M, Czub J, Kogut M (2021) Mechanism of recognition of parallel G‐quadruplexes by DEAH/RHAU helicase DHX36 explored by molecular dynamics simulations. Comput Struct Biotechnol J 19: 2526–2536 [DOI] [PMC free article] [PubMed] [Google Scholar]
- Hou XM, Wu WQ, Duan XL, Liu NN, Li HH, Fu J, Dou SX, Li M, Xi XG (2015) Molecular mechanism of G‐quadruplex unwinding helicase: sequential and repetitive unfolding of G‐quadruplex by Pif1 helicase. Biochem J 466: 189–199 [DOI] [PubMed] [Google Scholar]
- Huppert JL, Balasubramanian S (2005) Prevalence of quadruplexes in the human genome. Nucleic Acids Res 33: 2908–2916 [DOI] [PMC free article] [PubMed] [Google Scholar]
- Kabsch W (2010) XDS. Acta Crystallogr D Biol Crystallogr 66: 125–132 [DOI] [PMC free article] [PubMed] [Google Scholar]
- Lee WTC, Yin Y, Morten MJ, Tonzi P, Gwo PP, Odermatt DC, Modesti M, Cantor SB, Gari K, Huang TT et al (2021) Single‐molecule imaging reveals replication fork coupled formation of G‐quadruplex structures hinders local replication stress signaling. Nat Commun 12: 2525 [DOI] [PMC free article] [PubMed] [Google Scholar]
- Lemmens B, van Schendel R, Tijsterman M (2015) Mutagenic consequences of a single G‐quadruplex demonstrate mitotic inheritance of DNA replication fork barriers. Nat Commun 6: 8909 [DOI] [PMC free article] [PubMed] [Google Scholar]
- Levitus M, Waisfisz Q, Godthelp BC, Vries YD, Hussain S, Wiegant WW, Elghalbzouri‐Maghrani E, Steltenpool J, Rooimans MA, Pals G et al (2005) The DNA helicase BRIP1 is defective in Fanconi anemia complementation group. J Nat Genet 37: 934–935 [DOI] [PubMed] [Google Scholar]
- Li J‐H, Lin W‐X, Zhang BO, Nong D‐G, Ju H‐P, Ma J‐B, Xu C‐H, Ye F‐F, Xi XG, Li M et al (2016) Pif1 is a force‐regulated helicase. Nucleic Acids Res 44: 4330–4339 [DOI] [PMC free article] [PubMed] [Google Scholar]
- Li SB, Wang HL, Jehi SA, Li J, Liu S, Wang Z, Truong L, Chiba T, Wang ZF, Wu XH (2021) PIF1 helicase promotes break‐induced replication in mammalian cells. Embo J 40: e104509 [DOI] [PMC free article] [PubMed] [Google Scholar]
- Liu NN, Ji L, Guo Q, Dai YX, Wu WQ, Guo HL, Lu KY, Li XM, Xi XG (2020) Quantitative and real‐time measurement of helicase‐mediated intra‐stranded G4 unfolding in bulk fluorescence stopped‐flow assays. Anal Bioanal Chem 412: 7395–7404 [DOI] [PubMed] [Google Scholar]
- Liu N‐N, Song Z‐Y, Guo H‐L, Yin H, Chen W‐F, Dai Y‐X, Xin B‐G, Ai X, Ji L, Wang Q‐M et al (2021) Endogenous Bos taurus RECQL is predominantly monomeric and more active than oligomers. Cell Rep 36: 109688 [DOI] [PubMed] [Google Scholar]
- Lovelace LL, Minor W, Lebioda L (2005) Structure of human thymidylate synthase under low‐salt conditions. Acta Crystallogr D Biol Crystallogr 61: 622–627 [DOI] [PubMed] [Google Scholar]
- Lu KY, Chen WF, Rety S, Liu NN, Wu WQ, Dai YX, Li D, Ma HY, Dou SX, Xi XG (2018) Insights into the structural and mechanistic basis of multifunctional S‐cerevisiae Pif1p helicase. Nucleic Acids Res 46: 1486–1500 [DOI] [PMC free article] [PubMed] [Google Scholar]
- Lu KY, Xin BG, Zhang T, Liu NN, Li D, Rety S, Xi XG (2021) Structural study of the function of Candida Albicans Pif1. Biochem Biophys Res Commun 567: 190–194 [DOI] [PubMed] [Google Scholar]
- Maizels N, Gray LT (2013) The G4 genome. PLoS Genet 9: e1003468 [DOI] [PMC free article] [PubMed] [Google Scholar]
- McCoy AJ, Grosse‐Kunstleve RW, Adams PD, Winn MD, Storoni LC, Read RJ (2007) Phaser crystallographic software. J Appl Crystallogr 40: 658–674 [DOI] [PMC free article] [PubMed] [Google Scholar]
- Mendoza O, Bourdoncle A, Boulé J‐B, Brosh RM Jr, Mergny J‐L (2016) G‐quadruplexes and helicases. Nucleic Acids Res 44: 1989–2006 [DOI] [PMC free article] [PubMed] [Google Scholar]
- Paeschke K, Burkovics P (2021) Mgs1 function at G‐quadruplex structures during DNA replication. Curr Genet 67: 225–230 [DOI] [PMC free article] [PubMed] [Google Scholar]
- Petoukhov MV, Franke D, Shkumatov AV, Tria G, Kikhney AG, Gajda M, Gorba C, Mertens HD, Konarev PV, Svergun DI (2012) New developments in the ATSAS program package for small‐angle scattering data analysis. J Appl Crystallogr 45: 342–350 [DOI] [PMC free article] [PubMed] [Google Scholar]
- Schierer T, Henderson E (1994) A protein from Tetrahymena thermophila that specifically binds parallel‐stranded G4‐DNA. Biochemistry 33: 2240–2246 [DOI] [PubMed] [Google Scholar]
- Schwindt E, Paeschke K (2018) Mms1 is an assistant for regulating G‐quadruplex DNA structures. Curr Genet 64: 535–540 [DOI] [PMC free article] [PubMed] [Google Scholar]
- Singh DK, Ghosh AK, Croteau DL, Bohr VA (2012) RecQ helicases in DNA double strand break repair and telomere maintenance. Mutat Res 736: 15–24 [DOI] [PMC free article] [PubMed] [Google Scholar]
- Todd AK, Johnston M, Neidle S (2005) Highly prevalent putative quadruplex sequence motifs in human DNA. Nucleic Acids Res 33: 2901–2907 [DOI] [PMC free article] [PubMed] [Google Scholar]
- Traczyk A, Liew CW, Gill DJ, Rhodes D (2020) Structural basis of G‐quadruplex DNA recognition by the yeast telomeric protein Rap1. Nucleic Acids Res 48: 4562–4571 [DOI] [PMC free article] [PubMed] [Google Scholar]
- Varshney D, Spiegel J, Zyner K, Tannahill D, Balasubramanian S (2020) The regulation and functions of DNA and RNA G‐quadruplexes. Nat Rev Mol Cell Biol 21: 459–474 [DOI] [PMC free article] [PubMed] [Google Scholar]
- Voter AF, Qiu Y, Tippana R, Myong S, Keck JL (2018) A guanine‐flipping and sequestration mechanism for G‐quadruplex unwinding by RecQ helicases. Nat Commun 9: 4201 [DOI] [PMC free article] [PubMed] [Google Scholar]
- Wang L, Wang QM, Wang YR, Xi XG, Hou XM (2018) DNA‐unwinding activity of Saccharomyces cerevisiae Pif1 is modulated by thermal stability, folding conformation, and loop lengths of G‐quadruplex DNA. J Biol Chem 293: 18504–18513 [DOI] [PMC free article] [PubMed] [Google Scholar]
- Wu CG, Spies M (2016) G‐quadruplex recognition and remodeling by the FANCJ helicase. Nucleic Acids Res 44: 8742–8753 [DOI] [PMC free article] [PubMed] [Google Scholar]
- Zhang W‐Z, Tang J‐C, Wang S‐S, Wang Z‐J, Qin W‐M, He J‐H (2019) The protein complex crystallography beamline (BL19U1) at the Shanghai Synchrotron Radiation Facility. Nucl Sci Tech 30: 170 [Google Scholar]
- Zhou R, Zhang J, Bochman ML, Zakian VA, Ha T (2014) Periodic DNA patrolling underlies diverse functions of Pif1 on R‐loops and G‐rich DNA. eLife 3: e02190 [DOI] [PMC free article] [PubMed] [Google Scholar]
- Zhou X, Ren W, Bharath SR, Tang X, He Y, Chen C, Liu Z, Li D, Song H (2016) Structural and Functional Insights into the unwinding mechanism of Bacteroides sp Pif1. Cell Rep 14: 2030–2039 [DOI] [PubMed] [Google Scholar]
- Zimmer K, Puccini A, Xiu J, Baca Y, Spizzo G, Lenz H‐J, Battaglin F, Goldberg RM, Grothey A, Shields AF et al (2020) WRN‐mutated colorectal cancer is characterized by a distinct genetic phenotype. Cancers 12: 1319 [DOI] [PMC free article] [PubMed] [Google Scholar]