

Summary
Autoimmune diseases (ADs) are at a significantly higher risk of cancers with unclear mechanism. By searching GWAS catalog database and Medline, susceptible genes for five common ADs, including systemic lupus erythematosus (SLE), rheumatoid arthritis, Sjögren syndrome, systemic sclerosis, and idiopathic inflammatory myopathies, were collected and then were overlapped with cancer driver genes. Single-cell transcriptome analysis was performed in the comparation between SLE and related cancer. We identified 45 carcinogenic autoimmune disease risk (CAD) genes, which were mainly enriched in T cell signaling pathway and B cell signaling pathway. Integrated single-cell analysis revealed immune cell signaling was significantly downregulated in renal cancer compared with SLE, while stemness signature was significantly enriched in both renal cancer or lymphoma and SLE in specific subpopulations. Drugs targeting CAD genes were shared between ADs and cancer. Our study highlights the common and specific features between ADs and related cancers, and sheds light on a new discovery of treatments.
Subject areas: Bioinformatics, Complex system biology, Systems biology, Cancer systems biology
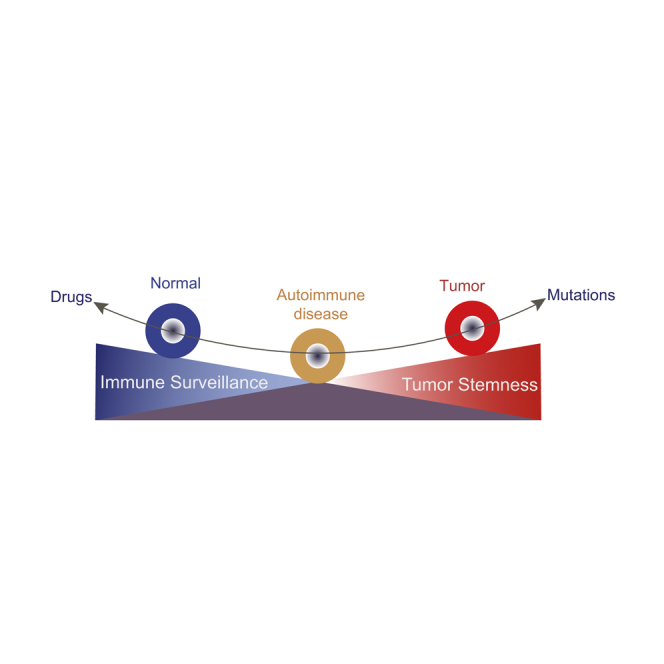
Graphical abstract
Highlights
-
•
Autoimmune diseases (ADs) share risk genes with cancer
-
•
Imbalance of immunosurveillance and cell stemness may cause cancer development in AD
-
•
Targeting carcinogenic AD risk genes have the potential in treatment of both entities
Bioinformatics; Complex system biology; Systems biology; Cancer systems biology
Introduction
Autoimmune diseases (ADs), such as rheumatoid arthritis (RA), systemic lupus erythematosus (SLE), Sjӧgren syndrome (SS), systemic sclerosis (SSc), and idiopathic inflammatory myopathies (IIM), are severe public health threats around the world, affecting 3%–10% of the world population (Thomas et al., 2010; Cross et al., 2014), besides cancer is also one of the major causes of disability and mortality worldwide (Li et al., 2019; Teng et al., 2020). Each of these problems independently represents a major burden on the health-care systems, and their co-occurrence complicates the diagnosis and treatment. ADs and cancers are frequently concomitant in humans, and the epidemiological relationship between ADs and cancers has been well established (Franks and Slansky, 2012; Giat et al., 2017). In general, 1) patients with RA have higher risks of lymphoma, leukemia, lung cancer, and non-melanoma skin cancers; 2) patients with SLE have increased risks of developing hematological malignancies and cancers in female reproductive system, nasopharynx, and kidney; 3) patients with SS have higher risk of lymphoproliferative disorders; 4) patients with SSc have higher rates of concurrent cancers of lung, skin, esophageal, and liver; 5) patients with IIM have higher risks of ovarian, lung, and gastric cancer (Giat et al., 2017; Franks and Slansky, 2012; Hemminki et al., 2017; Bayaert et al., 2013). Notably, certain types of lymphoma tend to be more common in people with systemic ADs, especially when their ADs have high cumulative activity levels. For example, among patients with RA, those with higher disease activity had a 60- to 70-fold increased risk of lymphoma compared to patients with lower disease activity (Mercer et al., 2017; Yadlapati and Efthimiou, 2016). Six cohort studies comprising a total of 6,641 patients with SSc from United States, Australia, Northern Europe, and Taiwan revealed a pooled standardized incidence ratio of 1.41 for cancer (Onishi et al., 2013). However, mechanisms underlying the positive relationship between autoimmunity and related cancers remain unclear.
The GWAS/meta-GWAS and candidate gene studies have successfully identified a considerable list of candidate genes for five ADs including RA, SLE, SS, SSc, and IIM (Okada et al., 2014; Morris et al., 2016; Lessard et al., 2013). Moreover, previous GWAS studies have reported associations between hematologic cancers and various ADs such as RA, multiple sclerosis, and ulcerative colitis (Sud et al., 2017; Okada et al., 2014), raising the possibility of common genetic susceptibility and hence common biological pathways between ADs and related cancers. Furthermore, single-cell profiling techniques have delineated the cellular and molecular landscapes that dominate the tumors in cancer (Young et al., 2018; Gaydosik et al., 2019) and the targeted organs in ADs (Arazi et al., 2019; Der et al., 2019), shedding light on potential pathogenic mechanisms. In this study, by systemically reviewing susceptible genes of the five ADs and driver genes in cancers, we identified 45 carcinogenic autoimmune disease risk (CAD) genes, which likely connect the genetic susceptibility of both specialties. In addition, single-cell transcriptome analyses revealed that defect of immune surveillance and gain of cancer stemness are present in both SLE and related cancers in kidney or skin, highlighting the possible transformation from ADs to some related malignancies.
Results
Characteristics of GWAS variants for the five ADs
Literature searching in the GWAS catalog and Pubmed database yielded 96 unique GWAS studies for the five ADs, of which 63 were derived from the GWAS catalog and 33 were collected from the Pubmed database (Figure 1; Table S1). These previous GWAS reported 1964 lead SNPs (Table S2), of which 1102 unique SNPs (Table S3) were functionally relevant to diseases and associated risk factors confirmed by cis-form expression quantitative trait loci (eQTL) analysis (Lappalainen et al., 2013; Westra et al., 2013; GTEx Consortium, 2015). These SNPs were annotated to 457 unique genes annotated by SNPnexus, including 132 for RA, 265 for SLE, 108 for SS, 71 for SSc, and 20 for IIM (139 genes were duplicates, Table S4). Previous study showed that these ADs shared symptoms, modes of progression, environmental risk factors, and high rates of familial aggregation (Acosta-Herrera et al., 2019). Consistently, we found 76 and 33 susceptible genes were shared by at least two and three ADs, respectively (Figure S1), suggesting genetic pleiotropy in different ADs. For instance, B cell lymphocyte kinase (BLK) gene is shared by five ADs and has an important influence on several ADs by regulating B cell activation (Simpfendorfer et al., 2015). Moreover, BLK is also an oncogene and a potential target for therapy in cutaneous T cell lymphoma (CTCL) (Petersen et al., 2014).
Figure 1.

Discovering procedures of carcinogenic autoimmune disease risk genes
The carcinogenic autoimmune disease risk genes (CAD genes) refer to the genes where five autoimmune diseases (ADs) risk SNPs are located in or nearby overlapped with cancer driver genes. GWAS: genome-wide association studies; SNP: single nucleotide polymorphism; cis-eQTL: cis-expression quantitative trait loci; RA: rheumatoid arthritis; SLE: systemic lupus erythematosus; SS: Sjogren’s syndrome; SSc: systemic sclerosis; IIM: idiopathic inflammatory myopathies.
Functional enrichment of associated loci of ADs on regulatory elements
We performed an enrichment analysis with GARFIELD (Iotchkova et al., 2019) to assess whether the associated variants lie in coding or non-coding regulatory elements of specific cell types. The results showed remarkable enrichment patterns that mainly appeared in blood cells and embryonic stem cells (ES) with 39 significant enrichments (p ≤ 5 × 10⁻², Figure S2). We found the majority of associated variants were enriched in DNase I hypersensitivity site hotspots in blood with a repertoire of cells from the immune system, such as T helper cells (p = 3.19 × 10⁻²), CD56+ NK (p = 2.23 × 10⁻²), CD20+ B (p = 3.19 × 10⁻²), and CD19+ B (p = 3.86 × 10⁻²) primary cells (Table S5). In line with this enrichment, disease-associated SNPs were enriched in transcription start site (TSS, p = 3.51 × 10⁻²) in the B lymphocyte cell line GM12878. Additionally, the highest enrichment was observed in the histone modification H3K27me3 (p = 3.65 × 10⁻²) in the HepG2 cell line, which is from a liver hepatocellular carcinoma. Therefore, our results indicated these associated variants may not only contribute to ADs via T cell or B cell regulations but also involved in human cancers by activating cancer stem cells.
Genetic association between five ADs and cancers
In order to find the genetic association between ADs and cancers, the ADs susceptible genes were compared with cancer driver genes. First, 1,877 candidate cancer driver genes were collected from seven published datasets including 124 genes in 20/20 rule (Vogelstein et al., 2013), 567 genes in CGC database (Tate et al., 2019), 118 genes in CGC-pointMut (Cho et al., 2016), 288 genes in HCD (Tamborero et al., 2013), 797 genes in MouseMut (March et al., 2011; Mann et al., 2012), 688 genes in OnGene (Liu et al., 2017), and 299 genes in CTAT (Bailey et al., 2018) (Table S6). Next, all identified susceptible genes of five ADs were overlapped with cancer driver genes. 45 genes were found to be implicated in driving cancer development (Figure 2A) and we named these genes carcinogenic AD risk (CAD) genes. Third, we employed PancanQTL (Gong et al., 2018) to perform cis-eQTL annotation to confirm if any lead SNP could regulate local gene expression in cancers. We found 41 out of 45 (91.11%) CAD genes harbored at least one cis-eQTL in at least one of 33 cancer types from The Cancer Genome Atlas (TCGA) project (Figure 2B; Table S7). For example, KDM4C, DDX6, NOTCH2, FADS2, PTPN2, and PTTG1 genes have top incidences among the five ADs and 33 TCGA cancer types. Interestingly, the BLK gene is the most common CAD gene shared by five ADs, followed by TNPO3 and NOTCH4 (Figure 2B). Additionally, we found 13 CAD genes shared by at least two ADs while 32 CAD genes occurred specifically in one AD. Functional annotation of CAD genes and specific genetic variants across five ADs were described in Table S8. Furthermore, to identify the enriched biological and molecular pathways of these CAD genes, we employed ClueGO, ToppGene, and g:Profiler to perform functional enrichment analysis. We found that these 45 CAD genes were significantly overrepresented mainly in five biological pathway categories (FDR<0.05): 1) T cell signaling pathway, 2) immune response, 3) metabolism pathway, 4) B cell signaling pathway, and 5) regulation of cytokine pathway (Figure S3; Table S9). In addition, protein-protein network analysis by STRING revealed that 45 CAD genes have significantly more interactions than expected (p = 8.59 × 10⁻⁶), and ERBB2, PTPRC, GRB2, PPARG, and NOTCH2 are network hubs which are widely linked with other CAD genes (Figure S4). Our observations identified overlapping of AD susceptible genes and cancer driver genes, highlighting the potential genetic root of cancer susceptibility in patients with AD.
Figure 2.

Network visualization and overview of the 45 CAD genes shared between the five autoimmune diseases and cancers
(A) In the gene network, nodes indicate mutated genes in ADs and/or cancers; node colors indicate genes specifically belongs to different disease groups; edges indicate genes in the same group or shared by ≥ 2 groups.
(B) Summary of the 45 CAD genes in five ADs and 33 cancer types. Gene score indicates the number of diseases among five ADs and 33 cancer types from The Cancer Genome Atlas involving a specific mutated gene based on cis-eQTL analyses. Filled red boxes indicate the AD having the risk genes, and filled green boxes indicate the cancer type carrying the mutated genes.
Immune cell signaling is likely depressed in renal cancer compared with SLE
Given that ADs and cancers shared susceptible genes and biological pathways, we investigated the expression levels of those genes in cells from both sides. Patients with SLE usually have kidney involvement and have a high risk of renal cancer. Thus, we integrated and analyzed single-cell transcriptomes of 3,707 SLE renal cells and 16,103 renal cancer cells to compare the cell identities based on expression signatures. We observed large numbers of identical cells shared between SLE and renal cancer (Figure 3A). These 19,810 renal cells were clustered into 22 cell clusters (Figure 3B) by Seurat v3 and the proportions of some cell subtypes were different although the proportions of most cell subtypes were comparable between SLE and renal cancer (Figure 3C). For example, the proportions of NK cells (cluster 2 and cluster 11), plasma cells (cluster 21), and B cells (cluster 12) were lower while the proportion of macrophages was higher in renal cancer compared to SLE (Figure 3C; Table S10).
Figure 3.

Immune cell signaling was downregulated in renal cancer compared to SLE revealed by integrated single-cell analysis
(A) Integrated UMAP visualization of 19,810 renal cells from SLE (n = 3,707 cells) and renal cancer (n = 16,103 cells). Each dot represents a single cell. Cells from different samples are color-coded (SLE: pink, renal cancer: cyan).
(B) UMAP visualization of integrated projection of SLE and renal cancer cells that were assigned to 22 clusters and color-coded based on the clusters.
(C) Percentages of cells from each cluster (color-coded based on the clusters showed in (B) in SLE and renal cancer.
(D and E) Dotplots showing the scaled expression level of 45 CAD genes within each cluster of integrated (D) or split (E) dataset of SLE and renal cancer, the size of each circle reflects the percentage of cells in a cluster where the gene is detected, and the color intensity reflects the average expression level within each cluster (E). Renal cancer and SLE were indicated in cyan and red color, respectively (E).
(F and G) Enrichment of immune cell signaling gene signature in each renal cell split by samples of SLE and renal cancer was illustrated by UMAP plots (F) and violin plots (G). The violin represents the probability density at each value. Expression levels are color-coded: gray, not expressed; blue, expressed, SLE: pink violins, and renal cancer: cyan violins.
Expressions of 45 CAD genes varied in 22 cell clusters of renal cells, in which PTPRC, GRB2, and REL gene were highly expressed (Figure 3D). Interestingly, PTPRC and GRB2 genes were downregulated while REL gene (a proto-oncogene) was upregulated in renal cancer compared with SLE (Figure 3E). Both PTPRC (encodes CD45) and GRB2 are required for immune cell maturation and signaling (Vang et al., 2008; Jang et al., 2010). Then, four immune cell signaling-related CAD genes including PTPRC, SH2B3, TCF7, and GRB2 were examined in SLE and renal cancer. Their expression was all depressed in renal cancer compared with SLE (Figure S5). Taken together, immune cell signaling signature represented by the four CAD genes was depressed in renal cancer compared with SLE (Figures 3F and 3G).
Enrichment analysis of cancer-related signatures in renal cells of SLE and renal cancer
To understand the origin of oncogenesis, enrichment analysis of cancer gene signatures (Table S11) was performed. We found stemness associated genes were highly expressed in cells of cluster 5, 10, 15, and 19 and displayed more significantly in renal cancer (Figures 4A–4E). Similar features were observed in 3,600 cells randomly selected from both SLE and renal cancer (Figure S6). Next, we took cluster 5 as an example to perform GSEA validation analysis since cluster 5 has the most significant enrichment of stemness signature and simultaneously has comparable cell number between SLE and renal cancer. Stemness-related genes were significantly upregulated in cluster 5 of SLE renal cells (Figures 4F and 4G, NES = 1.47, p = 2.50 × 10⁻³) and in cluster 5 of renal cancer cells (Figures 4H and 4I, NES = 1.48, p = 0) compared with normal renal cells from healthy donors. Six stemness-related genes including NFIB, EMX2, NFIA, TFDP2, SOX9, and MET were consistently upregulated in both SLE and renal cancer compared with normal controls (Figures 4G and 4I). We speculated that cells in cluster 5 were cancer stem cells, which were rare immortal cells within a tumor that can both self-renew by dividing and give rise to different tumor cell types.
Figure 4.

Integrated single-cell transcriptome analysis discovering cells with stemness in SLE and renal cancer
(A) Heatmap indicating the Z-scores of 12 cancer-related gene signatures, including Stemness, Glycine metabolism, Hypoxia, Glycolysis, Metastasis, Angiogenesis, Invasion, EMT, Proliferation, DNA repair, DNA damage, Cell Cycle.
(B and C) Enrichment of the stemness gene signature in each renal cell (n = 16,103 cells). Single-cell average expression levels of stemness-related genes were illustrated in the UMAP plots (B) and violin plots (C). Gray, not expressed; blue, expressed. The violin represents the probability density at each value. Stemness signature genes were significantly enriched in cluster 5, 10, 15, and 19, highlighted in black circles (B) and violins (C).
(D and E) Enrichment of the stemness gene signature in each renal cell split by samples of SLE and renal cancer were illustrated by violin plots (D) and UMAP plots (E).
(F and H) GSEA illustrating the enrichment of stemness gene signature in cluster five of SLE renal cells (n = 379 cells) versus normal renal cells (n = 379 cells) from healthy donor (p=0.0025) (F) or in cluster 5 of renal cancer cells (n = 688 cells) versus adjacent normal renal cells (n = 572 cells) from the same three individual patients (p<0.001) (H). Normalized enrichment scores and nominal p values are indicated by Kolmogorov-Smirnov test.
(G and I) Heatmap indicating significant upregulated stemness-related genes in cluster 5 of SLE renal cells compared with normal renal cells from healthy donor (G) or in cluster 5 of renal cancer cells compared with adjacent normal renal cells from the same three individual patients (I), orange and blue bar indicated cells from SLE (or renal cancer) and normal renal cells, respectively. Red highlighted the genes enriched in both (G) and (I).
(J) Joint visualization of scRNA-seq data of 19,810 renal cells from SLE (n = 3,707 cells) and renal cancer (n = 16,103 cells) determined by Monocle v3, color-coded by sample type of origin (SLE: cyan, renal cancer: pink).
(K) UMAP visualization of renal cells with renal tumor identity (black circle highlighted renal cells from SLE with tumor identity, ccRCC: clear cell renal cell carcinoma, wilms tumor: Wilms tumor, wilms.fibro: Wilms’ tumor and fibroblasts, pRCC: papillary renal cell carcinoma) annotated by Monocle v3 with the top five most specific tumor cell marker genes of the original paper, color-coded by cell type.
(L) The trajectories of renal cells state transition in a two-dimensional state-space determined by Monocle v3. Black lines show the structure of the trajectories, and black circles highlight the trajectories of both SLE and renal cancer cells. Each dot represents a single cell, color-coded by cell type.
(M) Highlighted pseudotime visualization of a trajectory in l (on the left), color-coded by pseudotime. Brackets with numbers indicate branch nodes, where cells can transform to several outcomes. Color represents origin of cells: cyan (SLE), pink (renal cancer).
Apart from stemness signature, glycine/serine/threonine metabolism signature was also enriched in both SLE and renal cancer in cells of cluster 5 and 6 while it was obviously higher in SLE in cells of cluster 5 compared with renal cancer (Figures 4A and S7A). Consistently, amino acid metabolism could affect T cell activation, differentiation, and function in both systemic lupus erythematosus (Kono et al., 2021) and cancers (Pan et al., 2021). Whereas, other tumorigenic signatures including angiogenesis and hypoxia, glycolysis, and metastasis were enriched in renal cancer cells of cluster either 5, 6, 10, 15, or 19 but not in SLE cells (Figures 4A and S7B–S7E). In addition, cancer metastasis signatures including invasion and epithelial-mesenchymal transition (EMT) were enriched in renal cancer cells of cluster either 16, 18, 19, or 20 but not in SLE cells (Figures S7F and S7G). Interestingly, other cancer hallmark signatures including proliferation, DNA repair, DNA damage, and cell cycle were enriched in both renal cancer and SLE cells of cluster 17 and 20 which are proliferating T cells and macrophages, respectively (Figures S7H–S7K). Our observations suggested SLE renal cells shared oncogenic expression signatures with renal cancer cells while renal cancer cells harbored cancer-specific hallmark signatures compared with SLE renal cells.
Furthermore, cell type classification based on the top five most specific tumor marker genes (Table S12) revealed that some renal cells from SLE had similar expression characteristics to renal tumor by using the function of Garnett in Monocle v3 (Cao et al., 2019) (Figures 4J and 4K). Interestingly, single-cell trajectory analysis of renal cells state transition in a two-dimensional state-space demonstrated a continuum of intermediate states spanning SLE and renal cancers (Figures 4L and 4M). On the other hand, profiles of aneuploid copy number were delineated in both SLE and renal cancer cells (Figures S8A and S8B). 1,372 aneuploid and 1,898 diploid cells were identified in SLE renal cells while 6,306 aneuploid and 6,024 diploid cells were observed in renal cancer cells (Table S13). Consistently, some SLE renal cells had similar characteristics of aneuploid copy number profiles to renal tumor cells although most of aneuploid cells in SLE seemed to be benign (Figures S8C–S8F).
Expression signatures in skin cells of SLE and T cell lymphoma
To confirm what we have observed in renal cells from SLE and renal cancer, we performed single-cell transcriptome analysis of skin cells in SLE and cutaneous T cell lymphoma (CTCL). Briefly, we integrated and analyzed single-cell transcriptomes of 2,272 SLE skin cells and 10,938 CTCL skin cells to compare the cell identities and expression signatures. Large numbers of identical cells were shared between SLE and CTCL since they were derived from the same tissue (Figure 5A). These 13,210 skin cells were clustered into 17 cell types (Figures 5B and 5C) by Seurat v3 and stemness signatures were enriched in skin cells of cluster 9 and 10 (Figure 5D). Consistently, stemness signatures were enriched more significantly in CTCL cancer cells compared with SLE skin cells (Figures 5E–5G). Similar features were observed in randomly selected 2,200 cells from both SLE and CTCL (Figure S9). In addition, stemness-related genes were significantly upregulated in skin cells of cluster 9 and 10 (Figure 5H, NES = 1.50, p = 4.00 × 10⁻³) and CTCL cancer cells (Figure 5I, NES = 1.47, p = 2.95 × 10⁻²) compared with normal skin cells from healthy donors. Similarly, single-cell trajectory analysis of skin cells state transition showed SLE skin cells were located at earlier transcription states than CTCL tumor cells along the trajectory ordered in pseudotime (Figure 5J). Therefore, single-cell transcriptome analysis of skin cells in SLE and T cell lymphoma also illustrated the potential trajectories in which SLE cells may transform cell fates to tumor cells by reinforcing cell stemness.
Figure 5.

Integrated single-cell datasets analysis confirming cells with stemness in SLE and T cell lymphoma
(A) Integrated UMAP visualization of 13,210 skin cells from SLE (n = 2,272 cells) and lymphoma (n = 10,938 cells) determined by Seurat v3. Each dot represents a single cell. Cell origins are color-coded (SLE: cyan, lymphoma: pink).
(B and C) UMAP visualization of integrated projection of SLE and lymphoma was assigned to 17 clusters and color-coded based on the clusters (B) and split by SLE and lymphoma (C).
(D–G) Enrichment of the stemness signature in each skin cell, determined by multiple feature analysis of Seurat v3. Single-cell average expression levels of stemness-related genes were illustrated in the UMAP plot (D, E) and violin plot (E, G). Expression levels are color-coded: gray, not expressed; blue, expressed. Each dot corresponds to one individual cell. Stemness signature genes were significantly enriched in cluster 9 and 10, highlighted by black circles (D). The violin represents the probability density at each value. (E, G) Enrichment of the stemness signature in each skin cell split by SLE and lymphoma were illustrated by UMAP plots (E) and violin plots (G). Stemness signature genes were significantly enriched in cluster 9 and 10 of SLE and turn more significant in lymphoma, highlighted in cyan and pink circle, respectively.
(H and I) GSEA illustrating the enrichment of stemness signature in cluster 9 and 10 of SLE skin cells (n = 149 cells) versus normal skin cells (n = 224 cells) from three healthy control subjects (p=0.004) (H) or in cluster 9 and 10 of lymphoma skin cells (n = 977 cells) versus normal skin cells (n = 977 cells) from four healthy control skin samples (p=0.0295) (I). Normalized enrichment scores and nominal p values are indicated by Kolmogorov-Smirnov test.
(J) The trajectories of skin cells state transition in a two-dimensional state-space determined by Monocle v3. Black lines show the structure of the trajectories. Each dot represents a single cell color-coded by pseudotime. Bracket with numbers indicate branch nodes, where cells can transform to several outcomes. Origin of cells was color-coded: cyan (SLE), pink (lymphoma).
Drug enrichment analysis of CAD genes
Bioinformatic prediction based on genetic or expression features potentially improves the success rates in repurposing existing therapeutic drugs (Li et al., 2021; Wang et al., 2021). A drug enrichment analysis for the 45 CAD genes was performed on the DGIdb platform (Freshour et al., 2021). We identified 266 drugs for GRB2, BLK, CDKN1B, PPARG, FADS2, KDM4C, PADI2, NOTCH2/4, PTPRC, ERBB2, CDK12, and SH2B3 at any stages of development (Tables S14 and S15). Some of the enriched drugs such as methotrexate (MTX) and azathioprine (AZA) have been reported to be used in both cancer and AD therapy, indicating potential shared therapy for ADs and cancers. To study how they affect gene transcription of ADs and cancers, we performed a series of GSEA analyses. In this analysis, MTX and AZA have shown extensive effect on important signaling pathways involved in the pathogenesis of ADs (RA, SLE, and SS) and cancers such as prostate cancer, leukemia, breast cancer, and small-cell lung cancer (Figures 6A and 6B, Tables S16, and S17). Signaling pathways related to 45 CAD genes were also significantly regulated by these two drugs (Figures 6A and 6B). MTX, as one of the most common conventional disease-modifying antirheumatic drugs (DMARDs), repressed upregulated genes of RA, SS, and SLE, as well as activity-related genes of RA, SS, and SLE (Figures 6C and S10A). Meanwhile, MTX also reversed the upregulation of genes involved in pathways in several cancer types including colorectal cancer, small-cell lung cancer, and prostate cancer (Figures 6D and S10A).
Figure 6.

Gene set enrichment analysis of shared drugs between autoimmune diseases and cancer
(A–H) GSEA of expression profile of methotrexate (A) and azathioprine (B) show that both methotrexate and azathioprine have extensive effects on gene signatures of ADs and cancer, dark gray dot: pathway with normalized enrich score higher than 1 or lower than −1, highlighted colored dot: pathways overlapped with 45 CAD genes associated pathways, light gray dot: pathway with normalized enrich score lower than 1 or higher than −1; (C) methotrexate significantly downregulates activity-related genes of RA, SS, and SLE (p < 0.001), as well as gene signatures of RA (p < 0.001), SS (p < 0.001), SLE (p = 0.31); (D) methotrexate significantly downregulates pathways in cancer gene signatures in colorectal cancer, small-cell lung cancer, prostate cancer (p < 0.001); (E) pazopanib downregulates gene signatures of RA and SLE (p < 0.001); (F) tofacitinib downregulates gene signatures of non-melanoma skin cancer and basal cell carcinoma (p < 0.001); (G and H) pioglitazone downregulates gene signatures of some ADs (such as RA and SS) (p < 0.05) (G), and cancer (such as carcinoma and endometrial cancer) (p < 0.05) (H). NES: normalized enrichment score.
Next, some CAD-targeting drugs known for treating cancer, ADs, or other diseases were analyzed for the therapeutic potential for ADs or cancer, respectively. Pazopanib, a potent receptor tyrosine kinase inhibitor, has been used for therapy of cancer such as sarcoma and renal cell carcinoma. Intriguingly, our results showed that it also repressed upregulated genes of RA and SLE, indicating their possible role in treating some ADs (Figures 6E and S10B). Tofacitinib is an inhibitor of Janus kinase (JAK) 1 and 3 and has recently been used to treat RA, psoriatic arthritis, and ulcerative colitis. We found that it also reversed gene signatures of some cancers including non-melanoma skin cancer, basal cell carcinoma, and acute myeloid leukemia (Figures 6F and S10C), and exhibit cytotoxicity on a basal cell carcinoma cell line TE354.T (Figure S11). An antidiabetes drug, pioglitazone, is an agonist for the nuclear receptor peroxisome proliferator-activated receptor gamma (PPAR-γ). It modulates genes involved in the control of glucose and lipid metabolism of cells, which are also dysregulated in ADs and cancers (Figures 4 and S7). Our GSEA results showed that pioglitazone could reverse upregulated genes in both ADs such as RA and SS and related cancers (Figures 6G, 6H, and S10D), predicting its potential as a novel drug for the treatment of both ADs and carcinomas. Both pazopanib and pioglitazone reduce viability of RA fibroblast-like synoviocytes, which is one of the important effector cells in RA inflammatory sites (Figure S11). Our results pointed to mechanisms underlying shared treatments between ADs and cancers and shed light on the discovery of new chemotherapy for ADs and cancers.
Discussion
In this study, we systematically evaluated candidate pleiotropic genes and associated biological pathways that are likely shared between ADs and malignancies. We identified 45 CAD genes implicated in both ADs and cancers. These genes belong to interrelated signaling pathways important in both ADs and carcinogenesis such as T cell signaling pathway, immune response, metabolism pathway, B cell signaling pathway, and regulation of cytokine pathway. Integrated single-cell transcriptome analysis revealed immune cell signaling was downregulated in cancer compared to SLE, whereas, stemness gene signature was enriched in specific cell types in SLE and enriched more significantly in such cells from renal cancer or CTCL when compared with that in normal tissues. By investigating the gene variants, cells with stemness, as well as drugs shared between ADs and cancer, we linked ADs with certain malignancies. Our study is the first GWAS-based enrichment and single-cell analysis aiming to improve the knowledge of the genetic resemblances between ADs and cancer as well as shared risk genes among five ADs.
Pathway analysis on CAD genes highlights some immune-related pathways, some of which also play important roles in cancer development. T cell signaling pathway is one of the main categories that may underlie the link between ADs and malignancies. It is widely known that altered survival of T cells and defects in the inhibitory signaling pathways of T cells can contribute to autoimmunity (Ohashi, 2002). Alteration of T cell signaling associated with survival, such as the PI-3K pathway, is sufficient to promote autoimmunity. B cell signaling pathway is crucial for normal B cell development and adaptive immunity (Melchers, 2015). BCR signaling also supports the survival and growth of malignant B cells in patients with B cell leukemia or lymphomas. In addition, other signaling pathways such as NOTCH signaling pathway and virus infection pathway were also significantly enriched (FDR <0.05) among these 45 CAD genes. Most of these biological and molecular pathways were related to both ADs (Okada et al., 2014) and human cancers (Vogelstein et al., 2013). For example, NOTCH signaling pathway has been known to control cell-fate determination in nearly every tissue and organ by influencing differentiation, proliferation, or apoptotic events, and dysregulated NOTCH signaling is implicated in ADs and various malignancies (Guruharsha et al., 2012; Kuksin and Minter, 2015).
Immune surveillance was depressed in renal cancer compared with SLE, indicated by the decrease of the number of NK cells and B cells as well as immune cell signaling indicated by some CAD genes. If cells with driver mutations and driver genes were not eliminated immediately by the immune system, those cancerous and/or precancerous cells would develop into tumors (Wang et al., 2020, 2021). Moreover, in specific cell types, stemness signature was enriched in both SLE cells and renal cancer cells or CTCL cells rather than normal control cells (Figures 4 and 5). Cells with increased stemness may be more prone to transform into cancer stem cells under the influence of some environmental factors or cytotoxic drugs. Therefore, gain of cancer stemness and defect of immune surveillance may be the underlying mechanisms of the high risk for some cancers in patients with ADs. In the comparison between SLE and renal cancer, we identified some renal cell clusters with high stemness signals except renal cortex cells (cluster 5) were only found in renal cancer but not in SLE. Whether those cells were derived from tumor development or due to sampling difference require further study.
Patients with ADs have immune dysregulation, and usually have to receive immunosuppressive medications, which can inhibit tumor immune surveillance. DMARDs, suppressing immune responses in patients with ADs, could presumably raise the possibility of an increased risk of malignancies. However, there is a debate on whether ADs treatments cause cancer. For instance, a large cohort study has shown that MTX can increase the risk of non-melanoma skin cancer (Scott et al., 2016; Ridker et al., 2019) while other studies claimed that there is no certain evidence to confirm the oncogenicity of MTX (Salliot and van der Heijde, 2009; Beauparlant et al., 1999). Moreover, most randomized controlled trials meta-analysis of biologic treatment for RA including anti-TNF and other biologic agents do not show significant differences in the incidence of cancer including lymphoma between biologics and control treatments (Lopez-Olivo et al., 2012; Bongartz et al., 2009; Leombruno et al., 2009). However, the follow-up time is relatively short as cancer may be more likely to be noticed at late periods. At this point, immunosuppressive treatment is not established as the dominant reason why autoimmunity can raise the risk of some cancers, especially since some DMARDs may be used as antitumor drugs.
But it is worth noting that chronic inflammation is a hallmark of autoimmunity and inflammatory mediators can act upon local tissues to increase cell proliferation, mutagenesis, oncogene activation, and angiogenesis, which is consistent with our results showed in Figure 4A and may result in tumor initiation and development. It is easy to understand why many clinic chemotherapy drugs are shared between ADs and cancer. MTX and AZA are two widely used drugs for standard therapy of both ADs and cancer. Our GSEA analysis revealed shared treatment outcome between ADs and cancers by two well-known shared drugs (MTX and AZA), and showed the potential of an antitumor drug (pazopanib), an antirheumatic drug (tofacitinib), and a novel antidiabetic drug (pioglitazone) for treatments of ADs, cancers, and both, respectively. Moreover, we confirmed the potential of an antitumor drug pazopanib and antidiabetic drug pioglitazone to inhibit RA fibroblast-like synoviocytes and found an antirheumatic drug tofacitinib could significantly suppress the growth of a basal cell carcinoma cell line TE354.T. The present study revealed a likely mechanism underlying epidemiological relationship and shared treatments between ADs and cancers. Our findings shed light on the new discovery of chemotherapy for both ADs and cancers.
Limitations of the study
One important limitation in this study is that only five out of over a hundred of ADs were included in the analysis, although the five ADs represent important systemic immune-mediated disease with high cancer risk to some extends. Secondly, overlapping of susceptible genes of ADs and cancer driver genes were performed to study the genetic association. However, we cannot exclude that some genes were differentially mutated and functioned in the two entities. Thirdly, dynamic sampling of cancer development in patients with history of ADs was very difficult. For this reason, we had to rely on the integrated analysis of data from separate studies.
STAR★Methods
Key resources table
Resource availability
Lead contact
Further information and requests for resources and reagents should be directed to and will be fulfilled by the lead contact, Fengbiao Mao (maofengbiao@126.com).
Materials availability
This study did not generate new unique reagents.
Experimental model and subject details
The study was approved by the ethics committees and institutional review board of West China Hospital, Sichuan University. We obtained fibroblast-like synoviocytes (FLS) from 3 synovial tissues obtained at arthroplasty or synovectomy from RA patients who received the diagnosis according to the American college of Rheumatology 2010 classification criteria for RA. TE354.T cell line was purchased from ATCC (CRL-7762).
Method details
Collection of SNPs of autoimmune diseases and cancer driver genes
A systemic search of susceptible genes for five ADs (RA, SLE, SS, SSc, and IIM) was carried out on the NHGRI-EBI GWAS catalogue database (https://www.ebi.ac.uk/gwas/home) (Buniello et al., 2019). A literature search for published GWAS or meta-GWAS papers on PubMed between Jan 1, 2000 and May 1, 2019 was conducted in the field of the five ADs using inclusion criteria: 1) discovered risk loci or SNP of five ADs including RA, SLE, SS, SSc, and IIM; 2) GWAS or meta-analysis of GWAS with odds ratio (OR) and P-value. Related data were extracted as a supplement to the curated datasets from NHGRI-EBI GWAS catalogue database. All genome-wide significant SNPs (p < 5 × 10⁻⁸) and suggestive significant SNPs (5 × 10⁻⁸≤p < 1 × 10⁻⁵) were collected, including leading SNPs, first author and year, PubMed ID, journal, discovery and replication sample sizes. A candidate gene was considered as an AD susceptible gene if 1) at least one of the lead SNPs is located within or nearby the gene; and 2) it is functionally relevant to influence at least one of the AD susceptible genes as proved by expression quantitative trait loci (eQTL) analysis. Cancer driver genes were curated from studies of 20/20 rule (Vogelstein et al., 2013), CGC database (Tate et al., 2019), CGCpointMut (Cho et al., 2016), HCD (Tamborero et al., 2013), MouseMut (March et al., 2011, Mann et al., 2012), ONGene (Liu et al., 2017), and CTAT (Bailey et al., 2018). The duplicates of cancer driver genes were removed.
Regulatory features of SNPs and overlapping genes
A non-parametric enrichment analysis was performed for associated variants by implementing GARFIELD (Iotchkova et al., 2019). The overlaps between each AD and cancer or among five ADs were analyzed and visualized using a Venn diagram created by a web tool (http://bioinformatics.psb.ugent.be/webtools/Venn/).
Biological pathway enrichment and network analysis
The potential pleiotropic genes were further used to identify the most enriched canonical pathways using Cytoscape plugin ClueGO (http://apps.cytoscape.org/apps/cluego) (Bindea et al., 2009), ToppGene (Chen et al., 2009) (https://toppgene.cchmc.org/), and g:Profiler (Raudvere et al., 2019) (https://biit.cs.ut.ee/gprofiler/) platforms. Network visualization was constructed by Cytoscape v3.6.1 (Shannon et al., 2003). In details, all the 45 potential pleiotropic genes were used as input for these softwares. Cytoscape, ToppGene and g:Profiler were used to compare the proportion of input genes mapping to a biological pathway with the reference genes in the ingenuity databases. The significance of the overrepresented canonical pathways was determined using the hypergeometric test followed by adjustment by multiple testing using the Benjamini-Hochberg (B&H) method. Significant levels were determined at B&H adjusted p-value < 0.05. STRING v10 (https://string-db.org/) (Szklarczyk et al., 2015) was used to construct a protein-protein interaction network.
Expression regulation analysis and gene annotation
Expression quantitative trait loci (eQTLs) analysis was employed to identify the functional lead SNPs and regulated genes using three public databases: Lappalainen et al (Lappalainen et al., 2013), Westra et al (Westra et al., 2013), and GTEx (GTEx Consortium, 2015). Then, SNPs were annotated to local genes based on GRCh37/hg19 using the web tool SNPnexus (https://snp-nexus.org/) (Dayem Ullah et al., 2018), which provides information of overlapping or neighboring up/down-stream genes.
scRNA-seq datasets collection
Two integrated single cell analysis were performed in this study. In order to ensure it was comparable between SLE and cancer datasets, we integrated datasets from the same tissue to make sure each paired sample had similar cell types. Renal tissues from SLE (Arazi et al., 2019) and renal cancer (Young et al., 2018) were used for the first integrated single cell analysis. In kidney integration, the scRNA-seq dataset of renal tissue from 24 patients with lupus nephritis (LN) was downloaded from the ImmPort repository with the study number of SDY997 and the experiment number of EXP15176 (Arazi et al., 2019). In details, 3,707 renal cells were extracted with the sample ID started with “K” from the UMI counts matrix file. The scRNA-seq dataset of renal cancer was downloaded from the supplemental information of the study (Young et al., 2018) with three files (matrix.mtx, genes.tsv, barcodes.tsv). In details, 16,103 renal cancer cells were extracted from five renal cancer patients with the sample ID labeled as “RCC” (clear cell renal cell carcinoma, n = 4) and “PapRCC” (papillary renal cell carcinoma, n = 1). Skin tissues from SLE (Arazi et al., 2019) and cutaneous T-cell lymphoma (CTCL) (Gaydosik et al., 2019) were used as the validation in the second integrated single-cell analysis. In skin integration, the scRNA-seq dataset for SLE was obtained from 17 skin tissues collected from 17 patients with LN, and was downloaded from ImmPort repository with the study number of SDY997 and experiment number of EXP15077 (Arazi et al., 2019). In details, the read counts of 2,272 skin cells were extracted from expression matrix files with the sample ID containing the character of “Skin” and were used by followed analysis. The scRNA-seq dataset of skin tissues from three advanced-stage CTCL skin tumors was downloaded from the GEO database with the accession number of GSE128531 (Gaydosik et al., 2019). In details, the raw read counts of 10,938 skin cells were extracted from expression matrix files.
scRNA-seq data integration
Single cell transcriptome datasets were read and further integrated using Seurat v3.0.2 (Stuart et al., 2019). Briefly, Seurat Object of each dataset was generated by the Seurat function of “CreateSeuratObject”. Cells that expressed less than 500 genes were considered outliers and discarded. Raw unique molecular identifier counts were normalized to unique molecular identifier count per million total counts and log-transformed with the Seurat function of “NormalizedData”. In total 2,000 most variable genes were identified based on average expression and dispersion with the selection method of "vst" by the Seurat function of “FindVariableFeatures”. FindIntegrationAnchors function was then used to find correspondences across the different studied datasets (ie. SLE dataset 1 and renal cancer, SLE dataset 2 and lymphoma) with the parameters of dimensionality = 1:20. IntegrateData function was used to generate the integrated Seurat Object with the result output from the FindIntegrationAnchors. Next, the standard workflow from Seurat was used to scale the integrated data, to find the relevant components with PCA (npcs = 30) and to visualize the results with UMAP (reduction = "pca", dims = 1:20). Marker genes were identified by the Seurat function FindAllMarkers. Cell type of each cluster was then annotated with those marker genes by using Enrichr (Kuleshov et al., 2016). Scaled expression data of these marker genes was used for creating dotplots. Normalized data was shown in feature plots or violin plots.
Feature plots and violin plots of multiple genes
In order to create feature plots and violin plots for multiple genes, the average normalized expression of those genes was used to profile stemness gene signature for renal cells and skin cells, T cell signaling gene signature for renal cells. Stemness geneset containing 166 genes was collected from the database CancerSEA (Yuan et al., 2019). Score of stemness signature was obtained from the average expression level of stemness geneset by using the “apply” function of R. T cell signaling gene signature expression score was obtained from the average expression level of gene PTPRC, SH2B3, TCF7 and GRB2 by using the “apply” function of R. Next, standard FeaturePlot and VlnPlot function of Seurat was used to generate the feature plots or violin plots by replacing the original single gene with geneset signature score.
Gene set enrichment analysis for stemness signature
First, four paired scRNA-seq datasets were served as the input datasets: 1) renal cells from cluster 5 of SLE (n = 379 cells) versus normal renal cells (n = 379 cells) from healthy donors in the same study (Arazi et al., 2019), 2) renal cells in cluster 5 of renal cancer (n = 688 cells) versus adjacent normal renal cells (n = 572 cells) from the three corresponding individual patients in the same study (Young et al., 2018), 3) skin cells in cluster 9 and 10 of SLE (n = 149 cells) versus normal skin cells (n = 224 cells) from healthy donors in the same study (Der et al., 2019), 4) skin cells in cluster 5 of lymphoma (n = 977 cells) versus normal skin cells (n = 977 cells) from three healthy control subjects in the same study (Gaydosik et al., 2019). Renal cells from SLE and renal cancer, as well as skin cells from SLE and lymphoma were extracted from the UMI counts matrix files of each dataset, as described in “Datasets collection” part, with the cluster ID of each cell defined by Seurat, as described in “scRNA-seq data integration” part. Normal paired renal cells (SLE and renal cancer) and normal paired skin cells (SLE and lymphoma) were extracted from paired UMI counts matrix file of each dataset with the cell barcode information described in their corresponding supplementary meta files (Arazi et al., 2019; Young et al., 2018; Der et al., 2019; Gaydosik et al., 2019). Second, the stemness geneset that contains 166 genes obtained from the database of CancerSEA (Yuan et al., 2019) was used as input geneset. Third, the enrichment analysis of stemness signature was performed in four paired samples using the GSEA (gene set enrichment analysis) v3.0 software (Subramanian et al., 2005). Finally, the Enrichment score (ES) and nominal p value were applied to sort each dataset after gene set permutations was performed 1000 times for the analysis.
Trajectory analysis and cell classification
Trajectory modelling and pseudo temporal ordering of cells were performed with the Monocle v3 R package (Cao et al., 2019) by following the standard pipeline on its official website (https://cole-trapnell-lab.github.io/monocle3). Briefly, to further verify the potential relationships between SLE and cancer, integrated objects with 2000 most highly variable genes of renal cells for renal cancer and SLE as well as skin cells for lymphoma and SLE were input into Monocle v3 to predict developmental trajectory. Firstly, reduce dimension was performed with the monocle function “reduce_dimension”. Next, cells were grouped into clusters with the function of “cluster_cells”. Then, in order to learn the trajectory graph, a principal graph within each partition was fitted by using the learn graph function with the clustered cells. Finally, we order the cells according to their progress through the developmental program that measured by pseudotime in Monocle v3. In order to place the cells in order, the “beginning” of the biological process was also needed to be set by choosing the regions of the graph that marked as "roots" (here, we randomly assigned a cell from SLE: TCTGGAAGTGTAAGTA as the root) of the trajectory. In addition, sub-types identity of renal tumor into clear cell renal cell carcinoma, Wilms’ tumor and papillary renal cell carcinoma was predicted and annotated by the function of Garnett in Monocle v3 based on the top five most specific tumor cell marker genes from the original paper (Young et al., 2018). Aneuploid copy number profiles of SLE renal cells and renal cancer cells were delineated by using CopyKat (Gao et al., 2021) with default parameters.
Drug search and drug activity evaluated by gene set enrichment analysis
Drug-targeting CAD genes were summarized by querying the DGIdb (http://www.dgidb.org) platform (Freshour et al., 2021). Efficacy of drugs shared between ADs and cancers including methotrexate and azathioprine were performed with GSEA (Subramanian et al., 2005). GSEA of an anti-tumor drug pazopanib and a targeted synthetic disease-modifying antirheumatic drug (DMARD) tofacitinib were explored in ADs and cancers, respectively. Pioglitazone, a peroxisome proliferator-activated receptor gamma (PPARγ) agonist that was used for diabetes, was analyzed in both ADs and cancers to find its novel utility with GSEA. Input expression matrix include: RNA expression microarray data from chondrocytes or RA synovial fibroblasts stimulated with 1) methotrexate and 2) azathioprine (GEO: GSE12860); 3) RNA expression microarray data from HLCs treated with pazopanib or DMSO for 24 h (GEO: GSE75888); 4) RNA expression microarray data of whole skin from C57/B6 mice female treated with tofacitinib or vehicle control for 4 days (GEO: GSE69300); 5) RNA expression microarray data of rat bladder after dosed orally with Pioglitazone or vehicle (GEO: GSE68592). Genesets include: 1) activity-related genes for RA, SS and SLE were obtained from a previous study (Banchereau et al., 2017), 2) differentially expressed genes obtained in SS cohorts (Emamian et al., 2009), 3) up-regulated genes in SLE compared to healthy controls were obtained from a previous study (Mackay et al., 2016), 4) RA related genes were obtained from a previous study (He et al., 2016), 5) rest of the gene sets for ADs and cancers, as well as different functional pathways were obtained from databases of GWAS Catalog, dbGaP, GO Biological Process, KEGG, Reactome, WikiPathways, and BioCarta. Then, the GSEA analysis of these five-paired samples was performed using the GSEA v3.0 software. Finally, the Enrichment score (ES) and nominal p value were applied to sort each dataset after gene set permutations was performed 1000 times for the analysis. Gene symbols of mouse and rat were converted to the symbols of homologous genes of human by using Ensembl BioMart tool.
Cell proliferation assay
The effects of tofacitinib, pazopanib, and pioglitazone on the proliferation of TE354.T (a basal cell carcinoma cell line) and fibroblast-like synoviocytes (FLS) were analyzed using the cell counting kit (CCK)-8 proliferation assay according to the manufacturer’s protocols (Biosharp, China). In brief, cells were plated onto 96-well plates at the density of 1×10⁴ cells/well in DMSO supplemented with 10% FBS. When they reached 30% confluence, cells were washed with PBS and fresh media supplemented with compounds of different concentration were added into each well. Following 48h incubation, CCK-8 solution was added to each plate. After 1-3h incubation, the absorbance was measured at 450 nm using a microplate reader. Each experiment was repeated for 3 times independently.
Quantification and statistical analysis
Two-tailed unpaired student’s t-test were used for comparisons of two groups. Kolmogorov-Smirnov test was used for calculation of the norminal p values in gene set enrichment analysis (GSEA). The hypergeometric test followed by adjustment by multiple testing using the Benjamini-Hochberg (B&H) method was used to determine the significance of the overrepresented canonical pathways. The level of significance was set at ∗P < 0.05, ∗∗P < 0.01, ∗∗∗P < 0.001. All data visualization and statistical analyses were carried out using inhouse R script and Graphpad Prism v7.0 Software.
Acknowledgments
The project was funded by Clinical Medicine Plus X - Young Scholars Project, Peking University, the Fundamental Research Funds for the Central Universities [PKU2022LCXQ043], Research start-up funding, Peking University Third Hospital (BYSYYZD2021001), National Natural Science Foundation of China (No. 82104484, 32170656) and the Post-Doctor Research Project, West China Hospital, Sichuan University (2021HXBH014).
Author contributions
F.M., C.L., S.L., and L.S. conceived the study, participated in the design of analyses and the interpretation of results. S.L., C.L., Y.Z., and Y.L. drafted the manuscript. S.L., F.M., and C.L. developed computational scripts employed in the analyses. X.Z., D. F., K.L., and L.X. provided professional guidance in the writing and refining of the manuscript. Y.L., Y.Z., and X.K. participated in the interpretation of results and the oversight of analyses.
Declaration of interests
The authors declare no competing interests.
Published: July 15, 2022
Footnotes
Supplemental information can be found online at https://doi.org/10.1016/j.isci.2022.104631.
Contributor Information
Lichao Sun, Email: sunlichao@cicams.ac.cn.
Yi Liu, Email: yi2006liu@163.com.
Fengbiao Mao, Email: maofengbiao@126.com.
Supplemental information
Data and code availability
-
•
The SNPs information were collected from NHGRI-EBI GWAS catalogue database (https://www.ebi.ac.uk/gwas/home) and PubMed. All the single cell transcriptome datasets used in this study are available in GEO (https://www.ncbi.nlm.nih.gov/geo/). Accession numbers and DOIs are listed in the key resources table.
-
•
All codes used in this study followed the manuals of each R package. Accession numbers are listed in the key resources table.
-
•
Any additional information required to reanalyze the data reported in this paper is available from the lead contact upon request.
References
- Acosta-Herrera M., Kerick M., González-Serna D., Myositis Genetics Consortium. Scleroderma Genetics Consortium. Wijmenga C., Franke A., Gregersen P.K., Padyukov L., Worthington J., et al. Genome-wide meta-analysis reveals shared new loci in systemic seropositive rheumatic diseases. Ann. Rheum. Dis. 2019;78:311–319. doi: 10.1136/annrheumdis-2018-214127. [DOI] [PMC free article] [PubMed] [Google Scholar]
- Arazi A., Rao D.A., Berthier C.C., Davidson A., Liu Y., Hoover P.J., Chicoine A., Eisenhaure T.M., Jonsson A.H., Li S., et al. The immune cell landscape in kidneys of patients with lupus nephritis. Nat. Immunol. 2019;20:902–914. doi: 10.1038/s41590-019-0398-x. [DOI] [PMC free article] [PubMed] [Google Scholar]
- Bailey M.H., Tokheim C., Porta-Pardo E., Sengupta S., Bertrand D., Weerasinghe A., Colaprico A., Wendl M.C., Kim J., Reardon B., et al. Comprehensive characterization of cancer driver genes and mutations. Cell. 2018;173:371–385.e18. doi: 10.1016/j.cell.2018.02.060. [DOI] [PMC free article] [PubMed] [Google Scholar]
- Banchereau R., Cepika A.M., Banchereau J., Pascual V. Understanding human autoimmunity and autoinflammation through transcriptomics. Annu. Rev. Immunol. 2017;35:337–370. doi: 10.1146/annurev-immunol-051116-052225. [DOI] [PMC free article] [PubMed] [Google Scholar]
- Bayaert R., Beaugerie L., Van Assche G. Cancer risk in immune-mediated inflammatory diseases (IMID) Mol. Cancer. 2013;12 doi: 10.1186/1476-4598-12-98. [DOI] [PMC free article] [PubMed] [Google Scholar]
- Beauparlant P., Papp K., Haraoui B. The incidence of cancer associated with the treatment of rheumatoid arthritis. Semin. Arthritis Rheum. 1999;29:148–158. doi: 10.1016/s0049-0172(99)80026-2. [DOI] [PubMed] [Google Scholar]
- Bindea G., Mlecnik B., Hackl H., Charoentong P., Tosolini M., Kirilovsky A., Fridman W.H., Pagès F., Trajanoski Z., Galon J. Cluego: a Cytoscape plug-in to decipher functionally grouped gene ontology and pathway annotation networks. Bioinformatics. 2009;25:1091–1093. doi: 10.1093/bioinformatics/btp101. [DOI] [PMC free article] [PubMed] [Google Scholar]
- Bongartz T., Warren F., Mines D., Matteson E., Abrams K., Sutton A. Etanercept therapy in rheumatoid arthritis and the risk of malignancies: a systematic review and individual patient data meta-analysis of randomised controlled trials. Ann. Rheum. Dis. 2009;68:1177–1183. doi: 10.1136/ard.2008.094904. [DOI] [PubMed] [Google Scholar]
- Buniello A., Macarthur J., Cerezo M., Harris L., Hayhurst J., Malangone C., Mcmahon A., Morales J., Mountjoy E. The NHGRI-EBI GWAS catalog of published genome-wide association studies, targeted arrays and summary statistics 2019. Nucleic Acids Res. 2019;47:D1005–D1012. doi: 10.1093/nar/gky1120. [DOI] [PMC free article] [PubMed] [Google Scholar]
- Cao J., Spielmann M., Qiu X., Huang X., Ibrahim D.M., Hill A.J., Zhang F., Mundlos S., Christiansen L., Steemers F.J., et al. The single-cell transcriptional landscape of mammalian organogenesis. Nature. 2019;566:496–502. doi: 10.1038/s41586-019-0969-x. [DOI] [PMC free article] [PubMed] [Google Scholar]
- Chen J., Bardes E.E., Aronow B.J., Jegga A.G. Toppgene suite for gene list enrichment analysis and candidate gene prioritization. Nucleic Acids Res. 2009;37:W305–W311. doi: 10.1093/nar/gkp427. [DOI] [PMC free article] [PubMed] [Google Scholar]
- Cho A., Shim J., Kim E., Supek F., Lehner B., Lee I. Muffinn: cancer gene discovery via network analysis of somatic mutation data. Genome Biol. 2016;17:129. doi: 10.1186/s13059-016-0989-x. [DOI] [PMC free article] [PubMed] [Google Scholar]
- Cross M., Smith E., Hoy D., Carmona L., Wolfe F., Vos T., Williams B., Gabriel S., Lassere M., Johns N. The global burden of rheumatoid arthritis: estimates from the global burden of disease 2010 study. Ann. Rheum. Dis. 2014;73:1316–1322. doi: 10.1136/annrheumdis-2013-204627. [DOI] [PubMed] [Google Scholar]
- Dayem Ullah A., Oscanoa J., Wang J., Nagano A., Lemoine N., Chelala C. Snpnexus: assessing the functional relevance of genetic variation to facilitate the promise of precision medicine. Nucleic Acids Res. 2018;46:W109–W113. doi: 10.1093/nar/gky399. [DOI] [PMC free article] [PubMed] [Google Scholar]
- Der E., Suryawanshi H., Morozov P., Kustagi M., Goilav B., Ranabothu S., Izmirly P., Clancy R., Belmont H.M., Koenigsberg M., et al. tubular cell and keratinocyte single-cell transcriptomics applied to lupus nephritis reveal type I Ifn and fibrosis relevant pathways. Nat. Immunol. 2019;20:915–927. doi: 10.1038/s41590-019-0386-1. [DOI] [PMC free article] [PubMed] [Google Scholar]
- Emamian E.S., Leon J.M., Lessard C.J., Grandits M., Baechler E.C., Gaffney P.M., Segal B., Rhodus N.L., Moser K.L. Peripheral blood gene expression profiling in Sjögren’s syndrome. Genes Immun. 2009;10:285–296. doi: 10.1038/gene.2009.20. [DOI] [PMC free article] [PubMed] [Google Scholar]
- Franks A., Slansky J. Multiple associations between A broad spectrum of autoimmune diseases, chronic inflammatory diseases and cancer. Anticancer Res. 2012;32:1119–1136. [PMC free article] [PubMed] [Google Scholar]
- Freshour S.L., Kiwala S., Cotto K.C., Coffman A.C., Mcmichael J.F., Song J.J., Griffith M., Griffith O., Wagner A.H. Integration of the drug-gene interaction database (DGIdb 4.0) with open crowdsource efforts. Nucleic Acids Res. 2021;49:D1144–D1151. doi: 10.1093/nar/gkaa1084. [DOI] [PMC free article] [PubMed] [Google Scholar]
- Gao R., Bai S., Henderson Y.C., Lin Y., Schalck A., Yan Y., Kumar T., Hu M., Sei E., Davis A., et al. Delineating copy number and clonal substructure in human tumors from single-cell transcriptomes. Nat. Biotechnol. 2021;39:599–608. doi: 10.1038/s41587-020-00795-2. [DOI] [PMC free article] [PubMed] [Google Scholar]
- Gaydosik A.M., Tabib T., Geskin L.J., Bayan C.A., Conway J.F., Lafyatis R., Fuschiotti P. Single-cell lymphocyte heterogeneity in advanced cutaneous T-cell lymphoma skin tumors. Clin. Cancer Res. 2019;25:4443–4454. doi: 10.1158/1078-0432.CCR-19-0148. [DOI] [PMC free article] [PubMed] [Google Scholar]
- Giat E., Ehrenfeld M., Shoenfeld Y. Cancer and autoimmune diseases. Autoimmun. Rev. 2017;16:1049–1057. doi: 10.1016/j.autrev.2017.07.022. [DOI] [PubMed] [Google Scholar]
- Gong J., Mei S., Liu C., Xiang Y., Ye Y., Zhang Z., Feng J., Liu R., Diao L., Guo A.Y., et al. Pancanqtl: systematic identification of cis-eqtls and trans-eqtls in 33 cancer types. Nucleic Acids Res. 2018;46:D971–D976. doi: 10.1093/nar/gkx861. [DOI] [PMC free article] [PubMed] [Google Scholar]
- GTEx Consortium Human genomics. The genotype-tissue expression (GTEx) pilot analysis: multitissue gene regulation in humans. Science. 2015;348:648–660. doi: 10.1126/science.1262110. [DOI] [PMC free article] [PubMed] [Google Scholar]
- Guruharsha K.G., Kankel M.W., Artavanis-Tsakonas S. The notch signalling system: recent insights into the complexity of A conserved pathway. Nat. Rev. Genet. 2012;13:654–666. doi: 10.1038/nrg3272. [DOI] [PMC free article] [PubMed] [Google Scholar]
- He P., Zhang Z., Liao W., Xu D., Fu M., Kang Y. Screening of gene signatures for rheumatoid arthritis and osteoarthritis based on bioinformatics analysis. Mol. Med. Rep. 2016;14:1587–1593. doi: 10.3892/mmr.2016.5423. [DOI] [PMC free article] [PubMed] [Google Scholar]
- Hemminki K., Forsti A., Sundquist K., Sundquist J., Li X. Familial associations of lymphoma and myeloma with autoimmune diseases. Blood Cancer J. 2017;7:E515. doi: 10.1038/bcj.2016.123. [DOI] [PMC free article] [PubMed] [Google Scholar]
- Iotchkova V., Ritchie G.R.S., Geihs M., Morganella S., Min J.L., Walter K., Timpson N.J., Dunham I., Birney E., Soranzo N., Consortium U.K. Garfield classifies disease-relevant genomic features through integration of functional annotations with association signals. Nat. Genet. 2019;51:343–353. doi: 10.1038/s41588-018-0322-6. [DOI] [PMC free article] [PubMed] [Google Scholar]
- Jang I.K., Zhang J., Chiang Y.J., Kole H.K., Cronshaw D.G., Zou Y., Gu H. Grb2 functions at the top of the T-cell antigen receptor-induced tyrosine kinase cascade to control thymic selection. Proc. Natl. Acad. Sci. USA. 2010;107:10620–10625. doi: 10.1073/pnas.0905039107. [DOI] [PMC free article] [PubMed] [Google Scholar]
- Kono M., Yoshida N., Tsokos G.C. Amino acid metabolism in lupus. Front. Immunol. 2021;12:623844. doi: 10.3389/fimmu.2021.623844. [DOI] [PMC free article] [PubMed] [Google Scholar]
- Kuksin C.A., Minter L.M. The link between autoimmunity and lymphoma: does notch signaling play A contributing role? Front. Oncol. 2015;5:51. doi: 10.3389/fonc.2015.00051. [DOI] [PMC free article] [PubMed] [Google Scholar]
- Kuleshov M.V., Jones M.R., Rouillard A.D., Fernandez N.F., Duan Q., Wang Z., Koplev S., Jenkins S.L., Jagodnik K.M., Lachmann A., et al. Enrichr: a comprehensive gene set enrichment analysis web server 2016 update. Nucleic Acids Res. 2016;44:W90–W97. doi: 10.1093/nar/gkw377. [DOI] [PMC free article] [PubMed] [Google Scholar]
- Lappalainen T., Sammeth M., Friedländer M., 'T Hoen P., Monlong J., Rivas M., Gonzàlez-Porta M. Transcriptome and genome sequencing uncovers functional variation in humans. Nature. 2013;501:506–511. doi: 10.1038/nature12531. [DOI] [PMC free article] [PubMed] [Google Scholar]
- Leombruno J., Einarson T., Keystone E. The safety of anti-tumour necrosis factor treatments in rheumatoid arthritis: meta and exposure-adjusted pooled analyses of serious adverse events. Ann. Rheum. Dis. 2009;68:1136–1145. doi: 10.1136/ard.2008.091025. [DOI] [PubMed] [Google Scholar]
- Lessard C.J., Li H., Adrianto I., Ice J.A., Rasmussen A., Grundahl K.M., Kelly J.A., Dozmorov M.G., Miceli-Richard C., Bowman S., et al. Variants at multiple loci implicated in both innate and adaptive immune responses are associated with Sjogren's syndrome. Nat. Genet. 2013;45:1284–1292. doi: 10.1038/ng.2792. [DOI] [PMC free article] [PubMed] [Google Scholar]
- Li G., Ruan S., Zhao X., Liu Q., Dou Y., Mao F. Transcriptomic signatures and repurposing drugs for covid-19 patients: findings of bioinformatics analyses. Comput. Struct. Biotechnol. J. 2021;19:1–15. doi: 10.1016/j.csbj.2020.11.056. [DOI] [PMC free article] [PubMed] [Google Scholar]
- Li X., Shi L., Wang Y., Zhong J., Zhao X., Teng H., Shi X., Yang H., Ruan S., Li M., et al. Oncobase: a platform for decoding regulatory somatic mutations in human cancers. Nucleic Acids Res. 2019;47:D1044–D1055. doi: 10.1093/nar/gky1139. [DOI] [PMC free article] [PubMed] [Google Scholar]
- Liu Y., Sun J., Zhao M. Ongene: a literature-based database for human oncogenes. J. Genet. Genomics. 2017;44:119–121. doi: 10.1016/j.jgg.2016.12.004. [DOI] [PubMed] [Google Scholar]
- Lopez-Olivo M., Tayar J., Martinez-Lopez J., Pollono E., Cueto J., Gonzales-Crespo M., Fulton S., Suarez-Almazor M. Risk of malignancies in patients with rheumatoid arthritis treated with biologic therapy: a meta-analysis. JAMA. 2012;308:898–908. doi: 10.1001/2012.jama.10857. [DOI] [PubMed] [Google Scholar]
- Mackay M., Oswald M., Sanchez-Guerrero J., Lichauco J., Aranow C., Kotkin S., Korsunsky I., Gregersen P.K., Diamond B. Molecular signatures in systemic lupus erythematosus: distinction between disease flare and infection. Lupus Sci. Med. 2016;3:E000159. doi: 10.1136/lupus-2016-000159. [DOI] [PMC free article] [PubMed] [Google Scholar]
- Mann K.M., Ward J.M., Yew C.C., Kovochich A., Dawson D.W., Black M.A., Brett B.T., Sheetz T.E., Dupuy A.J., Initiative A.P.C.G. Sleeping beauty mutagenesis reveals cooperating mutations and pathways in pancreatic adenocarcinoma. Proc. Natl. Acad. Sci. USA. 2012;109:5934–5941. doi: 10.1073/pnas.1202490109. [DOI] [PMC free article] [PubMed] [Google Scholar]
- March H.N., Rust A.G., Wright N.A., Ten Hoeve J., De Ridder J., Eldridge M., Van Der Weyden L., Berns A., Gadiot J., Uren A., et al. Insertional mutagenesis identifies multiple networks of cooperating genes driving intestinal tumorigenesis. Nat. Genet. 2011;43:1202–1209. doi: 10.1038/ng.990. [DOI] [PMC free article] [PubMed] [Google Scholar]
- Melchers F. Checkpoints that control B cell development. J. Clin. Invest. 2015;125:2203–2210. doi: 10.1172/JCI78083. [DOI] [PMC free article] [PubMed] [Google Scholar]
- Mercer L.K., Galloway J.B., Lunt M., Davies R., Low A.L., Dixon W.G., Watson K.D., Consortium B.C.C., Symmons D.P., Hyrich K.L. Risk of lymphoma in patients exposed to antitumour necrosis factor therapy: results from the British society for Rheumatology biologics register for rheumatoid arthritis. Ann. Rheum. Dis. 2017;76:497–503. doi: 10.1136/annrheumdis-2016-209389. [DOI] [PMC free article] [PubMed] [Google Scholar]
- Morris D.L., Sheng Y., Zhang Y., Wang Y.F., Zhu Z., Tombleson P., Chen L., Cunninghame Graham D.S., Bentham J., Roberts A.L., et al. Genome-wide association meta-analysis in Chinese and European individuals identifies ten new loci associated with systemic lupus erythematosus. Nat. Genet. 2016;48:940–946. doi: 10.1038/ng.3603. [DOI] [PMC free article] [PubMed] [Google Scholar]
- Ohashi P.S. T-cell signalling and autoimmunity: molecular mechanisms of disease. Nat. Rev. Immunol. 2002;2:427–438. doi: 10.1038/nri822. [DOI] [PubMed] [Google Scholar]
- Okada Y., Wu D., Trynka G., Raj T., Terao C., Ikari K., Kochi Y., Ohmura K., Suzuki A., Yoshida S., et al. Genetics of rheumatoid arthritis contributes to biology and drug discovery. Nature. 2014;506:376–381. doi: 10.1038/nature12873. [DOI] [PMC free article] [PubMed] [Google Scholar]
- Onishi A., Sugiyama D., Kumagai S., Morinobu A. Cancer incidence in systemic sclerosis: meta-analysis of population-based cohort studies. Arthritis Rheum. 2013;65:1913–1921. doi: 10.1002/art.37969. [DOI] [PubMed] [Google Scholar]
- Pan S., Fan M., Liu Z., Li X., Wang H. Serine, Glycine and onecarbon metabolism in cancer (review) Int. J. Oncol. 2021;58:158–170. doi: 10.3892/ijo.2020.5158. [DOI] [PMC free article] [PubMed] [Google Scholar]
- Petersen D.L., Krejsgaard T., Berthelsen J., Fredholm S., Willerslev-Olsen A., Sibbesen N.A., Bonefeld C.M., Andersen M.H., Francavilla C., Olsen J.V., et al. Open B-lymphoid tyrosine kinase (Blk) is an oncogene and A potential target for therapy with dasatinib in cutaneous T-cell lymphoma (CTCL) Leukemia. 2014;28:2109–2112. doi: 10.1038/leu.2014.192. [DOI] [PMC free article] [PubMed] [Google Scholar]
- Raudvere U., Kolberg L., Kuzmin I., Arak T., Adler P., Peterson H., Vilo J. G:Profiler: a web server for functional enrichment analysis and conversions of gene lists (2019 update) Nucleic Acids Res. 2019;47:W191–W198. doi: 10.1093/nar/gkz369. [DOI] [PMC free article] [PubMed] [Google Scholar]
- Ridker P.M., Everett B.M., Pradhan A., Macfadyen J.G., Solomon D.H., Zaharris E., Mam V., Hasan A., Rosenberg Y., Iturriaga E., et al. Low-dose methotrexate for the prevention of atherosclerotic events. N. Engl. J. Med. 2019;380:752–762. doi: 10.1056/NEJMoa1809798. [DOI] [PMC free article] [PubMed] [Google Scholar]
- Salliot C., van der Heijde D. Long-term safety of methotrexate monotherapy in patients with rheumatoid arthritis: a systematic literature Research. Ann. Rheum. Dis. 2009;68:1100–1104. doi: 10.1136/ard.2008.093690. [DOI] [PMC free article] [PubMed] [Google Scholar]
- Scott F., Mamtani R., Brensinger C., Haynes K., Chiesa-Fuxench Z., Zhang J., Chen L. Risk of nonmelanoma skin cancer associated with the use of immunosuppressant and biologic agents in patients with A history of autoimmune disease and nonmelanoma skin cancer. Jama Dermatol. 2016;152:164–172. doi: 10.1001/jamadermatol.2015.3029. [DOI] [PMC free article] [PubMed] [Google Scholar]
- Shannon P., Markiel A., Ozier O., Baliga N.S., Wang J.T., Ramage D., Amin N., Schwikowski B., Ideker T. Cytoscape: a software environment for integrated models of biomolecular interaction networks. Genome Res. 2003;13:2498–2504. doi: 10.1101/gr.1239303. [DOI] [PMC free article] [PubMed] [Google Scholar]
- Simpfendorfer K.R., Armstead B.E., Shih A., Li W., Curran M., Manjarrez-Orduño N., Lee A.T., Diamond B., Gregersen P.K. Autoimmune disease-associated haplotypes of Blk exhibit lowered thresholds for B cell activation and expansion of Ig class-switched B cells. Arthritis Rheumatol. 2015;67:2866–2876. doi: 10.1002/art.39301. [DOI] [PubMed] [Google Scholar]
- Stuart T., Butler A., Hoffman P., Hafemeister C., Papalexi E., Mauck W.M., 3rd, Hao Y., Stoeckius M., Smibert P., Satija R. Comprehensive integration of single-cell data. Cell. 2019;177:1888–1902.e21. doi: 10.1016/j.cell.2019.05.031. [DOI] [PMC free article] [PubMed] [Google Scholar]
- Subramanian A., Tamayo P., Mootha V.K., Mukherjee S., Ebert B.L., Gillette M.A., Paulovich A., Pomeroy S.L., Golub T.R., Lander E.S., Mesirov J.P. Gene set enrichment analysis: a knowledge-based approach for interpreting genome-wide expression profiles. Proc. Natl. Acad. Sci. USA. 2005;102:15545–15550. doi: 10.1073/pnas.0506580102. [DOI] [PMC free article] [PubMed] [Google Scholar]
- Sud A., Thomsen H., Law P.J., Forsti A., Da Silva M.I., Holroyd A., Broderick P., Orlando G., Lenive O., Wright L., et al. Genome-wide association study of classical hodgkin lymphoma identifies key regulators of disease susceptibility. Nat. Commun. 2017;8 doi: 10.1038/s41467-017-00320-1. [DOI] [PMC free article] [PubMed] [Google Scholar]
- Szklarczyk D., Franceschini A., Wyder S., Forslund K., Heller D., Huerta-Cepas J., Simonovic M., Roth A., Santos A., Tsafou K.P., et al. String V10: protein-protein interaction networks, integrated over the tree of life. Nucleic Acids Res. 2015;43:D447–D452. doi: 10.1093/nar/gku1003. [DOI] [PMC free article] [PubMed] [Google Scholar]
- Tamborero D., Gonzalez-Perez A., Perez-Llamas C., Deu-Pons J., Kandoth C., Reimand J., Lawrence M., Getz G., Bader G., Ding L., Lopez-Bigas N. Comprehensive identification of mutational cancer driver genes across 12 tumor types. Sci. Rep. 2013;3:2650. doi: 10.1038/srep02650. [DOI] [PMC free article] [PubMed] [Google Scholar]
- Tate J., Bamford S., Jubb H., Sondka Z., Beare D., Bindal N., Boutselakis H. Cosmic: the catalogue of somatic mutations in cancer. Nucleic Acids Res. 2019;47:D941–D947. doi: 10.1093/nar/gky1015. [DOI] [PMC free article] [PubMed] [Google Scholar]
- Teng H., Wei W., Li Q., Xue M., Shi X., Li X., Mao F., Sun Z. Prevalence and architecture of posttranscriptionally impaired synonymous mutations in 8,320 genomes across 22 cancer types. Nucleic Acids Res. 2020;48:1192–1205. doi: 10.1093/nar/gkaa019. [DOI] [PMC free article] [PubMed] [Google Scholar]
- Thomas S., Griffiths C., Smeeth L., Rooney C., Hall A. Burden of mortality associated with autoimmune diseases among females in the United Kingdom. Am. J. Public Health. 2010;100:2279–2287. doi: 10.2105/AJPH.2009.180273. [DOI] [PMC free article] [PubMed] [Google Scholar]
- Vang T., Miletic A.V., Arimura Y., Tautz L., Rickert R.C., Mustelin T. Protein tyrosine phosphatases in autoimmunity. Annu. Rev. Immunol. 2008;26:29–55. doi: 10.1146/annurev.immunol.26.021607.090418. [DOI] [PubMed] [Google Scholar]
- Vogelstein B., Papadopoulos N., Velculescu V., Zhou S., Diaz La J., Kinzler K. Cancer genome landscapes. Science. 2013;339:1546–1558. doi: 10.1126/science.1235122. [DOI] [PMC free article] [PubMed] [Google Scholar]
- Wang H., Wang T., Zhao X., Wu H., You M., Sun Z., Mao F. Ai-driver: an ensemble method for identifying driver mutations in personal cancer genomes. NAR Genom. Bioinform. 2020;2:Lqaa084. doi: 10.1093/nargab/lqaa084. [DOI] [PMC free article] [PubMed] [Google Scholar]
- Wang T., Ruan S., Zhao X., Shi X., Teng H., Zhong J., You M., Xia K., Sun Z., Mao F. Oncovar: an integrated database and analysis platform for oncogenic driver variants in cancers. Nucleic Acids Res. 2021;49:D1289–D1301. doi: 10.1093/nar/gkaa1033. [DOI] [PMC free article] [PubMed] [Google Scholar]
- Westra H., Peters M., Esko T., Yaghootkar H., Schurmann C., Kettunen J., Christiansen M. Systematic identification of trans eQTLs as putative drivers of known disease associations. Nat. Genet. 2013;45:1238–1243. doi: 10.1038/ng.2756. [DOI] [PMC free article] [PubMed] [Google Scholar]
- Yadlapati S., Efthimiou P. Autoimmune/inflammatory arthritis associated lymphomas: who is at risk? BioMed Res. Int. 2016;2016:8631061. doi: 10.1155/2016/8631061. [DOI] [PMC free article] [PubMed] [Google Scholar]
- Young M.D., Mitchell T.J., Vieira Braga F.A., Tran M.G.B., Stewart B.J., Ferdinand J.R., Collord G., Botting R.A., Popescu D.M., Loudon K.W., et al. Single-cell transcriptomes from human kidneys reveal the cellular identity of renal tumors. Science. 2018;361:594–599. doi: 10.1126/science.aat1699. [DOI] [PMC free article] [PubMed] [Google Scholar]
- Yuan H., Yan M., Zhang G., Liu W., Deng C., Liao G., Xu L., Luo T., Yan H., Long Z., et al. CancerSEA: a cancer single-cell state atlas. Nucleic Acids Res. 2019;47:D900–D908. doi: 10.1093/nar/gky939. [DOI] [PMC free article] [PubMed] [Google Scholar]
Associated Data
This section collects any data citations, data availability statements, or supplementary materials included in this article.
Supplementary Materials
Data Availability Statement
-
•
The SNPs information were collected from NHGRI-EBI GWAS catalogue database (https://www.ebi.ac.uk/gwas/home) and PubMed. All the single cell transcriptome datasets used in this study are available in GEO (https://www.ncbi.nlm.nih.gov/geo/). Accession numbers and DOIs are listed in the key resources table.
-
•
All codes used in this study followed the manuals of each R package. Accession numbers are listed in the key resources table.
-
•
Any additional information required to reanalyze the data reported in this paper is available from the lead contact upon request.