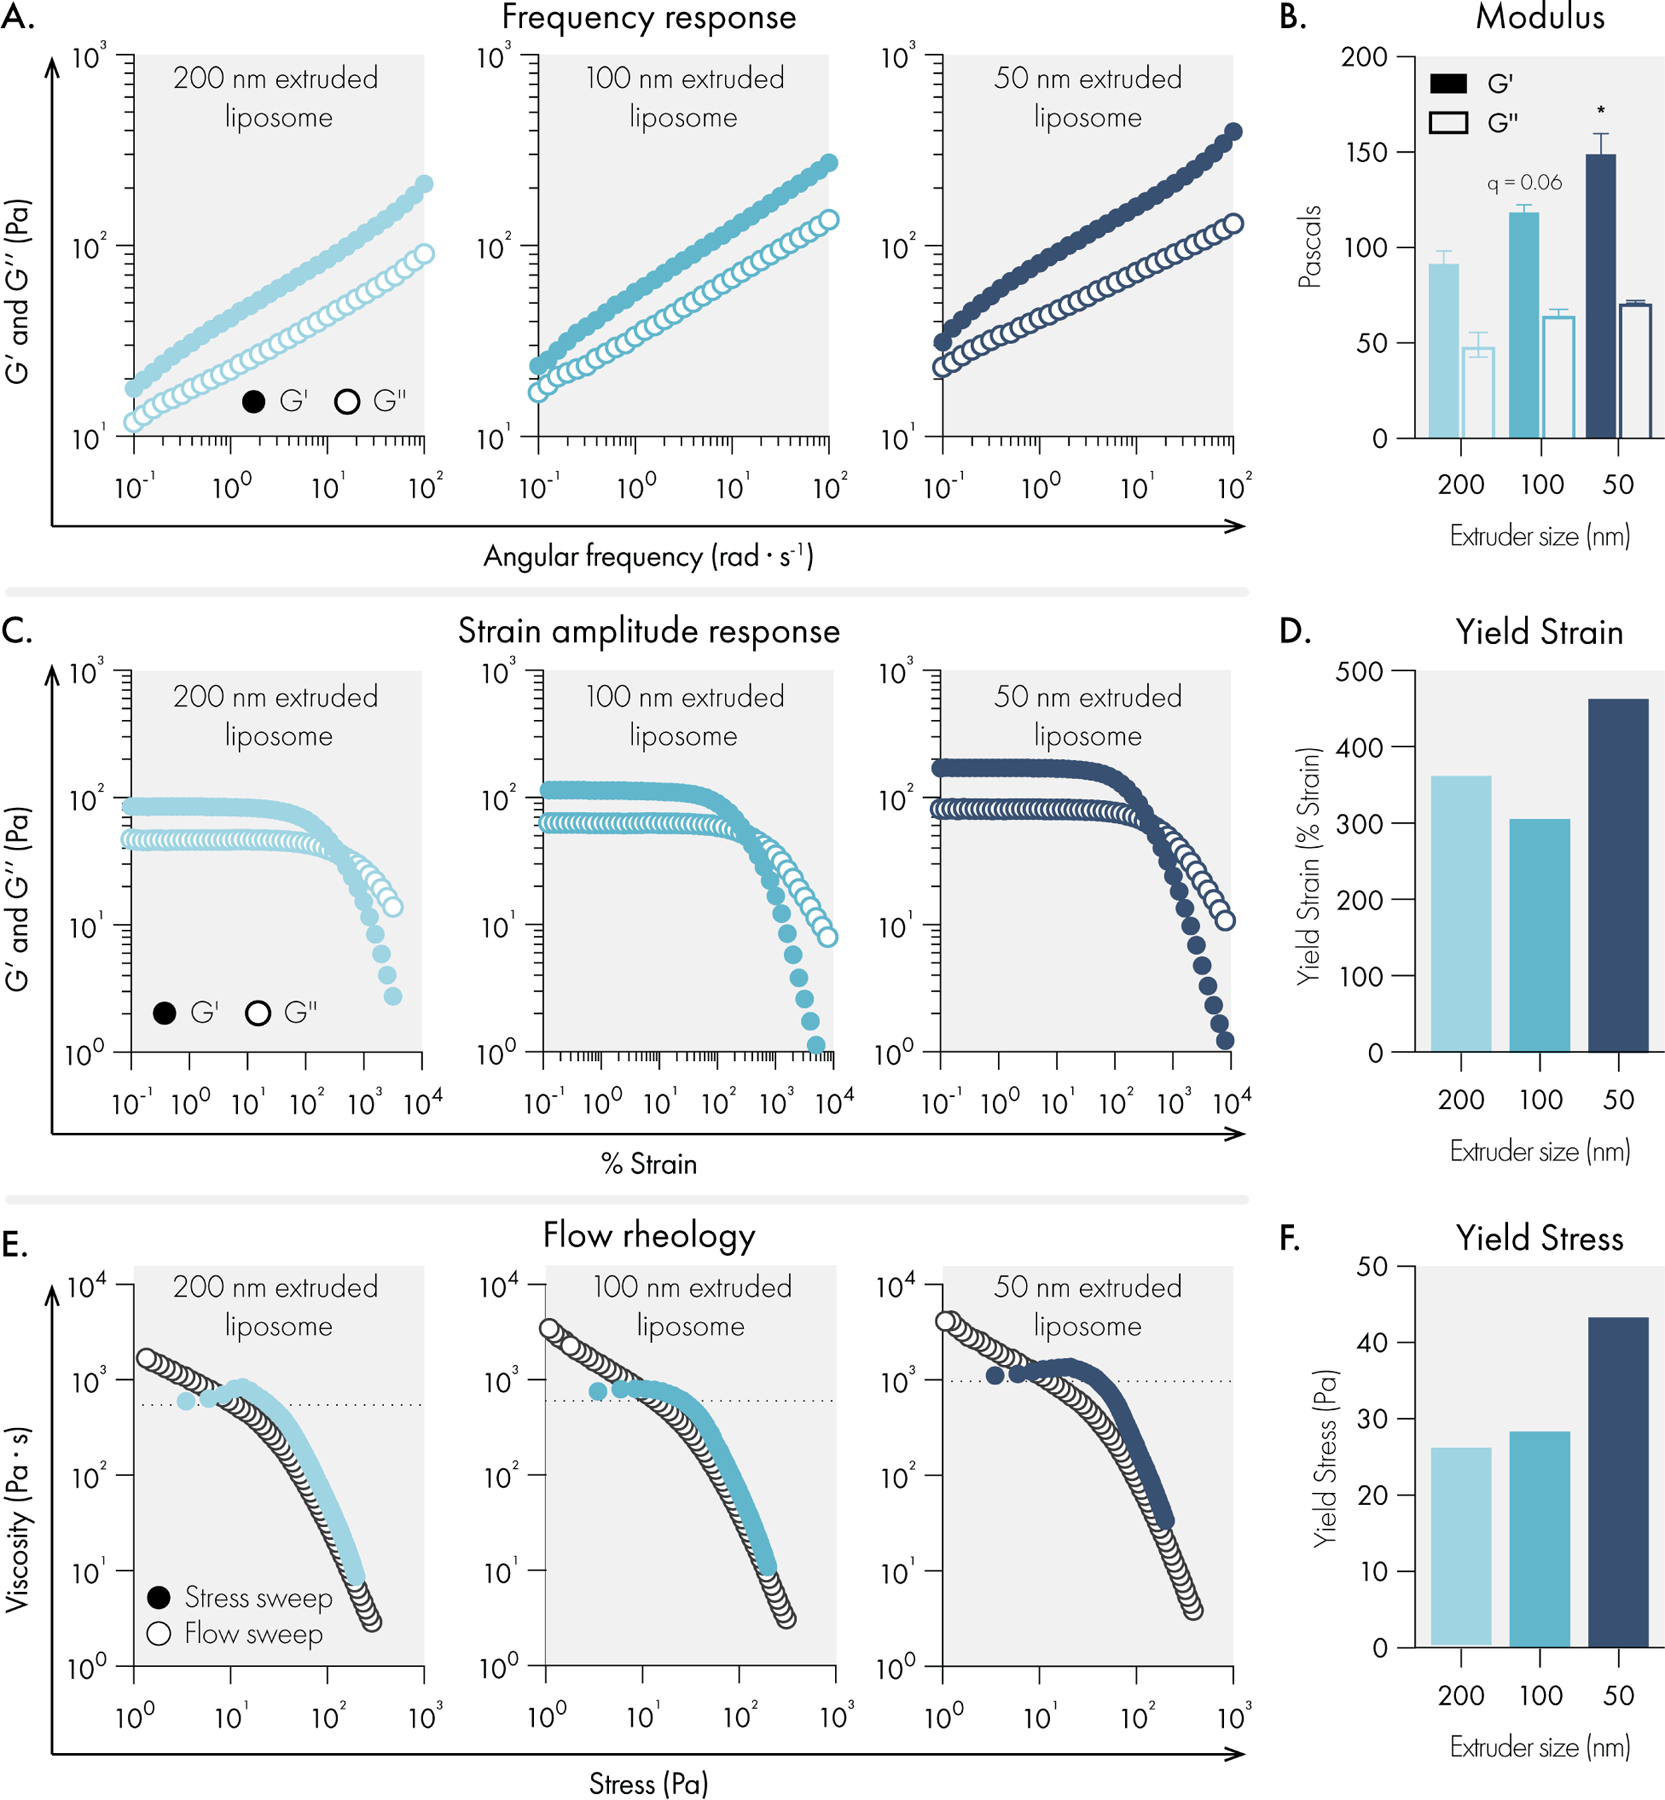
Figure 3.

Liposome size impact on rheological properties of liposomal hydrogels. All measurements were performed with hydrogels composed of 2% HPMC-C12 and 4% liposome, by weight. Liposomes were extruded through either 200, 100, or 50 nm polycarbonate filters. (A) Representative oscillatory shear rheology. (B) G’ and G” at 10 rad/s indicates G’ is influenced by liposome size. Data represents the mean and SEM of two replicate batches. (C) Representative strain-controlled oscillatory shear rheology. (D) Yield strain values extracted from the strain amplitude response data. (E) Representative flow rheology overlay showing low to high stress-ramp behavior (solid circles and high to low flow sweep (empty circles). (F) Yield stress values extracted from flow rheology data. Statistical comparisons were made using a one-way ANOVA, and the false discovery rate (FDR) was controlled at 5% using the Benjamini, Krieger, and Yekutieli method.
