. 2022 Jun 21;11:e75610. doi: 10.7554/eLife.75610

Figure 1. 3D nanoscopy of vinculin and talin-C in the osteoclast podosome belt.

(A) Representative dSTORM images of vinculin (blue) merged with the corresponding epifluorescence images of the F-actin cores (ochre). (A’) Enlarged view of (A). The white crosses indicate the localization of actin cores. (B) DONALD images corresponding to (A) where the height is represented in false color (scale shown in B’). (B’) Enlarged view of (B). The white crosses indicate the localization of actin cores. (C) Representative dSTORM images of talin-C (blue) merged with the corresponding epifluorescence images of the F-actin cores (ochre). (C’) Enlarged view of (C). (D) DONALD images corresponding to (A) where the height is represented in false color (scale shown in (D’)). (D’) Enlarged view of (D). (E–F) Height profiles for vinculin (E) and talin-C (F) and radial distributions (in green and pink, respectively) with respect to the distance to the center of the podosome belt. Data from 465 cores and 1235 cores were quantified for vinculin and talin-C graphs, respectively. (G–H) Radial (G) and vertical (H) distributions of cortactin, α-actinin1, filamin A, paxillin, vinculin, and talin-C in podosome belts. (I) Median axial positions of F-actin, cortactin, α-actinin1, filamin A, paxillin, vinculin, and talin-C in podosome belts. Box-and-whisker plots show the median, lower and upper quartiles (box) and the 10th and 90th percentiles (whiskers). Scale bars: 5 µm (A–D), 1 µm (B’, D’).

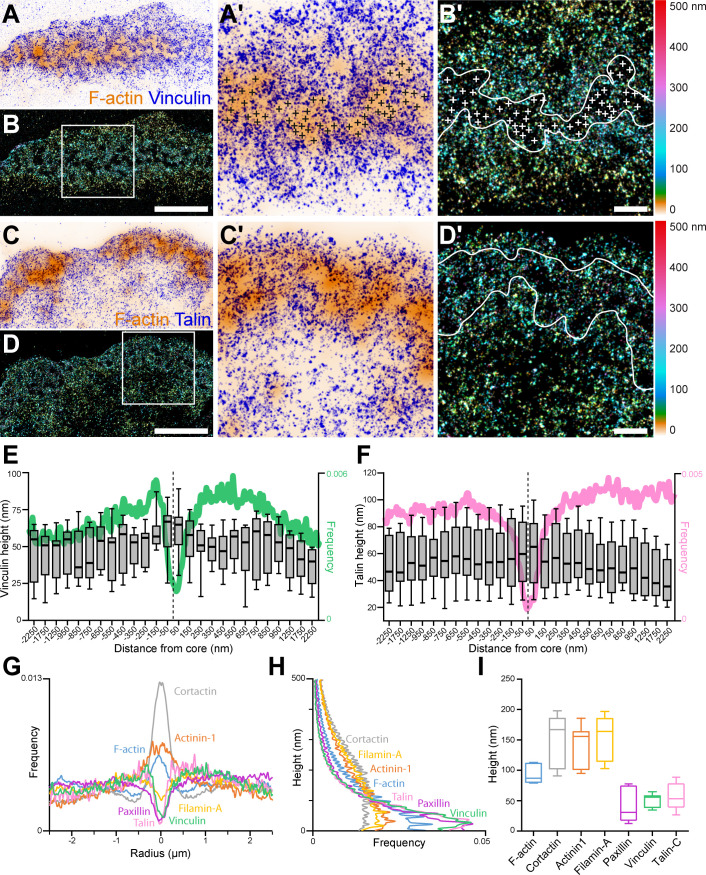
Figure 1—source data 1. Figure 1 source data for all protein height profiles.
Figure 1—source data 2. Figure 1 - source data for all protein radial and vertical distributions.
elife-75610-fig1-data2.xlsx (234.4KB, xlsx)

Figure 1.

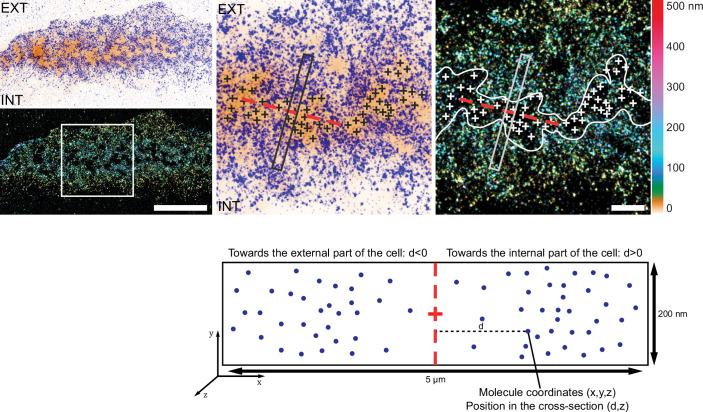
Figure 1—figure supplement 1. Analysis workflow for the 3D localization of proteins relative to actin cores with DONALD.

Figure 1—figure supplement 1.

dSTORM image merged with the corresponding epifluorescence image of the F-actin cores (ochre). In DONALD images, the height is represented in false color. The white crosses indicate the localization of actin cores. When zooming in on a region of the belt, each of the actin cores (crosses) in the different clusters were located by the user. Then, the general orientation of the cluster was evaluated, and rectangular regions were delimited and centered on each actin core composing the podosome belt, transverse to the direction of the cluster (dashed red line). Within these cross-sections, molecules were automatically localized depending on their distance to the central axis of the cross-section and their height. Importantly, all molecules situated towards the cell edge were represented on the left, while those towards the interior of the cell are on the right in the associated charts. EXT: exterior of the cell. INT: interior of the cell. Scale bars: 5 µm (left panel), 1 µm (right panel).
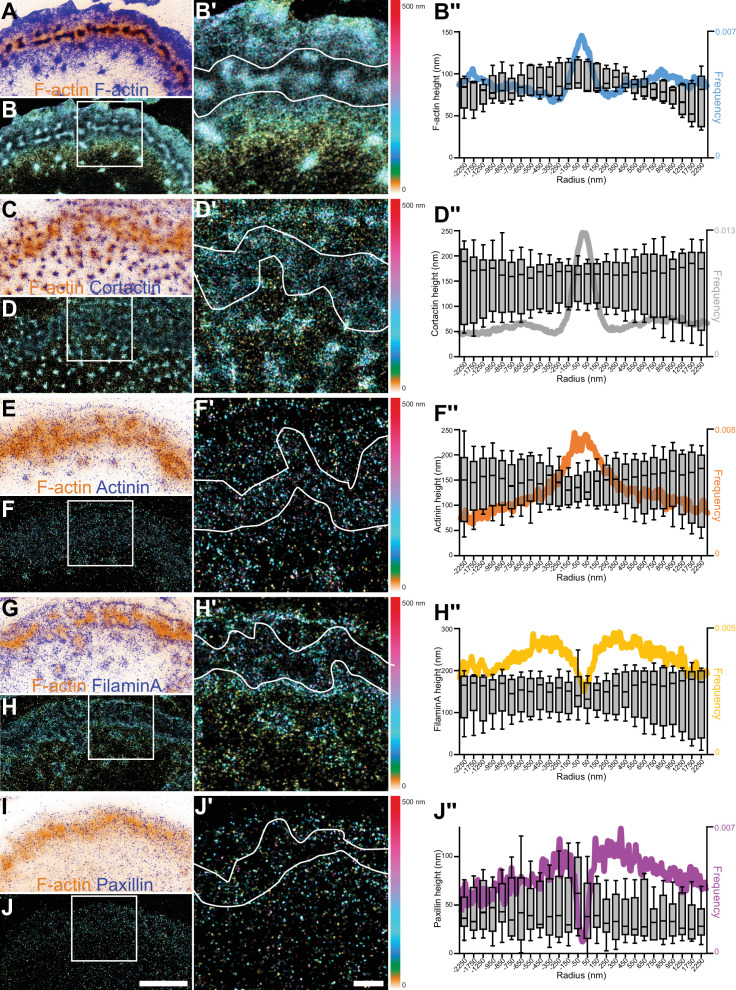
Figure 1—figure supplement 2. 3D nanoscopy of F-actin, cortactin, α-actinin1, filamin A, and paxillin in the osteoclast podosome belt.

Figure 1—figure supplement 2.

(A) Representative dSTORM images of F-actin (blue) merged with the corresponding epifluorescence images of the F-actin cores (ochre). (B) DONALD images corresponding to (A) where the height is represented in false color (scale shown in (B’)). (B’) Enlarged view of (B). (B’’) Height profiles and radial distributions (color) of F-actin with respect to the distance to the center of the sealing zone. Data from 168 cores were quantified. (C) Representative dSTORM images of cortactin (blue) merged with the corresponding epifluorescence images of the F-actin cores (ochre). (D) DONALD images corresponding to (C) where the height is represented in false color (scale shown in (D’)). (D’) Enlarged view of (D). (D’’) Height profiles and radial distributions (color) of cortactin with respect to the distance to the center of the sealing zone. Data from 1100 cores were quantified. (E) Representative dSTORM images of α-actinin1 (blue) merged with the corresponding epifluorescence images of the F-actin cores (ochre). (F) DONALD images corresponding to (E) where the height is represented in false color (scale shown in (F’)). (F’) Enlarged view of (F). (F’’) Height profiles and radial distributions (color) of α-actinin1 with respect to the distance to the center of the sealing zone. Data from 844 cores were quantified. (G) Representative dSTORM images of filamin A (blue) merged with the corresponding epifluorescence images of the F-actin cores (ochre). (H) DONALD images corresponding to (G) where the height is represented in false color (scale shown in (H’)). (H’) Enlarged view of (H). (H’’) Height profiles and radial distributions (color) of filamin A with respect to the distance to the center of the sealing zone. Data from 798 cores were quantified. (I) Representative dSTORM images of paxillin (blue) merged with the corresponding epifluorescence images of the F-actin cores (ochre). (J) DONALD images corresponding to (I) where the height is represented in false color (scale shown in (J’)). (J’) Enlarged view of (J). (J’’) Height profiles and radial distributions (color) of paxillin with respect to the distance to the center of the sealing zone. Data from 722 cores were quantified. Box-and-whisker plots show the median, lower and upper quartiles (box) and the 10th and 90th percentiles (whiskers). Scale bars: 5 µm (A–J), 1 µm (A’-J’).