Abstract
Background
Pancreatic neuroendocrine tumors (pNETs) are rare cancers with outcomes determined by multiple factors including grade, stage, and clinical presentation. In this study, we aimed to determine the prognosis of patients with pNETs using a large population-based database.
Materials and Methods
In this population-based study, we identified patients with pNETs from the SEER 18 registry (2000-2016) using a combination of ICD-O-3 and histology codes. We calculated age-adjusted incidence rates using SEER*Stat 8.3.5. In addition, we analyzed overall survival (OS) using the Kaplan-Meier method, and investigated prognostic factors using a multivariable Cox proportional hazards model.
Results
A total of 8944 pNETs patients were identified. Annual incidence rates increased from 0.27 to 1.00 per 100 000. This was largely explained by an increase in number of patients diagnosed with localized disease in more recent years (2012-2016). Median OS was 68 months (95% CI [64, 73]) and 5-year OS rates in localized, regional, and metastatic disease were 83%, 67%, and 28%, respectively. There was a significant improvement in OS for patients diagnosed between 2009 and 2016 (median OS 85 months) compared with those diagnosed between 2000 and 2008 (median OS 46 months) (HR 0.66; 95% CI [0.62, 0.70]). This improvement in OS was consistent across all stages.
Conclusions and Relevance
This study shows a steady increase pNETs incidence with notable stage migration to earlier stages in recent years. This increase in incidence is accompanied by a significant improvement in survival across different disease stages.
Keywords: neuroendocrine tumors, SEER, incidence, pancreatic tumors
This study used the SEER cancer registry to research trends in the incidence and mortality rates of pancreatic neuroendocrine tumors in the United States over the past 2 decades.
Implications for Practice.
In this study, the investigators find that the incidence of pNETs has increased over the last 2 decades. Significant number of these cancers are being diagnosed in earlier stages. This increase in incidence is associated with improvement in survival across all stages.
Introduction
Pancreatic neuroendocrine tumors (pNET) are rare neoplasms that comprise less than 2% of all pancreatic malignancies. These tumors are thought to arise from islet cells of the pancreas and are known to have different outcomes based on grade, stage, and clinical presentation.1-3 The overall incidence of neuroendocrine neoplasms has been steadily increasing along with improvement in overall survival (OS) over time4.5,6 However, it is not clear whether this increase in incidence and survival applies to pNET after approval of newer agents such as everolimus and sunitinib. Therefore, a more focused and updated look at the incidence and mortality trends of pNET across different stages would be helpful in delineating such patterns which can help in better understanding of the disease.
In this study, we aimed to use the Surveillance, Epidemiology, and End Results (SEER) cancer registry to study trends in the incidence and mortality of pNET in the US over the last 2 decades.
Materials and Methods
Data source
Data on patients diagnosed with pNETs between 2000 and 2016 were drawn from the SEER 18 registry.7
Study Population
Patients diagnosed with pNETs between 2000 and 2016 whose diagnosis did not rely on autopsy or death certificates were included in this analysis. Patients were identified using a combination of topographical codes (International Classification of Diseases for Oncology, 3rd Edition, ICD-O-3: C25.0, C25.1, C25.2, C25.3, C25.4, C25.7, C25.8, and C25.9) and histology codes (8150, 8151, 8152, 8153, 8155, 8240, 8241, and 8246).
Outcomes and Statistical Analysis
Using SEER*Stat 8.3.5, age-adjusted incidence rates were calculated and plotted by year of diagnosis (in 1-year increments with/without stratified stage status, race, and age at diagnosis). Patient demographics and clinical characteristics were summarized as count (percentage) by groups of year of diagnosis (2000-2018, 2009-2016) including sex, age at diagnosis race, grade (I, II, III), stage and surgery on primary tumor. Grades III and IV were combined into a single category4 and are henceforth referred to as grade III. Using SAS 9.4, OS was compared across strata defined by stage (localized, regional, distant), grade (I, II, III), year of diagnosis (2000 to 2008, 2009 to 2016), and with/without surgery via 2-sided log-rank tests with a nominal significance level of α =.05. Overall survival was plotted via the Kaplan-Meier method for the full sample and by strata for each of these prognostic factors. Median OS and 5-year OS rates were also calculated for the full sample and by strata for each of these prognostic factors. Finally, univariate and multivariable Cox proportional hazards regression models were applied to investigate the association between OS and the factors including year of diagnosis (2000 to 2008, 2009 to 2016, and in 1-year increments), age at diagnosis (in 5-year increments), stage (localized, regional, distant), grade (I, II, III), sex (male, female), race (White, Black, other), functional status and surgery on the primary tumor (yes, no). All tests were 2-sided, and P-values of <.05 were considered significant.
Results
Baseline Characteristics
Between 2000 and 2016, 8944 patients with pNETs were identified (Table 1). Most patients were White (7108/ 8898, 79.88%), 45 years or older (7803/ 8944, 87.24%), and with non-metastatic disease at diagnosis (4794/8606, 55.71%). Tumor grade was available for 5148 (57.56%) of the 8944 patients, with most having grade I tumors (3547/ 5148, 68.90%).
Table 1.
Baseline characteristics of the included patients
| Characteristic | Year of diagnosis | Total (N = 8944) | |
|---|---|---|---|
| 2000 to 2008 (N = 2804) | 2009 to 2016 (N = 6140) | ||
| Female sex | 1275 (45.5%) | 2725 (44.4%) | 4000 (44.7%) |
| Age at diagnosis | |||
| 44 years or younger | 405 (14.4%) | 736 (12.0%) | 1141 (12.8%) |
| 45 to 64 years | 1322 (47.1%) | 2708 (44.1%) | 4030 (45.1%) |
| 65 years or older | 1077 (38.4%) | 2696 (43.9%) | 3773 (42.2%) |
| Race | |||
| White | 2298 (82.1%) | 4810 (78.9%) | 7108 (79.9%) |
| Black | 313 (11.2%) | 737 (12.1%) | 1050 (11.8%) |
| Other | 187 (6.7%) | 553 (9.1%) | 740 (8.3%) |
| Missing | 6 | 40 | 46 |
| Grade | |||
| I | 574 (52.0%) | 2973 (73.5%) | 3547 (68.9%) |
| II | 254 (23.0%) | 637 (15.7%) | 891 (17.3%) |
| III | 275 (24.9%) | 435 (10.8%) | 710 (13.8%) |
| Unknown | 1701 | 2095 | 3796 |
| Stage | |||
| Localized | 531 (20.2%) | 2567 (43.0%) | 3098 (36.0%) |
| Regional | 549 (20.9%) | 1147 (19.2%) | 1696 (19.7%) |
| Distant | 1552 (59.0%) | 2260 (37.8%) | 3812 (44.3%) |
| Unstaged or unknown | 172 | 166 | 338 |
| Surgery on primary tumor | |||
| Yes | 1165 (41.8%) | 3253 (53.2%) | 4418 (49.7%) |
| No | 1622 (58.2%) | 2857 (46.8%) | 4479 (50.3%) |
| Missing | 17 | 30 | 47 |
Patient demographic and disease characteristics by year of diagnosis.
Incidence Rates and Trends Over Time
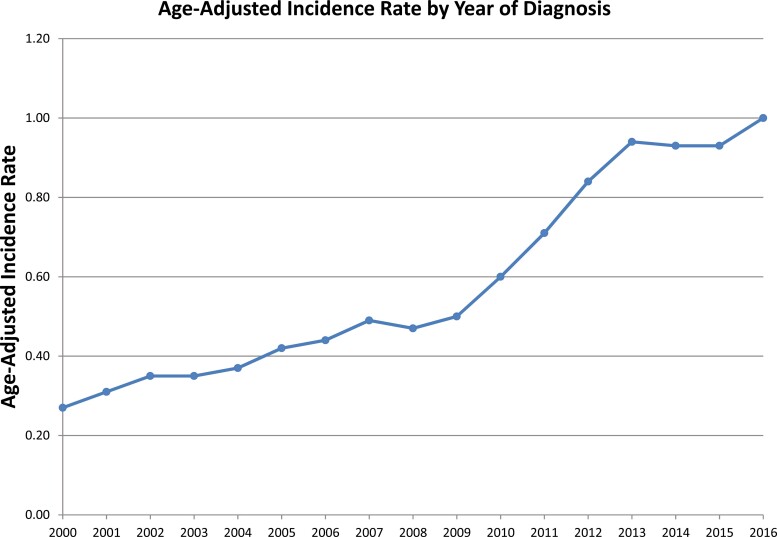
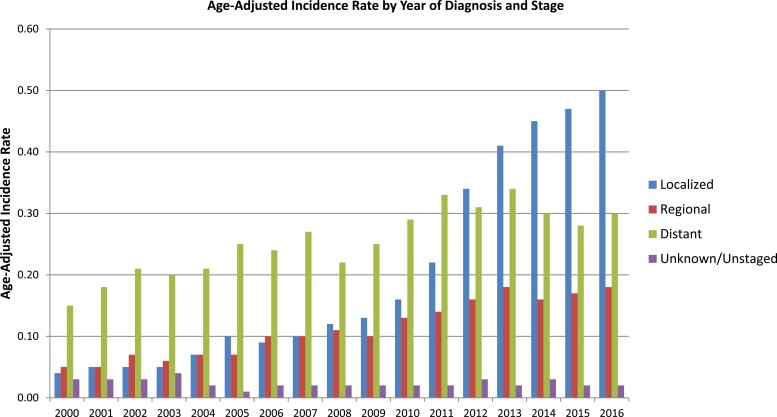
The overall incidence during the study period was 0.61 per 100 000 person-years. Age-adjusted incidence rate was comparable between Black patients and White patients at 0.69 and 0.61 per 100 000, respectively (Supplementary Fig. S1). Diagnosis with pNETs peaked among 70- to 74-year-old patients, with an incidence rate of 2.45 per 100 000 (Supplementary Fig. S2). Annual incidence rates increased over the study period from 0.27 to 1.00 per 100 000 (Fig. 1). The increase in incidence over the study period can largely be explained by a significant increase in the number of patients diagnosed with localized disease in recent years (ie, 2012 to 2016) (Fig. 2).
Figure 1.
Age-adjusted incidence rate by year of diagnosis.
Figure 2.
Age-adjusted incidence rate by year of diagnosis and stage.
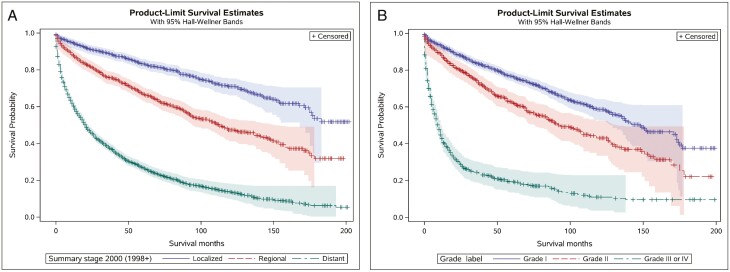
Median overall survival (mOS) for the entire cohort was 68 months (95% CI [64, 73]), and 5-year OS rates localized, regional, and metastatic disease were 83.19% (SE = 0.86%), 67.36% (SE = 1.31%), and 28.13% (SE = 0.79%), respectively (Fig. 3a). The 5-year OS rates in grade I, grade II, and grade III tumors were 77.33% (SE = 0.87%), 63.06% (SE = 1.92%), and 20.04% (SE = 1.60%), respectively (Fig. 3b).The 5-year OS rates for different stage/grade groups were: 87.28%, 79.69%, and 46.24% for localized grade I, grade II, and grade III, respectively; 80.99%, 72.49%, and 38.19%, for regional grade I, grade II, and grade III, respectively; 51.03%, 45.16%, and 12.37% for metastatic grade I, grade II, and grade II, respectively.
Figure 3.
(A) Kaplan-Meier curve for overall survival in patients with localized, regional, and distant pNETs. (B) Kaplan-Meier curve for overall survival in patients with grade I, grade II, and grade III pNETs.
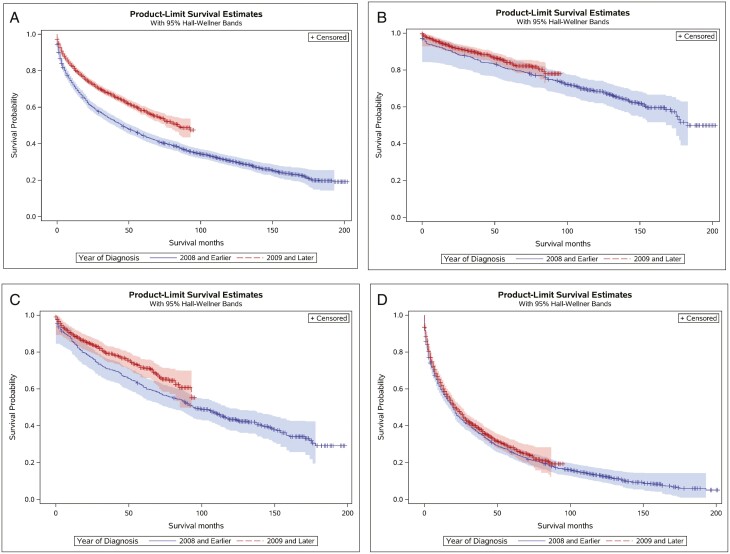
There was a significant improvement in OS for patients diagnosed between 2009 and 2016 (mOS = 85 months) compared with those diagnosed between 2000 and 2008 (mOS = 46 months) (log-rank test: χ2(1) = 154.95, P <.001; univariate Cox proportional hazards: HR = 0.66, 95% CI [0.62, 0.70]), which was seen across all stages (Fig. 4). Patients with metastatic grade I/II (or unknown) disease who underwent surgery experienced significantly longer OS (mOS = 84 months) compared with those who did not undergo surgery (mOS = 18 months) (log-rank test: χ2(1) = 354.15, P <.001; univariate Cox proportional hazards: HR = 0.31, 95% CI [0.28, 0.36]) (Supplementary Fig. S3). In the univariate Cox proportional hazards regression models, more recent year of diagnosis (ie, 2009—2016), younger age at diagnosis, localized disease, lower grade, female sex, race other than White or Black, and surgery on the primary tumor were all associated with longer OS. In the multivariable Cox proportional hazards regression model, more recent year of diagnosis, younger age at diagnosis, localized disease, lower grade, female sex, and surgery on the primary tumor were associated with longer OS (Table 2). In contrast, race was not significantly associated with OS.
Figure 4.
Kaplan-Meier curve for overall survival by year of diagnosis for: (A) all stages; (B) localized stage; (C) regional stage; (D) metastatic stage.
Table 2.
Multivariable cox proportional hazards regression for cases diagnosed between 2000 and 2016.
| Prognostic factor | Reference group | P-value | Hazard ratio |
|---|---|---|---|
| Year of diagnosis (1-year increments) | <.001 | 0.97 (0.96, 0.98) | |
| Age at diagnosis (5-year increments) | <.001 | 1.15 (1.12, 1.17) | |
| SEER stage—regional | Localized | <.001 | 1.62 (1.37, 1.91) |
| SEER stage—distant | Localized | <.001 | 2.78 (2.38, 3.25) |
| Grade—grade II | Grade I | .007 | 1.21 (1.05, 1.39) |
| Grade—grade III | Grade I | <.001 | 3.47 (3.06, 3.93) |
| Sex—female | Male | .001 | 0.84 (0.76, 0.94) |
| Race—black | White | .16 | 1.12 (0.96, 1.32) |
| Race—other | White | .31 | 0.90 (0.74, 1.10) |
| Functional status—functional | Nonfunctional | .85 | 0.96 (0.63, 1.47) |
| Surgery | No surgery | <.001 | 0.35 (0.31, 0.40) |
Discussion
Different population-based studies have shown an increase in NET incidence over time with a 6.4-fold increase between 1973 and 2012.4,8 This same trend was reflected in our study with an overall increase in annual incidence of pNETs from 0.27 to 1.00 per 100 000, from 2000—2016. This increase in incidence was mainly represented by a higher proportion of early stage disease (localized) in more recent years. Although not possible to evaluate using SEER data, it is likely that a substantial proportion of patients diagnosed at an earlier stage were diagnosed incidentally in the absence of symptoms related to the malignancy. With increased use of cross- sectional imaging as an evaluation tool for a variety of clinical conditions, we have observed an increasing number of incidental pNET diagnoses in the clinic, often at earlier stages. In addition to the increase in incidence, we saw significantly better survival in pNET patients diagnosed between 2009 and 2016 compared with those diagnosed between 2000 and 2008. While some of this can be explained by more patients diagnosed at earlier stages, we found that this survival benefit was consistent across all stages.
Our data suggest a complex epidemiologic signature with increase in incidence and decrease in mortality, which could be attributed to either increase in true cancer occurrence or increased diagnosis of early stage disease.9 When we discuss any large database, we must acknowledge the Will Rogers phenomenon, or stage migration.10 The increased use of cross-sectional imaging along with the improvement in imaging modalities with somatostatin receptor imaging probably explain this phenomenon in pNETs. In addition, it is important to note that the increased incidence in grade I cancers over time may also have contributed to the decreased mortality.
In addition to stage migration, the improvement in survival seen in our study was also probably a result of better treatment strategies as the improvement in survival in recent years was seen across all stages including advanced stage (ie, metastatic disease). Over the last 15 years, multiple treatment options have been developed in pNET. In addition to the somatostatin analog lanreotide,11 everolimus was approved by the US Food and Drug Administration (US FDA) based on a phase III trial showing favorable outcomes in patients receiving everolimus compared to placebo.12 Similarly, sunitinib was approved based on progression-free survival of 11.4 months in patients receiving sunitinib compared with 5.5 months in those receiving placebo.13 Other more recent therapeutic developments are expected to further increase this survival in pNET such as the combination of capecitabine/temozolomide14 and peptide receptor radionuclide therapy (Lu 177).15,16 Although the largest trial studying PRRT (NETTER-1) excluded pNETs, both prospective and retrospective studies showed promising efficacy in pNET leading to FDA approval of Lutathera for grades I and II gastroenteropancreatic NETs.15 In addition to the abovementioned treatment strategies, recent translational work has led to a better understanding of the genetic and molecular pathways in pNETs, paving the way for future therapeutic developments.17
Current guidelines recommend surveillance imaging for a total of 10 years in patients with pNET after complete resection, with considering discussion with patients after that regarding continuing or ceasing surveillance.18 In our study, we found an apparent continuous decrease in survival after 10 years in low-grade pNETs. Of course, the current analysis did not delineate whether these deaths are secondary to pNETs, as it has been shown in different studies that non-NET causes of deaths are responsible for significant number of deaths in low-grade NETs.19,20 Our study is not without limitations that are mainly related to its observational nature and reliance on the SEER database. One limitation of the SEER database is that it classifies neuroendocrine neoplasms into 4 grades: grade I, well differentiated; grade II, moderately differentiated; grade III, poorly differentiated; and grade IV, undifferentiated or anaplastic. To better resemble the recent WHO classifications, we combined grade III and IV into one category as was performed by others.4 In addition, the SEER database does not provide granular data regarding Ki-67 index and differentiation. Another limitation is the lack of information of patients’ comorbidities along with other details related to the functional status of the pNETs. Therefore, the identification of functional tumors using SEER data is unreliable. Despite the limitations of the SEER database, we believe that it provides the most recent and comprehensive data for examining incidence and survival trends of pNETs over time.
Conclusion
There has been a steady increase in the incidence of pNETs with notable stage migration as most patients are diagnosed in early stages of disease in recent years. Additionally, this increase in incidence is accompanied by a significant improvement in survival across different disease stages.
Supplementary Material
Contributor Information
Mohamad Bassam Sonbol, Mayo Clinic Cancer Center, Phoenix, AZ, USA.
Gina L Mazza, Clinical Trials and Biostatistics, Mayo Clinic, Phoenix, AZ, USA.
Lanyu Mi, Clinical Trials and Biostatistics, Mayo Clinic, Phoenix, AZ, USA.
Thomas Oliver, Mayo Clinic Cancer Center, Phoenix, AZ, USA.
Jason Starr, Mayo Clinic Cancer Center, Phoenix, FL, USA.
Hallbera Gudmundsdottir, Mayo Clinic Cancer Center, Rochester, MN, USA.
Sean P Cleary, Mayo Clinic Cancer Center, Rochester, MN, USA.
Timothy Hobday, Mayo Clinic Cancer Center, Rochester, MN, USA.
Thorvardur R Halfdanarson, Mayo Clinic Cancer Center, Rochester, MN, USA.
Conflict of Interest
Jason Starr: Tersera, Natera, Advanced Accelerated Applications, Pfizer, Taiho, Ipsen (C/A); Thorvardur R. Halfdanarson: Ipsen, Advanced Accelerator Applications, Curium, TerSera, Crinetics, ITM, Terumo (C/A), Advanced Accelerator Applications, Thermo Fisher Scientific, Basilea, Turnstone Biologics (RF). The other authors indicated no financial relationships.
(C/A) Consulting/advisory relationship; (RF) Research funding; (E) Employment; (ET) Expert testimony; (H) Honoraria received; (OI) Ownership interests; (IP) Intellectual property rights/inventor/patent holder; (SAB) Scientific advisory board.
Author Contributions
Conception/design: M.B.S., G.L.M., T.O., J.S., H.G., S.P.C., T.H., T.R.H. Provision of study material/patients: M.B.S., G.L.M., T.R.H. Collection and/or assembly of data: M.B.S., G.L.M., T.O., J.S., H.G., S.P.C., T.H., T.R.H. Data analysis and interpretation: G.L.M., L.M. Manuscript writing: M.B.S., G.L.M., T.O., J.S., H.G., S.P.C., T.H., T.R.H. Final approval of manuscript: All authors.
Data Availability
The data underlying this article will be shared on reasonable request to the corresponding author.
References
- 1. Halfdanarson TR, Strosberg JR, Tang L, et al. The North American neuroendocrine tumor society consensus guidelines for surveillance and medical management of pancreatic neuroendocrine tumors. Pancreas 2020;49(7):863-881. [DOI] [PubMed] [Google Scholar]
- 2. Di Domenico A, Pipinikas CP, Maire RS, et al. Epigenetic landscape of pancreatic neuroendocrine tumours reveals distinct cells of origin and means of tumour progression. Commun Biol. 2020;3(1):740. [DOI] [PMC free article] [PubMed] [Google Scholar]
- 3. Chan CS, Laddha SV, Lewis PW, et al. ATRX, DAXX or MEN1 mutant pancreatic neuroendocrine tumors are a distinct alpha-cell signature subgroup. Nat Commun. 2018;9(1):4158. [DOI] [PMC free article] [PubMed] [Google Scholar]
- 4. Dasari A, Shen C, Halperin D, et al. Trends in the incidence, prevalence, and survival outcomes in patients with neuroendocrine tumors in the United States. JAMA Oncol 2017;3(10):1335-1342. [DOI] [PMC free article] [PubMed] [Google Scholar]
- 5. Lepage C, Bouvier AM, Phelip JM, et al. Incidence and management of malignant digestive endocrine tumours in a well defined French population. Gut 2004;53(4):549-553. [DOI] [PMC free article] [PubMed] [Google Scholar]
- 6. Halfdanarson TR, Rubin J, Farnell MB, Grant CS, Petersen GM.. Pancreatic endocrine neoplasms: epidemiology and prognosis of pancreatic endocrine tumors. Endocr Relat Cancer. 2008;15(2):409-427. [DOI] [PMC free article] [PubMed] [Google Scholar]
- 7. Surveillance Research Program, National Cancer Institute SEER*Stat software (www.seer.cancer.gov/seerstat) version 8.3.6. [computer program]. 2019. [Google Scholar]
- 8. Yao JC, Hassan M, Phan A, et al. One hundred years after “carcinoid”: epidemiology of and prognostic factors for neuroendocrine tumors in 35,825 cases in the United States. J Clin Oncol. 2008;26(18):3063-3072. [DOI] [PubMed] [Google Scholar]
- 9. Welch HG, Kramer BS, Black WC.. Epidemiologic signatures in cancer. N. Engl. J. Med. 2019;381(14):1378-1386. PMID: 31577882. [DOI] [PubMed] [Google Scholar]
- 10. Feinstein AR, Sosin DM, Wells CK.. The Will Rogers phenomenon. Stage migration and new diagnostic techniques as a source of misleading statistics for survival in cancer. N Engl J Med. 1985;312(25):1604-1608. [DOI] [PubMed] [Google Scholar]
- 11. Caplin ME, Pavel M, Ćwikła JB, et al. Lanreotide in metastatic enteropancreatic neuroendocrine tumors. N Engl J Med. 2014;371(3):224-233. [DOI] [PubMed] [Google Scholar]
- 12. Yao JC, Shah MH, Ito T, et al. Everolimus for advanced pancreatic neuroendocrine tumors. N Engl J Med. 2011;364(6):514-523. [DOI] [PMC free article] [PubMed] [Google Scholar]
- 13. Raymond E, Dahan L, Raoul JL, et al. Sunitinib malate for the treatment of pancreatic neuroendocrine tumors. N Engl J Med. 2011;364(6):501-513. [DOI] [PubMed] [Google Scholar]
- 14. Kunz PL, Catalano PJ, Nimeiri H, et al. A randomized study of temozolomide or temozolomide and capecitabine in patients with advanced pancreatic neuroendocrine tumors: a trial of the ECOG-ACRIN Cancer Research Group (E2211). J Clin Oncol. 2018;36(15_suppl):4004-4004. [DOI] [PMC free article] [PubMed] [Google Scholar]
- 15. Starr JS, Sonbol MB, Hobday TJ, et al. Peptide receptor radionuclide therapy for the treatment of pancreatic neuroendocrine tumors: recent insights. OncoTargets Ther 2020;13:3545-3555. [DOI] [PMC free article] [PubMed] [Google Scholar]
- 16. Strosberg J, El-Haddad G, Wolin E, et al. Phase 3 trial of (177)Lu-dotatate for midgut neuroendocrine tumors. N Engl J Med. 2017;376(2):125-135. [DOI] [PMC free article] [PubMed] [Google Scholar]
- 17. Scarpa A, Chang DK, Nones K, et al. Corrigendum: whole-genome landscape of pancreatic neuroendocrine tumours. Nature 2017;550(7677):548. [DOI] [PubMed] [Google Scholar]
- 18. Singh S, Moody L, Chan DL, et al. Follow-up recommendations for completely resected gastroenteropancreatic neuroendocrine tumors. JAMA Oncol 2018;4(11):1597-1604. [DOI] [PubMed] [Google Scholar]
- 19. Sonbol MB, Saad AM, Gonzalez-Velez M, Starr J, Halfdanarson TR.. Causes of death after neuroendocrine tumors diagnosis: a US population-based analysis. Pancreas 2021;50(1):47-53. [DOI] [PubMed] [Google Scholar]
- 20. Hallet J, Law C, Singh S, et al. Risk of cancer-specific death for patients diagnosed with neuroendocrine tumors: a population-based analysis. J Natl Compr Canc Netw. 2021;19(8):935-944. [DOI] [PubMed] [Google Scholar]
Associated Data
This section collects any data citations, data availability statements, or supplementary materials included in this article.
Supplementary Materials
Data Availability Statement
The data underlying this article will be shared on reasonable request to the corresponding author.


