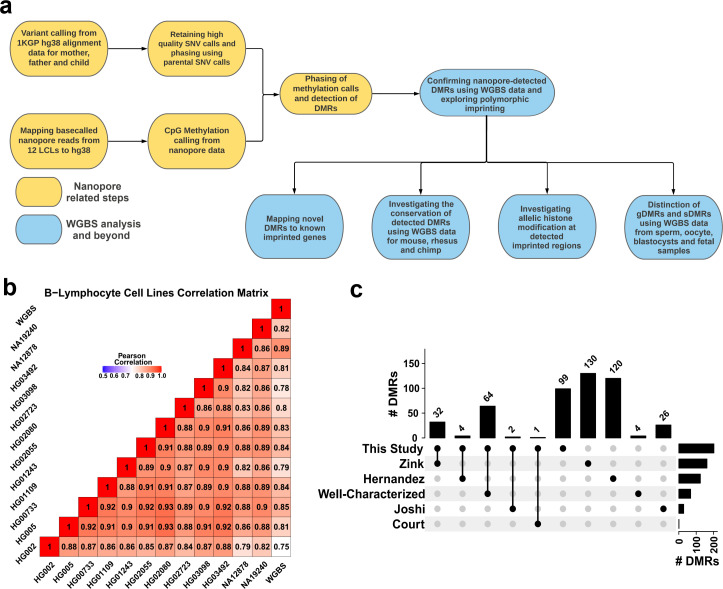
Figure 1. Detection of allelic methylation using nanopore sequencing.
(a) Flowchart of the study representing all the analysis steps. (b) Pearson correlation matrix of the nanopore CpG methylation frequencies for the 12 cell lines and NA12878 whole-genome bisulfite sequencing (WGBS) from ENCODE (ENCFF835NTC). (c) Upset plot of the number of differentially methylated regions (DMRs) detected in our study and previous studies, including overlaps.


