

Abstract
Afamin is a member of the hepatokine that are strongly associated with various metabolic diseases. The relationship between afamin and nonalcoholic fatty liver disease (NAFLD) remains unclear. This study aimed to explore the correlation between serum afamin levels and NAFLD. We analyzed 88 NAFLD patients and 88 age- and sex-matched healthy controls who took their health examinations at the First Affiliated Hospital, Zhejiang University School of Medicine. The association was further confirmed in 22 biopsy-confirmed NAFLD patients and 36 healthy controls. Serum afamin levels were evaluated using an enzyme-linked immunosorbent assay (ELISA). NAFLD patients had significantly higher serum afamin levels than the healthy controls (14.79 ± 5.04 mg/L versus 10.83 ± 3.24 mg/L; P < 0.001). Serum afamin levels were positively correlated with metabolic parameters including the body mass index, waist circumference, systolic blood pressure, liver enzymes, and lipid profiles. A multiple regression analysis showed that serum afamin levels were independently related to the risk of NAFLD (OR: 1.289, 95% CI, 1.141–1.456; P < 0.001). The receiver operating characteristic (ROC) analysis showed that the area under curve (AUC) of serum afamin plus the BMI for detecting NAFLD was 0.878. In participants with liver biopsies, the serum afamin plus the BMI detected NAFLD with an AUC of 0.758. In conclusion, serum afamin levels were positively associated with prevalence and risk of NAFLD, and serum afamin plus the BMI had a high diagnostic performance for NAFLD. This study provides epidemiological evidence of afamin in NAFLD.
1. Introduction
Nonalcoholic fatty liver disease (NAFLD) has become one of the most common chronic liver diseases, affecting approximately 25% adults worldwide [1]. The prevalence of NAFLD in Asia has rapidly climbed to approximately 29.62% in recent years [2]. The increased NAFLD prevalence is strongly associated with the increasing incidence of obesity and related metabolic disorders, such as type 2 diabetes mellitus, chronic kidney disease, and cardiovascular diseases, and is considered a major public health concern and socioeconomic burden [3–5].
The liver is a crucial regulator of systemic metabolism and energy homeostasis [6]. Hepatokines, known as liver-enriched secreted proteins, are the proteins or protein-like substances that are primarily secreted by the liver [7]. An increasing number of studies found that hepatokines play significant regulatory roles in lipid and glucose metabolism [8, 9]. Clinical investigations have found that altered hepatokines were significantly associated with metabolic syndrome (MetS) and cardiovascular diseases [7, 8, 10]. Similar to the function of adipokines and myokines, hepatokines play a significant role in the development of fatty liver disease. For example, FGF21, which is primarily secreted by the liver, modulates the progress of NAFLD by regulating oxidation stress, endoplasmic reticulum stress, mitochondria dysfunction, and inflammation [11].
Afamin is the fourth member of the albumin gene family and is primarily expressed and secreted in the liver [12]. Although the physiologic function of afamin is largely unknown, current investigations have found that afamin is closely correlated with obesity and related metabolic diseases [9]. Serum afamin levels have been found to be positively associated with the body mass index (BMI) [13] and the prevalence of MetS and its components [14]. Serum afamin levels were also significantly associated with type 2 diabetes mellitus [15]. In addition, transgenic mice with an overexpression of afamin are characterized by elevated body weight and serum levels of lipids and lipoproteins [14]. Furthermore, NAFLD is also characterized with increased inflammatory burden [16]. And recent studies have reported that afamin was associated with inflammatory conditions, such as polycystic ovary syndrome [17]. However, whether serum afamin levels are associated with NAFLD, a hepatic manifestation of MetS, remains unclear.
In this study, we explored the association between serum afamin levels and NAFLD. We also explored whether serum afamin could serve as a potential biomarker for the noninvasive diagnosis of NAFLD.
2. Materials and Methods
2.1. Study Participants
A total of 88 NAFLD patients and 88 age- and gender-matched healthy controls were recruited from individuals who took their health examination at the First Affiliated Hospital, Zhejiang University School of Medicine between September 25 and October 10, 2020. Participants were excluded as follows: (i) those with alcohol consumption ≥ 210 g/week for men or ≥ 140 g/week for women; (ii) those with a history of viral hepatitis or other chronic liver disease; (iii) those taking antidiabetic, antihypertension, or lipid-lowering drugs; and (iv) those with acute infections within 2 weeks or with a history of malignancy. To validate the diagnostic value of afamin on NAFLD, another 22 biopsy-confirmed NAFLD patients and 36 healthy controls were enrolled from the First Affiliated Hospital, Zhejiang University School of Medicine. All of the liver biopsies were performed due to suspected NAFLD during liver surgeries. This study was approved by the Ethics Committee of the First Affiliated Hospital, Zhejiang University School of Medicine (reference number: 2021-007).
2.2. Clinical and Biochemical Measurements
Data on the demographic characteristics of the participants were collected using a self-administered health questionnaire. Detailed physical measurements such as weight, height, waist circumference, and systolic and diastolic blood pressure were further measured during the health examination [18]. The BMI was calculated using the kilograms of weight divided by the square of the height in meters.
Serum blood samples of all the participants for the biochemical analysis of metabolic parameters were obtained using venipuncture after an overnight fast. Serum biochemical parameters such as alanine aminotransferase (ALT), aspartate aminotransferase (AST), γ-glutamyl transpeptidase (GGT), uric acid, triglyceride (TG), total cholesterol (TC), low-density lipoprotein (LDL)-cholesterol and high-density lipoprotein (HDL)-cholesterol, and fasting blood glucose (FBG) were measured using an automatic biochemistry analyzer (Olympus, Kobe, Japan) according to the manufacturer's instructions. Hemoglobin, platelets, and white blood cell counts were determined using a SYSMEX XT-1800 hematology autoanalyzer with standard methods.
During the health examinations, an abdominal ultrasound examination was performed by trained ultrasonographists using a Sonoline G60S ultrasound system with a 3.5-MHz probe (Siemens, Erlangen, Germany) [19].
2.3. Afamin Measurement
The serum afamin concentration was measured in all included participants using an ELISA (ABIN415271, Fernhurst, TX) according to the manufacturer's instructions. The maximum detectable dose of human afamin was determined to be 0.2 mg/L. Serum blood samples were diluted 1:1000 with phosphate buffering solution (PBS) depending on the available concentration of the ELISA kit, and of all diluted samples were in the detection range of the ELISA kit.
2.4. Diagnostic Criteria and Definitions
NAFLD was defined as the presence of fatty liver with the absence of excessive alcohol use or other identifiable causes. Fatty liver was diagnosed using an abdominal ultrasound examination, and the criteria were based on those suggested by the Chinese Liver Disease Association [20]. Dyslipidemia was defined according to the Chinese guidelines on prevention and treatment of dyslipidemia in adults [21]. Hypertension was defined as systolic blood pressure ≥ 140 mm Hg or diastolic blood pressure ≥90 mm Hg [22]. According to the WHO, an adult with a BMI ≥ 25 kg/m2 was considered overweight. Type 2 diabetes mellitus was defined as a fasting glucose level ≥ 126 mg/dL (≥7 mmol/L) according to the 1997 American Diabetes Association criteria [23].
2.5. Statistical Analyses
Statistical analyses were performed using the SPSS software package version 25.0 for Mac (SPSS Inc., Chicago, IL). First, normality analysis was conducted for continuous variables by Kolmogorov–Smirnov test. Categorical variables were expressed as frequencies with percentages, and continuous variables were presented as means ± standard deviations (SD). Student's t-test or one-way ANOVA was conducted for continuous variables, while chi-square tests were conducted for the categorical variables. The correlation between the serum afamin levels and metabolic parameters was examined using a Spearman correlation analysis. The Cochran–Armitage trend test was used to show the trend of the prevalence. Serum afamin levels were further divided into quartiles to conduct a quartile-based analysis. Multivariable logistic regression was further used to analyze the serum afamin levels and related factors associated with the likelihood of NAFLD (probability to enter= 0.05 and probability to remove= 0.10). In order to generate the predicted probability of NAFLD, we included the BMI and afamin, separately and simultaneously, in the logistic regression model. Then, the receiver operating characteristic (ROC) curve was used to evaluate the diagnostic performance of serum afamin levels for NAFLD. The criterion for selecting the optimum cutoff point depended on the Youden's index. A P value < 0.05 (two-tailed) was considered to be statistically significant.
3. Results
3.1. Serum Afamin Levels Were Elevated in NAFLD Patients
A total of 88 NAFLD patients and 88 age- and gender-matched healthy controls were enrolled for measuring the serum afamin levels. Table 1 illustrates the clinical characteristic comparisons between the NAFLD patients and the healthy controls. The mean age was 47.64 ± 13.94 years old, and females comprised 36.4% of the NAFLD patients. Compared with healthy controls, NAFLD patients had higher BMI, waist circumference, higher serum levels of ALT, GGT, TG, and uric acid, and lower serum HDL-cholesterol levels (Table 1). Interestingly, we found that the NAFLD patients had significantly higher serum afamin concentrations than the healthy controls (14.79 ± 5.04 mg/L versus 10.83 ± 3.24 mg/L, P < 0.001; Table 1). This finding suggests that elevated serum afamin levels may be correlated with NAFLD.
Table 1.
Clinical characteristics of NAFLD patients and healthy controls.
| Variables | Healthy controls (n = 88) | NAFLD patients (n = 88) | P value |
|---|---|---|---|
| Age (years) | 47.85 ± 12.86 | 47.64 ± 13.94 | 0.804a |
| Gender (female/male) | 32/56 | 32/56 | 1.000b |
| Body mass index (kg/m2) | 23.04 ± 2.22 | 26.3 ± 2.53 | <0.001a |
| Waist circumference (cm) | 80.03 ± 6.15 | 87.37 ± 12.31 | <0.001a |
| Systolic blood pressure (mm Hg) | 123.2 ± 18.75 | 128.68 ± 24.56 | 0.098a |
| Diastolic blood pressure (mm Hg) | 74.06 ± 11.99 | 77.43 ± 11.92 | 0.063a |
| Alanine aminotransferase (U/L) | 22.61 ± 21.91 | 42.65 ± 57.38 | 0.003a |
| Aspartate aminotransferase (U/L) | 21.06 ± 11.4 | 28.7 ± 35.77 | 0.058a |
| γ-Glutamyl transpeptidase (U/L) | 29.92 ± 26.39 | 44.97 ± 36.91 | 0.002a |
| Uric acid (μmol/L) | 331.24 ± 71.39 | 373.6 ± 89.62 | 0.001a |
| Triglyceride (mmol/L) | 1.43 ± 1.06 | 2.27 ± 1.75 | <0.001a |
| Total cholesterol (mmol/L) | 4.70 ± 0.92 | 4.89 ± 1.02 | 0.201a |
| High-density lipoprotein cholesterol (mmol/L) | 1.27 ± 0.30 | 1.12 ± 0.27 | <0.001a |
| Low-density lipoprotein cholesterol (mmol/L) | 2.73 ± 0.78 | 2.83 ± 0.78 | 0.441a |
| Fast blood glucose (mmol/L) | 5.25 ± 1.51 | 5.43 ± 1.32 | 0.415a |
| Afamin (mg/L) | 10.83 ± 3.24 | 14.79 ± 5.04 | <0.001a |
Data are expressed as the means ± standard deviations. a Student's t-test. b Pearson chi-square test.
3.2. Serum Afamin Levels Were Positively Associated with Metabolic Parameters
The Spearman correlation analysis is shown in Table 2. Serum afamin levels were positively correlated with the BMI (rs = 0.242, P = 0.001), waist circumference (rs = 0.207, P = 0.010), and systolic blood pressure (rs = 0.203, P = 0.007). We also found that the serum afamin levels were positively correlated with liver enzymes and lipid profiles, including ALT (rs = 0.207, P = 0.006), GGT (rs = 0.247, P = 0.001), and TG (rs = 0.189, P = 0.012). All of the participants were further divided into quartiles according to their afamin levels, and it was found that participants with the highest afamin quartile had the higher GGT and diastolic blood pressure than those with the lowest quartile (Table S1). These results suggest a positive association between serum afamin levels and metabolic parameters.
Table 2.
Correlation of the serum afamin levels with the anthropometric and biochemical variables.
| Variables | r s | P value |
|---|---|---|
| Age (years) | 0.063 | 0.408 |
| Body mass index (kg/m2) | 0.242 | 0.001 |
| Waist circumference (cm) | 0.207 | 0.010 |
| Diastolic blood pressure (mm Hg) | 0.147 | 0.052 |
| Systolic blood pressure (mm Hg) | 0.203 | 0.007 |
| Alanine aminotransferase (U/L) | 0.207 | 0.006 |
| Aspartate aminotransferase (U/L) | 0.154 | 0.041 |
| γ-Glutamyl transpeptidase (U/L) | 0.247 | 0.001 |
| Uric acid (μmol/L) | 0.145 | 0.055 |
| Triglyceride (mmol/L) | 0.189 | 0.012 |
| Total cholesterol (mmol/L) | 0.050 | 0.511 |
| High-density lipoprotein cholesterol (mmol/L) | −0.054 | 0.475 |
| Low-density lipoprotein cholesterol (mmol/L) | −0.035 | 0.642 |
| Fast blood glucose (mmol/L) | 0.145 | 0.055 |
The significance analysis was conducted using the Spearman rank correlation test.
3.3. Serum Afamin Levels Were Positively Associated with Prevalence of NAFLD
Of the 176 participants enrolled, 75 fulfilled the diagnostic criteria of dyslipidemia, 105 were overweight, 16 had type 2 diabetes mellitus, and 59 had hypertension. As shown in Figure 1, serum afamin quartiles were positively associated with the prevalence of NAFLD (P < 0.001) and were overweight (P = 0.002), while there was no significant association between the serum afamin quartiles and the prevalence of T2DM, dyslipidemia, or hypertension. These results further suggested a positive association between the serum afamin levels with NAFLD.
Figure 1.
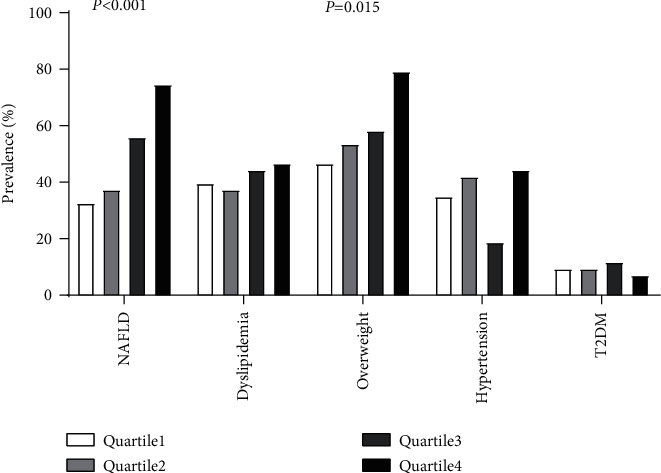
Prevalence of NAFLD, dyslipidemia, overweight, hypertension, and T2DM according to quartiles of the serum afamin levels. Participants were classified into quartiles according to their serum afamin levels. Quartile 1 < 9.78 mg/L, 9.78 ≤ Quartile 2 < 12.14 mg/L, 12.14 ≤ Quartile 3 < 15.29 mg/L, and Quartile 4 ≥ 15.29 mg/L. NAFLD= nonalcoholic fatty liver disease; T2DM = type 2 diabetes mellitus. P-trend was calculated by the Cochran–Armitage χ2 test for the trend.
Elevated serum afamin levels were associated with an increased risk of NAFLD.
Univariable and multivariable logistic regression analyses were then performed to explore the association of serum afamin levels with the risk of NAFLD (Table 3). In the univariable analysis, we found that elevated serum afamin levels were significantly associated with an increased risk of NAFLD (OR: 1.287, 95% CI: 1.167–1.419; P < 0.001). In the multivariable analysis, serum afamin levels remained significantly and positively associated with the risk of NAFLD (OR: 1.289, 95% CI, 1.141–1.456; P < 0.001). These results suggested that the participants with elevated afamin levels may have an increased risk of NAFLD.
Table 3.
Logistic regression analysis of NAFLD with the anthropometric and biochemical variables.
| Variables | Univariable analysis | Multivariable analysis∗ |
|---|---|---|
| OR (95%CI) | OR (95%CI) | |
| Age (years) | 0.997 (0.975–1.020) | |
| Body mass index (kg/m2) | 1.875 (1.539–2.285) | 1.794 (1.458–2.208) |
| Waist circumference (cm) | 1.129 (1.072–1.189) | |
| Diastolic blood pressure (mm Hg) | 1.012 (0.997–1.027) | |
| Systolic blood pressure (mm Hg) | 1.024 (0.998–1.051) | |
| Alanine aminotransferase (U/L) | 1.029 (1.010–1.048) | |
| Aspartate aminotransferase (U/L) | 1.030 (0.997–1.063) | |
| γ-Glutamyl transpeptidase (U/L) | 1.016 (1.005–1.028) | |
| Uric acid (μmol/L) | 1.007 (1.003–1.011) | |
| Triglyceride (mmol/L) | 2.181 (1.464–3.250) | 1.627 (1.032–2.566) |
| Total cholesterol (mmol/L) | 1.224 (0.898–1.669) | |
| High-density lipoprotein cholesterol (mmol/L) | 0.148 (0.048–0.456) | |
| Low-density lipoprotein cholesterol (mmol/L) | 1.163 (0.793–1.707) | |
| Fast blood glucose (mmol/L) | 1.094 (0.881–1.358) | |
| Afamin (mg/L) | 1.287 (1.167–1.419) | 1.289 (1.141–1.456) |
∗ Backward stepwise regression was used in the multivariate logistic regression analyses (probability to enter= 0.05, and probability to remove = 0.10). All variables in the table entered the regression model at first. Finally, the body mass index, triglyceride, and afamin were retained in the multivariable model. OR= odds ratio, CI= confidence interval.
3.4. Diagnostic Performance of Serum Afamin in NAFLD
The area under the ROC curves was calculated to measure the sensitivity and specificity of the variables with statistical significance, as shown in Table 3, as a potential marker for NAFLD. We found that the calculated AUC value was 0.746 for afamin, 0.818 for the BMI, and 0.878 for afamin plus the BMI (Figure 2). The cutoff for detecting NAFLD based on the distribution of specificities and sensitivities was also calculated. For afamin, a cutoff value of ≥ 13.50 mg/L with a sensitivity of 60.2% and a specificity of 83.0% was used to detect NAFLD. Using this threshold, the positive predictive value was 62.5%, the negative predictive value was 69.3%, and the accuracy was 65.9%. For the serum afamin levels plus BMI, the positive predictive value was 77.3%, the negative predictive value was 79.5%, and the accuracy was 78.4%, indicating a better diagnostic potential than that of the BMI or the serum afamin levels alone.
Figure 2.
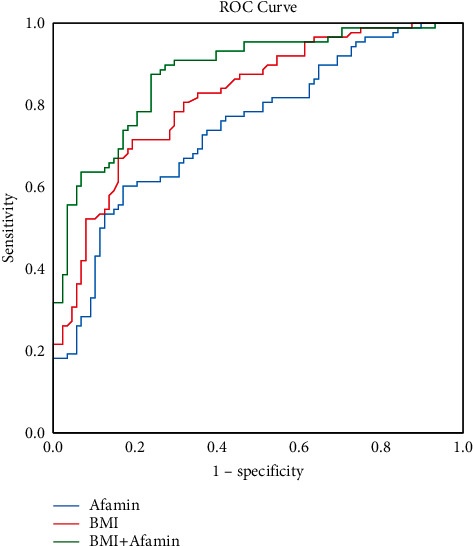
Receiver operating characteristic (ROC) analysis for the diagnosis of NAFLD. The ROC curves for afamin, BMI, and afamin plus the BMI are shown. The area under the curve (AUC) of afamin was 0.746, and the positive predictive value was 62.5%. The negative predictive value was 69.3%, and the accuracy was 65.9%. The area under the curve (AUC) of the BMI was 0.818, and the positive predictive value was 77.3%. The negative predictive value was 70.5%, and the accuracy was 73.9%. The area under the curve (AUC) of afamin plus the BMI was 0.878, and the positive predictive value was 77.3%. The negative predictive value was 79.5%, and the accuracy was 78.4%.
3.5. Validation of Serum Afamin in Liver Biopsy-Proved Participants
The diagnostic performance of serum afamin in 58 liver biopsy-proved participants, including 22 NAFLD patients and 36 controls, was validated. We found that the biopsy-proved NAFLD patients had significantly higher serum afamin levels than the healthy controls (P < 0.01; Figure 3). As shown in Figure 4, the AUC value of the serum afamin, BMI, and afamin plus the BMI for detecting NAFLD was 0.628, 0.670, and 0.758, respectively, suggesting a good predictive value of serum afamin plus the BMI in the liver biopsy-proved participants.
Figure 3.
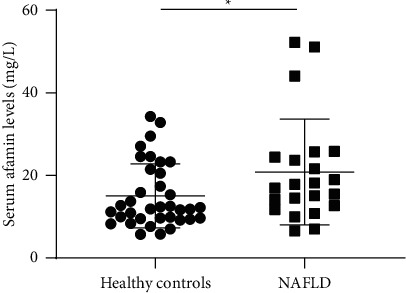
Differentially serum afamin levels in biopsy-proven participants. A total of 58 biopsy-proved participants including 22 biopsy-confirmed NAFLD patients and 36 healthy controls were enrolled. The serum afamin levels were significantly higher in the biopsy-proved NAFLD patients than in the healthy controls (P < 0.01). A significance analysis was conducted using Student's t-test.
Figure 4.
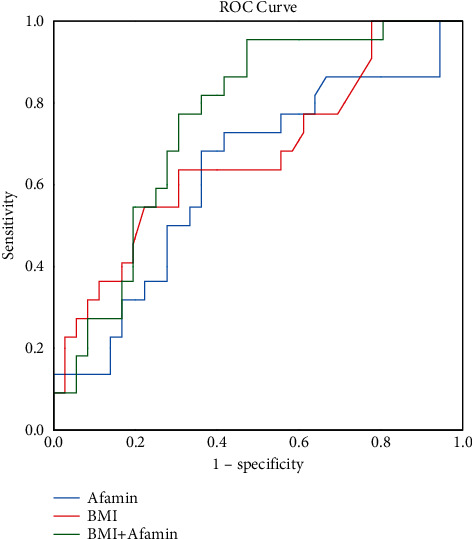
The receiver operating characteristic (ROC) analysis of afamin, body mass index (BMI), and BMI plus afamin for detecting NAFLD in biopsy-proven participants. The ROC curves for afamin, the BMI, and afamin plus the BMI are shown. The area under the curve (AUC) of afamin was 0.628. The area under the curve (AUC) of the BMI was 0.670. The area under the curve (AUC) of afamin plus the BMI was 0.758.
4. Discussion
In this study, we presented evidence for the first time that serum afamin levels were significantly elevated in NAFLD patients, and the levels were positively associated with the prevalence and risk of NAFLD. Moreover, we found that serum afamin levels have high diagnostic performance for NAFLD diagnosis. These findings may have important clinical implications for the diagnosis and treatment of NAFLD.
Afamin is a hepatokine that is highly expressed in the liver and secreted into blood. Similar to the function of other hepatokines such as FGF21, SMOC1, LECT2, and SeP, afamin plays a significant role in lipid and glucose metabolism [24–27]. Afamin acts as a transfer protein that is responsible for exchanging lipoproteins, such as cholesterol, triglycerides, and apoB [28]. The overexpression of afamin significantly increases the levels of serum triglycerides, total cholesterol, and FBG [14]. However, the association between the serum afamin levels and NAFLD has not been explored as yet. In this study, our findings suggested that afamin may be also closely associated with NAFLD.
Afamin has been previously reported to be a potential biomarker for gestational diabetes mellitus [29], preeclampsia [30], and type 2 diabetes mellitus [15]. Consistent with these reports, it was found in this study that the serum afamin levels had a good diagnostic value for NAFLD. At a cutoff value of ≥ 13.50 mg/L, the diagnostic accuracy of afamin was calculated to be 65.9%, with a specificity of 83.0%, to detect NAFLD. In addition, the diagnostic accuracy of afamin plus the BMI turned out to be as high as 78.4% (AUC = 0.878), with a specificity of 79.5%. The diagnostic performance of afamin plus the BMI was also verified in biopsy-proven participants, and it was found that the BMI plus afamin had a high accuracy for the diagnosis of NAFLD. These findings suggested that afamin may serve as a potential biomarker for the noninvasive diagnosis of NAFLD. In recent years, several pharmacological therapies aiming to alleviate NAFLD are being examined at various phases of clinical trials; hence, the early diagnosis of NAFLD is useful to try to cure this very common disease [31].
The mechanistic explanation for the association between afamin and NAFLD remains unclear. Afamin has been shown to be a specific binding protein for vitamin E and may be responsible for the transport of vitamin E [28]. Vitamin E is identified as a potent antioxidant that has anti-inflammatory effects and has been used in the treatment of fatty liver diseases. A systematic review and meta-analysis have revealed that adjuvate vitamin E therapy significantly improved biochemical and histological parameters in fatty liver patients [32]. Vitamin E therapy reduced the levels of markers of oxidative stress and the histological fibrosis score in the livers of MCD diet-induced models of steatohepatitis mice [33]. Afamin has also been reported to bind tightly to Wnt proteins and acylated Wnt proteins in active form. The Wnt signaling pathway is ubiquitous signaling that regulates a wide range of physiologic processes in various diseases, such as MetS and NAFLD [34, 35]. The knockout of LRP6, a receptor for canonical Wnt ligands, was shown to significantly induce liver steatosis through active hepatic AKT/PI3K/mTOR [36]. Previous studies have also reported that elevated serum afamin levels are associated with insulin resistance and with increased glucose concentrations [13, 14], which are involved in the development of NAFLD. Therefore, afamin may play a role in the progress of NAFLD through regulated vitamin E metabolism, insulin resistance, and affect the Wnt-dependent mechanism. However, further studies are required to confirm this hypothesis.
There are several limitations in this study. First, this is an observational design, and further studies are required to explore the potential causal relationship between serum afamin levels in the development of NAFLD. Second, a relatively limited sample size was recruited from a single center in this study. Further studies with a larger sample size may be needed to confirm the association between serum afamin and NAFLD, as well as to verify the accuracy of afamin in the diagnosis of NAFLD.
5. Conclusion
In conclusion, this study revealed that the serum afamin levels were positively associated with prevalence and risk of NAFLD. These results also suggested that serum afamin may be a reliable biomarker for the noninvasive diagnosis of NAFLD.
Acknowledgments
The work was supported by Key Research and Development Program of Zhejiang Province (2020C03033) and the National Natural Science Foundation of China (82070585).
Contributor Information
Xiaofeng Zhang, Email: 837837@zju.edu.cn.
Chengfu Xu, Email: xiaofu@zju.edu.cn.
Data Availability
The data used to support the findings of this study are available from the corresponding author upon request.
Conflicts of Interest
The authors declare that they have no conflicts of interest.
Authors' Contributions
Shenghui Chen and Zhening Liu contributed equally to this work.
Supplementary Materials
Table S1. Clinical characteristics by quartiles of the serum afamin levels. See table S1 in the Supplementary Material.
References
- 1.Younossi Z. M., Koenig A. B., Abdelatif D., Fazel Y., Henry L., Wymer M. Global epidemiology of nonalcoholic fatty liver disease-Meta-analytic assessment of prevalence, incidence, and outcomes. Hepatology . 2016;64(1):73–84. doi: 10.1002/hep.28431. [DOI] [PubMed] [Google Scholar]
- 2.Li J., Zou B., Yeo Y. H., et al. Prevalence, incidence, and outcome of non-alcoholic fatty liver disease in Asia, 1999–2019: a systematic review and meta-analysis. The Lancet Gastroenterology & Hepatology . 2019;4(5):389–398. doi: 10.1016/s2468-1253(19)30039-1. [DOI] [PubMed] [Google Scholar]
- 3.Jarvis H., Craig D., Barker R., et al. Metabolic risk factors and incident advanced liver disease in non-alcoholic fatty liver disease (NAFLD): a systematic review and meta-analysis of population-based observational studies. PLoS Medicine . 2020;17(4) doi: 10.1371/journal.pmed.1003100.e1003100 [DOI] [PMC free article] [PubMed] [Google Scholar]
- 4.Kwon Y. M., Oh S. W., Hwang S., Lee C., Kwon H., Chung G. E. Association of nonalcoholic fatty liver disease with components of metabolic syndrome according to body mass index in Korean adults. American Journal of Gastroenterology . 2012;107(12):1852–1858. doi: 10.1038/ajg.2012.314. [DOI] [PubMed] [Google Scholar]
- 5.Targher G., Byrne C. D., Tilg H. NAFLD and increased risk of cardiovascular disease: clinical associations, pathophysiological mechanisms and pharmacological implications. Gut . 2020;69(9):1691–1705. doi: 10.1136/gutjnl-2020-320622. [DOI] [PubMed] [Google Scholar]
- 6.Watt M. J., Miotto P. M., De Nardo W., Montgomery M. K. The liver as an endocrine organ-linking NAFLD and insulin resistance. Endocrine Reviews . 2019;40(5):1367–1393. doi: 10.1210/er.2019-00034. [DOI] [PubMed] [Google Scholar]
- 7.Iroz A., Couty J. P., Postic C. Hepatokines: unlocking the multi-organ network in metabolic diseases. Diabetologia . 2015;58(8):1699–1703. doi: 10.1007/s00125-015-3634-4. [DOI] [PubMed] [Google Scholar]
- 8.Jung T. W., Yoo H. J., Choi K. M. Implication of hepatokines in metabolic disorders and cardiovascular diseases. BBA Clinical . 2016;5:108–113. doi: 10.1016/j.bbacli.2016.03.002. [DOI] [PMC free article] [PubMed] [Google Scholar]
- 9.Crunkhorn S. Hepatokine improves glucose control. Nature Reviews Drug Discovery . 2020;19(11):p. 756. doi: 10.1038/d41573-020-00171-4. [DOI] [PubMed] [Google Scholar]
- 10.Meex R. C. R., Watt M. J. Hepatokines: linking nonalcoholic fatty liver disease and insulin resistance. Nature Reviews Endocrinology . 2017;13(9):509–520. doi: 10.1038/nrendo.2017.56. [DOI] [PubMed] [Google Scholar]
- 11.Fisher F. M., Chui P. C., Nasser I. A., et al. Fibroblast growth factor 21 limits lipotoxicity by promoting hepatic fatty acid activation in mice on methionine and choline-deficient diets. Gastroenterology . 2014;147(5):1073–1083. doi: 10.1053/j.gastro.2014.07.044. [DOI] [PMC free article] [PubMed] [Google Scholar]
- 12.Dieplinger H., Dieplinger B. Afamin—a pleiotropic glycoprotein involved in various disease states. Clinica Chimica Acta . 2015;446:105–110. doi: 10.1016/j.cca.2015.04.010. [DOI] [PubMed] [Google Scholar]
- 13.Seeber B., Morandell E., Lunger F., Wildt L., Dieplinger H. Afamin serum concentrations are associated with insulin resistance and metabolic syndrome in polycystic ovary syndrome. Reproductive Biology and Endocrinology . 2014;12(1):p. 88. doi: 10.1186/1477-7827-12-88. [DOI] [PMC free article] [PubMed] [Google Scholar]
- 14.Kronenberg F., Kollerits B., Kiechl S., et al. Plasma concentrations of afamin are associated with the prevalence and development of metabolic syndrome. Circ Cardiovasc Genet . 2014;7(6):822–829. doi: 10.1161/circgenetics.113.000654. [DOI] [PubMed] [Google Scholar]
- 15.Kollerits B., Lamina C., Huth C., et al. Plasma concentrations of afamin are associated with prevalent and incident type 2 diabetes: a pooled analysis in more than 20, 000 individuals. Diabetes Care . 2017;40(10):1386–1393. doi: 10.2337/dc17-0201. [DOI] [PubMed] [Google Scholar]
- 16.Kosekli M. A., Kurtkulagii O., Kahveci G., et al. The association between serum uric acid to high density lipoprotein-cholesterol ratio and non-alcoholic fatty liver disease: the abund study. Revista da Associação Médica Brasileira . 2021;67(4):549–554. doi: 10.1590/1806-9282.20201005. [DOI] [PubMed] [Google Scholar]
- 17.Köninger A., Edimiris P., Koch L., et al. Serum concentrations of afamin are elevated in patients with polycystic ovary syndrome. Endocrine Connections . 2014;3(3):120–126. doi: 10.1530/ec-14-0053. [DOI] [PMC free article] [PubMed] [Google Scholar]
- 18.Wang J., Xu C., Xun Y., et al. ZJU index: a novel model for predicting nonalcoholic fatty liver disease in a Chinese population. Scientific Reports . 2015;5(1) doi: 10.1038/srep16494.16494 [DOI] [PMC free article] [PubMed] [Google Scholar]
- 19.Wang Q., Shi X., Wang J., Zhang J., Xu C. Low serum vitamin D concentrations are associated with obese but not lean NAFLD: a cross-sectional study. Nutrition Journal . 2021;20(1):p. 30. doi: 10.1186/s12937-021-00690-9. [DOI] [PMC free article] [PubMed] [Google Scholar]
- 20.Fan J. G., Farrell G. C. Epidemiology of non-alcoholic fatty liver disease in China. Journal of Hepatology . 2009;50(1):204–210. doi: 10.1016/j.jhep.2008.10.010. [DOI] [PubMed] [Google Scholar]
- 21.Chinese guidelines on prevention and treatment of dyslipidemia in adults. Zhonghua xin xue guan bing za zhi . 2007;35(5):390–419. [PubMed] [Google Scholar]
- 22.Carey R. M., Whelton P. K. Prevention, detection, evaluation, and management of high blood pressure in adults: synopsis of the 2017 American college of cardiology/American heart association hypertension guideline. Annals of Internal Medicine . 2018;168(5):p. 351. doi: 10.7326/m17-3203. [DOI] [PubMed] [Google Scholar]
- 23.American Diabetes Association. 2. Classification and diagnosis of diabetes. Diabetes Care . 2016;39(1):S13–S22. doi: 10.2337/dc16-S005. [DOI] [PubMed] [Google Scholar]
- 24.Montgomery M. K., Bayliss J., Devereux C., et al. SMOC1 is a glucose-responsive hepatokine and therapeutic target for glycemic control. Science Translational Medicine . 2020;12(559) doi: 10.1126/scitranslmed.aaz8048.eaaz8048 [DOI] [PubMed] [Google Scholar]
- 25.Berti L., Irmler M., Zdichavsky M., et al. Fibroblast growth factor 21 is elevated in metabolically unhealthy obesity and affects lipid deposition, adipogenesis, and adipokine secretion of human abdominal subcutaneous adipocytes. Molecular Metabolism . 2015;4(7):519–527. doi: 10.1016/j.molmet.2015.04.002. [DOI] [PMC free article] [PubMed] [Google Scholar]
- 26.Yoo H. J., Hwang S. Y., Choi J. H., et al. Association of leukocyte cell-derived chemotaxin 2 (LECT2) with NAFLD, metabolic syndrome, and atherosclerosis. PLoS One . 2017;12(4) doi: 10.1371/journal.pone.0174717.e0174717 [DOI] [PMC free article] [PubMed] [Google Scholar]
- 27.Mita Y., Nakayama K., Inari S., et al. Selenoprotein P-neutralizing antibodies improve insulin secretion and glucose sensitivity in type 2 diabetes mouse models. Nature Communications . 2017;8(1):p. 1658. doi: 10.1038/s41467-017-01863-z. [DOI] [PMC free article] [PubMed] [Google Scholar]
- 28.Jerkovic L., Voegele A. F., Chwatal S., et al. Afamin is a novel human vitamin E-binding glycoprotein characterization and in vitro expression. Journal of Proteome Research . 2005;4(3):889–899. doi: 10.1021/pr0500105. [DOI] [PubMed] [Google Scholar]
- 29.Köninger A., Mathan A., Mach P., et al. Is Afamin a novel biomarker for gestational diabetes mellitus? a pilot study. Reproductive Biology and Endocrinology . 2018;16(1):p. 30. doi: 10.1186/s12958-018-0338-x. [DOI] [PMC free article] [PubMed] [Google Scholar]
- 30.Köninger A., Enekwe A., Mach P., et al. Afamin: an early predictor of preeclampsia. Archives of Gynecology and Obstetrics . 2018;298(5):1009–1016. doi: 10.1007/s00404-018-4897-z. [DOI] [PMC free article] [PubMed] [Google Scholar]
- 31.Negi C. K., Babica P., Bajard L., Bienertova-Vasku J., Tarantino G. Insights into the molecular targets and emerging pharmacotherapeutic interventions for nonalcoholic fatty liver disease. Metabolism . 2022;126 doi: 10.1016/j.metabol.2021.154925.154925 [DOI] [PubMed] [Google Scholar]
- 32.Amanullah I., Khan Y. H., Anwar I., Gulzar A., Mallhi T. H., Raja A. A. Effect of vitamin E in non-alcoholic fatty liver disease: a systematic review and meta-analysis of randomised controlled trials. Postgraduate Medical Journal . 2019;95(1129):601–611. doi: 10.1136/postgradmedj-2018-136364. [DOI] [PubMed] [Google Scholar]
- 33.Phung N., Pera N., Farrell G., Leclercq I., Hou J. Y., George J. Pro-oxidant-mediated hepatic fibrosis and effects of antioxidant intervention in murine dietary steatohepatitis. International Journal of Molecular Medicine . 2009;24(2):171–180. doi: 10.3892/ijmm_00000220. [DOI] [PubMed] [Google Scholar]
- 34.Abou Ziki M. D., Mani A. The interplay of canonical and noncanonical Wnt signaling in metabolic syndrome. Nutrition research . 2019;70:18–25. doi: 10.1016/j.nutres.2018.06.009. [DOI] [PMC free article] [PubMed] [Google Scholar]
- 35.Ackers I., Malgor R. Interrelationship of canonical and non-canonical wnt signalling pathways in chronic metabolic diseases. Diabetes and Vascular Disease Research . 2018;15(1):3–13. doi: 10.1177/1479164117738442. [DOI] [PMC free article] [PubMed] [Google Scholar]
- 36.Hagiwara A., Cornu M., Cybulski N., et al. Hepatic mTORC2 activates glycolysis and lipogenesis through Akt, glucokinase, and SREBP1c. Cell Metabolism . 2012;15(5):725–738. doi: 10.1016/j.cmet.2012.03.015. [DOI] [PubMed] [Google Scholar]
Associated Data
This section collects any data citations, data availability statements, or supplementary materials included in this article.
Supplementary Materials
Table S1. Clinical characteristics by quartiles of the serum afamin levels. See table S1 in the Supplementary Material.
Data Availability Statement
The data used to support the findings of this study are available from the corresponding author upon request.