

Abstract
Objective
Higher protein intake during weight loss is associated with better health outcomes, but whether this is because of improved diet quality is not known. The purpose of this study was to examine how the change in self‐selected protein intake during caloric restriction (CR) alters diet quality and lean body mass (LBM).
Methods
In this analysis of pooled data from multiple weight loss trials, 207 adults with overweight or obesity were examined before and during 6 months of CR (approximately 10 food records/person). Body composition was measured by dual‐energy x‐ray absorptiometry. Diet quality was assessed using the Healthy Eating Index in 2 groups: lower (LP) and higher (HP) protein intake.
Results
Participants (mean [SD], 54 [11] years; 29 [4] kg/m2) lost 5.0% (5.4%) of weight. Protein intake was 79 (9) g/d (1.0 [0.2] g/kg/d) and 58 (6) g/d (0.8 [0.1] g/kg/d) in the HP and LP groups, respectively (p < 0.05), and there was an attenuated LBM (kilograms) loss in the HP (−0.6% [1.5%]) compared with the LP (−1.2% [1.4%]) group (p < 0.01). The increased Healthy Eating Index score in the HP compared with the LP group was attributed to greater total protein and green vegetable intake and reduced refined grain and added‐sugar intake (p < 0.05).
Conclusions
Increasing dietary protein during CR improves diet quality and may be another reason for reduced LBM, but it requires further study.
Study Importance.
What is already known?
-
►
Obesity is a heterogeneous disease often associated with a poor‐quality diet.
-
►
Intensive nutrition counseling for weight loss (WL) can increase diet quality; however, the role of higher protein intake on diet quality during caloric restriction (CR) is not known.
-
►
Understanding the link between diet quality and protein intake during WL is important because higher dietary protein during weight‐stable conditions is associated with attenuated loss of lean body mass (LBM) and other reported health benefits.
What are the new findings?
-
►
Individuals with overweight and obesity improved the quality of their diet more with a higher (79 g/d) compared with a lower (58 g/d) protein intake.
-
►
Individuals who self‐select a diet with higher protein intake during CR, compared with lower intake, also reduced intake of low‐ or zero‐protein foods, including refined grains and added sugar, and increased intake of green vegetables.
-
►
Greater protein intake and better diet quality during CR attenuate loss of LBM.
How might these results change the focus of clinical practice?
-
►
Moderately higher protein intake (1.0 g/kg/d) at 20% of energy intake with WL counseling can be encouraged for successful weight loss, to improve diet quality, and to attenuate loss of LBM.
-
►
Counseling for weight management that recognizes that there is a wide potential range of protein intake that is interconnected to other food choices may improve the quality of advice to patients.
INTRODUCTION
Individuals with overweight or obesity often have poor‐quality diets that lack fruits and vegetables, whole grains, and legumes and contain excessive amounts of added sugar and saturated, compared with unsaturated, fatty acids (1), which can lead to higher risk of greater weight gain and chronic disease (2, 3). Weight loss (WL) of 5% to 10% may prevent chronic disease (4); however, WL diets that restrict energy also reduce healthy food and micronutrient intake (5). The effect of higher protein intake during WL on health outcomes has been reported extensively, and there is evidence that it can promote a healthy body weight, attenuate loss of muscle mass (6, 7), and reduce chronic disease (8, 9, 10). In addition, it was shown that dietary protein contributes to nutrient adequacy in the general population (11). However, the impact of self‐selected dietary protein on diet quality has not been examined, to our knowledge, in a longitudinal study (11), such as during caloric restriction (CR). The link between protein intake and diet quality is important because diet quality is suboptimal in the US, and higher‐protein WL diets are popular. In addition, the nutrient adequacy in populations consuming lower energy intake, such as in young children and older individuals, or during calorie‐restricted diets requires more research. It is possible that, if dietary protein affects intake of other foods and diet quality, this can provide further insight into outcomes associated with low‐calorie higher‐protein diets.
Epidemiological studies have indicated that use of diet quality indices, rather than single nutrients or food intake in isolation, provides a comprehensive analysis of dietary intake (12). The Healthy Eating Index (HEI) aligns with key recommendations of the Dietary Guidelines for Americans, with a goal to achieve recommended nutrient intakes within the recommended energy intakes (13). The proportional scoring structure of HEI (14) is an appropriate metric to examine longitudinal change such as in a WL trial. Evidence has indicated that a better diet quality has health benefits and that it is associated with reduced weight gain (2) or greater WL (15, 16); however, little is known about how HEI is influenced by protein content of the diet.
To address the knowledge gaps, a pooled analysis of completed trials was performed to maximize the number of participants undergoing a similar protocol for moderate WL. Lifestyle modification (i.e., diet and behavior therapy) using group counseling was delivered in 16 sessions over 6 months (17, 18), similar to that recommended by the Guidelines (2013) for Managing Overweight and Obesity in Adults (18). The primary goal in this study was to determine how changes in self‐selected protein intake during CR affect intake of other foods (with low or zero protein), diet quality using HEI‐2015, and nutrient adequacy during 6 months of WL in adults with overweight and obesity. Whether changes in protein intake and other foods in the diet are associated with lean body mass (LBM) after WL in this population was also examined. It was hypothesized that higher protein intake during WL would improve diet quality and attenuate LBM loss compared with lower protein intake.
METHODS
Trial designs
This analysis included pooled data of multiple trials from the same laboratory at Rutgers University (19, 20, 21, 22, 23) in which participants followed a 6‐ to 12‐month WL intervention, with weekly counseling sessions during the first 8 weeks and at least twice monthly sessions thereafter with a registered dietitian nutritionist (RD/RDN). Because all participants completed 6 months of WL, this time point was used for the current analysis.
This group of WL trials in our laboratory that were funded by the NIH (AG‐12161) are included in the Osteoporosis, Weight Loss, and Endocrine database (OWLE). Trial registration of the original studies is at ClinicalTrials.gov NCT01631292, NCT00473031, NCT00472745, and NCT00472680 (Supporting Information Table S1). These clinical trials were selected because participants had BMI > 25 kg/m2 and participated in at least 6 months of nutrition education and behavior modification using similar protocols. Additionally, there was consistency among these trials, with study staff adhering to evidence‐based practices (i.e., RDN) and standard operating procedures to enhance validity.
The study was conducted according to the guidelines of the Declaration of Helsinki and approved by the Institutional Review Board of Rutgers University, the State University of New Jersey (protocol code 94‐011 and 11/20/2020). Informed consent was obtained from all participants involved in the study.
In the original trials, participants received calcium and vitamin D supplementation or assignment to high or normal protein groups. All participants were encouraged to lose weight following a 500‐calorie‐deficit diet and to consume healthier foods using the Academy of Nutrition and Dietetics/American Diabetes Association’s Food Lists for Weight Management. Participants included in these studies were advised to consume protein intake (18% of the calories) from less‐processed sources (i.e., poultry, red meat, fish, legumes, and dairy). The subset (n = 24) included in this study who were encouraged to consume higher protein intake (23) reported intake ranging from 13% to 29%, which was similar to the other 183 participants who were asked to consume 18% protein (10%‐28%).
Participants were informed on procedures for reporting accurate food records during initial phases of screening and intervention. Baseline 24‐hour recall and monthly food records were documented. Physical activity level was based on the reported time spent walking for exercise or other walking and scored from 0 to 3 (24). All participants were advised to maintain their usual physical activity during the intervention. Height at baseline and monthly weight were measured on a stadiometer and digital balance scale, respectively. Body composition (fat mass and LBM) was assessed using dual‐energy x‐ray absorptiometry (Lunar Prodigy Advance, GE Healthcare) at baseline and 6 months.
Participants
In the original WL trials, adult women and men with overweight and obesity were screened between 2000 and 2012 for eligibility in the primary WL studies (19, 20, 21, 22, 23). Participants were recruited from the New York‐New Jersey‐Pennsylvania metropolitan area in the US. Participants between the ages of 24 and 75 years with BMI of 25 to 40 (≥23 if Asian) were recruited for these studies. A brief physical examination, for screening purposes, confirmed that all participants met inclusion criteria, as described previously (19, 20, 21, 22, 23). Participants randomized to weight maintenance in these trials were excluded from this analysis. Participants were also excluded from this analysis if they did not report a 24‐hour recall at baseline or did not report food records during the intervention. Participants completed an informed consent before enrollment in the original clinical trials, approved by the Rutgers University Institutional Review Board.
In a previous study (25), with a 16% difference in HEI between groups (WL with a 2.3% greater protein intake than weight maintenance control individuals), a sample size of at least 21 per group would provide 90% power to detect a difference in HEI due to WL. In another study examining HEI among individuals who eat animal‐protein products, an estimated group of at least 63 persons was needed to detect a 4.8‐score difference between groups (β of 0.90 and α of 0.05) (26). Based on these 2 studies, and allowing for some missing data, we estimated that, with 1 covariate, 100 persons per group would be needed.
Dietary assessment and calculations
Food records that were collected from the original trials were never previously analyzed or reported. Baseline 24‐hour recall and food records were collected monthly using forms provided by the laboratory and validated by an RD. Over the WL duration, 3‐day food records (2 weekdays, 1 weekend day per week) were entered at 1 month, 3 months, and 6 months. These food records were entered by the RD or staff (verified by the RD) into Automated Self‐Administered 24‐hour Dietary Assessment Tool (ASA24, US version; National Cancer Institute [NCI]‐NIH). Diet quality, nutrient intake, and sources of dietary protein (red meat, processed meat, poultry, organ meat, seafood, eggs, soy, nuts, seeds, and legumes) were examined.
The HEI encourages intake of fruits, vegetables, whole grains, and protein foods high in fiber and unsaturated fats. Additionally, HEI discourages intake of saturated fatty acids (SFAs), refined grains, added sugar, and sodium. The HEI (calculated with SAS version 9.4 code, SAS Institute, Inc.; NCI and US Department of Agriculture [USDA]) has 13 food components (scored as 0‐5 or 0‐10) with a maximum score of 100 (14). The food components include the following: whole grains; total fruit (includes fruit juice); whole fruit (excludes fruit juice); total vegetables; greens and beans (dark green vegetables and all types of legumes); total protein foods (meat, poultry, eggs, and legumes); seafood and plant proteins (fish, shellfish, nuts, seeds, legumes, and soy foods [not beverages]); dairy (milk, yogurt, cheese, and fortified soy beverages); and fatty acids ratio (polyunsaturated and monounsaturated fatty acids to SFAs). Foods that are unfavorable to HEI include the following: refined grains, sodium, added sugar, and SFAs (13). The HEI incorporates energy intake into the score, making it applicable for CR diets that vary in calories. Unlike other indices that use population means or a dichotomous scoring structure for comparing populations, HEI uses proportional scoring, making it better suited to track change over time. It also includes a greater range of protein sources to address questions related to dietary protein in this study.
Statistical analysis
Descriptive statistics were used to define baseline characteristics. Data were assessed for skewness and normality, and Levene’s test for equal variances analyzed homoscedasticity. To examine change in dietary protein from baseline to CR, the sample population was divided by the median (lower protein [LP] and higher protein [HP]). Mixed models ANCOVA was used to assess how longitudinal change in dietary protein affected change in other foods in the LP or HP groups (controlled for baseline protein intake). One‐way ANCOVA assessed change in body composition between protein groups, controlling for age and sex. A sensitivity analysis was also performed using mixed model ANCOVA with dietary protein examined as a continuous rather than categorical variable. Multiple imputation was used to handle partial missing body composition data (n = 8). A sensitivity analysis was completed to compare findings with and without multiple imputation for body composition. Multiple linear regression was used to determine the extent that protein sources contributed to change in protein intake and LBM in the total sample. In addition, multiple linear regression was used to determine how change in protein intake contributed to change in micronutrient intake (adjusted for age, sex, and BMI) and to determine which food components predicted improvement in HEI during CR. SPSS Statistics version 27 (IBM Corp.) was used for the analyses.
RESULTS
Participant characteristics
There were 314 individuals who participated in the trials, and 272 were assigned to WL and measured for body composition at baseline and 6 months (Supporting Information Figure S1). Participants (n = 209) who recorded intake at baseline and during the intervention were eligible for this study. Two participants were removed for lack of feasibility of reported dietary intake: one because of very low protein and energy intake during WL and one as an outlier for high protein intake (>3 SD). Analysis included 24‐hour recalls at baseline (n = 207) and 1,870 food records during CR (~10 days of intake/person). This sample is predominantly female (88%) and White (85%), and most have overweight (BMI: 29.1 [4.1]; Table 1). Baseline body weight did not differ significantly between the LP (77.3 [14.1] kg) and HP groups (81.1 [14.7] kg). Fat mass and LBM also did not differ between groups (LP [LBM: 42.6 (8.3) kg, fat mass: 32.3 (7.7) kg] and HP [LBM: 44.9 (8.6) kg, fat mass: 34.8 (9.0) kg]).
TABLE 1.
Baseline characteristics
| Age (y) | 54.4 ± 10.7 |
| Female | 183 (88%) |
| Race/ethnicity | |
| White | 176 (85%) |
| Black | 24 (12%) |
| Other | 7 (3%) |
| Weight (kg) | 79.7 ± 14.6 |
| Lean mass | 33.5 ± 8.4 |
| Fat mass | 43.8 ± 8.5 |
| BMI (kg/m2) | 29.1 ± 4.1 |
| Overweight (BMI 25‐29.9) | 138 (67%) |
| Obesity (BMI ≥30) | 69 (33%) |
| Dietary intake | |
| Energy (kcal/d) | 1,829 ± 626 |
| Protein (% kcal) | 17.5 ± 5.3 |
| Carbohydrate (% kcal) | 48.9 ± 9.9 |
| Fat (% kcal) | 33.7 ± 8.5 |
Data given as means ± SD or n (%). n = 207.
CR
Participants lost 5.0% (5.4%; p < 0.001) of their baseline body weight (79.7 [14.6] kg). During CR, the LP group consumed less protein, at 58.3 [6.6] g/d, compared with the HP group, at 78.6 [9.4] g/d (Table 2). In addition, the percentage protein intake during CR was lower in the LP (17.8% [2.9%]) compared with the HP group (19.9 [2.8%]; p < 0.001). During CR, carbohydrates (LP: 51% [5.3%] vs. HP: 47.4% [5.8%]) differed between groups (p < 0.001). Dietary fat intake averaged 32.8% [4.8%], and it did not differ between groups. The physical activity level score was 1.0 (0.7), and physical activity did not differ significantly between the LP and HP groups or change over time. Both protein groups lost a similar amount of weight and fat mass during CR, but there was a greater decrease in LBM in the LP compared with the HP group (p < 0.01), whether calculated as percentage (not shown) or kilogram loss (Figure 1).
TABLE 2.
Mixed models assessment of diet quality food scores before and during caloric restriction by protein intake
| Baseline | Caloric restriction | p value, interaction | ||
|---|---|---|---|---|
| (n = 207) | LP | HP | ||
| Dietary protein | ||||
| Intake (g/d) | 77.8 ± 29.2 | 58.29 ± 6.6 | 78.56 ± 9.4 | <0.001 |
| Intake (g/kg/d) | 0.99 ± 0.38 | 0.84 ± 0.14 | 1.01 ± 0.21 | <0.001 |
| HEI components (total score) | ||||
| Total protein (5) | 4.4 ± 1.2 | 4.1 ± 0.7 | 4.5 ± 0.5 | <0.001 |
| Seafood/plant protein (5) | 2.9 ± 2.3 | 2.5 ± 1.2 | 3.2 ± 1.1 | <0.001 |
| Total dairy (10) | 5.3 ± 3.4 | 6.1 ± 1.8 | 6.1 ± 1.8 | 0.028 |
| Total vegetables (5) | 3.5 ± 1.6 | 3.9 ± 0.8 | 3.8 ± 0.7 | 0.821 |
| Greens and beans (5) | 2.4 ± 2.3 | 2.4 ± 1.2 | 2.6 ± 1.1 | 0.004 |
| Total fruit (5) | 2.9 ± 2.0 | 3.5 ± 1.1 | 3.1 ± 1.2 | 0.431 |
| Whole fruit (5) | 3.1 ± 2.2 | 3.6 ± 1.2 | 3.5 ± 1.1 | 0.822 |
| Whole grains (10) | 3.4 ± 3.6 | 3.7 ± 2.1 | 4.1 ± 2.2 | 0.533 |
| Refined grains a (10) | 5.8 ± 3.8 | 6.4 ± 1.9 | 6.7 ± 2.1 | <0.001 |
| MUFA+PUFA/SFA (10) | 5.0 ± 3.9 | 5.7 ± 1.8 | 5.5 ± 1.6 | 0.642 |
| SFA a (10) | 6.0 ± 3.6 | 7.0 ± 1.5 | 6.4 ± 1.9 | 0.205 |
| Added sugar a (10) | 8.0 ± 2.3 | 7.8 ± 1.5 | 8.3 ± 1.2 | 0.039 |
| Sodium a (10) | 3.6 ± 3.3 | 3.7 ± 1.9 | 3.2 ± 1.6 | 0.873 |
| HEI (100) | 56.5 ± 18.5 | 60.4 ± 8.0 | 60.9 ± 7.6 | 0.010 |
Values are reported as means ± SD. The LP (n = 104) and HP (n = 103) groups are shown using linear mixed models ANCOVA (controlling for baseline protein intake). Baseline diet quality and HEI component scores did not differ significantly between groups, and dietary protein (percentage of energy intake) was 17.8% ± 2.9% and 19.9% ± 2.8% in the LP and HP groups, respectively (p < 0.001).
Abbreviations: HEI, Healthy Eating Index‐2015; HP, higher protein; LP, lower protein; MUFA, monounsaturated fatty acid; PUFA, polyunsaturated fatty acid; SFA, saturated fatty acid.
HEI moderation component (higher score indicates lower intake and healthier diet).
FIGURE 1.
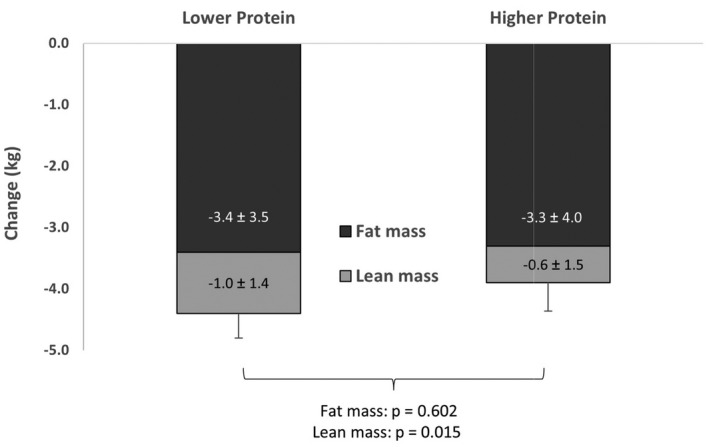
Body composition change due to 6 months of weight loss. Values are means ± SD for change in fat, lean mass, and total weight (kilograms), and they compare the lower protein (n = 104) and higher protein (n = 103) groups using ANCOVA (adjusted for age and sex)
Diet quality
The HEI score improved in the entire sample from baseline to CR over 6 months (p < 0.05). Multiple linear regression models were constructed to determine foods that contributed to the improved HEI with CR, indicating that total fruit, whole grains, refined grains, dairy, and seafood/plant protein sources all contributed to the rise in HEI in the unadjusted and adjusted models (p < 0.05; Supporting Information Table S3). In the HP group, compared with the LP group, HEI component scores that improved during CR include dairy, added sugar (p < 0.05), total protein, seafood/plant protein, refined grains, and vegetable greens and beans (p < 0.01; Table 2). Diet quality (HEI) improved over time in both groups, with a greater increase in the HP compared with the LP group (p < 0.05; Table 2). Intake of SFAs (23.3 [14.5] g), added sugar (46.8 [38.1] g), refined grains (171 [83] g), and sodium (31.8 [11.8] g) decreased during CR (p < 0.05), but they did not differ between groups. In the sensitivity analysis, using protein as a continuous variable, protein intake also contributed significantly to the increase in HEI and the same dietary components. The change in protein intake by group was also analyzed (mixed models ANCOVA) and this indicated that HP improved scores for HEI and certain food components (Supporting Information Figure S2).
Total protein intake was 68.4 (3.0) g/d in the entire sample during CR and was largely from animal protein (46.8 [16.3] g/d). Protein sources that accounted for 70% of variance for the change in protein intake from baseline to CR were poultry, unprocessed red meat, seafood, cured meat, cheese, milk, eggs, and nuts/seeds (F = 50.6; p < 0.001; Supporting Information Table S2). Protein sources that were not consumed in significant quantity and that did not contribute to the change in protein intake were organ meats, legumes, yogurt, and soy products. In addition, of all protein sources, only poultry accounted for the variance in LBM change, with β = 0.433 (95% CI: 0.042‐0.824; p < 0.05; not shown). Furthermore, when examining whether food categories (fruits, vegetables, grains, protein, dairy, and oils/fat) could explain the variance for LBM change, only total protein could (β = 1.919; 95% CI: 1.384‐2.455; p < 0.001).
Micronutrients
Baseline nutrient intake was below the recommended daily allowance for calcium, magnesium, potassium, choline, fiber, and vitamins D and E. Micronutrient intake further decreased (p < 0.05) for all micronutrients during CR, except for vitamins K, D, C, B12, and A. In addition, a greater intake of protein during CR was associated with most vitamins and minerals (excluding vitamin B1, folate, vitamin E, copper, and iron; Table 3).
TABLE 3.
Regression coefficients and 95% CIs examining the contribution of protein intake on change in micronutrient intake from baseline to caloric restriction
| Vitamin | β (95% CI) | p value | Mineral | β (95% CI) | p value |
|---|---|---|---|---|---|
| Vitamin B3 | 0.267 (0.224 to 0.310) | <0.001 | Selenium | 1.087 (0.894 to 1.281) | <0.001 |
| Choline | 3.706 (3.142 to 4.271) | <0.001 | Phosphorus | 9.670 (8.277 to 11.062) | <0.001 |
| Vitamin B6 | 0.023 (0.017 to 0.029) | <0.001 | Potassium | 15.320 (11.086 to 19.553) | <0.001 |
| Vitamin D | 0.090 (0.059 to 0.121) | <0.001 | Sodium | 12.884 (7.374 to 18.395) | <0.001 |
| Vitamin B2 | 0.010 (0.006 to 0.013) | <0.001 | Zinc | 0.053 (0.030 to 0.077) | <0.001 |
| Vitamin K | 1.935 (0.819 to 3.051) | <0.001 | Magnesium | 1.075 (0.502 to 1.649) | <0.001 |
| Vitamin B12 | 0.077 (0.027 to 0.127) | 0.003 | Calcium | 2.519 (0.266 to 4.772) | 0.029 |
| Vitamin A | 8.393 (2.948 to 13.838) | 0.003 | Copper | 0.007 (−0.001 to 0.016) | 0.088 |
| Vitamin C | 0.518 (0.032 to 1.004) | 0.037 | Iron | −0.022 (−0.057 to 0.012) | 0.205 |
| Vitamin B1 | 0.004 (−0.002 to 0.009) | 0.165 | |||
| Folate | 0.138 (−1.029 to 1.305) | 0.816 | |||
| Vitamin E | 0.005 (−0.028 to 0.037) | 0.767 |
n = 207; controlled for energy, age, sex, and BMI.
DISCUSSION
A higher quality diet is associated with WL, largely attributed to higher fiber, fruit, and vegetable intake and controlled portion sizes (15, 16). Consistent with this, individuals in the current study showed an improvement in diet quality during CR compared with baseline. In addition, higher protein intake during CR has been shown to contribute to certain health outcomes (10). These benefits may be attributed to a higher protein intake alone and/or alterations in dietary patterns caused by change in protein intake. To our knowledge, no previous study has examined how the amount of protein intake during CR affects diet quality. In this study, we used multiple food records during 6 months of WL to examine whether change in self‐selected dietary protein affects diet quality and food component scores. We found that individuals with higher protein intake (79 g/d), compared with lower protein (58 g/d) intake, during CR had a greater improvement in diet quality. In addition, change in protein intake in the HP compared with the LP group resulted not only in greater total protein and dairy scores (as expected) but also greater intake of dark green vegetables and reduced intake of refined grains and added sugar. Overall, WL in individuals consuming higher compared with lower protein intake attenuated loss of LBM, which was somewhat expected, but also altered low‐ or zero‐protein foods, which improved diet quality.
In this study, individuals who self‐selected higher protein intake during CR lost less LBM than those who consumed lower protein intake. An increased protein intake of 1.0 g/kg/d is not especially high, and adherence to this should be achievable with nutrition counseling, even in individuals who typically consume low protein intakes. The benefits of more LBM and greater insulin sensitivity with increased protein intake have been studied extensively (7, 27, 28, 29, 30); however, there is still lack of clarity regarding whether the health benefits are entirely due to protein intake alone when individuals are self‐selecting sources of protein during WL (31). The Preventing Obesity Using Novel Dietary Strategies (POUNDS) Lost trial examined 2 levels of protein intake (18% and 20% of calories), indicating only a trend for greater LBM loss in the LP group (32). This protein intake is comparable to the LP and HP groups in our current study, which indicated a significantly greater loss of LBM due to LP intake. The POUNDS Lost study (57% women) showed that there was a greater LBM loss in women than in men (33), and this may one reason for greater LBM differences between groups in the current study, which also had a greater proportion of women (88%).
In the Health, Aging and Body Composition study (Health ABC), self‐selected protein intake was examined over 3 years in 2,066 older individuals who were not undergoing WL (30). In this study (30), the lower and upper 2 quintiles of protein consumed were 55 g/d compared with 79 g/d, and change in LBM was −0.9 kg and −0.5 kg in the 2 groups, respectively. In the current WL study, the LP and HP groups consumed 58 and 79 g/d of protein, with LBM change of −1.0 and −0.6 kg, respectively. Together, these findings suggest that a higher dietary protein of about 80 g/d (or 1 g/kg/d) preserves LBM compared with a normal protein intake (of ~60 g/d or 0.8 g/kg/d) and that this may be especially important to consider in women and elderly populations who are more susceptible to consuming inadequate dietary protein. The current study indicated that, during reduced energy intake, lean protein sources (largely poultry) accounted for a significant proportion of variance in LBM change during WL. Other factors such as the reported physical activity were low in this population and they did not differ between groups or over time; therefore, they do not explain the attenuated LBM loss in the HP group. In individuals who are not losing weight, diet quality is associated with higher LBM, with or without physical activity (34). Understanding how to preserve LBM during CR continues to be a concern in the field, and future studies might explore further whether protein sources in combination with other foods affect LBM.
Identifying high‐quality proteins and the amount required for sufficient intake, which are influenced by several variables, remains controversial. Most measures of protein quality by amino acid composition and digestibility (protein digestibility‐corrected amino acid score and digestible indispensable amino acid score) suggest that proteins from animal sources are more complete to varying degrees than plant sources (35). However, other nutrients often consumed in excess in the Western diet that tend to accompany animal‐protein intake may reduce the benefit of including “complete” proteins in the diet. For example, observational studies have shown that, in individuals who are not dieting, protein consumption from animal sources is associated with a dietary pattern that has a greater intake of saturated fat, cholesterol, sodium, and added sugar and less fiber, all of which lower diet quality (36, 37). However, unlike reported high intakes of added sugar and sodium, SFA intake in the US (although still high) has been shown to be closer to recommended levels (≤10% of total energy intake, or ≤22 g/d) (38). This is consistent with findings in this study, showing that SFA intake was 23 g/d at baseline and decreased to 17 g/d in both protein groups during CR. In this study, a greater intake of total protein during CR was largely from lean meats such as poultry and unprocessed red meat, as well as seafood, dairy, and nuts and seeds. Consequently, HEI components such as sodium and SFAs that may have worsened with increased total protein intake were at healthier levels during CR and they did not differ between protein groups. Multiple other studies have shown that individuals consuming plant‐based diets meet protein needs and have a higher quality diet than omnivores (36, 39), but this tends to be driven by fruit and vegetable intake, not necessarily higher quality protein intake (35). One study concluded that diets with protein sources that are predominantly from lean meat or plant sources have similar diet quality (40). In this study, we showed that higher protein intake (from lean animal and plant sources), with dietary counseling to support WL, can contribute to a healthier dietary pattern, as indicated by a lower consumption of refined grains and added sugar and a higher consumption of green vegetables.
In addition to a high‐quality diet, micronutrient intake contributes to nutrient adequacy during CR, and high‐protein foods have been shown to be good sources of minerals (11). Our data indicated that many of the same nutrients that are below recommended intakes in the general population (41) were also low in participants in this study. Not surprisingly, these micronutrients became further compromised during modest WL. However, greater protein density was positively associated with multiple B vitamins, choline, and vitamins A, C, D, and K, as well as multiple minerals. Others have found that protein from animal sources increases consumption of zinc, potassium, vitamin B12, riboflavin, and folate (11, 40). Protein from plant sources contributes to higher intakes of calcium, copper, folate, potassium, magnesium, and thiamin (11, 42). Our data during CR indicated that protein intake, as well as change in dietary pattern associated with altered protein intake, was an important contributor to increased micronutrient intake.
A strength of this work is that, to our knowledge, no previous study has examined how protein intake during an energy‐restricted diet alters diet quality and patterns of food intake. This sample included pre‐ and postmenopausal women as well as men, increasing generalizability to the American population, but it was largely limited to a White population. Additionally, all participants were counseled by dietitians using the same nutrition‐education behavior‐modification intervention, increasing the consistency of nutrition counseling. This diet prescription and the counseling would be expected to and did improve diet quality. However, because the studies were conducted within one primary location, this could limit generalizability of the findings. Although the lower protein intake may reflect general lower adherence to the provided advice, both groups lost a similar amount of weight, suggesting that adherence to reduced calorie intake was similar between groups. Because methods used in this study to measure LBM do not discern between organ and muscle mass, the greater loss in the LP group during WL cannot be attributed only to muscle mass and its associated health benefits. However, muscle mass (but not organ mass) correlates with WL (43). Another limitation is that individuals with overweight and obesity typically underestimate intake (44). However, because we analyzed 10 food records to estimate dietary intake, and a dietitian educated participants to accurately report food intake and reviewed this with participants to reinforce validity of intake, it is expected that the quality of the nutrient analysis was enhanced (45).
CONCLUSION
These findings indicate that a moderately higher protein intake during CR improves diet quality and attenuates loss of LBM. The self‐selected higher protein intake during WL improves diet quality, largely owing to consumption of low‐fat protein sources, greater intake of green vegetables, and reduced intake of refined grains and added sugar, to better align with the Dietary Guidelines for Americans. Although the findings in this pooled analysis indicate that only dietary protein explained the variability in LBM changes during CR, the link to other food choices should be explored as a possibility in future studies. Accordingly, it would be interesting to determine whether higher self‐selected protein intake that improves diet quality, compared with a protein supplement alone, differentially affects LBM or other health outcomes. Also, future WL studies are needed to determine whether the dietary shifts in relation to self‐selected protein intake are consistent in individuals consuming different ethnic food patterns or in vulnerable populations at risk for meeting nutrient adequacy, such as in children or the elderly.O
CONFLICT OF INTEREST
The authors declared no conflict of interest.
AUTHOR CONTRIBUTIONS
ARO, DS, and SAS collected the data. ARO, YS, and SAS analyzed the data. ARO and SAS wrote the first draft, with contributions from LM and YS. All authors reviewed and commented on subsequent drafts of the manuscript.
CLINICAL TRIAL REGISTRATION
The original trials: ClinicalTrials.gov identifiers: NCT01631292, NCT00473031, NCT00472745, and NCT00472680, and the registration of this study is at: osf.io/67y3n.
Supporting information
Supplementary Material
ACKNOWLEDGMENTS
We are grateful to the RDs (R Zurfluh, N von Thun) who counseled individuals in this study and to M Watford, DPhil, for reviewing the manuscript. This work was supported by the Institute for the Advancement of Food and Nutrition Sciences (IAFNS) Protein Committee. IAFNS is a nonprofit science organization that pools funding from industry collaborators and advances science through the in‐kind and financial contributions from public and private sector participants. [Correction added on 29 June 2022: The Acknowledgments were updated with additional details.]
Ogilvie AR, Schlussel Y, Sukumar D, Meng L, Shapses SA. Higher protein intake during caloric restriction improves diet quality and attenuates loss of lean body mass. Obesity (Silver Spring). 2022;30:1411–1419. doi: 10.1002/oby.23428
Funding information
This data collection and analysis were funded by the Institute for the Advancements of Food and Nutrition Sciences and by the NIH, grant number AG‐12161.
DATA AVAILABILITY STATEMENT
Not applicable owing to Institutional Review Board regulations on open data access for these studies. The data that support the findings of this study are available from the corresponding author upon reasonable request.
REFERENCES
- 1. US Department of Health and Human Services and US Department of Agriculture . 2015‐2020 Dietary Guidelines for Americans. 8th ed. Published December 2015. https://health.gov/our‐work/nutrition‐physical‐activity/dietary‐guidelines/previous‐dietary‐guidelines/2015 [Google Scholar]
- 2. Fung TT, Pan AN, Hou T, et al. Long‐term change in diet quality is associated with body weight change in men and women. J Nutr. 2015;145:1850‐1856. [DOI] [PMC free article] [PubMed] [Google Scholar]
- 3. Quatromoni PA, Pencina M, Cobain MR, Jacques PF, D’Agostino RB. Dietary quality predicts adult weight gain: findings from the Framingham Offspring Study. Obesity (Silver Spring). 2006;14:1383‐1391. [DOI] [PubMed] [Google Scholar]
- 4. Ryan DH, Yockey SR. Weight loss and improvement in comorbidity: differences at 5%, 10%, 15%, and over. Curr Obes Rep. 2017;6:187‐194. [DOI] [PMC free article] [PubMed] [Google Scholar]
- 5. Engel MG, Kern HJ, Brenna JT, Mitmesser SH. Micronutrient gaps in three commercial weight‐loss diet plans. Nutrients. 2018;10:108. doi: 10.3390/nu10010108 [DOI] [PMC free article] [PubMed] [Google Scholar]
- 6. Pasiakos SM, Cao JJ, Margolis LM, et al. Effects of high‐protein diets on fat‐free mass and muscle protein synthesis following weight loss: a randomized controlled trial. FASEB J. 2013;27:3837‐3847. [DOI] [PubMed] [Google Scholar]
- 7. Devkota S, Layman DK. Protein metabolic roles in treatment of obesity. Curr Opin Clin Nutr Metab Care. 2010;13:403‐407. [DOI] [PubMed] [Google Scholar]
- 8. Leidy HJ, Clifton PM, Astrup A, et al. The role of protein in weight loss and maintenance. Am J Clin Nutr. 2015;101:1320S‐1329S. [DOI] [PubMed] [Google Scholar]
- 9. Virtanen HEK, Voutilainen S, Koskinen TT, et al. Dietary proteins and protein sources and risk of death: the Kuopio Ischaemic Heart Disease Risk Factor Study. Am J Clin Nutr. 2019;109:1462‐1471. [DOI] [PubMed] [Google Scholar]
- 10. Drummen M, Tischmann L, Gatta‐Cherifi B, Adam T, Westerterp‐Plantenga M. Dietary protein and energy balance in relation to obesity and co‐morbidities. Front Endocrinol (Lausanne). 2018;9:443. doi: 10.3389/fendo.2018.00443 [DOI] [PMC free article] [PubMed] [Google Scholar]
- 11. Phillips SM, Fulgoni VL 3rd, Heaney RP, Nicklas TA, Slavin JL, Weaver CM. Commonly consumed protein foods contribute to nutrient intake, diet quality, and nutrient adequacy. Am J Clin Nutr. 2015;101:1346S‐1352S. [DOI] [PubMed] [Google Scholar]
- 12. Liese AD, Krebs‐Smith SM, Subar AF, et al. The Dietary Patterns Methods Project: synthesis of findings across cohorts and relevance to dietary guidance. J Nutr. 2015;145:393‐402. [DOI] [PMC free article] [PubMed] [Google Scholar]
- 13. Krebs‐Smith SM, Pannucci TE, Subar AF, et al. Update of the Healthy Eating Index: HEI‐2015. J Acad Nutr Diet. 2018;118:1591‐1602. [DOI] [PMC free article] [PubMed] [Google Scholar]
- 14. US Department of Agriculture . Healthy Eating Index. Accessed February 1, 2022. Updated April 27, 2022. https://www.fns.usda.gov/healthy‐eating‐index‐hei [Google Scholar]
- 15. Christifano DN, Fazzino TL, Sullivan DK, Befort CA. Diet quality of breast cancer survivors after a six‐month weight management intervention: improvements and association with weight loss. Nutr Cancer. 2016;68:1301‐1308. [DOI] [PMC free article] [PubMed] [Google Scholar]
- 16. Ptomey LT, Willis EA, Goetz JR, et al. Portion‐controlled meals provide increases in diet quality during weight loss and maintenance. J Hum Nutr Diet. 2016;29:209‐216. [DOI] [PMC free article] [PubMed] [Google Scholar]
- 17. Heymsfield SB, Wadden TA. Mechanisms, pathophysiology, and management of obesity. N Engl J Med. 2017;376:1492. [DOI] [PubMed] [Google Scholar]
- 18. Jensen MD, Ryan DH, Apovian CM, et al. 2013 AHA/ACC/TOS guideline for the management of overweight and obesity in adults: a report of the American College of Cardiology/American Heart Association Task Force on Practice Guidelines and the Obesity Society. J Am Coll Cardiol. 2014;63:2985‐3023. [DOI] [PubMed] [Google Scholar]
- 19. Pop LC, Sukumar D, Schneider SH, et al. Three doses of vitamin D, bone mineral density, and geometry in older women during modest weight control in a 1‐year randomized controlled trial. Osteoporos Int. 2017;28:377‐388. [DOI] [PubMed] [Google Scholar]
- 20. Pop LC, Sukumar D, Tomaino K, et al. Moderate weight loss in obese and overweight men preserves bone quality. Am J Clin Nutr. 2015;101:659‐667. [DOI] [PMC free article] [PubMed] [Google Scholar]
- 21. Riedt CS, Cifuentes M, Stahl T, Chowdhury HA, Schlussel Y, Shapses SA. Overweight postmenopausal women lose bone with moderate weight reduction and 1 g/day calcium intake. J Bone Miner Res. 2005;20:455‐463. [DOI] [PMC free article] [PubMed] [Google Scholar]
- 22. Riedt CS, Schlussel Y, von Thun N, et al. Premenopausal overweight women do not lose bone during moderate weight loss with adequate or higher calcium intake. Am J Clin Nutr. 2007;85:972‐980. [DOI] [PMC free article] [PubMed] [Google Scholar]
- 23. Sukumar D, Ambia‐Sobhan H, Zurfluh R, et al. Areal and volumetric bone mineral density and geometry at two levels of protein intake during caloric restriction: a randomized, controlled trial. J Bone Miner Res. 2011;26:1339‐1348. [DOI] [PMC free article] [PubMed] [Google Scholar]
- 24. Haskell WL, Lee I‐M, Pate RR, et al. Physical activity and public health: updated recommendation for adults from the American College of Sports Medicine and the American Heart Association. Med Sci Sports Exerc. 2007;39:1423‐1434. [DOI] [PubMed] [Google Scholar]
- 25. Pascual RW, Phelan S, La Frano MR, Pilolla KD, Griffiths Z, Foster GD. Diet quality and micronutrient intake among long‐term weight loss maintainers. Nutrients. 2019;11:3046. doi: 10.3390/nu11123046 [DOI] [PMC free article] [PubMed] [Google Scholar]
- 26. Clarys P, Deliens T, Huybrechts I, et al. Comparison of nutritional quality of the vegan, vegetarian, semi‐vegetarian, pesco‐vegetarian and omnivorous diet. Nutrients. 2014;6:1318‐1332. [DOI] [PMC free article] [PubMed] [Google Scholar]
- 27. Kim JE, O’Connor LE, Sands LP, Slebodnik MB, Campbell WW. Effects of dietary protein intake on body composition changes after weight loss in older adults: a systematic review and meta‐analysis. Nutr Rev. 2016;74:210‐224. [DOI] [PMC free article] [PubMed] [Google Scholar]
- 28. Smith JD, Hou T, Ludwig DS, et al. Changes in intake of protein foods, carbohydrate amount and quality, and long‐term weight change: results from 3 prospective cohorts. Am J Clin Nutr. 2015;101:1216‐1224. [DOI] [PMC free article] [PubMed] [Google Scholar]
- 29. Wycherley TP, Moran LJ, Clifton PM, Noakes M, Brinkworth GD. Effects of energy‐restricted high‐protein, low‐fat compared with standard‐protein, low‐fat diets: a meta‐analysis of randomized controlled trials. Am J Clin Nutr. 2012;96:1281‐1298. [DOI] [PubMed] [Google Scholar]
- 30. Houston DK, Nicklas BJ, Ding J, et al. Dietary protein intake is associated with lean mass change in older, community‐dwelling adults: the Health, Aging, and Body Composition (Health ABC) Study. Am J Clin Nutr. 2008;87:150‐155. [DOI] [PubMed] [Google Scholar]
- 31. Cava E, Yeat NC, Mittendorfer B. Preserving healthy muscle during weight loss. Adv Nutr. 2017;8:511‐519. [DOI] [PMC free article] [PubMed] [Google Scholar]
- 32. Sacks FM, Bray GA, Carey VJ, et al. Comparison of weight‐loss diets with different compositions of fat, protein, and carbohydrates. N Engl J Med. 2009;360:859‐873. [DOI] [PMC free article] [PubMed] [Google Scholar]
- 33. Tirosh A, de Souza RJ, Sacks F, Bray GA, Smith SR, LeBoff MS. Sex differences in the effects of weight loss diets on bone mineral density and body composition: POUNDS LOST Trial. J Clin Endocrinol Metab. 2015;100:2463‐2471. [DOI] [PMC free article] [PubMed] [Google Scholar]
- 34. Xu F, Greene GW, Earp JE, et al. Relationships of physical activity and diet quality with body composition and fat distribution in US adults. Obesity (Silver Spring). 2020;28:2431‐2440. [DOI] [PubMed] [Google Scholar]
- 35. Food and Agriculture Association of the United Nations. Dietary Protein Quality Evaluation in Human Nutrition. FAO Food and Nutrition Paper 92. FAO. 2013. [PubMed] [Google Scholar]
- 36. Aggarwal A, Drewnowski A. Plant‐ and animal‐protein diets in relation to sociodemographic drivers, quality, and cost: findings from the Seattle Obesity Study. Am J Clin Nutr. 2019;110:451‐460. [DOI] [PMC free article] [PubMed] [Google Scholar]
- 37. Richter CK, Skulas‐Ray AC, Champagne CM, Kris‐Etherton PM. Plant protein and animal proteins: do they differentially affect cardiovascular disease risk? Adv Nutr. 2015;6:712‐728. [DOI] [PMC free article] [PubMed] [Google Scholar]
- 38. Shan Z, Rehm CD, Rogers G, et al. Trends in dietary carbohydrate, protein, and fat intake and diet quality among US Adults, 1999–2016. JAMA. 2019;322:1178‐1187. [DOI] [PMC free article] [PubMed] [Google Scholar]
- 39. Parker HW, Vadiveloo MK. Diet quality of vegetarian diets compared with nonvegetarian diets: a systematic review. Nutr Rev. 2019;77:144‐160. [DOI] [PubMed] [Google Scholar]
- 40. Nicklas TA, O’Neil CE, Zanovec M, Keast DR, Fulgoni VL 3rd. Contribution of beef consumption to nutrient intake, diet quality, and food patterns in the diets of the US population. Meat Sci. 2012;90:152‐158. [DOI] [PubMed] [Google Scholar]
- 41. Webber KH, Lee E. The diet quality of adult women participating in a behavioural weight‐loss programme. J Hum Nutr Diet. 2011;24:360‐369. [DOI] [PubMed] [Google Scholar]
- 42. Dikariyanto V, Berry SE, Pot GK, Francis L, Smith L, Hall WL. Tree nut snack consumption is associated with better diet quality and CVD risk in the UK adult population: National Diet and Nutrition Survey (NDNS) 2008–2014. Public Health Nutr. 2020;23:3160‐3169. [DOI] [PMC free article] [PubMed] [Google Scholar]
- 43. Bosy‐Westphal A, Kossel E, Goele K, et al. Contribution of individual organ mass loss to weight loss‐associated decline in resting energy expenditure. Am J Clin Nutr. 2009;90:993‐1001. [DOI] [PubMed] [Google Scholar]
- 44. Lichtman SW, Pisarska K, Berman ER, et al. Discrepancy between self‐reported and actual caloric intake and exercise in obese subjects. N Engl J Med. 1992;327:1893‐1898. [DOI] [PubMed] [Google Scholar]
- 45. Kos J, Bättig K. Comparison of an electronic food diary with a nonquantitative food frequency questionnaire in male and female smokers and nonsmokers. J Am Diet Assoc. 1996;96:283‐285. [DOI] [PubMed] [Google Scholar]
Associated Data
This section collects any data citations, data availability statements, or supplementary materials included in this article.
Supplementary Materials
Supplementary Material
Data Availability Statement
Not applicable owing to Institutional Review Board regulations on open data access for these studies. The data that support the findings of this study are available from the corresponding author upon reasonable request.