

Abstract
Androgen deprivation therapy suppresses tumor androgen receptor (AR) signaling by depleting circulating testosterone and is a mainstay treatment for advanced prostate cancer. Despite initial treatment response, castration-resistant prostate cancer nearly always develops and remains driven primarily by the androgen axis. Here we investigated how changes in oxygenation affect androgen synthesis. In prostate cancer cells, chronic hypoxia coupled to reoxygenation resulted in efficient metabolism of androgen precursors to produce androgens and activate AR. Hypoxia induced 3βHSD1, the rate-limiting androgen synthesis regulator, and reoxygenation replenished necessary cofactors, suggesting that hypoxia and reoxygenation both facilitate potent androgen synthesis. The EGLN1/VHL/HIF2α pathway induced 3βHSD1 expression through direct binding of HIF2α to the 5’ regulatory region of HSD3B1 to promote transcription. Overexpression of HIF2α facilitated prostate cancer progression, which largely depended on 3βHSD1. Inhibition of HIF2α with the small molecule PT2399 prevented prostate cancer cell proliferation. These results thus identify HIF2α as a regulator of androgen synthesis and potential therapeutic target in prostate cancer.
Keywords: androgen synthesis, hypoxia, metabolism, prostate cancer, 3βHSD1
Introduction:
Prostate cancer is the most commonly diagnosed non-skin cancer in men in the United States. Prostate cancer growth is largely dependent on the activation of androgen receptor (AR), a nuclear receptor, by androgens such as testosterone (T) and the more potent dihydrotestosterone (DHT)(1–3). Thus, androgen deprivation therapy (ADT) by medical or surgical castration, now often combined with other agents, is standard treatment (4). However, despite an initial response, advanced prostate cancer almost always develops resistance to ADT, resulting in castration-resistant prostate cancer (CRPC)(4).
Multiple clinical studies have shown that CRPC relies on synthesis of intratumoral androgens from precursor steroids such as dehydroepiandrosterone (DHEA)(5,6). Despite ADT suppression of serum T, intratumoral concentrations of T and DHT synthesized from extragonadal precursor steroids are still sufficient to activate the AR signaling pathway (7). That CRPC relies on intratumoral androgens is also exemplified by the benefit to patients treated with androgen synthesis inhibitors (e.g., abiraterone) or potent AR antagonists (e.g., enzalutamide, apalutamide and darolutamide)(3,8). A major pathway of DHT synthesis in CRPC requires 5α-reduction of androstenedione (AD) by steroid 5α-reductase 1 (SRD5A1) to produce 5α-androstanedione (5α-dione), which is then converted to DHT (Fig. 1A)(9,10). This “5α-dione” pathway bypasses the requirement for serum T.
Fig. 1. Survey of androgen metabolism under acute reoxygenation.
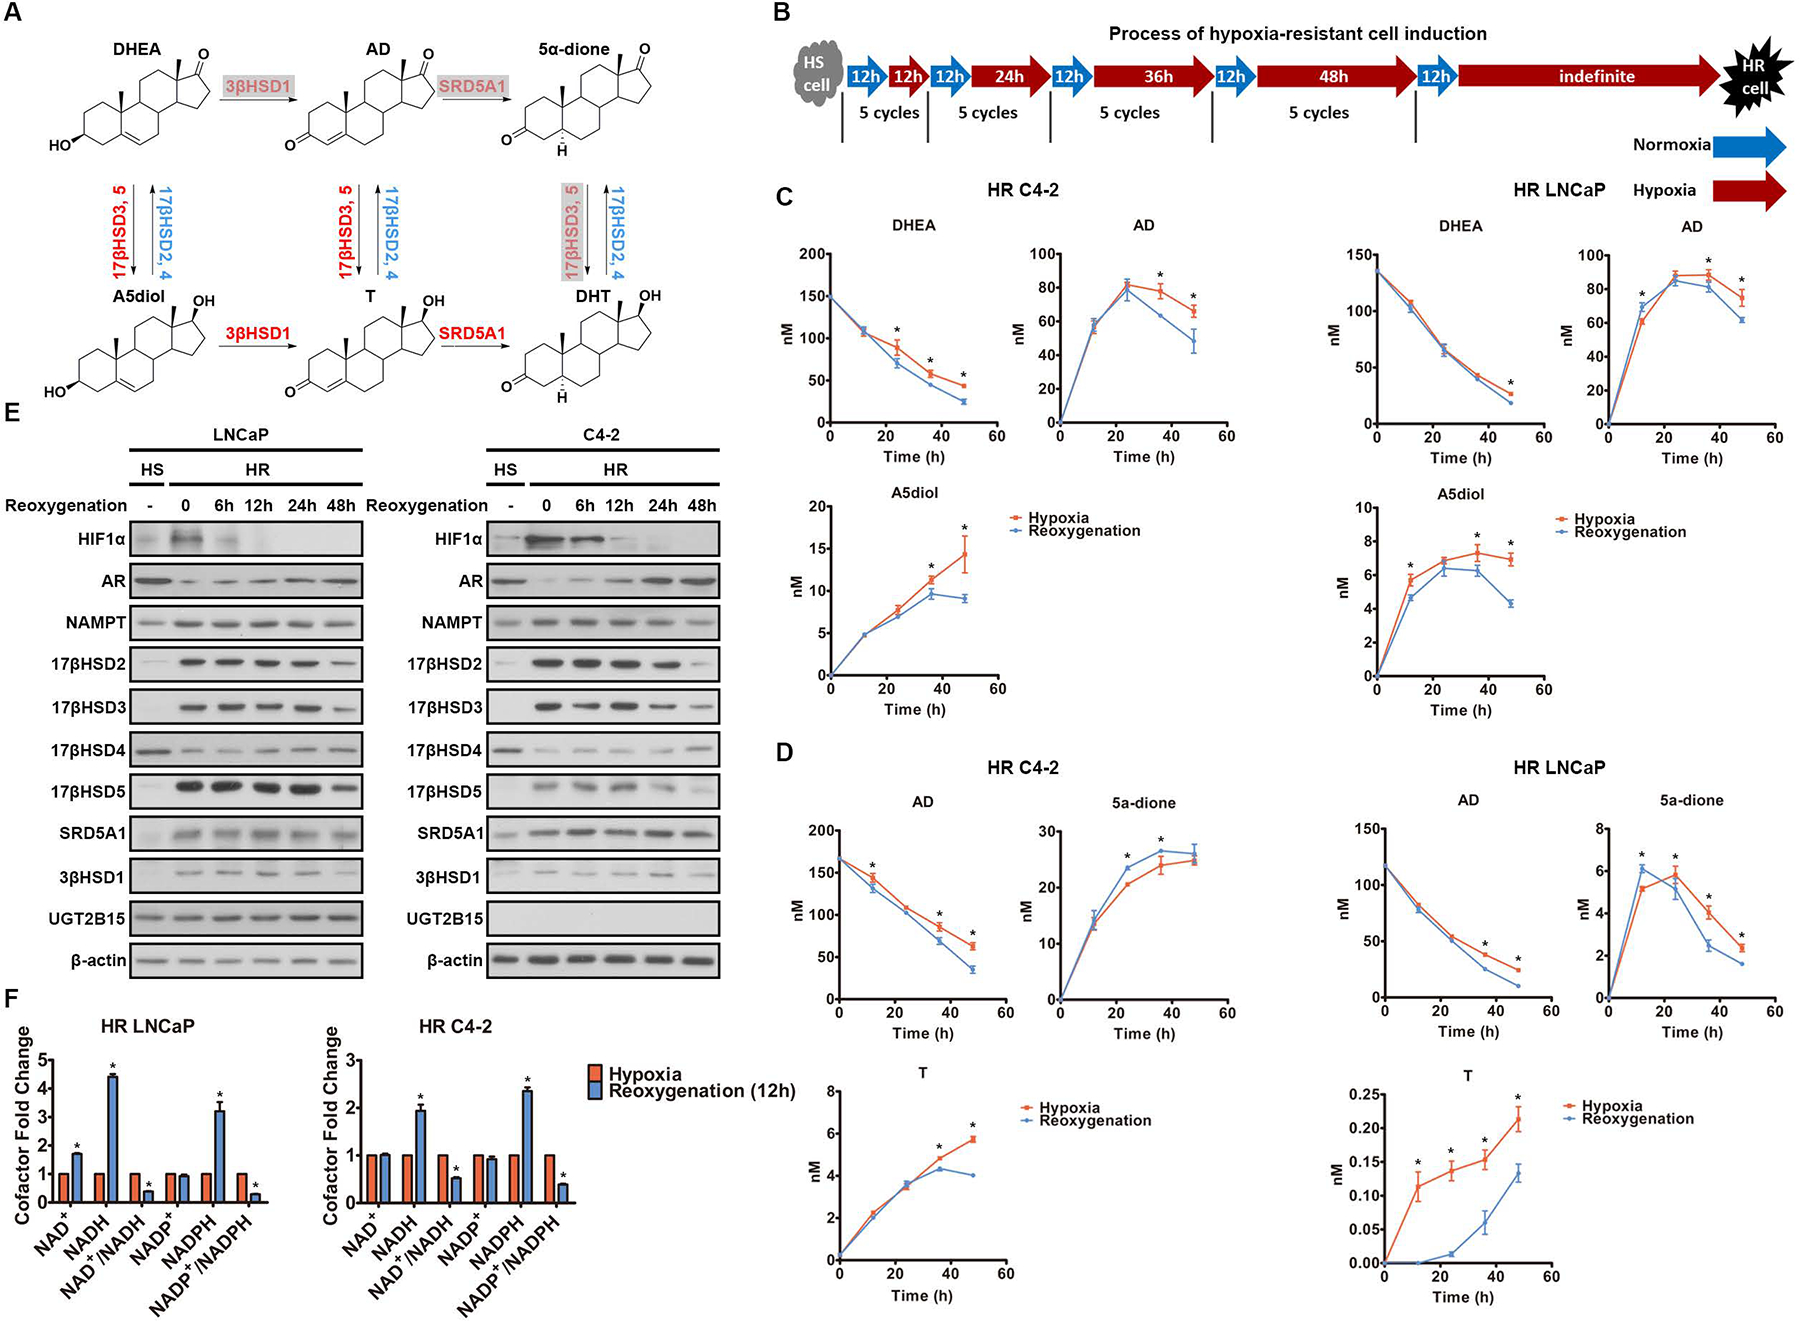
A. Androgen synthesis from DHEA. Gray indicates the main pathway of DHT synthesis in CRPC. B. Hypoxia-resistant (HR) cell line generation from hypoxia-sensitive (HS) cells. C-D. Metabolism of DHEA (C) and AD (D) was determined by mass spectrometry in HR cells with and without reoxygenation. Time 0 represents the point of DHEA (C) and AD (D) addition, and hypoxia or reoxygenation. Both groups of cells were under hypoxia before time 0. E. The enzymes involved in androgen metabolism were quantified by Western blot in HS cells under normoxia and in HR cells with and without reoxygenation. β-actin was a loading control. F. The cofactors were quantified in HR cells with and without reoxygenation. Error bars represent mean ± SEM. *, P<0.05 using an unpaired two-tailed t test.
AD is synthesized from DHEA/DHEA-sulfate, the major product of the human adrenal reticularis, by 3β-hydroxysteroid dehydrogenase/Δ5-->4 isomerase (3βHSD). The human 3βHSD family has two members: 3βHSD1 and 3βHSD2. 3βHSD1 is the peripherally expressed isoenzyme that sequentially catalyzes the two step-conversion of 3β-OH to 3-keto and Δ5- to Δ4-steroids (11). 3βHSD activity requires NAD+ as a cofactor, and NADH is required for the sequential isomerase activity (12,13). We first reported a germline-encoded gain-of-function missense (N367T) in 3βHSD1 that stabilizes the protein, thus promoting androgen synthesis from adrenal precursor steroids (14). In at least 10 clinical cohorts, men who inherit the more stable (adrenal permissive) enzyme have significantly worse outcomes after ADT, thus biochemically and genetically establishing the importance of this enzyme in driving clinical CRPC (15,16).
Solid tumors commonly contain hypoxic areas due to dynamic gradients of oxygen diffusion (17,18). Hypoxia profoundly affects tumor progression via inducing multiple downstream molecular events (18). Hypoxia-inducible factor (HIF), a family of transcription factors, is a major regulator of cellular response to hypoxia. Each functional HIF is a heterodimer composed of an α-subunit and a β-subunit (18,19). Hypoxia prevents hydroxylation of HIFα, which results in its accumulation and translocation to the nucleus where it dimerizes with oxygen-insensitive HIF1β, also called aryl hydrocarbon receptor nuclear translocator (ARNT), to induce the transcription of numerous genes (18,19).
Hypoxia has been reported to be a key driver in prostate cancer progression (17,20–23). However, how hypoxia affects androgen metabolism is not understood. Additionally, most prior studies of hypoxia in prostate cancer have been done under acute hypoxia, which does not reflect the in vivo state. Here, we investigated the alteration of androgen synthesis under acute and chronic hypoxia and cyclic hypoxia-reoxygenation in prostate cancer cells. Our surprising results suggest that cyclic hypoxia-reoxygenation facilitates the efficient metabolism of androgen precursors by prostate cancer cells to produce active androgens.
Materials and Methods
Reagents (Supplementary Table 1), antibodies for immunoblotting (Supplementary Table 2), antibodies for ChIP analysis (Supplementary Table 3), qPCR primers (Supplementary Table 4), ChIP primers (Supplementary Table 5), siRNA (Supplementary Table 6), and shRNA (Supplementary Table 7) are described in supplementary information.
Cell culture
LNCaP, PC3, and HepG2 cell lines were purchased from ATCC. The C4-2 cell line was generously provided by Dr. Leland Chung (Cedars-Sinai Medical Center, CA). The LAPC4 cell line was generously provided by Dr. Charles Sawyers (Memorial Sloan Kettering Cancer, NY). Hela and A549 cell lines were generously provided by Dr. Zihua Gong (Cleveland Clinic Foundation, OH). All cell lines were cultured in medium with 10% fetal bovine serum (FBS) and 1% penicillin/streptomycin. LNCaP, C4-2, PC3 and A549 cell lines were cultured in Roswell Park Memorial Institute (RPMI) 1640 medium. The LAPC4 cell line was cultured in Iscove’s Modified Dulbecco’s medium (IMDM). Hela and HepG2 cell lines were cultured in Dulbecco’s Modified Eagle medium (DMEM). To measure steroid metabolism, the cells were cultured in phenol red-free medium with charcoal-stripped FBS. All cell lines were cultured in a 5% CO2 humidified incubator. Hypoxic (1% O2) culture conditions were achieved using an O2/CO2 incubator (BioSpherix) containing a gas mixture composed of 94% N2, 5% CO2 and 1% O2. RPMI 1640 (10–500), phenol red-free RPMI 1640 (16–500), trypsin (589H100CUST) and PBS (121–500) were from the media preparation core in the Cleveland Clinic Lerner Research Institute. IMDM (I3395) and DMEM (D6429) were from Sigma-Aldrich. FBS (100–106) and charcoal-stripped FBS (100–119) were from Gemini Bio. All cell lines were routinely authenticated and tested for mycoplasma contamination prior to use, and cultured for ten passages after thawing for experiments.
Plasmid construction
The vectors expressing constitutively active HIF1α (HA-HIF1α-P402A/P564A/N803A-pcDNA3) and HIF2α (HA-HIF2α-P405A/P531A-pcDNA3) were gifts from William Kaelin (Addgene plasmid #87261 and #18956). Plasmid HA-HIF2α-P405A/P531A/N847A-pcDNA3 was generated from HA-HIF2α-P405A/P531A-pcDNA3 plasmid (Addgene plasmid #18956) by site-directed mutagenesis using primer CCAGATATGACTGTGAGGTGGCCGTGCCCGTGCTGGGAAGCTC and the QuikChange Lightning Multi Site-Directed Mutagenesis Kit (Agilent Technologies, 210515). Primers (Forward: TGGCCTAACTGGCCGAATTACCCAGGCATGGTG, Reverse: TATCCTCGAGGCTAGCTAAAAAGAGATGTCAAATGGTT) were used to amplify the 5′-flanking region of human HSD3B1 (−2880/+182) from LNCaP genomic DNA. This PCR-amplified fragment was cloned into the pNL2.1[Nluc/Hygro] luciferase vector (N1061, Promega) to generate pNL2.1-HSD3B1-Luc using In-Fusion Snap Assembly Starter Bundle (638945) from Takara Bio.
Plasmid transfection
Cells were grown to 70% confluence before transfection. Lipofectamine 3000 was used following the manufacturer’s protocol. Transfected cells were harvested after 48–72h. Antibiotics were used to select for cells that stably express transfected DNA.
Knockdown and knockout studies
For siRNA-mediated gene knockdown, cells were grown to 70% confluence, and then Lipofectamine RNAiMAX was used following the manufacturer’s protocol. The cells were harvested after 48–72h. For creating stable knockdown cells, shRNA was expressed and antibiotics were used for selection. HSD3B1 was knocked out by using guide RNA (CGTTTATACTAGCAGAAAGGC) in C4-2 cells. The virus for HSD3B1 knockout was produced using the LentiCRISPRv2 protocol (24).
NAD+, NADH, NADP+ and NADPH measurement
NAD+, NADH, NADP+ and NADPH were measured using the NAD/NADH-Glo Assay Kit (G9071) and NADP/NADPH-Glo Assay Kit (G9081) from Promega following the manufacturer’s instructions.
Quantitative PCR (qPCR) analysis
Total RNA was prepared using GenElute Mammalian Total RNA Miniprep Kit (RTN350-1KT) from Sigma-Aldrich. 2μg total RNA was used in a reverse-transcriptase reaction to synthesize cDNA with iScript cDNA Synthesis Kit (170-8891) from Bio-Rad. qPCR was performed by mixing together primers, cDNA, and iTaq Universal SYBR Green Supermix (1725124) from Bio-Rad and then loading the mixture in a real-time PCR instrument (ABI-7500) from Applied Biosystems. Each mRNA was quantified by normalizing the sample values to ACTB and then to control samples. The qPCR results are shown as the mean values of three independent experiments.
mRNA stability assay
Total RNA was prepared from the cells collected at the indicated time points after actinomycin D (5μM) treatment as described elsewhere (25).
Immunoblotting
Protein was extracted by lysing the cells with loading buffer (2% SDS, 10% glycerol, 10mM Tris, pH6.8, 100mM DTT) and then boiling the samples for 10min. The samples were loaded on an SDS-PAGE gel using a standard Tris-glycine buffer system. The proteins were then transferred to a PVDF membrane and incubated in TBST (137mM NaCl, 20mM Tris, 0.1% Tween-20, pH7.6) containing 5% non-fat dry milk for 1h at room temperature to block non-specific binding sites. Then the membrane was incubated with primary antibody at the appropriate dilution (see Supplementary Table 2) at 4°C overnight. The membrane was washed with TBST and incubated with secondary antibody at 1:10000 at room temperature for 1h. Then the membrane was washed again with TBST and incubated with SuperSignal West Pico PLUS Chemiluminescent Substrate (34578) from Thermo Fisher Scientific at room temperature for 5min. Signal was detected on ProSignal ECL Blotting Film (30-507L) from Genesee Scientific. The immunoblotting experiments were repeated three times.
Co-immunoprecipitation (co-IP)
107 cells overexpressing HA-tagged HIF2α were used to immunoprecipitate HA-tagged HIF2α. The co-IP assay was performed using Pierce HA-Tag Magnetic IP/Co-IP Kit (88838) from Thermo Fisher Scientific following the manufacturer’s instructions. 5×10⁷ cells were used to immunoprecipitate ARNT. The co-IP assay was performed using anti-ARNT antibody (5537, 1:50 dilution) from Cell Signaling and Pierce MS-Compatible Magnetic IP Kit, protein A/G (90409) from Thermo Fisher Scientific following the manufacturer’s instructions.
ChIP analysis
ChIP analysis was performed using the SimpleChIP® Enzymatic Chromatin IP Kit (9003) from Cell Signaling following the manufacturer’s instructions.
Luciferase assay for pNL2.1-HSD3B1-Luc
The cells transfected with pNL2.1-HSD3B1-Luc were lysed by Glo Lysis Buffer (E2661) from Promega, and the luciferase reaction was performed by mixing the cell lysis with Nano-Glo Luciferase Assay System (N1110) from Promega following the manufacturer’s instructions.
Intracellular oxygen concentration assay
Intracellular oxygen concentration was measured using the Intracellular Oxygen Concentration Assay kit (ab197245) from Abcam and following the manufacturer’s instructions. The equation we used for calculation is:
Where:
[O2]a = oxygen concentration in air-saturated conditions.
Lo = intra O2 probe signal measured in deoxygenated conditions.
La = intra O2 probe signal measured in air-saturated conditions.
Lt = experimental intensity values generated during measurement.
Here we used ambient O2 = 18.6%, as the test plates have equilibrated in an environment containing 5% CO2 and 95% humidity.
Cell viability assay
Cell viability was measured using either trypan blue stain or the CellTiter-Glo 2.0 Cell Viability Assay (G9241) from Promega following the manufacturer’s instructions. Trypan blue stain was performed by using Countess II FL automated cell counter and Countess™ cell counting chamber slides (C10283) from Thermo Fisher Scientific following the manufacturer’s instructions.
Nuclear and cytoplasmic extraction
5×10⁷ cells were used for nuclear and cytoplasmic extraction. NE-PE Nuclear and Cytoplasmic Extraction Reagents (78833) from Thermo Fisher Scientific were used following the manufacturer’s instructions.
Mouse xenograft studies
All studies were performed under a protocol approved by the institutional animal care and use committee of the Cleveland Clinic Lerner Research Institute. All NSG male mice (6–8 weeks old) were purchased from Cleveland Clinic Lerner Research Institute. 107 cells with 50% Matrigel Basement Membrane Matrix (354234) from Corning were subcutaneously injected into each mouse; at 19 days after injection, mice were surgically orchiectomized and implanted with a 5mg sustained-release DHEA pellet. Xenografts were measured using digital calipers 3 times a week after tumors became palpable. Tumor volume was calculated as V=(W2XL)/2. Progression-free survival was assessed as time to tumor volume of 800 mm3 from Day 0, the day of tumor cell injection. The numbers of mice in the CTRL/CTRL, CTRL/EPAS1 OE, HSD3B1 KO/CTRL, and HSD3B1 KO/EPAS1 OE groups were 8, 9, 9, and 10, respectively.
Human tissues
Fresh paired malignant and adjacent normal prostate tissue was obtained from 6 patients with localized prostate cancer undergoing radical prostatectomy at Cleveland Clinic under institutional review board approved protocols with written informed consent obtained from patients and in accordance with the Declaration of Helsinki. The samples were weighed and suspended in RIPA buffer (9806) from Cell Signaling. The samples were prepared using a Minilys homogenizer and hard tissue grinding kit (MK28) from Bertin Technologies following the manufacturer’s protocol. 3X blue loading buffer (7722) from Cell Signaling was added to the samples which were then boiled for 10min before being loaded on an SDS-PAGE gel.
Mass spectrometry
For medium samples, 200μl medium from steroid-treated cell culture was collected and mixed with 200μl H2O, 2ml methyl tert-butyl ether, and 10μl [2, 3, 4-13C3] AD (50ng/ml) as internal standard. The mixture was vortexed for 10min and then centrifuged at 3000g for 5 min at 4°C. The sample was then placed on dry ice for 5min to freeze the bottom layer, and the top organic fraction with the steroid was transferred into a new glass tube. The collected organic sample was evaporated with nitrogen gas at 40°C and then reconstituted in 120μl of 50% methanol. The sample was vortexed for 5min and then centrifuged at 3000g for 3 min at 4°C. The sample was transferred into a 1.5ml microcentrifuge tube and then centrifuged at 14000g for 10min at 4°C. 90μl supernatant was collected in an HPLC vial for mass spectrometry. For xenograft tumor sample, the sample (>30mg) was weighed and transferred into hard tissue grinding tubes (MK28) from Bertin Technologies. The sample was snap-frozen in liquid nitrogen and then suspended in 900μl cold acetonitrile with 10μl [2, 3, 4-13C3] AD (50ng/ml) as primary internal standard. The sample was then homogenized using a Minilys homogenizer following the manufacturer’s protocol. The sample was centrifuged at 14000g for 10min at 4°C, and the supernatant was transferred into a new glass tube. 500μl cold H2O was added into the tissue grinding tube, and the mixture was vortexed for 2min. The mixture was centrifuged at 14000g for 10min at 4°C, and the supernatant was transferred and combined with the supernatant from the previous steps. 10μl DHT-d3 (25ng/ml) was added as secondary internal standard. The steroids were then extracted following the protocol for medium sample described above. Mass spectrometry assay and analysis were performed as we have described previously (26).
Data analysis
Statistical analyses were performed in GraphPad Prism. Unless otherwise noted, error bars represent the SEM; P values were calculated. P<0.05 was considered statistically significant.
Data availability
The data generated in this study are available within the article and its supplementary data files.
Results
Acute hypoxia leads to decreased conversion of androgen precursors to downstream metabolites and increased preservation of androgen precursors.
DHT is synthesized from adrenal precursors such as DHEA and AD in peripheral tissues (Fig. 1A). Therefore, to determine how acute hypoxia affects androgen synthesis, we compared the metabolism of DHEA and AD under normoxia and acute hypoxia in LNCaP and C4-2 cells, two AR-expressing prostate cancer cell lines. A robust increase in GLUT1 and VEGFA mRNA, two well-known hypoxia-responsive genes, indicated a hypoxia response was induced in both cell lines (Supplementary Fig. S1A). Most remarkably, the androgen precursors persisted much longer under hypoxia as compared to normoxia (Supplementary Fig. S1B and C). The production of androstenediol (A5diol) from DHEA and T from AD was strikingly increased in both LNCaP and C4-2 cells under hypoxia (Supplementary Fig. S1B and C), which may be attributed to higher activity of 17βHSD3 and 17βHSD5 (reductive 17βHSD preference), or lower activity of 17βHSD2, 17βHSD4 (oxidative 17βHSD preference), and 3βHSD1 (Fig. 1A).
To further determine the mechanism of altered androgen metabolism under hypoxia, we examined protein levels of a panel of steroidogenic enzymes. Only 17βHSD4 demonstrated protein downregulation after 6 hours of hypoxia (Supplementary Fig. S1D). AR protein decreased, consistent with previous studies showing AR is degraded via hypoxia-induced autophagy (27).
Shifts in NAD+, NADH, NADP+ and NADPH with acute hypoxia.
Because all the enzymes we tested, except 17βHSD4, exhibited no change in protein level under acute hypoxia, we examined the associated cofactors, NAD+, NADH, NADP+ and NADPH, which regulate multiple steroidogenic enzymes. Hypoxia induced a decrease in all 4 cofactors, especially NADH and NADPH, in all prostate cancer cell lines we tested, including AR-expressing and nonexpressing cell lines (Supplementary Fig. S1E–G). These decreases may contribute to the decreased androgen synthesis from precursors. Interestingly, our results were contradictory with studies of other cancer types, in which the NAD+/NADH ratio decreased in response to hypoxia (28). To verify our results, we determined cofactor levels in cell lines representing other cancer types, such as HeLa (cervical cancer), HepG2 (liver cancer), and A549 (lung cancer), using the same method. The results from these non-prostate cancer cell lines were highly consistent with previous reports (28), showing increased NADH and decreased NAD+/NADH (Supplementary Fig. S1H), which confirmed our findings.
To further explore the significance of the cofactor decrease, we tried to rescue cofactors under hypoxia to determine whether their restoration influences androgen metabolism. Because the cell membrane is not permeable to NAD+, NADH, NADP+ and NADPH, we supplemented the cells with their precursors, NA and NMN. NA and NMN increased NAD+ and NADH only slightly under hypoxia, far from full restoration to the level seen under normoxia (Supplementary Fig. S1I), suggesting that the decrease in cofactors under acute hypoxia is not due to precursor reduction.
Chronic hypoxia decreased conversion and increased preservation of androgen precursors.
To systematically examine effects of oxygenation on androgen metabolism, we set out to interrogate the effects of acute hypoxia, chronic hypoxia and hypoxia-reoxygenation on androgen synthesis. Cancer cells experience long-term hypoxia in vivo due to a disorganized tumor vasculature, with periodic reoxygenation, so acute hypoxia does not accurately reflect the in vivo state. We found that neither LNCaP nor C4-2 cells survived more than 48 hours of hypoxia, so this approach did not allow us to investigate the effects of chronic hypoxia on androgen metabolism. Therefore, we developed a method to establish hypoxia-resistant cell lines that can survive under chronic hypoxia to better simulate the hypoxic condition in vivo. The cells were grown under cyclic hypoxia and reoxygenation for several weeks with a gradual increase in hypoxia exposure time (Fig. 1B). The cells became hypoxia resistant (HR) after several passages. HR cells were flatter compared with their normal hypoxia-sensitive (HS) counterparts (Supplementary Fig. S2A). The intracellular hypoxic condition was confirmed in HR cells (Supplementary Fig. S2B). Quantification of the hypoxia-responsive genes HES6, KDM3A and SOX9 (29) revealed that KDM3A and SOX9 were upregulated in HR cells at the mRNA level, whereas HES6 was upregulated in HR LNCaP but not HR C4-2 cells (Supplementary Fig. S2C). Although the protein expression of most of the enzymes involved in androgen metabolism did not change under acute hypoxia (Supplementary Fig. S1D), their expression was strikingly upregulated in HR cells during chronic hypoxia, except for 17βHSD4 and UGT2B15 (Supplementary Fig. S2D). 17βHSD4 expression was significantly decreased, as we found for acute hypoxia (Supplementary Fig. S1D and S2D). The alterations in enzyme levels suggest these changes might be critical for tumor cell adaptation and survival under chronic hypoxia. The changes in mRNA and protein were consistent for 3βHSD1, 17βHSD4 and 17βHSD5, whereas the change in mRNA and protein diverged for SRD5A1, 17βHSD2 and 17βHSD3, which suggests a post-transcriptional regulation (Supplementary Fig. S2D and E). AR downregulation occurred in HR cells, which may contribute to the slow growth of HR cells under hypoxia (Supplementary Fig. S2C–E).
To investigate the net metabolic consequences of this altered enzyme expression, we compared the metabolism of DHEA and AD in HS cells and HR cells. Surprisingly, in HR cells, conversion of androgen precursors to downstream metabolites decreased, with much longer preservation of precursors compared with HS cells (Supplementary Fig. S2G and H), despite much higher enzyme levels. Levels of all four cofactors were lower in HR compared with HS cells, especially NADH and NADPH (Supplementary Fig. S2F), consistent with our results for acute hypoxia (Supplementary Fig. S1E–G). This suggests that alteration in cofactors may play a decisive role in androgen synthesis. The robust upregulation of NAMPT (Supplementary Fig. S2D), the enzyme catalyzing the rate-limiting step in NAD+ biosynthesis, may help HR cells to compensate for the decreased cofactors, allowing adaptation to chronic hypoxia.
Reoxygenation rapidly increases cofactors without reducing enzyme protein.
Because conversion of androgen precursors to downstream metabolites decreased under both acute and chronic hypoxia, we determined whether reoxygenation could reverse this effect in HR cells. We compared the metabolism of DHEA and AD in HR cells under hypoxia and reoxygenation. After reoxygenation, HR cells exhibited decreased A5diol synthesis and increased 5α-dione synthesis, as well as moderately increased DHEA and AD consumption (Fig. 1C and D). Enzyme protein levels were unchanged up to 24 hours after reoxygenation, and an obvious change was detected only after 48 hours (Fig. 1E and Supplementary Fig. S3A). However, cofactors responded much more rapidly, such that 12 hours of reoxygenation led to significant upregulation of all cofactors, especially NADH and NADPH (Fig. 1F). Therefore, the rapid increase in cofactors may be critical in reoxygenation-mediated alteration of androgen synthesis. Our study suggests that cyclic hypoxia-reoxygenation, a common feature of tumors, enables HR cells to efficiently metabolize androgen precursors. During hypoxia when cells lack the nutrients needed to proliferate, the androgen precursors persist much longer, and the enzyme levels are upregulated; then reoxygenation facilitates androgen production by rapidly increasing the cofactor level without reducing enzyme protein in the short term.
Chronic hypoxia reversibly upregulates 3βHSD1.
We further compared the metabolism of DHEA and AD in HR cells after a 48-hour reoxygenation (hypoxia-reoxygenation) with that in HS cells (sustained normoxia). Compared with HS cells, HR cells with hypoxia-reoxygenation exhibited faster conversion of androgen precursors, especially DHEA, to downstream metabolites (Fig. 2A and B), as well as greater induction of AR target gene expression by DHEA (Fig. 2C). To investigate the effect of reoxygenation on enzyme protein level, we exposed HR cells to normoxia, then returned them to hypoxia. GLUT1 and VEGFA mRNA levels changed rapidly in response to the change in O2 (Supplementary Fig. S3B). The viability of HS cells under normoxia, and HR cells under hypoxia and reoxygenation was compared by using the trypan blue stain, and did not exhibit any difference (Supplementary Fig. S3C). In HR cells, enzyme protein expression was reversible: for all enzymes in which the protein level changed under chronic hypoxia, upon reoxygenation, levels gradually reverted to those seen in HS cells under normoxia (Fig. 2D and Supplementary Fig. S3D). After incubating these HR cells for 7 days under normoxia, we transferred them back to hypoxia. 17βHSD2 and 17βHSD4 protein levels quickly reverted to levels similar to those before transfer to normoxia, whereas the other enzymes did not rapidly respond (Fig. 2D and Supplementary Fig. S3D). Although the results from all three HR cell lines were generally consistent, HR LAPC4 cells more rapidly responded to the change in O2 than HR LNCaP and C4-2 cells (Supplementary Fig. S3D). 17βHSD3 and 17βHSD5 protein levels increased after re-incubation under hypoxia in HR LAPC4 cells but not in HR LNCaP and C4-2 cells (Supplementary Fig. S3D and Fig. 2D). Upon reoxygenation, 3βHSD1 protein level gradually reverted to that seen in HS cells under normoxia, but then did not change rapidly when re-incubated under hypoxia (Fig. 2D). Compared with HS cells, HR cells exhibited similar NAD+, NADP+, NADPH levels but a somewhat higher NADH level after a 2-day reoxygenation (Fig. 2E). Because DHEA conversion to AD is catalyzed by 3βHSD1, these data together indicate that the prolonged higher 3βHSD1 level may contribute to the faster conversion of DHEA to downstream metabolites in HR prostate cancer cells.
Fig. 2. Chronic hypoxia reversibly upregulates 3βHSD1.
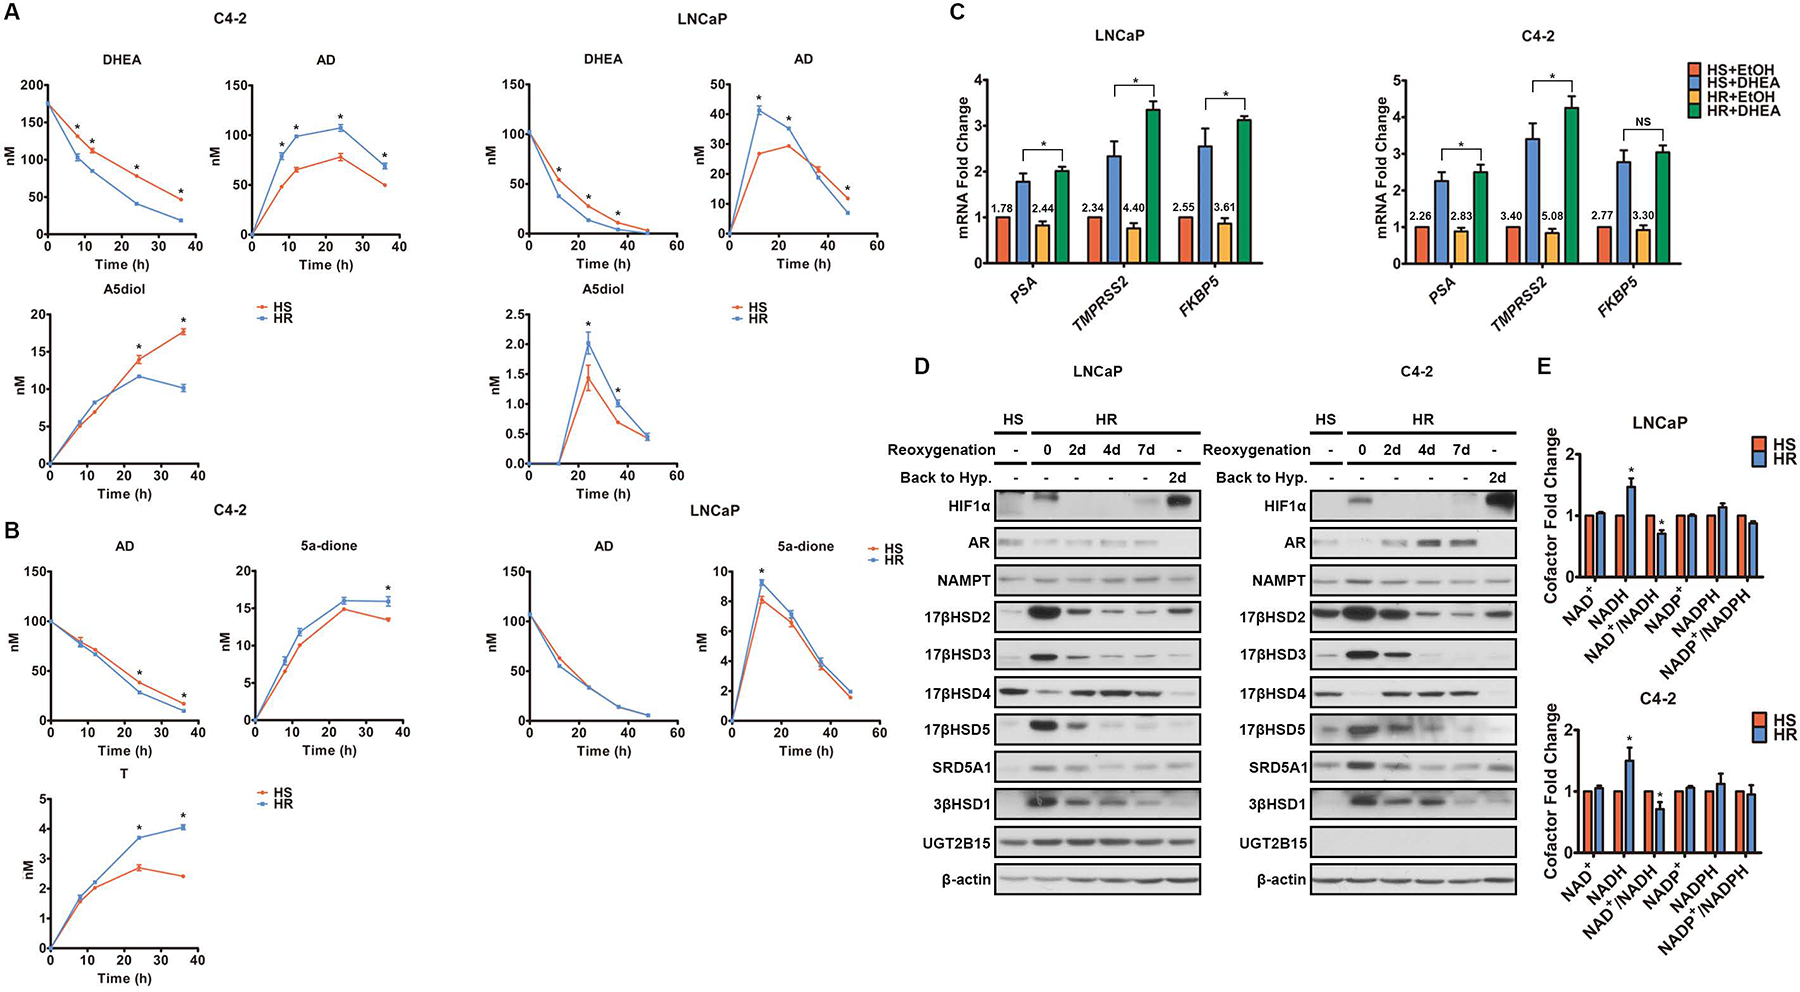
A-B. Metabolism of DHEA (A) and AD (B) was determined by mass spectrometry in both HS and HR cells under normoxia. Time 0 represents the point of DHEA (A) and AD (B) addition. HR cells were under reoxygenation for 48h before time 0. C. AR-regulated transcripts were determined by qPCR in both HS and HR cells under normoxia with or without 8h DHEA treatment. HR cells were under reoxygenation for 48h before DHEA treatment. The numbers above the columns denote fold change. D. The enzymes involved in androgen metabolism were quantified by Western blot in HS cells under normoxia and HR cells with and without reoxygenation. β-actin was a loading control. “Back to Hyp.” indicates HR cells that, after 7-day reoxygenation, were transferred back to hypoxia for 2 days. E. The cofactors were quantified in HS cells under normoxia and HR cells after 48h reoxygenation. Error bars represent mean ± SEM. *, P<0.05 using an unpaired two-tailed t test.
Hypoxia upregulates 3βHSD1 by inhibiting the EGLN1/VHL pathway.
3βHSD1 directly catalyzes conversion of DHEA to AD in peripheral tissues for DHT synthesis, and egl nine homolog (EGLN)/von Hippel–Lindau (VHL) pathway inhibition plays a pivotal role in the hypoxic response (30). Therefore, we determined whether EGLN/VHL pathway inhibition is responsible for 3βHSD1 upregulation under hypoxia. The EGLN inhibitor CoCl2 increased 3βHSD1 mRNA in HS cells under normoxia (Supplementary Fig. S4A). Using siRNA, we then knocked down all three isoforms of EGLN individually. Only EGLN1 knockdown substantially upregulated HIF1α and HIF2α as well as 3βHSD1 under normoxia, whereas EGLN2 or EGLN3 knockdown had little to no effect (Supplementary Fig. S4B and C). Interestingly, EGLN2 knockdown also strikingly downregulated EGLN3 by an unknown mechanism (Supplementary Fig. S4B and C). Because VHL is responsible for degrading the proteins hydroxylated by EGLN (prolyl hydroxylase), we determined whether VHL is involved in hypoxia-induced 3βHSD1 upregulation in LNCaP and C4-2 cells. VHL knockdown significantly increased HIF1α and HIF2α, as well as 3βHSD1 under normoxia (Fig. 3A and B). We also quantified several known HIF targets as positive controls. Unlike the other targets, VEGFA level remained unaffected by VHL knockdown for unknown reasons (Fig. 3B). VHL knockdown also increased DHEA conversion to AD as a consequence of 3βHSD1 upregulation (Fig. 3C). Furthermore, DHEA-mediated upregulation of AR targets was enhanced by VHL knockdown (Fig. 3D). These data together suggest that EGLN1/VHL pathway inhibition is sufficient to induce 3βHSD1 expression under normoxia.
Fig. 3. 3βHSD1 is upregulated by hypoxia via VHL inhibition.
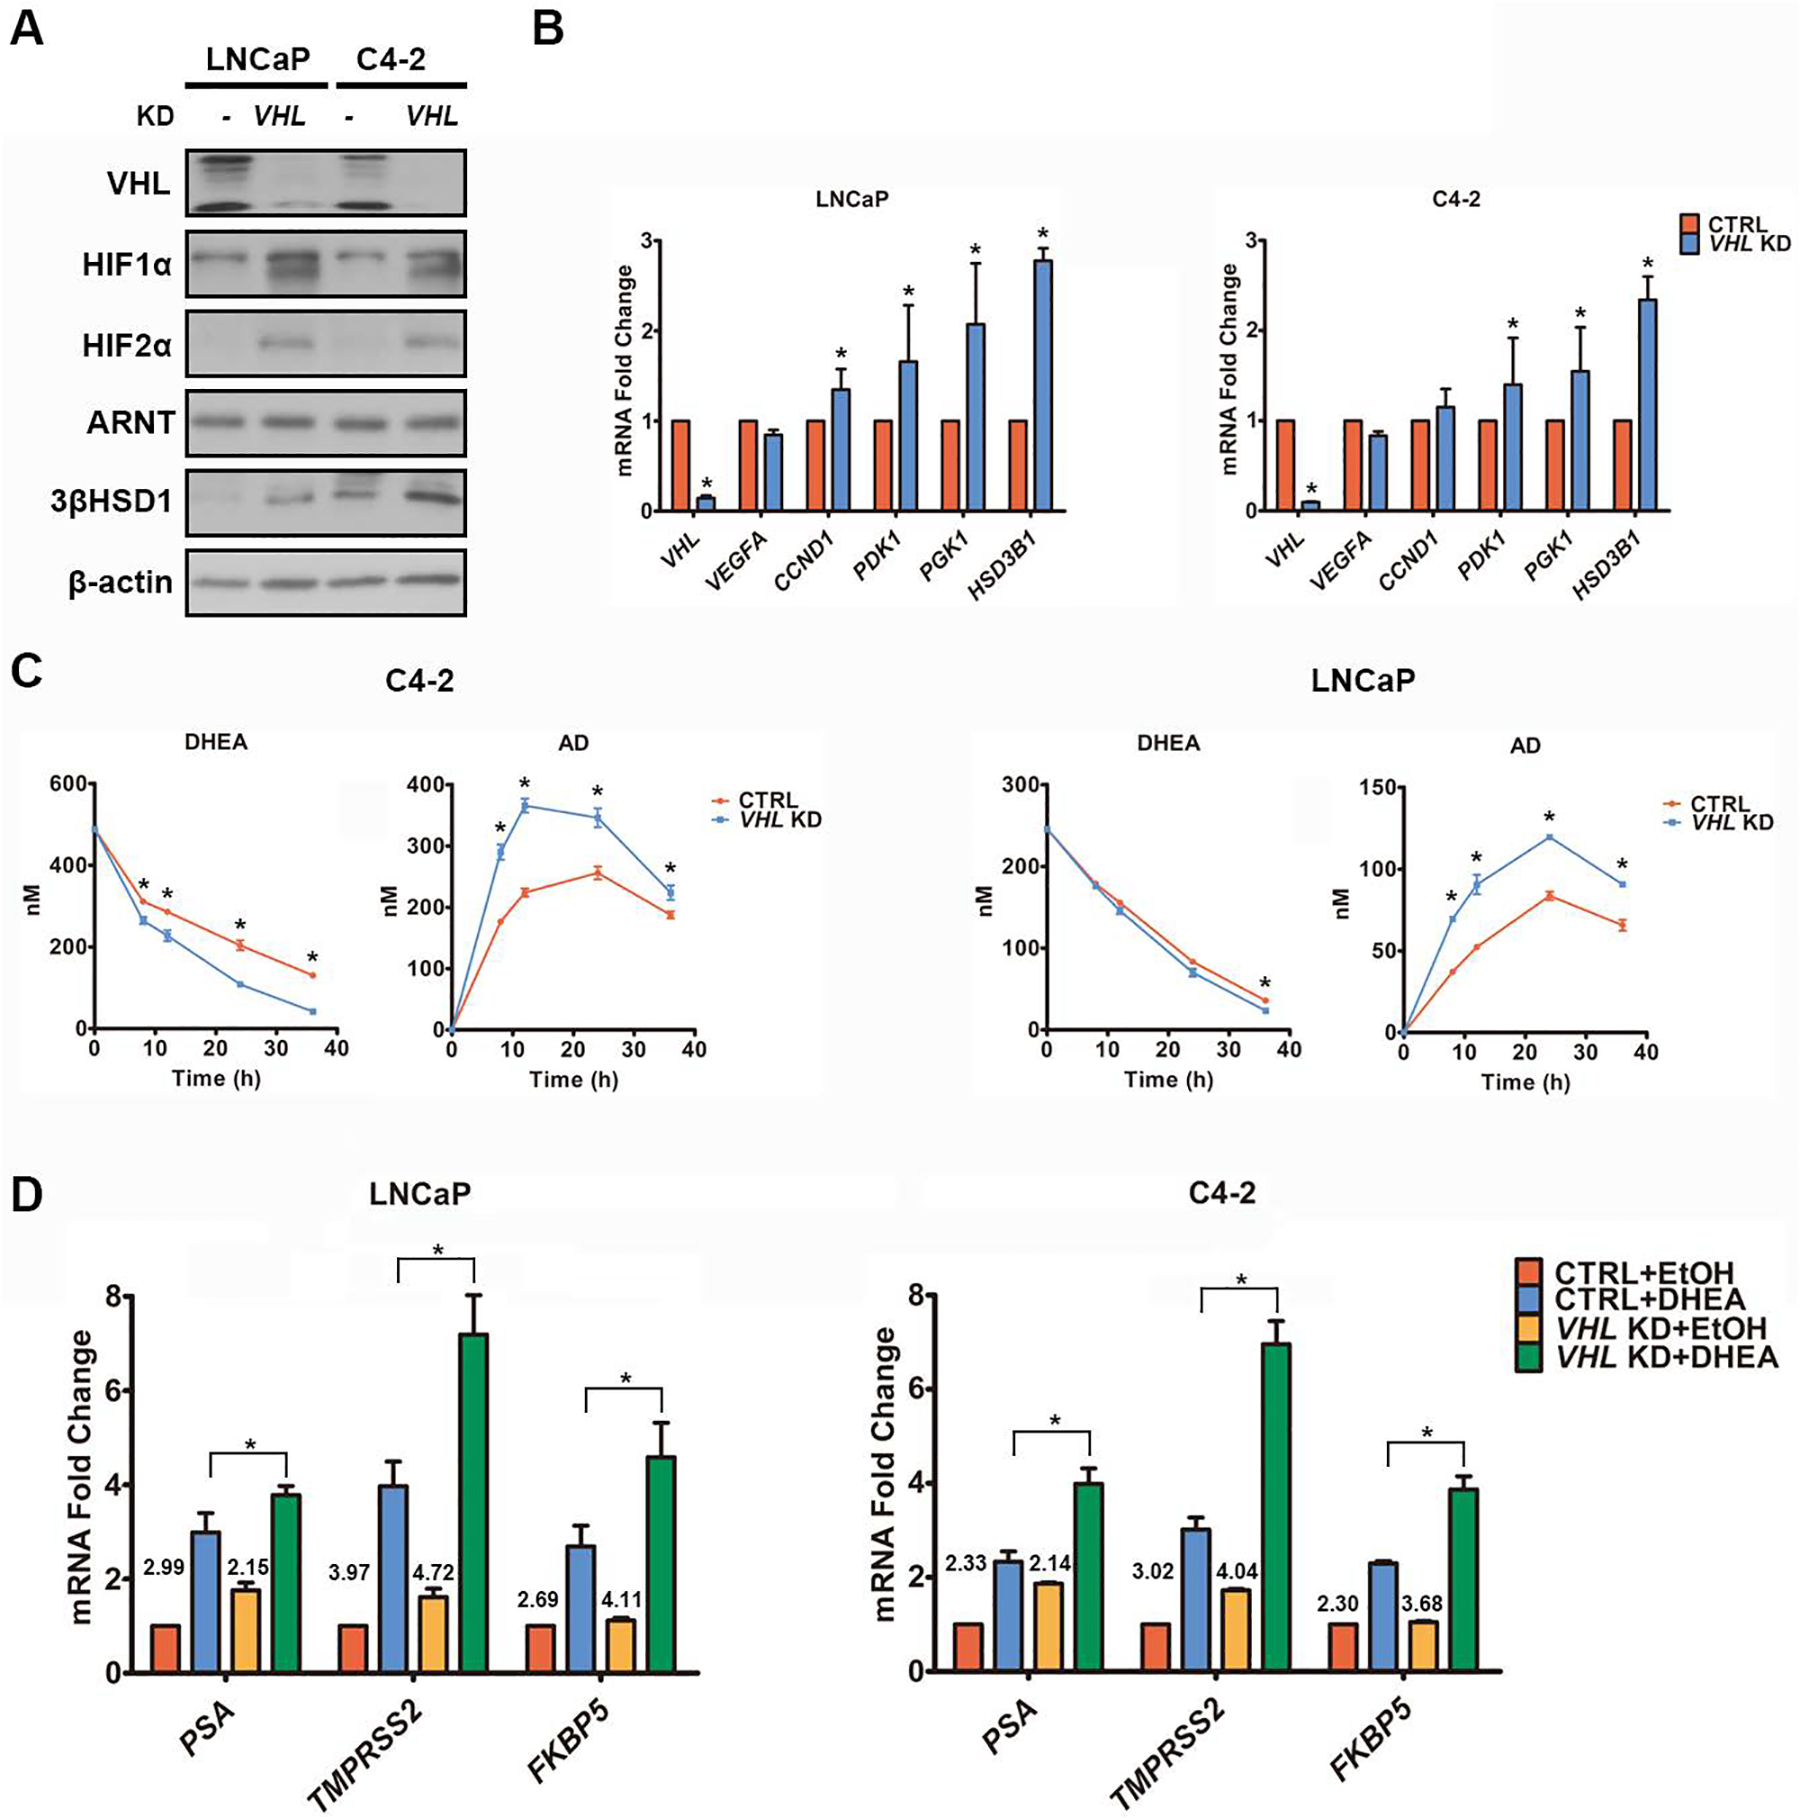
A-B. VHL, HIF, 3βHSD1, and HIF target proteins (A) and mRNA (B) were determined by Western blot (A) and qPCR (B) in cells with siRNA-mediated VHL knockdown and control cells under normoxia. β-actin was a loading control. C. DHEA metabolism was determined by mass spectrometry in cells with VHL knockdown and control cells under normoxia. Time 0 represents the point of DHEA addition, which was 48 hours after transfection with VHL or control siRNA. D. AR-regulated transcripts were determined by qPCR in cells with or without 8h DHEA treatment, which was 48 hours after transfection with VHL or control siRNA under normoxia. The numbers above the columns denote fold change. *P<0.05 using an unpaired two-tailed t test. Error bars represent mean ± SEM.
3βHSD1 is upregulated by HIF2α.
In the presence of oxygen, the HIFα subunit is hydroxylated on conserved proline residues by EGLN (31). Prolyl-hydroxylated HIFα is then recognized by VHL for ubiquitylation and proteasomal degradation (32). However, under hypoxia, HIF is activated by hypoxia-induced EGLN/VHL inhibition and is a major cellular response to hypoxia. Our data suggested that 3βHSD1 expression was elevated at the mRNA level in HR cells (Supplementary Fig. S2E) and by EGLN1/VHL inhibition under normoxia (Supplementary Fig. S4 and Fig. 3A and B). Therefore, we determined whether 3βHSD1 is a target of HIF. Because EGLN1/VHL inhibition stabilizes both HIF1α and HIF2α, we knocked down each isoform in cells that had VHL knockdown and thus, also had upregulated 3βHSD1 under normoxia. Only HIF2α knockdown abolished the 3βHSD1 upregulation (Fig. 4A). Then we individually overexpressed dominant-positive HIF1α and HIF2α (P402A/P564A/N803A on HIF1α and P405A/P531A/N847A on HIF2α) under normoxia, which abolish hydroxylation-mediated degradation and inhibition of coactivator binding (18). Overexpression of mutant HIF2α but not mutant HIF1α upregulated 3βHSD1 under normoxia (Fig. 4B and C). These data together suggest that 3βHSD1 is a downstream target of HIF2α but not HIF1α. Known HIF targets (positive controls) exhibited distinct patterns of regulation when HIF1α or HIF2α was overexpressed (Fig. 4C). HIFα overexpression did not affect VEGFA level, which was consistent with our VHL knockdown results (Fig. 3B).
Fig. 4. HIF2α upregulates 3βHSD1.
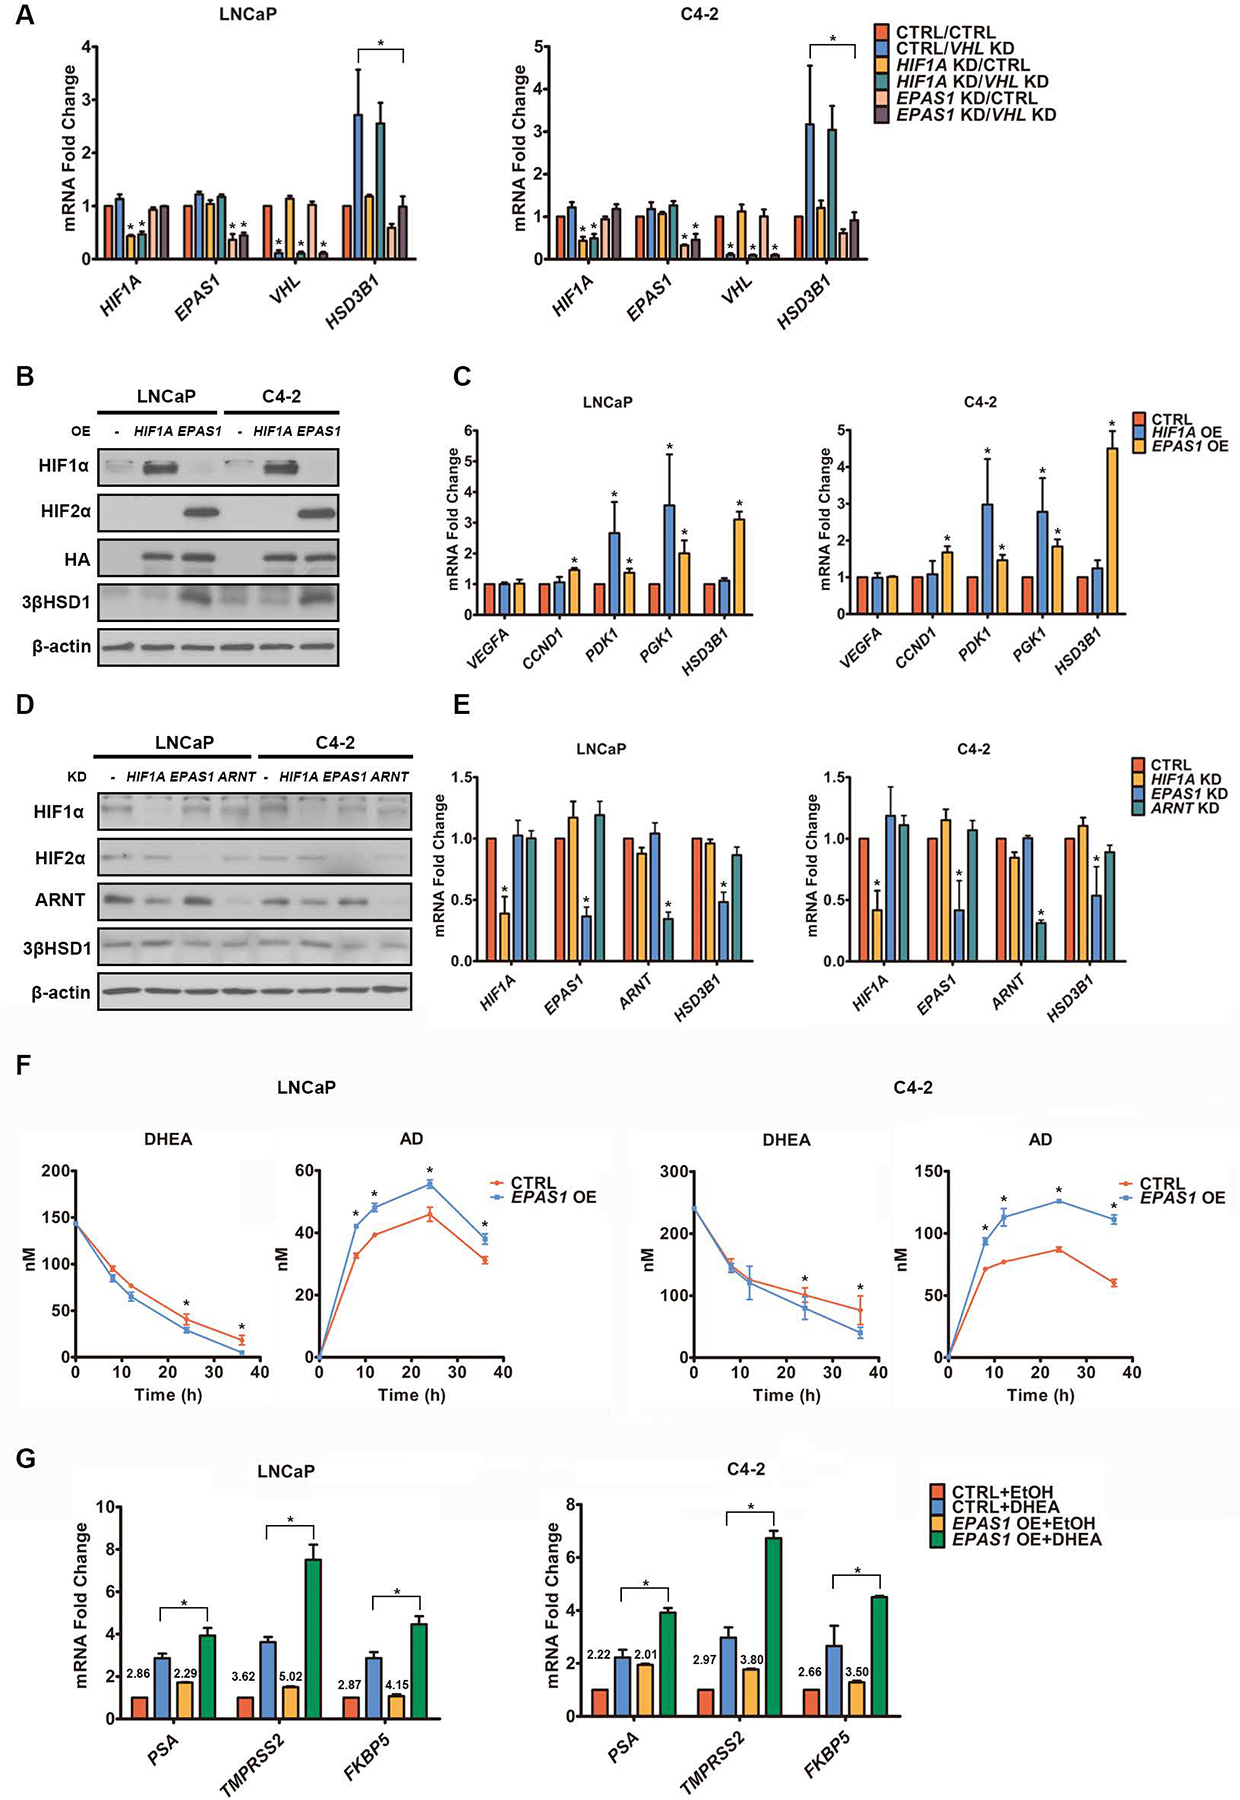
A. HIF, VHL and HSD3B1 mRNA was quantified by qPCR in cells with shRNA-mediated HIF and/or siRNA-mediated VHL knockdown (KD) and control cells under normoxia. EPAS1 is the gene encoding HIF2α. B-C. HIF, 3βHSD1, and HIF target proteins (B) and mRNA (C) were determined by Western blot (B) and qPCR (C) in cells with HA-tagged HIF overexpression (OE) and control cells under normoxia. D-E. HIF and 3βHSD1 protein (D) and mRNA (E) were determined by Western blot (D) and qPCR (E), respectively, in HR cells with and without shRNA-mediated HIF knockdown under hypoxia. β-actin was a loading control. F. DHEA metabolism was determined by mass spectrometry in cells with and without HA-tagged HIF2α overexpression under normoxia. Time 0 represents the point of DHEA addition, at 48 hours after transfection with HA-tagged HIF2α or control plasmid. G. AR-regulated transcripts were determined by qPCR in cells with or without 8h DHEA treatment, which was 48 hours after transfection with HA-tagged HIF2α or control plasmid under normoxia. The numbers above the columns denote fold change. *P<0.05 using an unpaired two-tailed t test. Error bars represent mean ± SEM.
As HIF1α and HIF2α transcriptional activity requires association with HIF1β, also known as ARNT, we also determined whether ARNT is required for hypoxia-induced 3βHSD1 upregulation. Knockdown of either HIF2α or ARNT decreased 3βHSD1 in HR cells under hypoxia (Fig. 4D and E). To determine the significance of HIF2α-mediated upregulation of 3βHSD1, we compared DHEA metabolism in cells with and without HIF2α overexpression. Conversion of DHEA to AD was increased by HIF2α (Fig. 4F) but not HIF1α (Supplementary Fig. S5A and B) overexpression under normoxia. DHEA-mediated upregulation of AR targets was also enhanced by HIF2α overexpression (Fig. 4G).
HIF transcriptional activity is also regulated by asparaginyl hydroxylation, mediated by factor inhibiting HIF-1 (FIH1). Hydroxylation on the conserved asparagine residue in the HIFα C-terminal transactivation domain prevents its interaction with the co-activator EP300 (18,19), which has been suggested to be critical for transcriptional activity of HIF1α, but not HIF2α (33). However, our data suggest that EP300 knockdown decreases 3βHSD1 in HR cells under hypoxia (Supplementary Fig. S6A and B). Moreover, the mutation of N847 to A, which abolishes the FIH1-mediated HIF2α hydroxylation, further enhanced HIF2α-mediated 3βHSD1 upregulation under normoxia (Supplementary Fig. S6C and D). These data together suggest that HIF2α-mediated 3βHSD1 upregulation requires EP300 binding.
HIF2α directly targets the 5’ regulatory region of HSD3B1.
We compared, using actinomycin D treatment-based mRNA half-life measurements, the stability of HSD3B1 mRNA in cells with and without dominant-positive HIF2α overexpression. Our results suggest that HIF2α overexpression cannot increase HSD3B1 mRNA stability under normoxia, indicating that HIF2α upregulates 3βHSD1 by increasing HSD3B1 transcription (Fig. 5A). HIF2α-mediated 3βHSD1 upregulation was also largely abolished in cells with ARNT knockdown (shRNA) (Fig. 5B). siRNA-mediated ARNT knockdown also largely dampened 3βHSD1 upregulation induced by HIF2α overexpression (Fig. 5C). We next examined whether HIF2α directly targets the 5’ regulatory region of HSD3B1. Six pairs of primers (P1 to P6) were designed to amplify 6 regions of the HSD3B1 5’ regulatory region (Fig. 5D). Chromatin immunoprecipitation (ChIP) assay results suggest that in the cells with HA-tagged HIF2α overexpression, HA-tagged HIF2α binds to the P6 region under normoxia (Fig. 5E). ChIP assay in HR cells indicated endogenous HIF2α and ARNT also binds to the P6 region under hypoxia (Fig. 5F and G). HA-tagged HIF2α overexpression also increased the activity of a luciferase reporter fused with the 5’ regulatory region of HSD3B1 under normoxia (Fig. 5H). These findings suggest that HIF2α targets the P6 area of the HSD3B1 5’ regulatory region.
Fig. 5. HIF2α directly targets the 5’ regulatory region of HSD3B1.
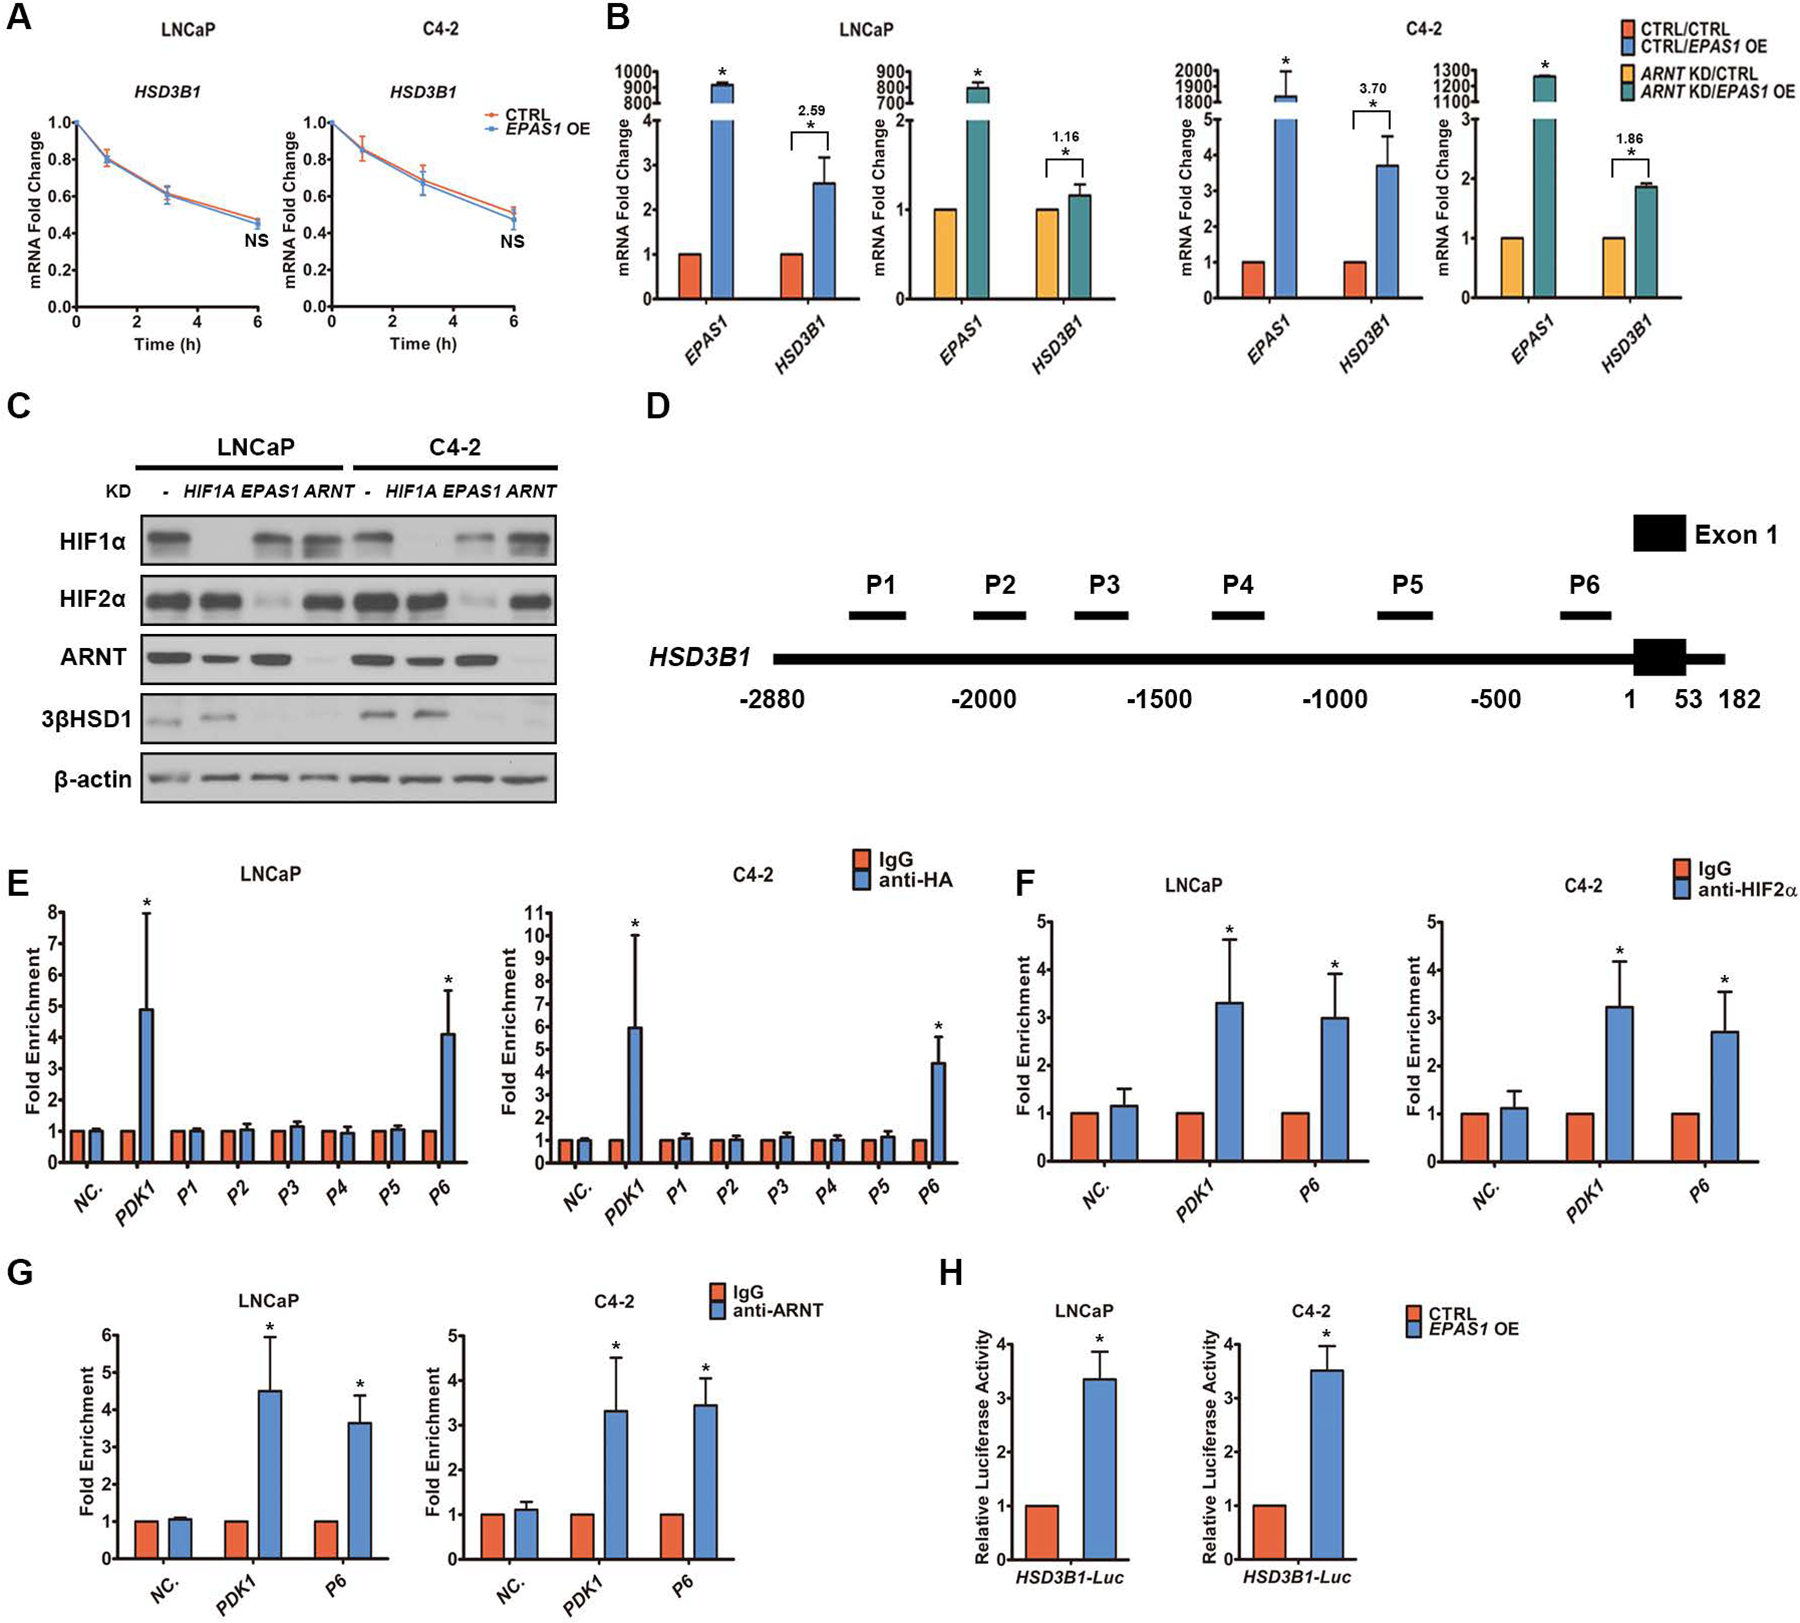
A. HSD3B1 mRNA was quantified by qPCR in cells with HA-tagged HIF2α overexpression (OE) and control cells at different time points following actinomycin D treatment under normoxia. Time 0 represents the point of actinomycin D addition. B. HA-tagged HIF2α was overexpressed in both control cells and cells with shRNA-mediated ARNT knockdown (KD) under normoxia. EPAS1 and HSD3B1 mRNA was quantified by qPCR. The numbers above the asterisks denote fold change. C. HA-tagged HIF2α was overexpressed in cells with and without siRNA-mediated HIF knockdown under normoxia, and HIF and 3βHSD1 protein expression was determined by Western blot. β-actin was a loading control. D. The 5’ regulatory region of HSD3B1 for the scanning ChIP assay. Six regions were amplified by six pairs of primers (P1 to P6). E. The six regions of the 5’ regulatory region of HSD3B1 were measured by qPCR in cells with HA-tagged HIF2α overexpression under normoxia. qPCR was performed on the fragmented chromatin precipitated by anti-HA or control IgG antibody. The primers targeting the promoter region of PDK1, which has been reported to bind HIF2, were used as a positive control. Human negative control primer set 1 (71001) from Active Motif was used as negative ChIP control (NC.). F-G. The P6 region of the HSD3B1 5’ regulatory region was measured by qPCR in HR cells under hypoxia. qPCR was performed on the fragmented chromatin precipitated by anti-HIF2α (F), anti-ARNT (G), or control IgG antibody. The primers targeting the promoter region of PDK1 were used as a positive control. Human negative control primer set 1 (71001) from Active Motif was used as negative ChIP control (NC.). H. The 5’ regulatory region of HSD3B1 was fused to a luciferase reporter to generate a promoter-luciferase construct that was then transfected into cells with HA-tagged HIF2α overexpression and control cells under normoxia. Error bars represent mean ± SEM. *P<0.05 using an unpaired two-tailed t test.
HIF2α is required for 3βHSD1-dependent tumor progression.
To determine the role of HIF2α in tumorigenesis, especially that dependent on 3βHSD1, we stably overexpressed dominant-positive HIF2α in both wild-type and HSD3B1-deleted C4-2 cells. HIF2α overexpression upregulated 3βHSD1 (Fig. 6A) and promoted cell proliferation in vitro, which largely depended on 3βHSD1 (Fig. 6B). A xenograft study in surgically orchiectomized mice showed that HIF2α overexpression promoted tumorigenesis in vivo, which also largely depended on 3βHSD1 (Fig. 6C). These data together suggest that HIF2α acts to upregulate 3βHSD1 expression to promote prostate tumorigenesis. We next analyzed androgen level in these tumor samples by mass spectrometry. The production of active androgens, such as T and DHT, was significantly increased by HIF2α overexpression, which is dependent on 3βHSD1 (Fig. 6D). Next, we compared the association between expression of HIF2α and 3βHSD1 in the peripheral and transitional zones of prostate tissues from patients with localized prostate cancer. Radical prostatectomy tissues generally exhibited greater 3βHSD1 protein expression where HIF2α was also elevated (Fig. 6E).
Fig. 6. In vivo analysis of tumors with HIF2α overexpression.
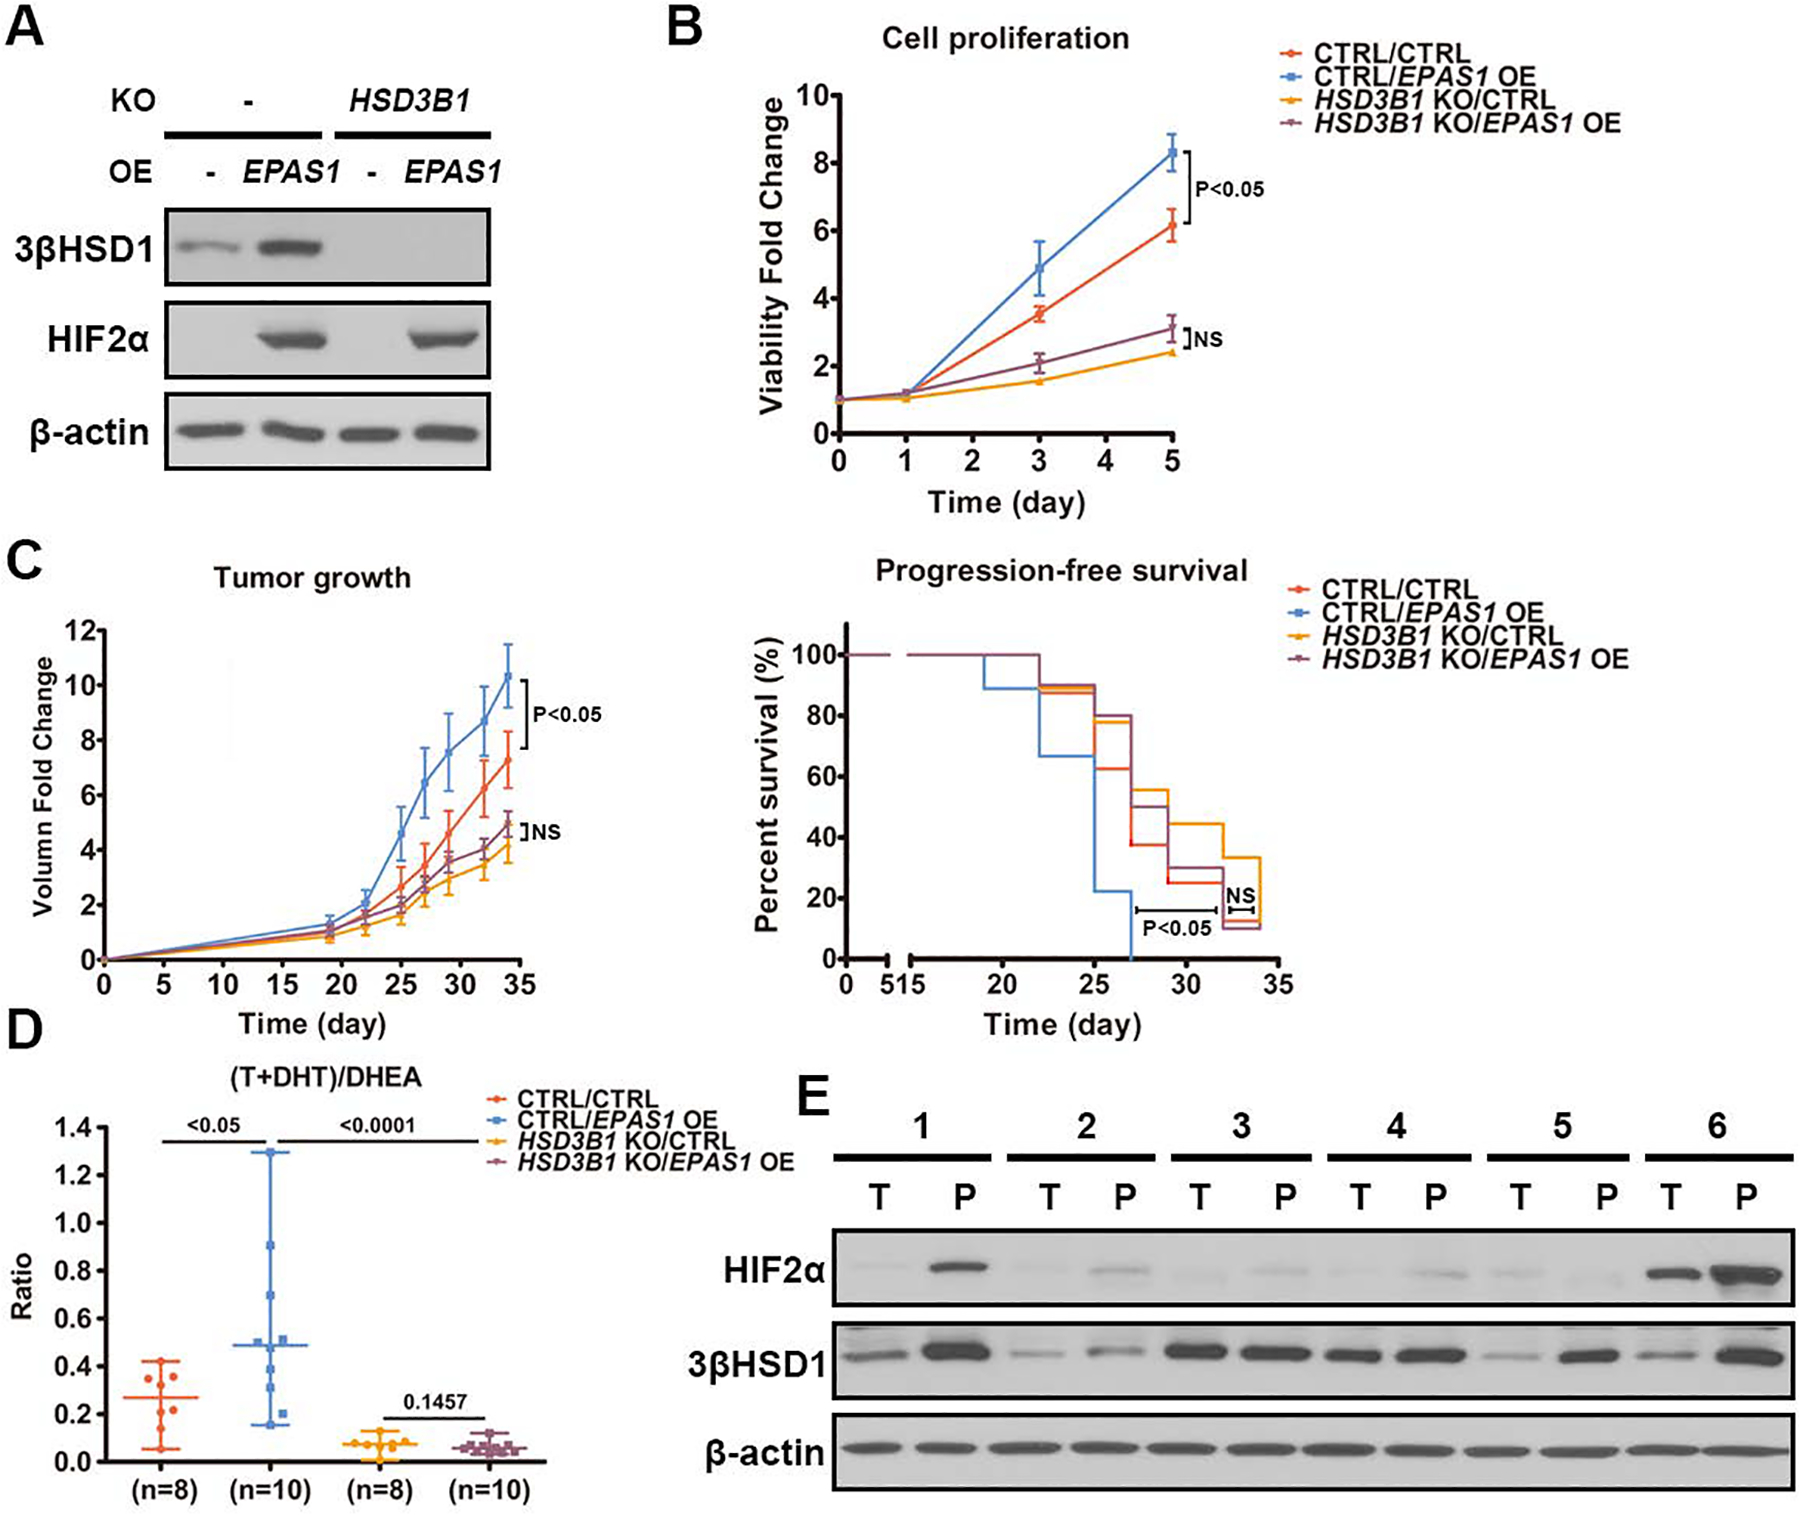
A. 3βHSD1 and HA-tagged HIF2α protein expression in HSD3B1 knockout (KO) and control C4-2 cells with and without HA-tagged HIF2α overexpression was determined by Western blot. β-actin was a loading control. B. The proliferation of the cells in Fig. 6A was measured by luciferase assay. The cells were treated with DHEA (100nM). The proliferation was compared using an unpaired two-tailed t test on day 5. C. Change in tumor volume and progression-free survival in a xenograft study using the cells in Fig. 6A with DHEA treatment after castration. Castration and DHEA pellet implantation was performed 19 days after cell injection. Tumor volume was compared using an unpaired two-tailed t test on day 34. Progression-free survival was assessed as time from cell injection to tumor volume of 800 mm3, and compared using a log-rank (Mantel-Cox) test. D. T, DHT and DHEA were measured in xenograft tumor samples from Fig. 6C using mass spectrometry and the ratio of (T+DHT)/DHEA is shown in each xenograft group. E. 3βHSD1 and HIF2α protein expression in radical prostatectomy tissues from 6 patients with localized prostate cancer was determined by Western blot. β-actin was a loading control. “T” and “P” represent transitional zone and peripheral zone, respectively. Error bars represent mean ± SEM.
Pharmacologic HIF2 inhibition suppresses cell growth via inhibiting the transactivation activity of HIF2.
Considering the critical role HIF2 plays in upregulating 3βHSD1 expression, we tested whether PT2399, a selective HIF2 antagonist, can downregulate 3βHSD1. PT2399 has been shown to dissociate the HIF2α and ARNT complex in clear-cell renal cell carcinoma and suppress tumorigenesis (34–36). PT2399 significantly decreased nuclear HIF2α expression in HR cells under hypoxia, without affecting HIF1α nuclear localization (Fig. 7A). The association of HIF2α with ARNT was also abolished by PT2399 (Fig. 7B and C). PT2399 also decreased the expression of several HIF2 targets, including HSD3B1 (Fig. 7D). In contrast, it robustly increased VEGFA expression for unknown reasons (Fig. 7D), suggesting that VEGFA regulation differs from that of the other HIF2 targets tested here. We next compared the effects of PT2399 treatment, androgen starvation, and the combination of both in HR cells under hypoxia. Androgen starvation was achieved by culturing the cells in charcoal-stripped media to mimic ADT in vitro. Our results showed that the combination of both PT2399 and androgen starvation resulted in a greater loss of cell viability compared with the single treatments, which suggests that HIF2 is critical to cell survival under hypoxia (Fig. 7E).
Fig. 7. PT2399 suppresses cell growth via inhibiting transactivation activity of HIF2.
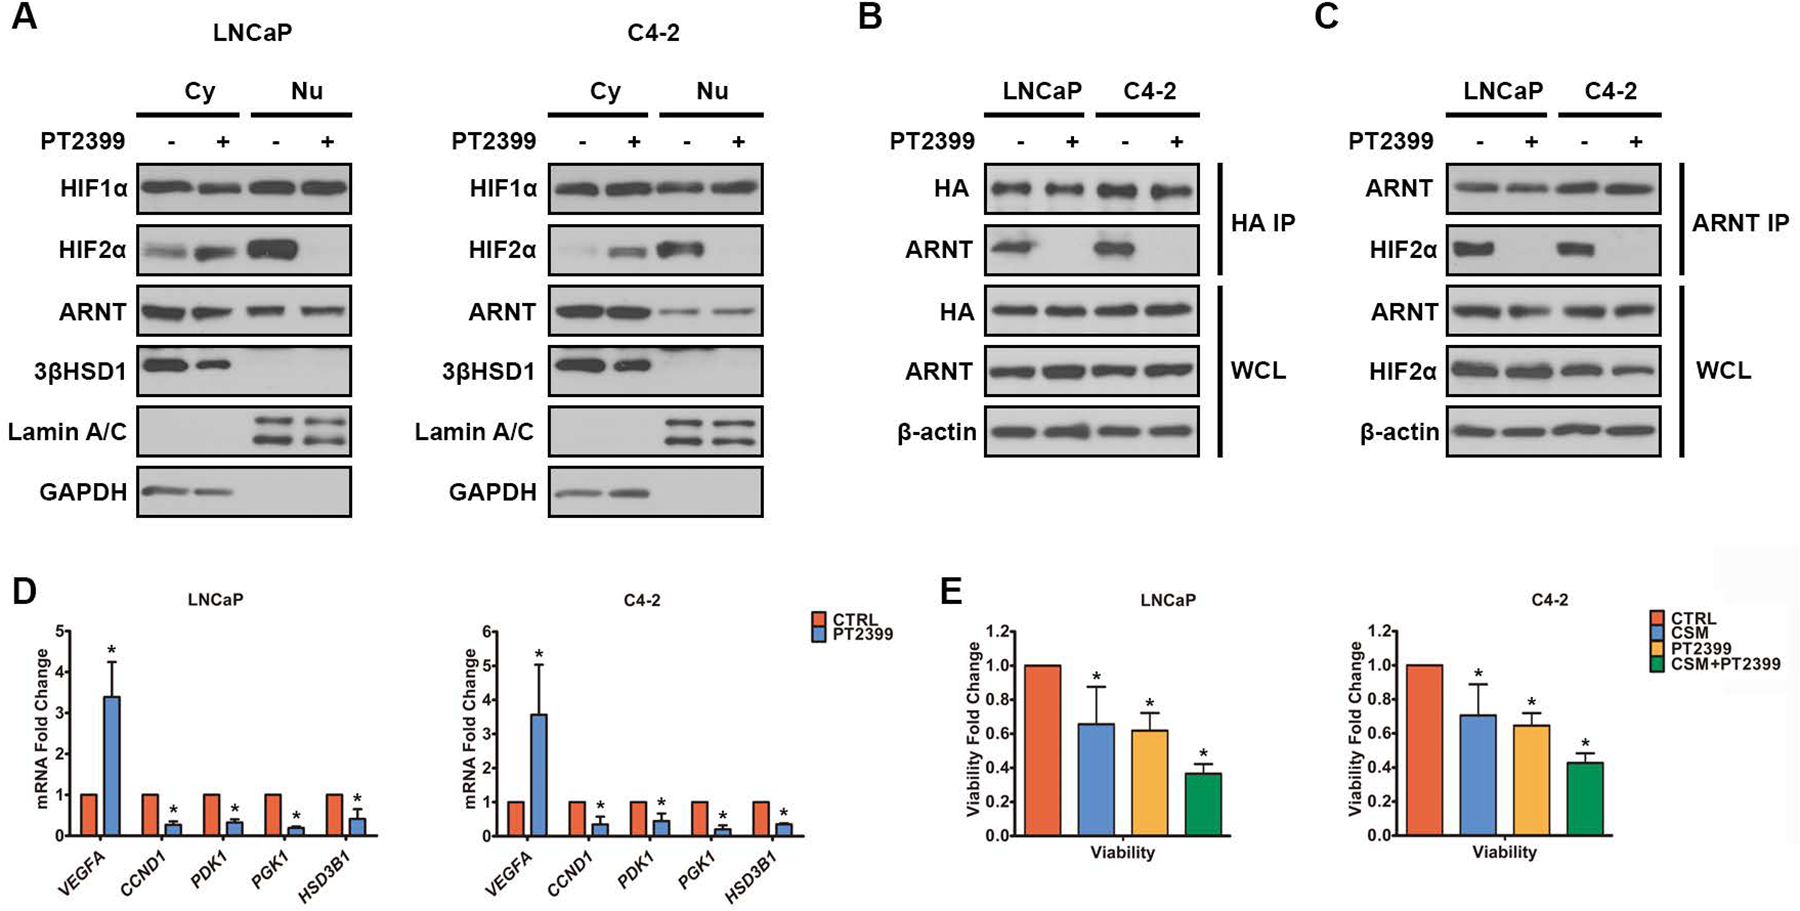
A. HIF and 3βHSD1 in cytoplasm (Cy) and nucleus (Nu) in HR cells treated with either PT2399 (50μM) or DMSO for 24h under hypoxia were determined by Western blot. Lamin A/C and GAPDH were determined as markers of the nucleus and cytoplasm, respectively. B. Cells with HA-tagged HIF2α overexpression were treated with either PT2399 (50μM) or DMSO for 24h under normoxia. HA-tagged HIF2α and ARNT were coimmunoprecipitated by anti-HA antibody. C. ARNT and HIF2α were coimmunoprecipitated by anti-ARNT antibody in HR cells treated with either PT2399 (50μM) or DMSO for 24h under hypoxia. D. HSD3B1 and HIF targets mRNA was determined by qPCR in HR cells treated with either PT2399 (50μM) or DMSO for 24h under hypoxia. E. HR cells were pre-cultured in either complete media or charcoal-stripped media (CSM) for 48h, and then treated with either DMSO (CTRL) or PT2399 (50μM) for 24h under hypoxia. The cell viability was measured using a Promega luciferase assay. Error bars represent mean ± SEM. *P<0.05 using an unpaired two-tailed t test.
Discussion:
Although increasing evidence indicates hypoxia is critical to prostate cancer progression (17,20–23), whether and how it affects androgen metabolism—a major driver of CRPC—is unknown. This issue is of critical importance because extragonadal androgen synthesis is clinically validated as a central driver of tumor progression. For example, the mechanism of abiraterone acetate, which confers a survival benefit in advanced and metastatic prostate cancer, is by blocking androgen metabolism (37,38). Understanding the effects of oxygenation on intratumoral androgen metabolism is therefore essential.
Our findings suggest that hypoxia induces changes in expression of multiple steroidogenic enzymes. Many of these enzymes directionally oppose one another by catalyzing competing reactions. For example, we found that expression of multiple 17βHSD enzymes with oxidative (17βHSD2, 17βHSD4) or reductive (17βHSD3, 17βHSD5) directionality is altered with hypoxia. Such complex alterations in expression, coupled with changes in cofactor regulation, are difficult to assess individually. Instead, the most important experimental observation is probably the net effect on androgen metabolism.
Of the androgen metabolism enzymes affected by hypoxia, 3βHSD1 catalyzes the only reaction that is rate-limiting, irreversible, and genetically validated for clinical outcomes in prostate cancer as a predictive genetic biomarker for resistance to gonadal testosterone depletion therapy and overall survival (39,40). Although our study mechanistically implicates the HIF pathway in transcriptionally regulating HSD3B1, chronic hypoxia alone is insufficient for increasing androgen metabolic flux through the enzymatic step catalyzed by 3βHSD1. Instead, transcriptional upregulation of HSD3B1 and 3βHSD1 by hypoxia must be coupled with reoxygenation in order to replenish cofactors necessary for this step (Fig. 8).
Fig. 8. Proposed regulation of androgen synthesis by cyclic hypoxia-reoxygenation in CRPC.
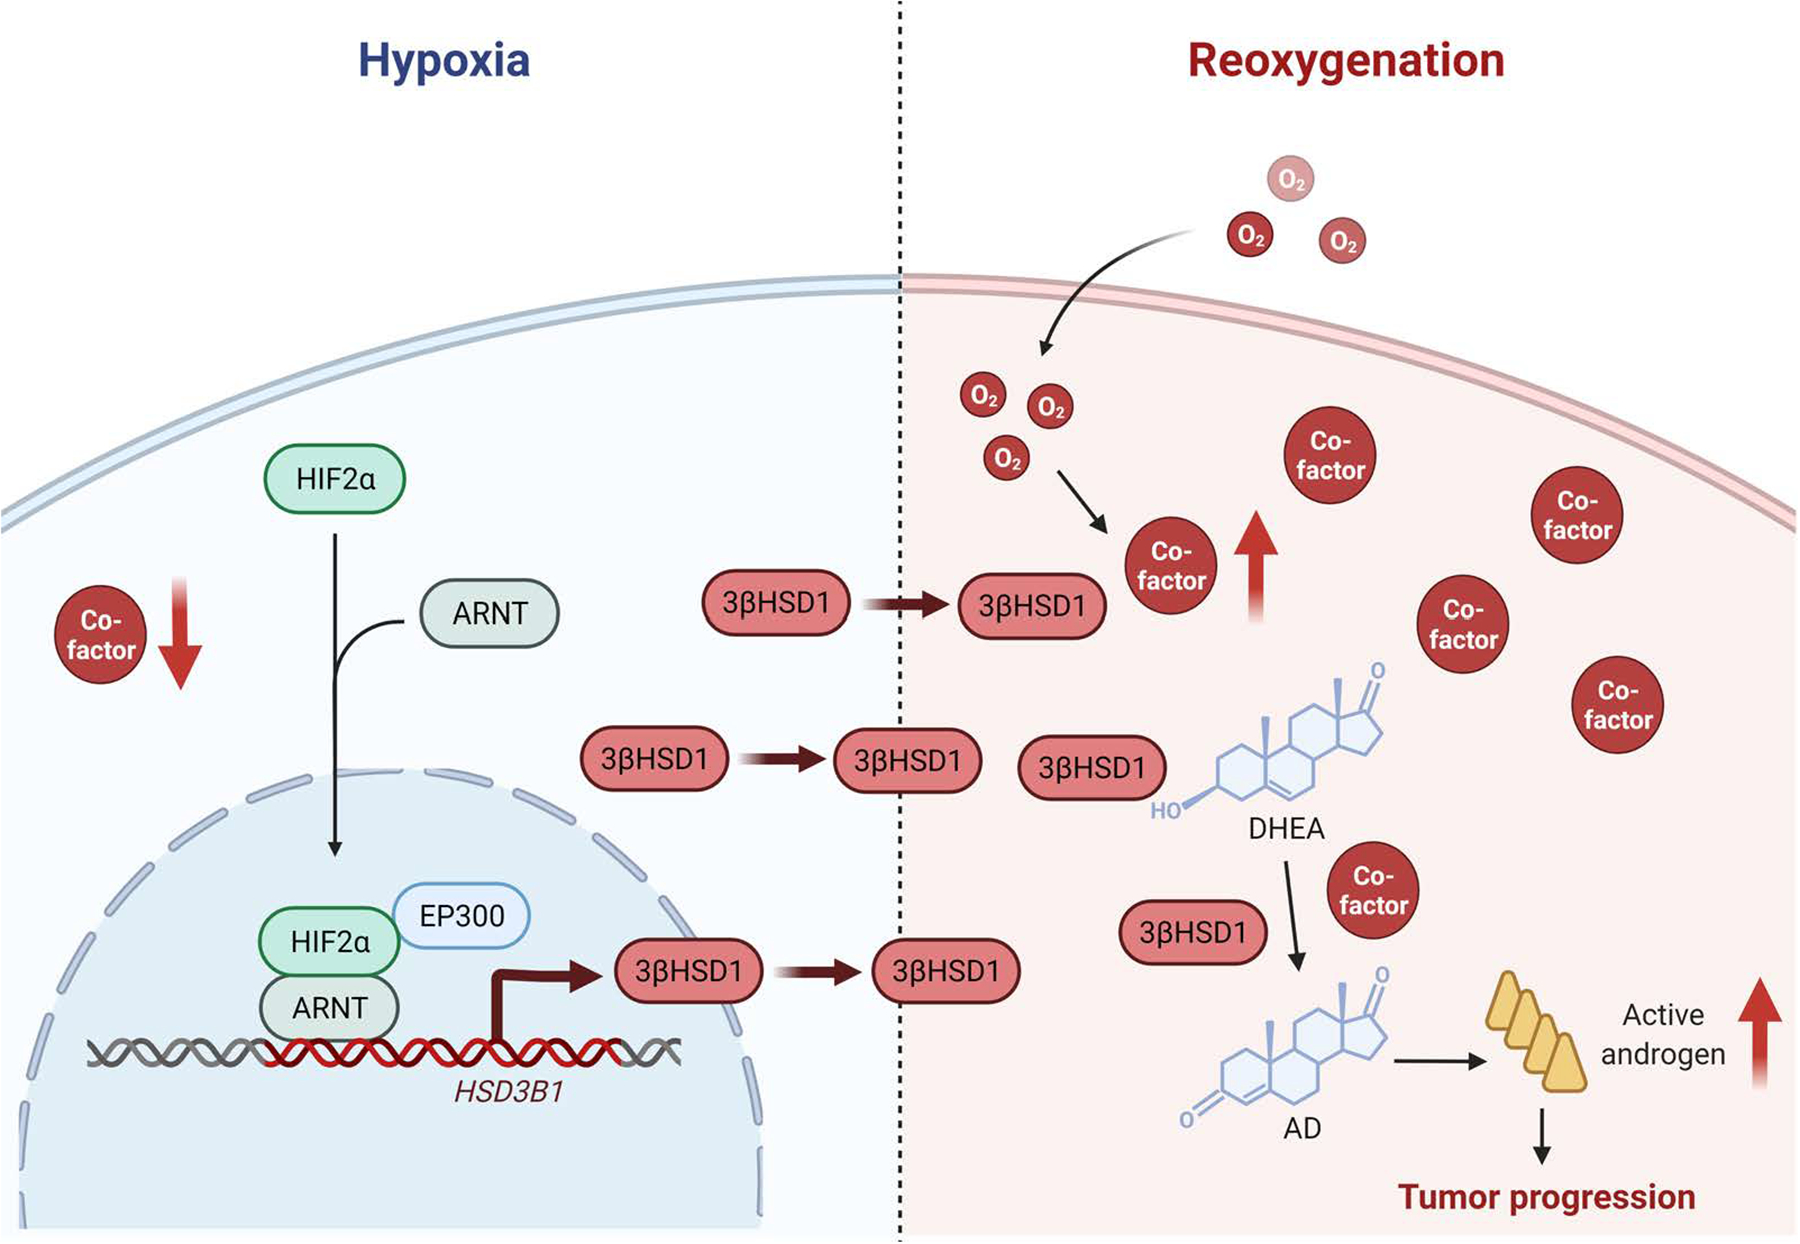
Hypoxia stabilizes HIF2α, which translocates to the nucleus and dimerizes with HIF1β to induce the transcription of HSD3B1. Then reoxygenation increases androgen production by rapidly increasing the cofactors without reducing 3βHSD1 protein in the short term.
Reoxygenation after chronic hypoxia occurs after neovascularization, cell death which provides increased oxygenation to the remaining tumor, or modification of other determinants of blood flow (41). ADT is used as standard of care both for localized prostate cancer (in combination with radiotherapy) as well as for metastatic disease (42). Therefore, the pathophysiology of hypoxia-reoxygenation and its role in androgen metabolism are relevant to both of these clinical settings. In fact, HSD3B1-driven clinical outcomes have been demonstrated for men with prostate cancer treated with local radiotherapy + ADT (43), in addition to multiple studies in the setting of metastatic prostate cancer (16). Our data suggest that hypoxia-reoxygenation can augment the behavior of the less metabolically active adrenal-restrictive HSD3B1 to effectively mimic adrenal-permissive behavior. Alternatively, hypoxia-reoxygenation could magnify the effects of adrenal-permissive HSD3B1 inheritance. Further, the in vivo data (Fig. 6C) suggest that HSD3B1 is a major component necessary for HIF-driven prostate cancer progression.
The functional outcomes associated with the hypoxic activation of the two transcriptionally active isoforms of HIF, HIF1 and HIF2, remain an area of active investigation. Although these transcription factors share a subset of hypoxia-responsive target genes, their biological functions remain non-overlapping, perhaps due to the differences in (a) expression patterns in different tissues, (b) sensitivity to oxygen loss, (c) the kinetics of their activation in response to hypoxia, and (d) the existence of isoform-specific targets. HIF1 is associated with response to acute hypoxia, whereas HIF2 stabilization is sustained in chronic hypoxia (44). Moreover, HIF2, but not HIF1, has been identified as a key oncogenic driver in pVHL-deficient cancers (e.g., clear-cell renal cell carcinoma)(45–49). We find that expression of 3βHSD1 occurs upon chronic exposure to hypoxia, with kinetics that are consistent with HIF2 activation. Our findings in prostate cancer reinforce this notion of “division-of-labor” between the HIF isoforms and suggest that activation of 3βHSD1 combats the metabolic stress imposed by chronic oxygen loss in prostate cancer cells.
Our study suggests that HIF2 may be a therapeutic target in prostate cancer and that PT2399 specifically blocks extragonadal androgen synthesis, which is critical for driving CRPC. New therapeutic strategies might include the addition of PT2399 to ADT in order to delay the development of CRPC. Alternatively, PT2399 might be investigated in addition to upfront treatment with ADT in combination with potent anti-androgens (e.g., abiraterone, enzalutamide, or apalutamide).
Separate from its role in prostate cancer, 3βHSD1 is also one step upstream of aromatase and therefore has physiologic relevance for the synthesis of estrogens in postmenopausal women. Homozygous adrenal-permissive HSD3B1 inheritance is linked to ER-positive postmenopausal breast cancer and accounts for about 5% of such cases (50). Hypoxia-reoxygenation may therefore drive local estrogen synthesis in postmenopausal breast cancer. Thus, these findings might have implications for the use and selection of systemic therapies (e.g., aromatase inhibitors) for women with breast cancer.
In summary, we show that hypoxia coupled with reoxygenation hastens the conversion from adrenal precursor steroids to potent androgens by sequentially increasing the expression of HSD3B1 and eliciting the production of cofactors required for activation of its encoded enzyme (Fig. 8). Notably, the EGLN1/VHL/HIF2 pathway is essential for promotion of HSD3B1 transcription and development of CRPC. HIF2 may be a therapeutic target in prostate cancer, and PT2399 should be investigated to counter androgen metabolic mechanisms that promote resistance to hormonal therapies.
Supplementary Material
Statement of Significance.
Hypoxia followed by reoxygenation in prostate cancer drives androgen deprivation therapy resistance via increasing the rate-limiting enzyme and cofactors for androgen synthesis, revealing HIF2α as a therapeutic target to subvert resistance.
Acknowledgements
We gratefully acknowledge Cassandra Talerico, Ph.D., for editing the manuscript. This work has been supported by R01CA261995, R01CA236780, R01CA172382, R01CA249279 (to N.S.), R50CA251961 (to M.B.), by grants from the U.S. Army Medical Research and Development Command (W81XWH2010137 and W81XWH-22-1-0082 to N.S. and W81XWH1810163 to L.Q.), and a Prostate Cancer Foundation Challenge Award (to N.S.).
Footnotes
Conflict of interest
None of the authors have a conflict of interest associated with the work presented here.
References
- 1.Wang G, Zhao D, Spring DJ, DePinho RA. Genetics and biology of prostate cancer. Genes Dev 2018;32:1105–40 [DOI] [PMC free article] [PubMed] [Google Scholar]
- 2.Attard G, Parker C, Eeles RA, Schröder F, Tomlins SA, Tannock I, et al. Prostate cancer. Lancet (London, England) 2016;387:70–82 [DOI] [PubMed] [Google Scholar]
- 3.Litwin MS, Tan HJ. The Diagnosis and Treatment of Prostate Cancer: A Review. Jama 2017;317:2532–42 [DOI] [PubMed] [Google Scholar]
- 4.Desai K, McManus JM, Sharifi N. Hormonal Therapy for Prostate Cancer. Endocrine reviews 2021;42:354–73 [DOI] [PMC free article] [PubMed] [Google Scholar]
- 5.Sharifi N Minireview: Androgen metabolism in castration-resistant prostate cancer. Molecular endocrinology (Baltimore, Md) 2013;27:708–14 [DOI] [PMC free article] [PubMed] [Google Scholar]
- 6.Chang KH, Ercole CE, Sharifi N. Androgen metabolism in prostate cancer: from molecular mechanisms to clinical consequences. British journal of cancer 2014;111:1249–54 [DOI] [PMC free article] [PubMed] [Google Scholar]
- 7.Montgomery RB, Mostaghel EA, Vessella R, Hess DL, Kalhorn TF, Higano CS, et al. Maintenance of intratumoral androgens in metastatic prostate cancer: a mechanism for castration-resistant tumor growth. Cancer research 2008;68:4447–54 [DOI] [PMC free article] [PubMed] [Google Scholar]
- 8.Ferraldeschi R, Sharifi N, Auchus RJ, Attard G. Molecular pathways: Inhibiting steroid biosynthesis in prostate cancer. Clinical cancer research : an official journal of the American Association for Cancer Research 2013;19:3353–9 [DOI] [PMC free article] [PubMed] [Google Scholar]
- 9.Chang KH, Li R, Papari-Zareei M, Watumull L, Zhao YD, Auchus RJ, et al. Dihydrotestosterone synthesis bypasses testosterone to drive castration-resistant prostate cancer. Proc Natl Acad Sci U S A 2011;108:13728–33 [DOI] [PMC free article] [PubMed] [Google Scholar]
- 10.Dai C, Chung YM, Kovac E, Zhu Z, Li J, Magi-Galluzzi C, et al. Direct Metabolic Interrogation of Dihydrotestosterone Biosynthesis from Adrenal Precursors in Primary Prostatectomy Tissues. Clinical cancer research : an official journal of the American Association for Cancer Research 2017;23:6351–62 [DOI] [PMC free article] [PubMed] [Google Scholar]
- 11.Simard J, Ricketts ML, Gingras S, Soucy P, Feltus FA, Melner MH. Molecular biology of the 3beta-hydroxysteroid dehydrogenase/delta5-delta4 isomerase gene family. Endocrine reviews 2005;26:525–82 [DOI] [PubMed] [Google Scholar]
- 12.Thomas JL, Frieden C, Nash WE, Strickler RC. An NADH-induced conformational change that mediates the sequential 3 beta-hydroxysteroid dehydrogenase/isomerase activities is supported by affinity labeling and the time-dependent activation of isomerase. J Biol Chem 1995;270:21003–8 [DOI] [PubMed] [Google Scholar]
- 13.Thomas JL, Duax WL, Addlagatta A, Brandt S, Fuller RR, Norris W. Structure/function relationships responsible for coenzyme specificity and the isomerase activity of human type 1 3 beta-hydroxysteroid dehydrogenase/isomerase. J Biol Chem 2003;278:35483–90 [DOI] [PubMed] [Google Scholar]
- 14.Chang KH, Li R, Kuri B, Lotan Y, Roehrborn CG, Liu J, et al. A gain-of-function mutation in DHT synthesis in castration-resistant prostate cancer. Cell 2013;154:1074–84 [DOI] [PMC free article] [PubMed] [Google Scholar]
- 15.Hettel D, Sharifi N. HSD3B1 status as a biomarker of androgen deprivation resistance and implications for prostate cancer. Nature reviews Urology 2018;15:191–6 [DOI] [PubMed] [Google Scholar]
- 16.Thomas L, Sharifi N. Germline HSD3B1 Genetics and Prostate Cancer Outcomes. Urology 2020;145:13–21 [DOI] [PMC free article] [PubMed] [Google Scholar]
- 17.Bhandari V, Hoey C. Molecular landmarks of tumor hypoxia across cancer types. 2019;51:308–18 [DOI] [PubMed] [Google Scholar]
- 18.Wigerup C, Påhlman S, Bexell D. Therapeutic targeting of hypoxia and hypoxia-inducible factors in cancer. Pharmacology & therapeutics 2016;164:152–69 [DOI] [PubMed] [Google Scholar]
- 19.Wilkins SE, Abboud MI, Hancock RL, Schofield CJ. Targeting Protein-Protein Interactions in the HIF System. ChemMedChem 2016;11:773–86 [DOI] [PMC free article] [PubMed] [Google Scholar]
- 20.Ashton J, Bristow R. Bad neighbours: hypoxia and genomic instability in prostate cancer. The British journal of radiology 2020;93:20200087 [DOI] [PMC free article] [PubMed] [Google Scholar]
- 21.Ranasinghe WK, Baldwin GS, Bolton D, Shulkes A, Ischia J, Patel O. HIF1α expression under normoxia in prostate cancer--which pathways to target? The Journal of urology 2015;193:763–70 [DOI] [PubMed] [Google Scholar]
- 22.Fraga A, Ribeiro R, Príncipe P, Lopes C, Medeiros R. Hypoxia and Prostate Cancer Aggressiveness: A Tale With Many Endings. Clinical genitourinary cancer 2015;13:295–301 [DOI] [PubMed] [Google Scholar]
- 23.Deep G, Panigrahi GK. Hypoxia-Induced Signaling Promotes Prostate Cancer Progression: Exosomes Role as Messenger of Hypoxic Response in Tumor Microenvironment. Critical reviews in oncogenesis 2015;20:419–34 [DOI] [PMC free article] [PubMed] [Google Scholar]
- 24.Mitani T, Minami M, Harada N, Ashida H, Yamaji R. Autophagic degradation of the androgen receptor mediated by increased phosphorylation of p62 suppresses apoptosis in hypoxia. Cellular signalling 2015;27:1994–2001 [DOI] [PubMed] [Google Scholar]
- 25.Eales KL, Hollinshead KE, Tennant DA. Hypoxia and metabolic adaptation of cancer cells. Oncogenesis 2016;5:e190. [DOI] [PMC free article] [PubMed] [Google Scholar]
- 26.Qi J, Nakayama K, Cardiff RD, Borowsky AD, Kaul K, Williams R, et al. Siah2-dependent concerted activity of HIF and FoxA2 regulates formation of neuroendocrine phenotype and neuroendocrine prostate tumors. Cancer cell 2010;18:23–38 [DOI] [PMC free article] [PubMed] [Google Scholar]
- 27.Gossage L, Eisen T, Maher ER. VHL, the story of a tumour suppressor gene. Nat Rev Cancer 2015;15:55–64 [DOI] [PubMed] [Google Scholar]
- 28.Bruick RK, McKnight SL. A conserved family of prolyl-4-hydroxylases that modify HIF. Science 2001;294:1337–40 [DOI] [PubMed] [Google Scholar]
- 29.Jaakkola P, Mole DR, Tian YM, Wilson MI, Gielbert J, Gaskell SJ, et al. Targeting of HIF-alpha to the von Hippel-Lindau ubiquitylation complex by O2-regulated prolyl hydroxylation. Science 2001;292:468–72 [DOI] [PubMed] [Google Scholar]
- 30.Yan Q, Bartz S, Mao M, Li L, Kaelin WG, Jr. The hypoxia-inducible factor 2alpha N-terminal and C-terminal transactivation domains cooperate to promote renal tumorigenesis in vivo. Mol Cell Biol 2007;27:2092–102 [DOI] [PMC free article] [PubMed] [Google Scholar]
- 31.Wu D, Su X, Lu J, Li S, Hood BL, Vasile S, et al. Bidirectional modulation of HIF-2 activity through chemical ligands. Nat Chem Biol 2019;15:367–76 [DOI] [PMC free article] [PubMed] [Google Scholar]
- 32.Chen W, Hill H, Christie A, Kim MS, Holloman E, Pavia-Jimenez A, et al. Targeting renal cell carcinoma with a HIF-2 antagonist. Nature 2016;539:112–7 [DOI] [PMC free article] [PubMed] [Google Scholar]
- 33.Cho H, Du X, Rizzi JP, Liberzon E, Chakraborty AA, Gao W, et al. On-target efficacy of a HIF-2alpha antagonist in preclinical kidney cancer models. Nature 2016;539:107–11 [DOI] [PMC free article] [PubMed] [Google Scholar]
- 34.James ND, de Bono JS, Spears MR, Clarke NW, Mason MD, Dearnaley DP, et al. Abiraterone for Prostate Cancer Not Previously Treated with Hormone Therapy. The New England journal of medicine 2017;377:338–51 [DOI] [PMC free article] [PubMed] [Google Scholar]
- 35.Fizazi K, Tran N, Fein L, Matsubara N, Rodriguez-Antolin A, Alekseev BY, et al. Abiraterone plus Prednisone in Metastatic, Castration-Sensitive Prostate Cancer. The New England journal of medicine 2017;377:352–60 [DOI] [PubMed] [Google Scholar]
- 36.Hearn JWD, Sweeney CJ, Almassi N, Reichard CA, Reddy CA, Li H, et al. HSD3B1 Genotype and Clinical Outcomes in Metastatic Castration-Sensitive Prostate Cancer. JAMA oncology 2020;6:e196496. [DOI] [PMC free article] [PubMed] [Google Scholar]
- 37.Naelitz BD, Sharifi N. Through the Looking-Glass: Reevaluating DHEA Metabolism Through HSD3B1 Genetics. Trends in endocrinology and metabolism: TEM 2020;31:680–90 [DOI] [PMC free article] [PubMed] [Google Scholar]
- 38.Bharti SK, Kakkad S, Danhier P, Wildes F, Penet MF, Krishnamachary B, et al. Hypoxia Patterns in Primary and Metastatic Prostate Cancer Environments. Neoplasia (New York, NY) 2019;21:239–46 [DOI] [PMC free article] [PubMed] [Google Scholar]
- 39.Desai MH, Parsi M, Potdar RR. Triple-arm androgen blockade for advanced prostate cancer: a review. Medical oncology (Northwood, London, England) 2021;38:75. [DOI] [PubMed] [Google Scholar]
- 40.Hearn JWD, Xie W, Nakabayashi M, Almassi N, Reichard CA, Pomerantz M, et al. Association of HSD3B1 Genotype With Response to Androgen-Deprivation Therapy for Biochemical Recurrence After Radiotherapy for Localized Prostate Cancer. JAMA oncology 2018;4:558–62 [DOI] [PMC free article] [PubMed] [Google Scholar]
- 41.Ginouvès A, Ilc K, Macías N, Pouysségur J, Berra E. PHDs overactivation during chronic hypoxia “desensitizes” HIFalpha and protects cells from necrosis. Proc Natl Acad Sci U S A 2008;105:4745–50 [DOI] [PMC free article] [PubMed] [Google Scholar]
- 42.Beroukhim R, Brunet JP, Di Napoli A, Mertz KD, Seeley A, Pires MM, et al. Patterns of gene expression and copy-number alterations in von-hippel lindau disease-associated and sporadic clear cell carcinoma of the kidney. Cancer research 2009;69:4674–81 [DOI] [PMC free article] [PubMed] [Google Scholar]
- 43.Goda N, Ryan HE, Khadivi B, McNulty W, Rickert RC, Johnson RS. Hypoxia-inducible factor 1alpha is essential for cell cycle arrest during hypoxia. Mol Cell Biol 2003;23:359–69 [DOI] [PMC free article] [PubMed] [Google Scholar]
- 44.Maranchie JK, Vasselli JR, Riss J, Bonifacino JS, Linehan WM, Klausner RD. The contribution of VHL substrate binding and HIF1-alpha to the phenotype of VHL loss in renal cell carcinoma. Cancer cell 2002;1:247–55 [DOI] [PubMed] [Google Scholar]
- 45.Gordan JD, Lal P, Dondeti VR, Letrero R, Parekh KN, Oquendo CE, et al. HIF-alpha effects on c-Myc distinguish two subtypes of sporadic VHL-deficient clear cell renal carcinoma. Cancer cell 2008;14:435–46 [DOI] [PMC free article] [PubMed] [Google Scholar]
- 46.Shen C, Beroukhim R, Schumacher SE, Zhou J, Chang M, Signoretti S, et al. Genetic and functional studies implicate HIF1α as a 14q kidney cancer suppressor gene. Cancer discovery 2011;1:222–35 [DOI] [PMC free article] [PubMed] [Google Scholar]
- 47.Kruse ML, Patel M, McManus J, Chung YM, Li X, Wei W, et al. Adrenal-permissive HSD3B1 genetic inheritance and risk of estrogen-driven postmenopausal breast cancer. JCI insight 2021 [DOI] [PMC free article] [PubMed] [Google Scholar]
- 48.Sanjana NE, Shalem O, Zhang F. Improved vectors and genome-wide libraries for CRISPR screening. Nature methods 2014;11:783–4 [DOI] [PMC free article] [PubMed] [Google Scholar]
- 49.Ratnadiwakara M, Änkö M-L. mRNA Stability Assay Using Transcription Inhibition by Actinomycin D in Mouse Pluripotent Stem Cells. Bio-protocol 2018;8:e3072. [DOI] [PMC free article] [PubMed] [Google Scholar]
- 50.Zhu Z, Chung YM, Sergeeva O, Kepe V, Berk M, Li J, et al. Loss of dihydrotestosterone-inactivation activity promotes prostate cancer castration resistance detectable by functional imaging. J Biol Chem 2018;293:17829–37 [DOI] [PMC free article] [PubMed] [Google Scholar]
Associated Data
This section collects any data citations, data availability statements, or supplementary materials included in this article.
Supplementary Materials
Data Availability Statement
The data generated in this study are available within the article and its supplementary data files.