


Abstract
A physical mapping strategy has been developed to verify and accelerate the assembly and gap closure phase of a microbial genome shotgun-sequencing project. The protocol was worked out during the ongoing Pseudomonas putida KT2440 genome project. A macro-restriction map was constructed by linking probe hybridisation of SwaI- or I-CeuI-restricted chromosomes to serve as a backbone for the quick quality control of sequence and contig assemblies. The library of PCR-generated SwaI linking probes was derived from the sequence assembly after 3- and 6-fold genome coverage. In order to support gap closure in regions with ambiguous assemblies such as the repetitive sequence of the seven ribosomal operons, high-resolution Smith/Birnstiel maps were generated by Southern hybridisation of pulsed-field gel electrophoresis-separated rare-cutter complete/frequent-cutter partial digestions with rare-cutter fragment end probes. Overall 1.5 Mb of the 6.1 Mb P.putida KT2440 genome has been subjected to high-resolution physical mapping in order to align assemblies generated from shotgun sequencing.
INTRODUCTION
Most microbial genome sequencing projects are based on either a top-down or a bottom-up approach. The top-down or directed approach starts with the construction of large insert clone libraries that are ordered and sequenced clone-by-clone. This approach, which has been applied initially to the sequencing of bacterial species like Mycoplasma pneumoniae (1) or Escherichia coli (2) does not demand a large computational infrastructure; however, the mapping of clones is time-consuming. The alternative bottom-up or whole genome shotgun approach is based on random sequencing of small insert clone libraries up to 10-fold genome coverage (3). In this approach, the ordering of the single sequence runs is performed in an in silico assembly process that in principle does not require any physical mapping information. Sequence information is rapidly generated during the initial phase of a shotgun-genome sequencing project; however, the subsequent phase of gap closure is tedious, inherently resistant to automation and problem solving is based on case-to-case. Typical obstacles are large repeats such as the multi-copy ribosomal operons in bacterial genomes. During this critical phase of a genome project, independently obtained physical map information could support sequence assembly and gap closure.
Macro-restriction mapping has been applied to the examination of bacterial genome structures and topology for many years (4,5). It is based mainly on the technique of pulsed-field gel electrophoresis (PFGE) (6), which allows the separation of DNA fragments up to 10 Mb, combined with Southern blot analysis. Low-resolution macro-restriction maps were used during the Pseudomonas aeruginosa PAO genome project serving as scaffolds for quick verification of assembled contigs (7). An alternative, technically sophisticated mapping strategy, the optical mapping technique (8), visualises restriction fragments directly and was used to support the sequencing and assembly of the Deinococcus radiodurans (9) and Plasmodium falciparium (10) genomes.
We have applied the combined strategy of shotgun sequencing and macro-restriction mapping to the ongoing Pseudomonas putida strain KT2440 (11) genome project. The non-pathogenic bacterium P.putida KT2440 colonises soil and plant rhizosphere (12) and is characterised by a pronounced metabolical and physiological versatility. It promotes plant growth (13), is a biocontrol agent for plant pathogens (14) and has a broad capacity for bioremediation and biotransformation (15,16). A physical map of P.putida strain KT2440 was reported by Ramos-Diaz et al. who estimated a genome size of 6 Mb and identified six ribosomal operons (17). In the present study we independently constructed a SwaI/I-CeuI macro-restriction map of the sequenced isolate of KT2440 to exclude the possibility of any genome rearrangement or other inconsistencies to the published map (17). The closely related taxospecies P.aeruginosa, for example, showed (within some strains including the sequenced PAO1 strain) large inversions after a few rounds of sub-cultivation (7) or other complex reorganisation events (18). This precautious approach is justified by the differences that showed up between our maps and the published maps (17).
In order to resolve chromosomal regions that are known to be critical during the sequence assembly, we designed a novel application of the Smith/Birnstiel mapping technique (19), an elegant and simple method for high-resolution mapping of linear DNA molecules. In the original protocol, an end-labelled DNA fragment was partially digested with a restriction enzyme. The autoradiogram of the gel-separated restriction digests visualises the order of restriction recognition sites, i.e. a high-resolution restriction map. This technique has been extended from plasmid to genome mapping (20) or comparative genomics (21). In our project SwaI fragments of strain KT2440 that cover ribosomal operons or complex repeat regions were subjected to high-resolution mapping based on SwaI total/X partial digestions (X: AseI, BamHI, DraI, EcoRV, HindIII, NdeI, SpeI, SspI, XbaI and XhoI) of the chromosome. About 1.5 Mb of the genome was mapped with a resolution ranging between 5 and 50 kb.
MATERIALS AND METHODS
Pulsed-field gel electrophoresis
Bacteria cells were grown overnight in Luria–Bertani medium, harvested by centrifugation for 10 min at 1200 g, washed and suspended in SE buffer (75 mM NaCl, 25 mM EDTA, pH 7.4). A suspension of 5 × 10⁹, 1 × 10¹⁰ or 3 × 10¹⁰ cells/ml was mixed with an equal volume of 2% low gelling agarose (Sigma) and dispensed into moulds (10 × 6 × 1 mm). The resulting agarose plugs were incubated with 1 mg/ml Proteinase K in ES buffer (0.5 M EDTA, 1% N-laurylsarcosine, pH 9.5) at 56°C for 48 h and stored in ET buffer (10 mM Tris–HCl, 10 mM EDTA, pH 7.4) at 4°C. For one-dimensional separation of single or double digestions the chromosomes, embedded in agarose, were cut with SwaI, SpeI or I-CeuI as described previously by Römling et al. (18) and separated in a Bio-Rad CHEF-DR III cell. The running conditions were adjusted to the size of the fragments. For two-dimensional mapping (22), chromosomes were completely cut with SwaI and separated in the first dimension using two linear ramps from 20–90 s for 40 h and from 1–15 s for 10 h (E = 6 Vcm–1, 1.5% agarose gel in 0.5× TBE buffer). The lane was cut out, digested with I-CeuI for 5 h and separated perpendicular to the first run in the second dimension (one linear ramp, 1–12 s, 35 h).
Smith/Birnstiel mapping
Agarose-embedded chromosomes were cleaved with SwaI to completion followed by partial digestions with BamHI, EcoRV, HindIII, XhoI, AseI, DraI, NdeI, SpeI, SspI or XbaI. The separated DNA fragments were transferred onto nylon membranes (Amersham Hybond N, N+) by capillary blotting and hybridised with fragment end probes of the SwaI fragment of interest. Two enzyme concentrations were used to cover the whole SwaI fragment from both sides by creating preferentially either larger or smaller partial-restriction fragments.
SwaI linking probe library
For the generation of SwaI linking probes by PCR, primer pairs were designed from the sequence flanking SwaI sites found in the sequence assembly of the 3- and 6-fold genome coverage (Table 1). The amplified PCR fragments were cut with SwaI for quality control, separated by gel electrophoresis and extracted using the QIAGEN gel extraction kit. Probes were labelled with digoxigenin-UTP by random-primed labelling (Boehringer-Roche DIG labelling kit) and hybridised onto one- or two-dimensional PFGE blots as described previously (18). For Smith/Birnstiel mapping, the PCR products were cut with SwaI prior to labelling to generate SwaI fragment end probes. Each mapping experiment was repeated at least twice to minimise the influences of the amounts of chromosomal DNA, by probe and blot quality or the inter-experimental variability of PFGE.
Table 1. Primer sequences designed from the KT2440 genome sequence assembly for the generation of SwaI-spanning PCR products.
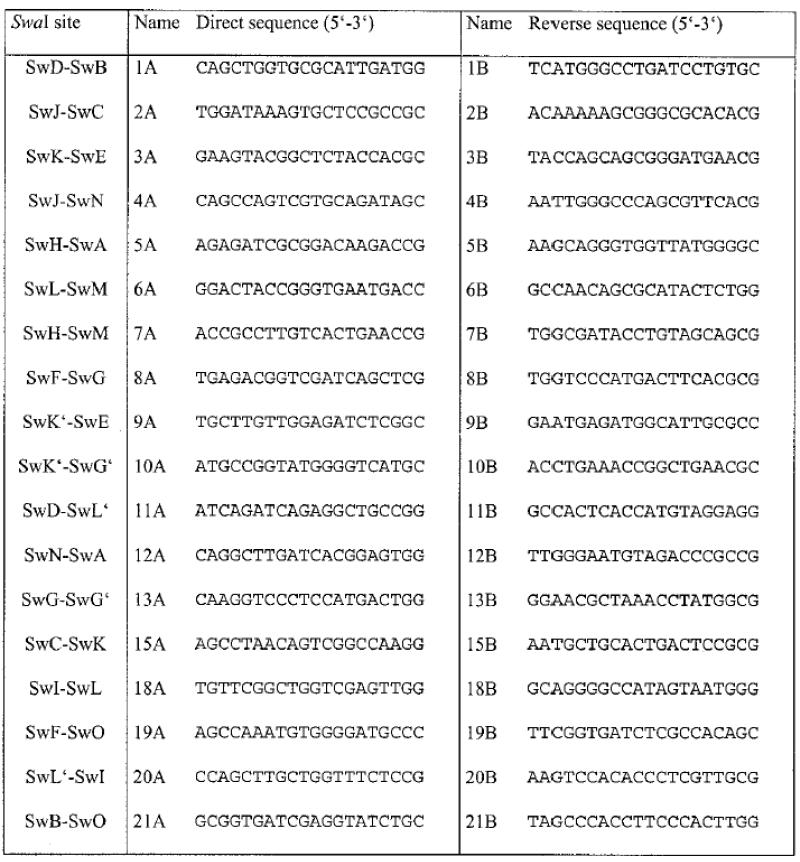
Only primer pairs that could be experimentally verified are listed.
Genome organisation between the rrn operons rrnA and rrnA’ was analysed by mid-range PCR using two divergent primer sequences from the 5S rDNA (5′-ATCTGGACATTCTGGCAACAG-3′) and 23S rDNA (5′-AAGTTAGCGGATGACCTGTGG-3′), respectively.
In silico analysis
The sequence contigs assembled from the shotgun-sequencing data were converted in silico into restriction maps. The Perl script used is flexible for all combinations of restriction enzymes and generates an output file suitable for graphical presentation. The comparison of in silico and experimentally generated maps is described in the Results and Discussion.
RESULTS AND DISCUSSION
SwaI/I-CeuI map constructed with SwaI-spanning probes
In order to provide a low-resolution map as a backbone for the quick evaluation of the sequence assembly and for the localisation of the ribosomal operons, we selected SwaI, which has the 8 bp recognition sequence ATTTAAAT and I-CeuI whose 26 bp recognition site is conserved within the rrl gene (23S rDNA) of eubacteria (23). Sequence information of the initial phase of shotgun sequencing was exploited to construct a macro-restriction map of P.putida KT2440. The sequence contigs assembled from the 3- and 6-fold genome equivalent of raw sequence, guided the design of ∼1.2 kb PCR products that span asymmetrically the SwaI restriction sites. The shotgun sequence assembly of three genome equivalents revealed 12 SwaI sites that were experimentally confirmed; six further SwaI sites were found within the 6-fold genome equivalent. This collection of PCR products corresponds with a SwaI linking clone library (24). Southern hybridisation of these PCR-derived linking probes on SwaI digested and PFGE-separated chromosomes of strain KT2440 enabled the assembly of the chromosomal SwaI fragments. The comparison of our map with that of Ramos-Diaz et al. (17) revealed 18 instead of 19 SwaI fragments, whereas the number of I-CeuI sites increased from six to seven. Moreover, we found differences in map position and sizes of fragments SwK’, SwL, SwL’, SwM and SwN as well as in the sizes of SwJ and SwK (Table 2).
Table 2. Fragments resulting after SwaI, I-CeuI or SwaI/I-CeuI double digestions of P.putida KT2440 chromosomes.
|
SwaI fragments |
I-CeuI fragments |
SwaI/I-CeuI fragments |
|||
|---|---|---|---|---|---|
| Size in kb | Size in kb | Size in kb | |||
| Only those SwaI/I-CeuI fragments are displayed that were generated from a SwaI fragments with an I-CeuI site. Number of SwaI and I-CeuI fragments, positions and sizes of fragments SwK’, SwL, SwL’, SwM and SwN as well as the sizes of SwJ and SwK differed from the published map (15). | |||||
| SwA | 910 | CeA | 2835 | SI-A1 | 635 |
| SwB | 690 | CeB | 1135 | SI-D1 | 570 |
| SwC | 620 | CeC | 1010 | SI-F1 | 445 |
| SwD | 585 | CeD | 600 | SI-A2 | 275 |
| SwE | 530 | CeE | 345 | SI-I1 | 210 |
| SwF | 480 | CeF | 175 | SI-I2 | 120 |
| SwG | 400 | CeG | 6 | SI-L’1 | 50 |
| SwG’ | 400 | SI-L’2 | 48 | ||
| SwH | 350 | SI-M1 | 43 | ||
| SwI | 330 | SI-M2 | 36 | ||
| SwJ | 210 | SI-F2 | 35 | ||
| SwK’ | 145 | SI-D2 | 15 | ||
| SwK | 125 | ||||
| SwL | 100 | ||||
| SwL’ | 98 | ||||
| SwM | 85 | ||||
| SwN | 30 | ||||
| SwO | 20 | ||||
To identify those SwaI fragments that harbour an I-CeuI restriction site indicative of an rrn operon, SwaI/I-CeuI double digestions of the chromosome were separated by one-dimensional PFGE. The resulting fragment pattern uncovered I-CeuI sites in the fragments SwA, SwD, SwF, SwI, SwL* and SwM. Although we found seven I-CeuI fragments after a total digestion of the chromosome, only six SwaI fragments were cut by I-CeuI. This means that one of these SwaI fragments contains two I-CeuI sites. The exact map positions of the I-CeuI sites were determined by the Southern hybridisation of one-dimensional SwaI/I-CeuI double digestions using SwaI fragment end probes and two-dimensional PFGE (first dimension, SwaI total; second dimension, I-CeuI partial digestion). Figure 1 shows that SwM was cut by I-CeuI into three fragments of ∼43, 36 and 6 kb and two partially digested fragments of ∼50 and 43 kb. The 6 kb fragment turned out to be CeG, the smallest I-CeuI fragment (Table 2). As the size of an rrn operon of Pseudomonads is ∼5.5 kb in length (7), the two ribosomal operons A and A’ are located adjacent to each other on SwM. A mid-range PCR with divergent primers in the 23S and 5S rRNA genes yielded a 4.6 kb product, which shows that both operons are organised in tandem with a spacer sequence of <200 bp. All ribosomal operons are oriented co-directionally with DNA replication as elucidated by hybridisation of SwaI/I-CeuI double digestions with 16S rDNA probes. The SwaI/I-CeuI genome map is shown in Figure 2.
Figure 1.

Two-dimensional PFGE and Southern hybridisation of a SwaI-total/I-CeuI partial digestion of P.putida KT2440 chromosomes. To analyse number and location of rrn operons within the small SwaI fragments SwJ–SwO, SwaI digested chromosomes were separated by PFGE (two linear ramps, 20–90 s for 40 h and 1–15 s for 10 h, E = 6 Vcm–1). The part of the lane that contained the small SwaI fragments (<300 kb) was cut out, digested partially with I-CeuI and separated in the second dimension (1–12 s for 35 h, E = 6 Vcm–1). (A) Two-dimensional PFGE: SwL was cleaved into two SwaI/I-CeuI fragments of 48 and 50 kb. Partial digestion of SwM gave five SwaI/I-Ceu fragments (49 kb, double band at 42–43, 36 and 6 kb). The 49 kb band is composed of one 43 kb band (SI-M1, Table 2) plus CeG (6 kb). (B) The Southern hybridisation with a rrn probe confirmed that SwM harbours two ribosomal operons with a distance of ∼6 kb between their inherent I-CeuI sites resulting into I-CeuI fragment CeG. SwL’, in contrast, contains only one I-CeuI site. Lane 1, lambda DNA concatemers; lane 2, BstEII digested lambda DNA.
Figure 2.

Refined SwaI/I-CeuI map of strain KT2440. The SwaI map was constructed by hybridisation of SwaI linking probes onto PFGE-separated SwaI digestions of the chromosome. The PCR-derived linking probes were designed from SwaI-containing contigs assembled after shotgun sequencing of 3- and 6-fold genome equivalents. The I-CeuI sites (indicating the positions of the ribosomal operons) were localised with SwaI/I-CeuI double digestions separated by one- and two-dimensional PFGE, followed by hybridisation with rRNA gene probes. The position and orientation of rrn operons are indicated by arrows. The dotted lines mark those regions that were covered by high-resolution Smith/Birnstiel maps.
High-resolution Smith/Birnstiel mapping of rrn regions
Within the shotgun-sequencing project the automatic assembly of raw sequence data could be ambiguous for multi-copy repeats such as the seven highly conserved ribosomal operons of the KT2440 genome. In order to facilitate the contig assembly in the rrn regions, high-resolution Smith/Birnstiel maps of those SwaI fragments were generated that contain the ribosomal operons. The larger fragments SwA, SwD and SwF were digested with the restriction enzymes DraI, NdeI, XbaI, AseI, SspI and SpeI whose cutting frequencies range from 1 to 5 sites/100 kb. For optimal resolution of the smaller fragments SwM, SwL, SwL’, SwI and parts of SwD, SwF and SwG, the more frequently cleaving enzymes BamHI, HindIII, XhoI and EcoRV were chosen. If necessary, combinations of these enzymes with higher and lower cutting frequencies were applied. After Southern hybridisation with SwaI fragment end probes, the resulting fragment pattern shows the order of restriction sites and is converted into a high-resolution map by calibration of fragment size. Figure 3 shows the Smith/Birnstiel map of SwL read off from the SwM/SwL junction.
Figure 3.

High-resolution Smith/Birnstiel mapping of SwaI fragment SwL with fragment end probe SwL–SwM. SwaI digested chromosomes of P.putida KT2440 were partially digested with EcoRV (0.5 and 0.1 U; 1 h), HindIII (1.0 and 0.25 U; 1 h), XhoI (0.5 and 0.1 U; 1 h) and BamHI (1.0 and 0.25 U; 1 h), respectively, and separated by PFGE (0–90 s for 40 h and 1–15 s for 10 h, E = 6 Vcm–1). The Southern hybridisation reveals the order of restriction sites on SwL. Lane 1, lambda DNA concatemers and BstEII digested lambda DNA; lane S, total digestions of P.putida KT2440 chromosomes with SwaI; lane E, EcoRV; lane H, HindIII; lane X, XhoI; lane B, BamHI.
Comparison of experimentally and in silico generated maps
Smith/Birnstiel maps are often biased by cross-hybridisation, clusters of restriction sites, differential susceptibility of sites to cleavage as well as by the amount of DNA applied per digestion. Therefore, the Smith/Birnstiel maps were aligned with the restriction maps of the sequence contigs by the criterion of the optimal match as defined by the matching score k rather than by the criterion of perfect match. The score k is the ratio of the number of matching sites of an enzyme X to the sum of all detected sites of X in both maps. Clusters of sites below the resolution of the blot were counted as one site. The error of determination of fragment size l was considered by a difference of up to ±0.05 l for corresponding sites. The experimentally generated Smith/Birnstiel maps of SwaI fragments Swj were compared with in silico-generated maps in steps of 0.1 Swj within a sliding window of 0.2 Swj. The in silico maps were not discarded as long as k values fluctuated above the threshold value of 0.6–0.8 depending on the number of sites and resolution of the experimental map. Misassemblies are recognised by the instantaneous decrease of k; in other words, misassemblies become immediately apparent by a qualitative change of similar to unrelated patterns.
We applied this approach to the genome assembly of strain KT2440 at the end of the shotgun-sequencing phase. Ninety-five sequence contigs of a total length of 6185 kb merged into eight scaffolds. As a first step contig scaffolds that contained SwaI recognition sequences were compared with the SwaI map of strain KT2440. Thereby three scaffolds broke into seven, five and two sub-scaffolds, respectively. Overall 10 scaffolds or sub-scaffolds were re-assigned to the SwaI map. Secondly, the nine remaining scaffolds were positioned on the macro-restriction map by the comparison of the in silico-generated restriction site pattern with that of the Smith/Birnstiel maps. Thereby three of the 11 breakpoints were identified to have arisen from misassembled sequence contigs. Figure 4 shows the application of this analysis to the rrnB region.
Figure 4.

Combined approach for contig scaffold ordering by low- and high-resolution restriction mapping in the region around rrnB. First, all contigs or contig scaffolds (for example scaffold 57 and 74) which contain SwaI recognition sequence(s) were assigned to respective positions on the SwaI macro-restriction map according to the individual sequence signature of the respective SwaI site(s). In a second step, in silico generated restriction maps of the remaining contig scaffolds were compared with the Smith/Birnstiel maps in order to verify the flanking regions of the ribosomal operons. Restriction sites that correspond to each other in both maps are highlighted in bold. The imperfections of experimental Smith/Birnstiel mapping were considered by scoring as described in the text. Using this method scaffold 52 could be unambiguously assigned to a part of SwI flanking rrnB like we did before with scaffold 55.
CONCLUSION
Low-resolution macro-restriction maps in combination with high-resolution Smith/Birnstiel maps are efficient tools for quality control of a sequence assembly generated from shotgun sequencing data. Maps are constructed within a few weeks at low cost. The comparison of a sequence assembly with the low- and high-resolution restriction maps allows the detection of possible misassemblies within sequence contigs or contig scaffolds and thus the re-ordering of an assembly. Especially flanking regions of ribosomal DNA sequences can be unambiguously assigned to mapped-ribosomal operons. In our hands the maximum resolution was ∼5 kb, local misassemblies caused by short repeats with no effects on the global assembly could not be identified.
The major advantage of interactive physical mapping during an on-going shotgun genome-sequencing project is the guidance to appropriate gap-closing experiments, thereby saving time and funds. In principle this approach can be applied to all bacterial genomes as well as to small eukaryotic genomes.
Acknowledgments
ACKNOWLEDGEMENTS
We thank Parool Meelu for helpful comments on the manuscript. This work was supported by a grant from the German Ministry of Education and Research (BMBF).
REFERENCES
- 1.Himmelreich R., Hilbert,H., Plagens,H., Pirkl,E., Li,B.C. and Herrmann,R. (1996) Complete sequence analysis of the genome of the bacterium Mycoplasma pneumoniae. Nucleic Acids Res., 24, 4420–4449. [DOI] [PMC free article] [PubMed] [Google Scholar]
- 2.Blattner F.R., Plunkett,G., Bloch,C.A., Perna,N.T., Burland,V., Riley,M., Collado-Vides,J., Glasner,J.D., Rode,C.K., Mayhew,G.F., Gregor,J., Davis,N.W., Kirkpatrick,H.A., Goeden,M.A., Rose,D.J., Mau,B., Shao,Y. et al. (1997) The complete genome sequence of Escherichia coli K-12. Science, 277, 1453–1474. [DOI] [PubMed] [Google Scholar]
- 3.Fraser C.M. and Fleischmann,R.D. (1997) Strategies for whole microbial genome sequencing and analysis. Electrophoresis, 18, 1207–1216. [DOI] [PubMed] [Google Scholar]
- 4.Fonstein M. and Haselkorn,R. (1995) Physical mapping of bacterial genomes. J. Bacteriol., 177, 3361–3369. [DOI] [PMC free article] [PubMed] [Google Scholar]
- 5.Römling U. and Tümmler,B. (1994) Bacterial genome mapping. J. Biotechol., 35, 155–164. [DOI] [PubMed] [Google Scholar]
- 6.Schwartz D.C. and Cantor,C.R. (1984) Separation of yeast chromosome-sized DNAs by pulsed field gradient gel electrophoresis. Cell, 37, 67–75. [DOI] [PubMed] [Google Scholar]
- 7.Stover C.K., Pham,X.Q., Erwin,A.L., Mizoguchi,S.D., Warrener,P., Hickey,M.J., Brinkman,F.S., Hufnagle,W.O., Kowalik,D.J., Lagrou,M., Garber,R.L., Goltry,L., Tolentino,E., Westbrock-Wadman,S., Yuan,Y., Brody,L.L., Coulter,S.N., Folger,K.R., Kas,A., Larbig,K., Lim,R., Smith,K., Spencer,D., Wong,GK., Wu,Z., Paulsen,I.T., Reizer,J., Saier,M.H., Hancock,R.E.W., Lory,S. and Olson,M.V. (2000) Complete genome sequence of Pseudomonas aeruginosa PA01, an opportunistic pathogen. Nature, 406, 959–964. [DOI] [PubMed] [Google Scholar]
- 8.Schwartz D.C., Li,X., Hernandez,L.I., Ramnarain,S.P., Huff,E.J. and Wang,Y.K. (1993) Ordered restriction maps of Saccharomyces cerevisiae chromosomes constructed by optical mapping. Science, 262, 110–114. [DOI] [PubMed] [Google Scholar]
- 9.Lin J., Qi,R., Aston,C., Jing,J., Anantharaman,T.S., Mishra,B., White,O., Daly,M.J., Minton,K.W., Venter,J.C. and Schwartz,D.C. (1999) Whole-genome shotgun optical mapping of Deinococcus radiodurans. Science, 285, 1558–1562. [DOI] [PubMed] [Google Scholar]
- 10.Lai Z., Jing,J., Aston,C., Clarke,V., Apodaca,J., Dimalanta,E.T., Carucci,D.J., Gardner,M.J., Mishra,B., Anantharaman,T.S., Paxia S., Hoffman,S.L., Venter,C.J., Huff,E.J. and Schwartz,D.C. (1999) A shotgun optical map of the entire Plasmodium falciparum genome. Nature Genet., 23, 309–313. [DOI] [PubMed] [Google Scholar]
- 11.Bagdasarian M. and Timmis,K.N. (1981) In Goebel,W. and Hofschneider,P.H. (eds), Current Topics of Microbiology and Immunology. Springer Verlag, Berlin, pp. 47–67.
- 12.Vancura V. (1980) Fluorescent pseudomonads in the rhizosphere of plants and their relation to root exudates. Folia Microbiol., 25, 168–173. [DOI] [PubMed] [Google Scholar]
- 13.Geels F.P. and Schippers,B. (1983) Selection of antagonistic fluorescent Pseudomonas spp. and their root colonization and persistence following treatment of seed potatoes. Phytopathol. Z., 108, 193–206. [Google Scholar]
- 14.O’Sullivan D.J. and O’Gara,F. (1992) Traits of fluorescent Pseudomonas spp. involved in suppression of plant root pathogens. Microbiol. Rev., 56, 662–676. [DOI] [PMC free article] [PubMed] [Google Scholar]
- 15.Ramos J.L., Diaz,E., Dowling,D., de Lorenzo,V., Molin,S., O’Gara,F., Ramos,C. and Timmis,K.N. (1994) The behaviour of bacteria designed for biodegradation. Biotechnology, 12, 1349–1356. [DOI] [PMC free article] [PubMed] [Google Scholar]
- 16.Ronchel M.C., Ramos,C., Jensen,L.B., Molin,S. and Ramos,J.L. (1995) Construction and behaviour of biologically contained bacteria for environmental applications in bioremediation. Appl. Environ. Microbiol., 61, 2990–2994. [DOI] [PMC free article] [PubMed] [Google Scholar]
- 17.Ramos-Diaz M.A. and Ramos,J.L. (1998) Combined physical and genetic map of the Pseudomonas putida KT2440 chromosome. J. Bacteriol., 180, 6352–6363. [DOI] [PMC free article] [PubMed] [Google Scholar]
- 18.Römling U., Schmidt,K.D. and Tümmler,B. (1997) Large genome rearrangements discovered by the detailed analysis of 21 Pseudomonas aeruginosa clone C isolates found in environment and disease habitats. J. Mol. Biol., 271, 386–404. [DOI] [PubMed] [Google Scholar]
- 19.Smith H.O. and Birnstiel,M.L. (1976) A simple method for DNA restriction site mapping. Nucleic Acids Res., 3, 2387–2398. [DOI] [PMC free article] [PubMed] [Google Scholar]
- 20.Kohara Y., Akiyama,K. and Isono,K. (1987) The physical map of the whole E.coli chromosome: application of a new strategy for rapid analysis and sorting of a large genomic library. Cell, 50, 495–508. [DOI] [PubMed] [Google Scholar]
- 21.Heuer T., Bürger,C. and Tümmler,B. (1998) Smith/Birnstiel mapping of genome rearrangements in Pseudomonas aeruginosa. Electrophoresis, 19, 4495–4499. [DOI] [PubMed] [Google Scholar]
- 22.Römling U., Fislage,R. and Tümmler,B. (1996) Macrorestriction mapping and analysis of bacterial genomes. In Birren,B. and Lai,E. (eds), Nonmammalian Genomic Analysis—A Practical Guide. Academic Press, San Diego, CA, pp. 319–346.
- 23.Liu S.L., Hessel,A. and Sanderson,K.E. (1993) Genomic mapping with I-CeuI, an intron-encoded endonuclease specific for genes for ribosomal RNA, in Salmonella spp., Escherichia coli and other bacteria. Proc. Natl Acad. Sci. USA, 90, 6874–6878. [DOI] [PMC free article] [PubMed] [Google Scholar]
- 24.Saito A., Abad,J.P., Wang,D.N., Ohki,M., Cantor,C.R. and Smith,C.L. (1991) Construction and characterization of a NotI linking library of human chromosome 21. Genomics, 10, 618–630. [DOI] [PubMed] [Google Scholar]