Abstract
High density oligonucleotide arrays have been used extensively for expression studies of eukaryotic organisms. We have designed a prokaryotic high density oligonucleotide array using the complete Escherichia coli genome sequence to monitor expression levels of all genes and intergenic regions in the genome. Because previously described methods for preparing labeled target nucleic acids are not useful for prokaryotic cell analysis using such arrays, a mRNA enrichment and direct labeling protocol was developed together with a cDNA synthesis protocol. The reproducibility of each labeling method was determined using high density oligonucleotide probe arrays as a read-out methodology and the expression results from direct labeling were compared to the expression results from the cDNA synthesis. About 50% of all annotated E.coli open reading frames are observed to be transcribed, as measured by both protocols, when the cells were grown in rich LB medium. Each labeling method individually showed a high degree of concordance in replica experiments (95 and 99%, respectively), but when each sample preparation method was compared to the other, ∼32% of the genes observed to be expressed were discordant. However, both labeling methods can detect the same relative gene expression changes when RNA from IPTG-induced cells was labeled and compared to RNA from uninduced E.coli cells.
INTRODUCTION
Expression analysis has been used to identify gene function and physiological pathways in many organisms, including humans, yeast, Drosophila, mice and bacteria (1–9). Understanding the functions of several genes and their biological roles can be assisted by comprehensive expression profiling, which involves using a large number of different environmental conditions. With the completion of more than 59 microbial genomes and with 80 more in progress (http://www.ncbi.nlm.nih.gov/PMGifs/Genomes/micr.html) microarray tools have established themselves as one set of methods for genome-wide expression profiling. However, a major challenge in prokaryotic expression analysis is the preparation and specific labeling of mRNA for microarray analysis (10). The preparation of mRNA from eukaryotic cells for microarray hybridization utilizes the polyadenylation [poly(A)] sequences present on the 3′-ends of the mRNA. Since mRNA comprises only 1–5% of the RNA extracted from eukaryotic cells, the use of oligo(dT) priming allows differential copying of the mRNA subpopulation. Using such a strategy for the analysis of prokaryotic RNAs is not useful. Although some bacterial mRNAs have a poly(A) sequence at the 3′-end, this sequence is only short lived and is used as a signal for mRNA degradation (11,12). Thus, labeling of bacterial RNAs requires either direct labeling of total RNA or the use of a cDNA synthesis process in which a pool of gene-specific or random oligonucleotide primers replace the oligo(dT) primers (9,13). Neither sample preparation method enriches the labeled target for mRNA. Thus, much of the label is incorporated into rRNAs and tRNAs, which make up 95–97% of the total RNA isolated from bacterial cells. We have used high density oligonucleotide probe arrays containing probes to the complete Escherichia coli genome interrogating all annotated 4218 open reading frames (ORFs) and most of the intergenic (Ig) regions for comparative studies of two alternative RNA labeling methods. One method is based on the synthesis of cDNA using random hexamer primers and total bacterial RNA as the template. The cDNA products are subsequently 3′-end-labeled by incorporating bio-ddATP using terminal transferase. The second method initially uses an enrichment process for mRNA, followed by 5′-end-labeling of the enriched, fragmented RNA using γ-S-ATP, added by means of a phosphotransferase, followed by covalent linkage of PEO-iodoacetylbiotin. We show that both labeling reactions give highly reproducible results and can detect differentially expressed genes in biological samples. However, concordance analysis between the two different sample preparation methods reveals discordance in about one of three detected genes. Possible reasons for this discordance are reviewed.
MATERIALS AND METHODS
Bacterial growth conditions
A single colony of E.coli K-12 (MG1655) was inoculated in 5 ml of Luria–Bertani (LB) broth and grown overnight with constant aeration at 37°C. The next day 20 ml of LB broth was inoculated with 0.2 ml of the overnight culture and grown at 37°C with constant aeration to an optical density (OD600) of 0.8. For the IPTG induction study, a 50 ml culture was split into two 25 ml cultures and IPTG was added to one culture at a final concentration of 1 mM. The cells were incubated for 30 min before RNA isolation.
RNA isolation
Total RNA was isolated from the cells using the protocol accompanying the MasterPure complete DNA/RNA purification kit from Epicentre Technologies (Madison, WI). Isolated RNA was resuspended in diethylpyrocarbonate (DEPC)-treated water, quantitated based on absorption at 260 nm and stored in aliquots at –20°C until further use. It is important to note that removal of chromosomal DNA is very important. Insufficient removal of DNA, including small fragments, will ultimately lead to unreproducible results and can be misleading during data analysis.
mRNA enrichment and labeling
Enrichment of mRNA was done as described in the Affymetrix Expression Handbook (Affymetrix Inc., Santa Clara, CA). In brief, a set of oligonucleotide primers specific for either 16S or 23S rRNA are mixed with total RNA isolated from bacterial cultures. After annealing at 70°C for 5 min, 300 U MMLV reverse transcriptase (Epicentre Technologies, Madison, WI) is added to synthesize cDNA strands complementary to the two rRNA species. The cDNA strand synthesis allows for selective degradation of the 16S and 23S rRNAs by RNase H. Treatment of the RNA/cDNA mixture with DNase I (Amersham Pharmacia Biotech, Piscataway, NJ) removes the cDNA molecules and oligonucleotide primers, which results in an RNA preparation that is enriched for mRNA by 80% (data not shown). For direct labeling of RNA, 20 µg enriched bacterial RNA was fragmented at 95°C for 30 min in a total volume of 88 µl of 1× NEB buffer for T4 polynucleotide kinase (New England Biolabs, Beverly, MA). After cooling to 4°C, 50 µM γ-S-ATP (Roche Molecular Biochemicals, Indianapolis, IN) and 100 U T4 polynucleotide kinase (Roche Molecular Biochemicals) was added to the fragmented RNA and the reaction was incubated at 37°C for 50 min. To inactivate T4 polynucleotide kinase the reaction was incubated for 10 min at 65°C and the RNA was subsequently ethanol precipitated to remove excess γ-S-ATP. After centrifugation the RNA pellet was resuspended in 96 µl of 30 mM MOPS, pH 7.5, and 4 µl of a 50 mM PEO-iodoacetylbiotin (Pierce Chemical, Rockford, IL) solution was added to introduce the biotin label. The reaction was incubated at 37°C for 1 h and the labeled RNA was purified using the RNA/DNA Mini-Kit from Qiagen (Valencia, CA) as recommended by the manufacturer. Eluted RNA was quantitated based on the absorption at 260 nm and hybridized to the oligonucleotide array.
cDNA synthesis and labeling
For the cDNA synthesis method, 10 µg total RNA was reverse transcribed using the SuperScript II system for first strand cDNA synthesis from Life Technologies (Rockville, MD). For the reaction, 500 ng random hexamers were mixed with the RNA in a total volume of 12 µl and heated to 70°C for 10 min. After cooling to 25°C within 10 min, the reaction buffer was added according to the manufacturer’s recommendations. After increasing the temperature to 42°C within 10 min, 1800 U SuperScript II was added to the reaction and incubated for 50 min. SuperScript II was heat inactivated at 72°C for 15 min and the mixture cooled to 4°C. RNA was removed using 2 U RNase H (Life Technologies) and 1 µg RNase A (Epicentre, Madison, WI) for 10 min at 37°C in 100 µl total volume. The cDNA was purified using the QiaQuick PCR purification kit from Qiagen (Valencia, CA). Isolated cDNA was quantitated based on the absorption at 260 nm and fragmented using a partial DNase I digest. For up to 5 µg isolated cDNA, 0.2 U DNase I (Roche Molecular Biochemicals) was added and incubated for 10 min at 37°C in 1× One-Phor-All buffer (Amersham Pharmacia Biotech) and the reaction stopped by incubation at 99°C for 10 min. The fragmentation was confirmed on a 0.7% agarose gel to verify that the fragments had an average length of 50–100 bp. The fragmented cDNA was 3′-end-labeled for 2 h at 37°C using 175 U terminal transferase (Roche Molecular Biochemicals) and 70 µM biotin-N6-ddATP (DuPont/NEN, Boston, MA) in 1× TdT buffer (0.2 M potassium cacodylate, 25 mM Tris–HCl, 0.25 mg ml–1 BSA, pH 6.6; Roche Molecular Biochemicals) and 2.5 mM cobalt chloride. The fragmented and end-labeled cDNA was added to the hybridization solution without further purification.
Array description
On the oligonucleotide arrays a given gene and Ig region is represented by 15 different 25mer oligonucleotides that are designed to be complementary to the target sequence and serve as unique, sequence-specific detectors (termed perfect match probes). An additional control element on these arrays is the use of mismatch (MM) control probes that are designed to be identical to their perfect match (PM) partners except for a single base difference in the central position. The presence of the MM oligonucleotide allows cross-hybridization and local background to be estimated and subtracted from the PM signal. For a given transcript the numbers of positive and negative probe pairs, as well as the PM and MM intensities, are used to determine whether a transcript is present (P), marginal (M) or absent (A). A probe pair is called positive when the intensity of the PM probe cell is significantly greater than that of the corresponding MM probe cell; a probe pair is called negative if the situation is reversed. The average difference (Avg Diff) of all 15 probes in a probe set is used to determine the level of expression of a transcript and is calculated by taking the difference between the PM and MM of every probe and averaging the differences over the entire probe set, with some trimming of outlier values.
Array hybridization and scanning
The hybridization solution contained 100 mM MES, 1 M NaCl, 20 mM EDTA and 0.01% Tween 20, pH 6.6 (referred to as 1× MES). In addition, the solution contained 0.1 mg ml–1 herring sperm DNA, 0.5 mg ml–1 BSA and 0.5 nM control Biotin-oligo 948. Samples were heated to 99°C for 5 min, followed by 45°C for an additional 5 min before being placed in the array cartridge. Hybridization was carried out at 45°C for 16 h with mixing on a rotary mixer at 60 r.p.m. Following hybridization, the sample solution was removed and the array was washed and stained as recommended in the technical manual (Affymetrix Inc.). In brief, to enhance the signals 10 µg ml–1 streptavidin and 2 mg ml–1 BSA in 1× MES was used as the first staining solution. After the streptavidin solution was removed, an antibody mix was added as the second stain, containing 0.1 mg ml–1 goat IgG, 5 µg ml–1 biotin-bound anti-streptavidin antibody and 2 mg ml–1 BSA in 1× MES. Nucleic acid was fluorescently labeled by incubation with 10 µg ml–1 streptavidin–phycoerythrin (Molecular Probes, Eugene, OR) and 2 mg ml–1 BSA in 1× MES. The arrays were read at 570 nm with a resolution of 3 µm using a confocal laser scanner (Affymetrix Inc.).
Statistical analysis
To evaluate the statistical significance of the increased number of negative probe pairs and the increased mean average difference we used simulation experiments employing the S-Plus statistics package (http://www.splus.mathsoft.com) in order not to rely on parametric assumptions. In the group of 312 genes that were discordant between the directly labeled RNA and the labeled cDNA transcripts we sampled 10 000 subsets of 312 genes from the group of all genes called present by either method and took the average number of negative probe pairs from each subset. The mean of these 10 000 values was 1.17, with a standard deviation of 0.054. To ensure that the abundant cDNA labeled, discordant genes were significantly different from the direct labeled discordant genes, we similarly sampled from the discordant genes as a whole. The mean average difference over the 237 abundant direct labeled discordant genes was 4763. The mean of our 10 000 samples of size 237 from the ‘All Present’ group was 1931, with a standard deviation of 216.
Slot blot analysis
Equal amounts of total RNA and cDNA (1 µg) were treated with a mixture of 1× SSC, 50% formamide and 6.48% formaldehyde (Sigma, St Louis, MO) in a volume of 40 µl. After heat treatment at 68°C for 15 min the denatured RNA and cDNA were immobilized on a nylon membrane (Roche Molecular Biochemicals) using a slot blot apparatus (Minifold II Slot Blot System; Schleicher & Schuell, Keene, NH) under vacuum. After UV crosslinking, the blots were pre-hybridized for 1 h and then hybridized with DIG Easy Hyb hybridization solution (Roche Molecular Biochemicals) overnight at 50°C with a gel-purified 200–400 bp PCR-generated, DIG-labeled probe specific for the gene of interest (PCR DIG Probe Synthesis Kit; Roche Molecular Biochemicals). The slot blots were washed for 5 min at room temperature using non-stringent buffer (2× SSC, 0.1% SDS) and twice for 15 min at 68°C using stringent buffer (0.1× SSC, 0.1% SDS). For the detection of transcripts the manufacturer’s wash and detection protocols were used (DIG Wash and Block Buffer Set, Anti-Digoxigenin-AP Fab fragments; Roche Molecular Biochemicals). The blots were developed by chemiluminescent detection (CDP-STAR reagent; Roche Molecular Biochemicals) and the resulting signals were visualized and quantified using an Alpha Innotech imager and software (MultiImage II Light Cabinet DE-500, Fluorchem v.1.02A; Alpha Innotech Corp., San Leandro, CA).
RESULTS
Sample preparation, labeling and hybridization
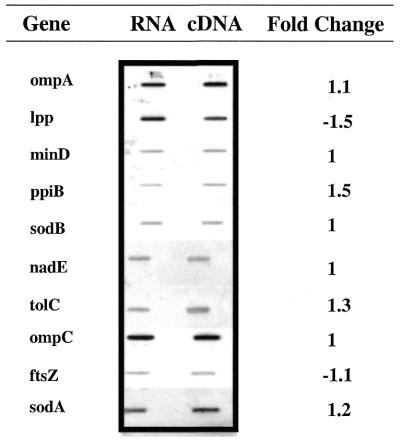
Isolated total E.coli RNA was used to generate the samples for hybridization to the E.coli high density oligonucleotide probe array. Two different labeling strategies were employed for comparison analysis; the first was a cDNA labeling strategy using random hexamers and the second a direct labeling strategy with prior mRNA enrichment. The yield of the cDNA method was estimated to be 35–40% of the 10 µg starting RNA based on spectrographic analysis. The low yield is believed to be due to inefficient reverse transcription of rRNA. The direct labeling strategy employed 100 µg total bacterial RNA with a yield of 2–4 µg enriched, labeled RNA. To assess the introduction of a bias during reverse transcription, equivalent concentrations of starting total RNA and cDNA were analyzed on slot blots using 10 genes interrogated on the array. Figure 1 shows the slot blot signals for all genes analyzed. The highest change in signal intensities was 1.5-fold.
Figure 1.
Slot blot analysis of selected genes. Total RNA and synthesized cDNA was spotted in equivalent amounts (1 µg). After hybridization with a labeled PCR fragment and staining, the intensities were measured. The relative change in intensities is shown as the fold change.
Array characteristics
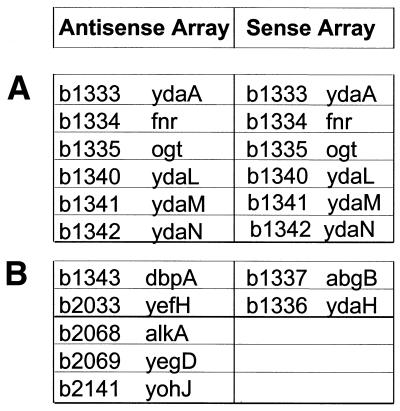
To evaluate the performance characteristics of each oligonucleotide probe used on the array, E.coli genomic DNA was hybridized to sense and antisense arrays. Genomic DNA serves as a normalized control target with each gene target present in equimolar amounts. The oligonucleotide sequences representing the annotated ORFs on the sense and antisense array interrogate the same location within the genes but have the reverse complement sequence to each other. The hybridization of genomic DNA from E.coli strain MG1655 was used to detect the hybridization characteristics of each oligonucleotide sequence chosen as probe on the array. Of a total of 4335 annotated genes interrogated on the array, 4324 were called present using end-labeled genomic DNA hybridized to the antisense array using the same conditions as for RNA hybridization. The sense version of the array detected 4327 genes when genomic DNA was used as the target. Thus, the probe selection used to construct the array was able to unambiguously detect >99.7% of the E.coli gene sequences as being present on the sense and antisense arrays. Using the gene nomenclature proposed by Blattner et al. (14), a list of genes not detected using chromosomal DNA is shown in Figure 2. In hybridization experiments involving both strands the probe sets for the genes yda (b1333), fnr (b1334), ogt (b1335), ydaL (b1340), ydaM (b1341) and ydaN (b1342) did not detect the target E.coli MG1655 genomic DNA. Earlier reports indicated that MG1655 has a deletion in the fnr operon (15). The other genes might represent additional mutations in the strain, not yet identified. The remaining undetected genes in the individual arrays could be the result of weak hybridization or cross-hybridization. Probe usage for DNA hybridization shows that on average 13 of 15 probe pairs per probe set were called positive and 0.1 probe pairs per probe set were called negative (data not shown). These results indicate that the selected probes on the microarray are capable of detecting complementary target sequences in a highly complex genetic background.
Figure 2.
Undetected genes using labeled chromosomal DNA hybridized to the sense and antisense E.coli array. (A) The b numbers and gene names where the corresponding probe set was not detected by both arrays. (B) The b numbers and gene names where the corresponding probe set was not detected by only one array.
Data analysis
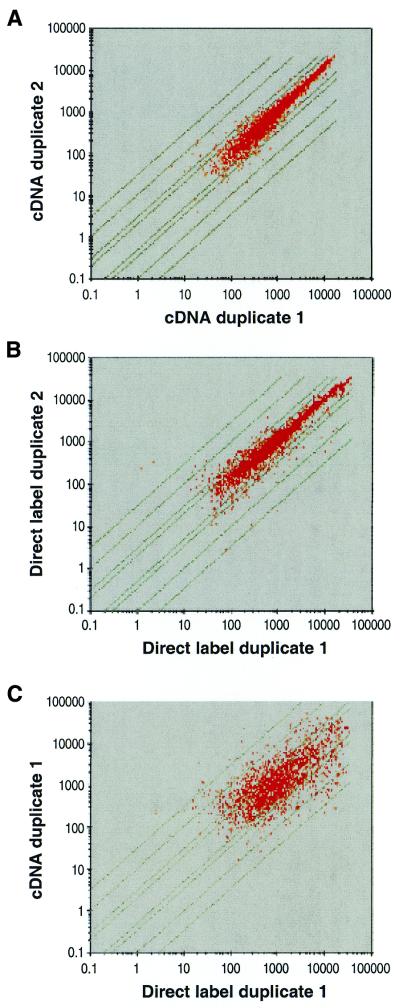
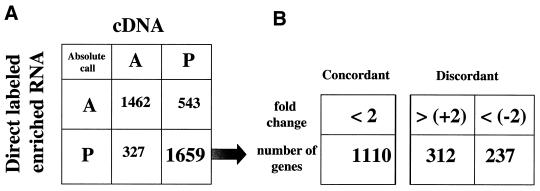
For analysis of the results produced by each of the two sample preparation methodologies GeneChip software analysis program 3.1 was used. Different replica experiments were scaled to a common, global average expression level of 500 to correct for experimental variation. For a single RNA isolate each labeling approach was carried out in duplicate and these were individually hybridized to a high density oligonucleotide probe array. Figure 3A shows the average difference correlation for all genes called present in the duplicate cDNA experiments. For the 4218 probe sets interrogating each of the annotated ORF regions (excluding rRNAs and tRNAs), 2202 were called present and 15 of these genes showed a >2-fold variation between duplicates. This 99.3% concordance was observed between replicates, with the largest variation being 3.5-fold between interrogated replicate genes. For the two independent enriched and direct labeled RNA samples a total of 1986 genes were called present in both experiments, with 101 genes identified with >2-fold variation in expression level between duplicates. This concordance of 95% was observed between replicates, with the greatest variation between two replicates being 13-fold (Fig. 3B). Comparison of one replicate from each labeling method with the other resulted in a much lower concordance of 68% (Fig. 3C). A total of 1659 genes were identified as present in both the cDNA and direct labeled samples, of which 1110 genes had a <2-fold difference in average difference value. A total of 549 genes had a >2-fold difference, with 312 genes showing a higher average difference value (>+2-fold change) in the cDNA labeling method compared to the direct labeling method. The remaining 237 genes showed a higher average difference value in the direct labeling method compared to the cDNA method (<–2-fold change) (Fig. 4). These two groups of discordant genes have been further analyzed. As shown in Table 1, the mean of the average difference values for all present genes in the two different labeling reactions were similar between the cDNA labeling method (2224) and the direct labeling method (2492). There was also no difference in the average number of positive probe pairs in the two experiments (10). However, the direct labeled target shows a higher number of negative probe pairs (1.3) compared to the cDNA target (0.8). This number of negative probes is further increased in the group of discordant genes in which the cDNA labeled genes show an increased average difference (fold change >+2). The direct labeled genes in this group show a 38% increase in the number of negative probe pairs (P = 10–33). This increase in negative probes ultimately results in a reduced average difference value for the genes in this group. In the other group of discordant genes, in which the direct labeled genes show an increased average difference value, the cDNA labeled genes showed only a slight increase in the average number of negative probe pairs (0.9) compared to the mean (0.8). However, in this group the mean average difference of the direct labeled genes was increased by 91% over the mean (P = 10–39). Comparison with the discordant genes as a whole yielded a P value in the order of 10–13. The cDNA labeled average difference over the 312 discordant genes was 1521, which is significantly lower than the mean of the ‘All Present’ group, but with much lower significance (P = 10–2).
Figure 3.
Log–log scatter plot depicting the normalized average difference (Avg Diff) intensity values for all present called probe sets used to monitor expression in E.coli when grown to mid log phase in rich LB medium. Diagonal lines in the graph represent 2-, 3-, 5- and 10-old variation between the compared expression experiments. (A) Scatter plot comparing the levels of expression in duplicate experiments using the cDNA sample preparation method and (B) scatter plot comparing the levels of expression in duplicate experiments using the direct labeling of enriched RNA method. (C) Scatter plot comparing the expression levels from the direct labeled enriched RNA method with the cDNA sample.
Figure 4.
Analysis of the comparison between the two labeling methods, cDNA synthesis and direct labeling of enriched RNA. (A) The absolute call concordance analysis of all genes called present or absent in the two experiments. (B) Genes called present by both methods have been further analyzed and separated into concordant (<2-fold change) and discordant genes (>2-fold change). The group of discordant genes has been further divided into genes with a positive (>+2-fold) or negative (<–2-fold) change. These two groups of discordant genes are the basis for further analysis as described in the text.
Table 1. Probe pair analysis for concordant and discordant genes.
| cDNA | Direct | ||
|---|---|---|---|
| All present genes | |||
| Average no. of positive probe pairs | 10.0 | 10.0 | |
| Average no. of negative probe pairs | 0.8 | 1.3 | |
| Mean average difference | 2224.6 | 2492.8 | |
| Fold change <–2 | |||
| Average no. of positive probe pairs | 9.2 | 11.4 | |
| Average no. of negative probe pairs | 0.9 | 0.9 | |
| Mean average difference | 1520.9 | 4762.8 | |
| Fold change >+2 | |||
| Average no. of positive probe pairs | 9.9 | 8.4 | |
| Average no. of negative probe pairs | 0.8 | 1.8 | |
| Mean average difference | 2056.5 | 747.2 |
To determine if there is any preference for long or short transcripts in the cDNA or direct labeling methods genes were classified based on the size of the ORF. For genes in operons the complete operon size was used for each gene in that operon. Operons were assigned based on known or predicted data (14). The average gene length for all genes detected as present using the cDNA method was 915 bp, compared to 844 bp for the direct labeled genes. The average gene length for all present genes was 941 bp. These results suggest that there is no bias for the length of the transcripts labeled by either method.
Probe pair usage comparison
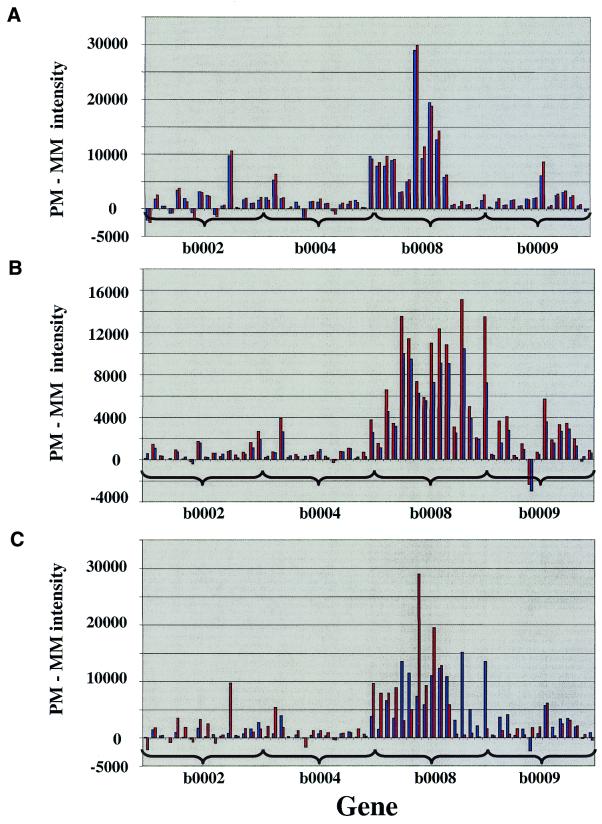
To further analyze the underlying differences between these two sample preparation methods, the individual probe pair intensities of all present probe sets from the direct labeled experiment and the cDNA experiment were compared (1659 probe sets). The absolute intensity (PM intensity – MM intensity) of each probe pair (total number of probe pairs 24 885) was subtracted from the absolute intensity of the same probe pair of the replicate experiment. The result of this subtraction was divided by the total number of probe pairs to yield the average intensity deviation for all probe pairs. In other words, the lower the number, the closer the intensities of two identical probe pairs from two different experiments. Duplicates using direct labeling show an average intensity deviation of 740 intensity units per probe pair (37%) with an average intensity for all probes of 1995. The duplicates from the cDNA method show an average intensity deviation of 512 intensity units per probe pair (15%), with an average intensity for all probes of 3239. Comparison of the cDNA and direct labeling methods resulted in an average intensity deviation of 2918 per probe pair. Figure 5A shows the PM – MM values for 59 selected probes between duplicate cDNA preparations. Figure 5B shows the same probes for the direct labeling method. The probe usage is distinct and highly reproducible for each method, but comparison of the profiles uncovers differences in probe hybridization (Fig. 5C).
Figure 5.
The PM – MM probe intensities of 59 probes on the E.coli array are shown. A comparison of (A) duplicate experiments using the cDNA labeling method and (B) duplicate experiments using the direct labeling of enriched RNA method. (C) cDNA (red) and direct labeled enriched RNA (blue) data are shown.
Absolute call discordance
The discordance of the absolute calls is 14% with 327 genes called present when using direct labeled RNA and absent in the cDNA target. In contrast, 543 genes are called present when using cDNA and absent when direct labeled enriched RNA was used as the target (Fig. 4). All of these genes possess low average difference intensities with mean average difference values of 56 and 87 for the absent calls and mean average difference values of 432 and 504 for the present calls. Since the average difference values are one parameter for determining the absolute call, low intensity genes are more likely to be on the threshold for being called present or absent and thus show a higher variation in absolute calls.
Induction of the lac operon using IPTG
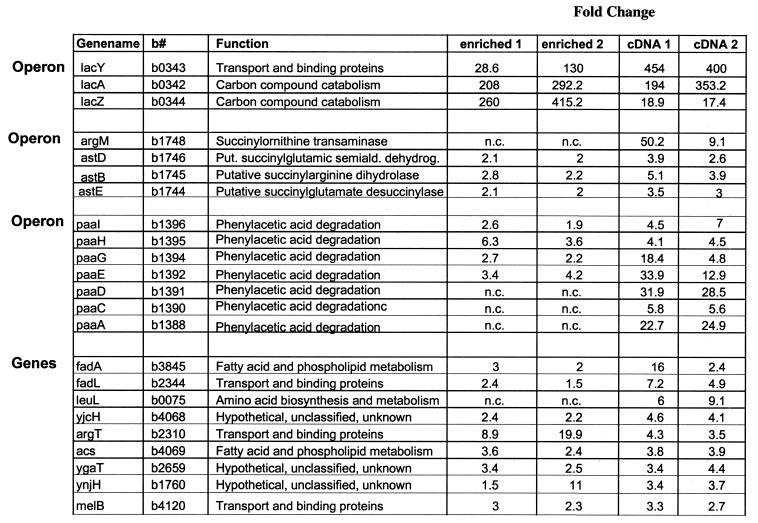
To determine whether relative differences observed in biological experiments could be detected using either of the two labeling methods, a study of E.coli cells induced with IPTG was performed. The genes of the lac operon were chosen for this comparative study for two reasons: it is one of the best studied operons in E.coli and only a limited number of genes over the entire genome have been observed to be differentially expressed (Table 2). Samples were prepared using total RNA extracted from E.coli cells grown in rich LB medium with and without IPTG induction. IPTG was added to split E.coli cultures in the mid-logarithmic growth phase. Thirty minutes post-IPTG induction total RNA was isolated, two replicates were each labeled using either the direct labeling method or the cDNA synthesis method and hybridized to the arrays. The genes within the lac operon were the most induced genes, with a 415-fold expression change for lacZ, a 292-fold change for lacA and a 130-fold change for lacY, when using the direct labeled sample. For the cDNA labeling method, lacZ had, in contrast, the lowest change of 17-fold, lacA a change of 353-fold and lacY had the highest change of 400-fold. These results confirm the ability of both labeling methods to detect relative changes in specific gene expression within a complex mixture of RNA. As expected based on our previous observations, the induction levels for the genes are quantitatively different between the two labeling methods. Drawing conclusions from comparisons of fold changes is problematical unless there are similar levels of average difference values in the untreated samples for cDNA and direct labeling expression results. In addition to the genes of the lac operon, other previously described genes (melA) and previously unidentified genes and operons were detected by either one or both labeling methods as being differentially expressed. All the genes listed in Table 2 showed an expression change >2-fold in duplicate experiments.
Table 2. IPTG-induced genes and operons.
n.c., no change.
DISCUSSION
The use of microarrays in expression studies has become an important tool in the research laboratory. Their use in eukaryotic expression studies has increased dramatically in recent years. The lack of a reproducible specific labeling method for mRNA from prokaryotes has contributed to the delay in implementing this technology in microbiology laboratories. Intuitively, a direct labeling method for total prokaryotic RNA would appear more straightforward than a cDNA synthesis method using random oligonucleotide primers, because of the potential for primer initiation hot-spots, over-representation of longer mRNAs or potential differences in the populations of individual hexamers from synthesis to synthesis. The present study compares a direct labeling method for enriched mRNA with a cDNA method using random hexamers. A comparison of the results produced by these two sample preparation methods points to the following conclusions. Both methods produce array-based hybridization results that are reproducible for replicates prepared by the same method. Importantly, each method can identify the same genes responding differentially to ITPG treatment, as shown in the induction studies with the lac operon in E.coli, thus making the two methods comparable. When measuring expression levels of individual genes, comparison of direct labeling of enriched RNA with cDNA indicates that two of three genes provide expression levels that are within 2-fold of each other irrespective of the sample preparation method used. However, for approximately one-third of the genes there is discordance in the determination of presence or absence of the gene depending upon the method used. The discordant genes are characterized by an increased number of negative probe pairs and greater hybridization signals when the direct RNA labeling method is used. Several reasons may contribute to this discordance. These include: (i) different hybridization kinetics for RNA and DNA molecules; (ii) different labeling protocols; (iii) cDNA synthesis bias based on random hexamer hybridization to the target; (iv) non-specific hybridization of the remaining rRNA. One of the observations made during this study was that the cDNA method did not improve when enriched RNA was used as the template for cDNA synthesis (data not shown). Direct labeling of total RNA, however, resulted in increased non-specific hybridization that was attributed to large amounts of rRNA in the sample (unpublished observation). In one of the discordant groups the direct labeled genes showed double the number of negative probe pairs than the genes from the cDNA method; this implies that the discordance of the genes in this group is due to non-specific hybridization of direct labeled RNA with the MM probe pairs. The cDNA method does not show significant deviations in the number of negative probe pairs and only a slight reduction in the average difference for discordant genes (P = 10–2). This comparison of two different labeling methods shows that for expression studies using microarrays the use of a consistent sample labeling protocol is essential. This becomes especially important when building expression libraries with data generated by different laboratories.
Acknowledgments
ACKNOWLEDGEMENTS
We would like to thank Garry Miyada, Kay Wu and Fred Christian for many fruitful discussions and suggestions.
REFERENCES
- 1.Xu J., Stolk,J.A., Zhang,X., Silva,S.J., Houghton,R.L., Matsumura,M., Vedvick,T.S., Leslie,K.B., Badaro,R. and Reed,S.G. (2000) Identification of differentially expressed genes in human prostate cancer using subtraction and microarray. Cancer Res., 60, 1677–1682. [PubMed] [Google Scholar]
- 2.Coller H.A., Grandori,C., Tamayo,P., Colbert,T., Lander,E.S., Eisenman,R.N. and Golub,T.R. (2000) Expression analysis with oligonucleotide microarrays reveals that MYC regulates genes involved in growth, cell cycle, signaling and adhesion. Proc. Natl Acad. Sci. USA, 97, 3260–3265. [DOI] [PMC free article] [PubMed] [Google Scholar]
- 3.Sudarsanam P., Iyer,V.R., Brown,P.O. and Winston,F. (2000) Whole-genome expression analysis of snf/swi mutants of Saccharomyces cerevisiae. Proc. Natl Acad. Sci. USA, 97, 3364–3369. [DOI] [PMC free article] [PubMed] [Google Scholar]
- 4.Bryant Z., Subrahmanyan,L., Tworoger,M., LaTray,L., Liu,C.R., Li,M.J., van den Engh,G. and Ruohola-Baker,H. (1999) Characterization of differentially expressed genes in purified Drosophila follicle cells: toward a general strategy for cell type-specific developmental analysis. Proc. Natl Acad. Sci. USA, 96, 5559–5564. [DOI] [PMC free article] [PubMed] [Google Scholar]
- 5.Winzeler E.A., Shoemaker,D.D., Astromoff,A., Liang,H., Anderson,K., Andre,B., Bangham,R., Benito,R., Boeke,J.D., Bussey,H., Chu,A.M., Connelly,C., Davis,K., Dietrich,F., Dow,S.W., El Bakkoury,M., Foury,F., Friend,S.H., Gentalen,E., Giaever,G., Hegemann,J.H., Jones,T., Laub,M., Liao,H., Davis,R.W. et al. (1999) Functional characterization of the S. cerevisiae genome by gene deletion and parallel analysis. Science, 285, 901–906. [DOI] [PubMed] [Google Scholar]
- 6.Heller R.A., Schena,M., Chai,A., Shalon,D., Bedilion,T., Gilmore,J., Woolley,D.E. and Davis,R.W. (1997) Discovery and analysis of inflammatory disease-related genes using cDNA microarrays. Proc. Natl Acad. Sci. USA, 94, 2150–2155. [DOI] [PMC free article] [PubMed] [Google Scholar]
- 7.Spellman P.T., Sherlock,G., Zhang,M.Q., Iyer,V.R., Anders,K., Eisen,M.B., Brown,P.O., Botstein,D. and Futcher,B. (1998) Comprehensive identification of cell cycle-regulated genes of the yeast Saccharomyces cerevisiae by microarray hybridization. Mol. Biol. Cell, 9, 3273–3297. [DOI] [PMC free article] [PubMed] [Google Scholar]
- 8.Kaminski N., Allard,J.D., Pittet,J.F., Zuo,F., Griffiths,M.J., Morris,D., Huang,X., Sheppard,D. and Heller,R.A. (2000) Global analysis of gene expression in pulmonary fibrosis reveals distinct programs regulating lung inflammation and fibrosis. Proc. Natl Acad. Sci. USA, 97, 1778–1783. [DOI] [PMC free article] [PubMed] [Google Scholar]
- 9.Richmond C.S., Glasner,J.D., Mau,R., Jin,H. and Blattner,F.R. (1999) Genome-wide expression profiling in Escherichia coli K-12. Nucleic Acids Res., 27, 3821–3835. [DOI] [PMC free article] [PubMed] [Google Scholar]
- 10.Gingeras T.R. and Rosenow,C. (2000) Studying microbial genomes with high-density oligonucleotide arrays. Am. Soc. Microbiol. News, 66, 463–469. [Google Scholar]
- 11.Nakazato H., Venkatesan,S. and Edmonds,M. (1975) Polyadenylic acid sequences in E. coli messenger RNA. Nature, 256, 144–146. [DOI] [PubMed] [Google Scholar]
- 12.Cao G.J. and Sarkar,N. (1992) Identification of the gene for an Escherichia coli poly(A) polymerase. Proc. Natl Acad. Sci. USA, 89, 10380–10384. [DOI] [PMC free article] [PubMed] [Google Scholar]
- 13.Selinger D.W., Cheung,K.J., Mei,R., Johansson,E.M., Richmond,C.S., Blattner,F.R., Lockhart,D.J. and Church,G.M. (2000) RNA expression analysis using a 30 base pair resolution Escherichia coli genome array. Nature Biotechnol., 18, 1262–1268. [DOI] [PubMed] [Google Scholar]
- 14.Blattner F.R., Plunkett,G., Bloch,C.A., Perna,N.T., Burland,V., Riley,M., Collado-Vides,J., Glasner,J.D., Rode,C.K., Mayhew,G.F., Gregor,J., Davis,N.W., Kirkpatrick,H.A., Goeden,M.A., Rose,D.J., Mau,B. and Shao,Y. (1997) The complete genome sequence of Escherichia coli K-12. Science, 277, 1453–1474. [DOI] [PubMed] [Google Scholar]
- 15.Guyer M.S., Reed,R.R., Steitz,J.A. and Low,K.B. (1981) Identification of a sex-factor-affinity site in E. coli as gamma delta. Cold Spring Harbor Symp. Quant. Biol., 45, 135–140. [DOI] [PubMed] [Google Scholar]


