Abstract
Masks are the primary tool used to prevent the spread of COVID-19 in the current pandemic. The use of masks may result in some discomfort, which may be caused by the accumulation of carbon dioxide in the inner space of the mask. This paper presents tests of carbon dioxide concentration in the inner space of the mask during work at a computer, for various flat and convex masks. Five different masks were used in the tests. Convex masks showed a greater accumulation of carbon dioxide than flat masks. The concentration of carbon dioxide was also higher for masks made of more layers. The dependence of the average values of carbon dioxide concentrations under the masks for selected people depending on the BMI and the type of mask was determined, as well as the measurements of carbon dioxide concentrations without the mask. An increase in carbon dioxide concentration was observed with increasing BMI.
The development of effective self-defense tools against the virus, including masks, is essential to contain the spread of COVID-19.
Keywords: Face masks, COVID-19, Carbon dioxide concentration, Air quality, Human health
Introduction
Indoor carbon dioxide (CO2) is generated mainly by the breathing of people in the room [1–4]. According to the standards of the American Society of Heating, Refrigerating and Air-Conditioning Engineers [5], indoor air CO2 levels should be well below 1,000 ppm to avoid the negative effects of poor indoor air quality [6–9]. A carbon dioxide concentration of 5,000 ppm (0.5%) is taken as the safety threshold for an eight-hour working day [10, 11]. According to various international standards, the recommended CO2 concentration for good air quality for human breathing is in the range 600–1000 ppm, and the acceptable concentration is 1000–1400 ppm [5, 12–15]. Various health problems are observed with prolonged exposure of humans to the concentration of CO2 above 5000 ppm. There are headaches, burning eyes and visual disturbances after fainting (with carbon dioxide concentrations above 70,000 ppm) and death (above 100,000 ppm) [14, 16]. In the literature [17, 18] there are studies describing the decline of intellect or disturbances of human concentration in unventilated rooms as a result of CO2 accumulation in those rooms. In literature [18, 19] it was reported that people performing precise activities or learning become tired much faster as a result of an increase in the concentration of CO2, while in [20] a deterioration in memorization scores was reported.
The coronavirus is an RNA virus covered with a fatty membrane, which can be combated with the use of chemicals such as ordinary soap, 60–70% alcohol, disinfectants and other virucidal preparations. COVID-19 is spread by talking, coughing, sneezing, and even breathing, in the form of aerosol droplets. Minimizing human-to-human spread of the virus is one of the most effective ways to control the current pandemic [21]. To prevent the spread of the disease, pharmaceutical interventions are undertaken, such as vaccinations and immune-boosting drugs, as well as non-pharmaceutical interventions such as social distancing, contact tracing, quarantine, face masks, regular hand washing with water, and the use of alcohol-based disinfectants [22]. One of the non-pharmaceutical forms of protection against COVID-19 is the wearing of protective masks. Currently, masks are undergoing dynamic development with the use of modern technologies based, for example, on nanotechnology [23], and hybrid models using deep and classical machine learning are being developed to detect the presence of a face mask [24]. According to [21], the mask is a more effective method of controlling infection and breaking the COVID-19 transmission chain than other methods such as washing hands, personal hygiene and social distancing.
Wearing masks is one of the standard methods of preventing the spread of disease by droplets. The effectiveness of the use of protective masks has been the subject of many publications, mainly concerning health care [25–28]. Recent studies show that wearing masks should not adversely affect health [29, 30], even in people with diseases [31]. The results of studies in [32] show that wearing the N95 mask during low-intensity work (MET 3) may increase metabolism, which reduces exhaled oxygen and increases the concentration of exhaled CO2.
Based on our own research [33] and literature [2, 3, 34, 35], we state that the concentration of CO2 in a room depends primarily on: the volume of the room, the number of CO2 sources and the intensity of ventilation (air exchange). A person exhales a different amount of CO2 depending on activity. Table 1 shows the relationship between the quantity of carbon dioxide per person and the type of human activity.
Table 1.
Carbon dioxide per person depending on activity level (own study based on [36])
| Activity | Carbon dioxide CO2 |
|
|---|---|---|
| [dm3/h] | [g/h] | |
| Relax | 12 | 23.724 |
| Activity level I (Sedentary) | 15 | 29.655 |
| Activity level II (Some physical activity) | 23 | 45.471 |
| Activity level III (Moderate Physical Activity) | 30 | 59.31 |
| Activity level IV (Vigorous Activity) | above 30 | 59.31 |
The aim of the present study is to measure the concentration of CO2 in selected masks while the user is working at a computer in a sitting position. Five different masks were used in the tests. It should be emphasized here that despite the fact that the introduction to the publication presents the influence of carbon dioxide on human health, no medical and questionnaire studies on the influence of an increased concentration of carbon dioxide on human health and well-being were performed in this work. The effectiveness of the masks in preventing viruses, bacteria and dust from entering the respiratory system was also not assessed in the study.
Research methodology
The tests of five masks involved determination of the CO2 concentration in the inner space of the mask (the volume bounded by the masked face and the inner surface of the mask).
Description of the tested masks
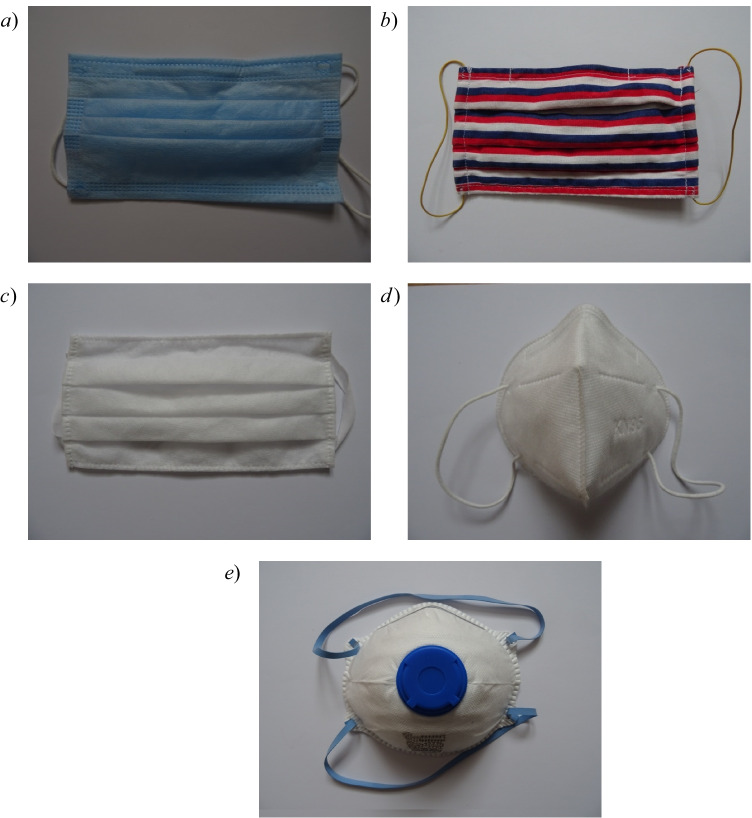
The research was carried out on five different popular masks. They are shown in general view in Fig. 1a–e, and their technical parameters are given in Table 2. Mask 1 and masks 3–5 were bought in local stores in Poland, while mask 2 was made by the researcher from cotton material. Based on their shape, masks 1–3 (Fig. 1a–c) were classified as flat masks, while masks 4 and 5 were classified as convex masks. Based on the type of material on the face of the mask, they were further classified as homogeneous (masks 1–4) and heterogeneous (mask 5). The heterogeneous mask 5 (Fig. 1e) consists of unpainted material, painted material, and a centrally located check valve. In this mask, the check valve is designed to lower the temperature and humidity under the mask by increasing the air flow during exhalation, as a result of which unfiltered air is exhaled through the valve. During inhalation, the check valve closes. Unidirectional air filtration means that this mask exposes others to the risk of COVID-19 infection from the user of the mask. It should be noted here that during the COVID-19 pandemic, there was a rapid shortage of masks in shops and pharmacies, which is why at the beginning of the pandemic, various masks were used, including masks made by users themselves. The work examined the masks that were most often used in the first phase of the COVID-19 pandemic in Poland.
Fig. 1.
General view of the tested masks: a) mask 1, b) mask 2, c) mask 3, d) mask 4, e) mask 5
Table 2.
Description of the tested masks
| Number | Name | Shape | Weight [g] | Material | Description of the mask |
|---|---|---|---|---|---|
| Mask 1 | three-layer mask | flat | 4 | non-woven polypropylene | type I, acc. to EN 14,683, three layers of fabric |
| Mask 2 | hand-made mask | flat | 14 | 100% cotton, weight: 125 g/m2 | made of three layers of material |
| Mask 3 | double-layer mask | flat | 4 | non-woven polypropylene | two layers of fabric |
| Mask 4 | protective mask, KN95 | convex | 5 | polypropylene | type FFP2 (according to EN 149: 2001 + A1: 2009 / GB2626-2006 KN95), mask equipped with a metal buckle at the level of the nose on the outer part of the mask, very densely woven materials, five layers of fabric |
| Mask 5 | filtering half mask, type FFP2 | convex | 14 | polypropylene | half mask with an exhalation check valve, type FFP2 (according to EN 149: 2001), mask equipped with a metal clip at the level of the nose on the outer part of the mask, very densely woven materials |
Carbon dioxide measurements in the space between mask and face
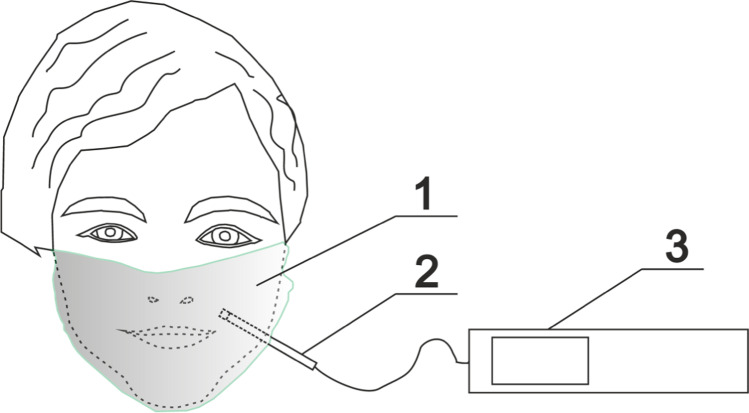
Carbon dioxide measurements were made using a Testo IAQ probe connected to a Testo 435 recorder, for which the error is ± 3% and ± 5% of the measured value for the ranges 0–5000 ppm and 5001– + 10,000 ppm respectively [33]. Before the experiment began, the apparatus was calibrated by an external calibration laboratory. The parameters of the internal and external environment were measured according to the recommendations given in the literature [37, 38]. Results were recorded every second. Carbon dioxide concentration was recorded every 1 s. The measurement point was located in the lower part of the zygomaticus major muscle (Fig. 2). The initial CO2 value was similar to the concentration of CO2 in the room where the tests were performed, and was on average 530 ppm. The room in which the tests were carried out had a volume of 300 m3 and was equipped with gravity ventilation with 0.5 air changes. The average temperature in the tested room was 21.3 °C (± 0.1 °C). On each occasion the mask was tested for 60 min, during which the people using the masks performed light work at a computer in a sitting position. Carbon dioxide concentration measurements were made for four adults, whose characteristics are given in Table 3. Body mass index (BMI) was determined according to the following formula:
| 1 |
Fig. 2.
Location of the measuring probe under the mask during measurement of CO2 concentration: 1 – test mask, 2 – measuring probe, 3 – CO2 concentration recorder
Table 3.
Characteristics of test subjects
| Number | Gender | Age | Height | Weight | BMI |
|---|---|---|---|---|---|
| - | - | - | cm | kg | kg/m2 |
| Person 1 | female | 56 | 171 | 102 | 35 |
| Person 2 | male | 43 | 180 | 90 | 28 |
| Person 3 | male | 43 | 178 | 100 | 32 |
| Person 4 | female | 35 | 164 | 70 | 26 |
All masks were tested by four participants and each participant performed 10 measurement series for each mask. It should be noted here that the number of respondents is small and equals 4 people, and the age range of the respondents is narrow and ranges from 35 to 56 years, therefore the results of the research on CO2 concentration presented in this paper should be treated as preliminary studies.
The uncertainty of the measured values was calculated according to Moffat [39] as follows:
| 2 |
where Binst is the overall fixed error uncertainty of the measurement equipment, and σran is a random error caused by various factors.
Results and discussion
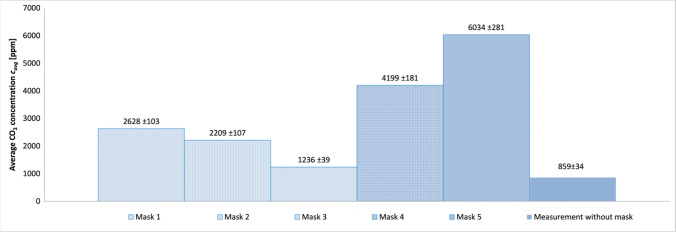
Figure 3 shows the average values of CO2 concentration for each mask and the measurement without mask measured for four people, from 10 measurement series for each mask. The highest mean values of CO2 concentration were obtained for the convex masks (masks 4 and 5), and the lowest for the flat masks (masks 1, 2, 3). The lowest average concentration of CO2 was obtained for the two-layer mask (mask 3), and was about one-sixth of the highest average concentration, obtained for the mask with a check valve (mask 5).
Fig. 3.
Comparison of mean values of CO2 concentration under the mask for selected masks and the measurement without the mask
Table 4 shows the average values of CO2 concentrations for various masks and test participants from 10 measurement series for each mask. The highest average values of CO2 concentrations were recorded for the first participant of the study, the lowest values for the fourth participant. The maximum average concentration of carbon dioxide was recorded for person No. 1, which is the oldest in the studied group, while the minimum mean concentration of carbon dioxide was recorded for the youngest person (No. 4), which may indicate the influence of age on the concentration of carbon dioxide in the mask space. In order to achieve more accurate results, research should be carried out on a larger group of people.
Table 4.
Average CO2 concentrations for various masks and test participants from 10 measurement series for each mask
| Average CO2 concentration [ppm] | |||||||
|---|---|---|---|---|---|---|---|
| Person | Mask 1 | Mask 2 | Mask 3 | Mask 4 | Mask 5 | Measurement without mask | Inside the laboratory |
| Person 1 | 3514 | 2786 | 1515 | 5427 | 7334 | 914 | 539 |
| Person 2 | 2088 | 1875 | 976 | 3264 | 6525 | 835 | 527 |
| Person 3 | 2948 | 2592 | 1258 | 5201 | 6365 | 934 | 563 |
| Person 4 | 1964 | 1584 | 1196 | 2905 | 3914 | 754 | 528 |
In order to thoroughly understand the effect of the mask on the CO2 levels in the space between the mask and the face, CO2 concentration tests were performed without the mask with the CO2 probe positioned in the same way as when measuring CO2 with the mask. The results of the measurements are presented in Table 4 and Fig. 3. Table 4 also shows the average values of CO2 concentration in the room where the tests were carried out. The values of CO2 concentrations during the test without a mask are about 70%, 58%, 66%, 43% higher than the average CO2 concentration in the room for participant 1, 2, 3 and 4, respectively. Several dozen percent higher values of CO2 concentrations during the measurement without the masks compared to the measurement of CO2 concentration in the room indicate a significant effect of the CO2 source, which is generated by the participant on the measuring probe. It should be noted here that the space of the mask is relatively small and it is probably impossible to eliminate this effect of the CO2 source.
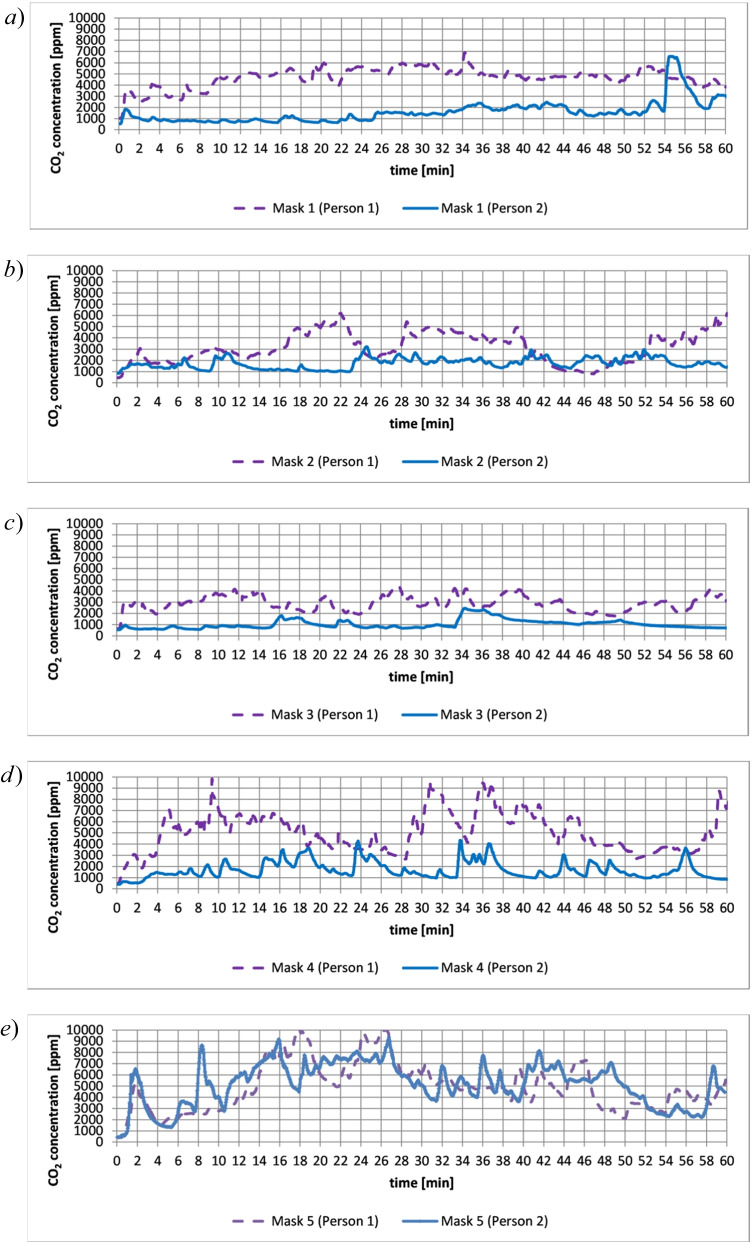
Figure 4a–e show example plots of CO2 concentration under the mask over a period of one hour. The graphs show higher values of CO2 concentration in the case of person 1 than person 2. The differences between the results of the tests between persons 1 and 2 indicate that the concentration of CO2 under the mask may depend on individual characteristics of the user. In the case of convex masks (masks 4 and 5), greater fluctuations in the concentration of CO2 were observed than in the case of flat masks. Drops in CO2 concentration after reaching the maximum values in convex masks may be caused by respiratory compensation [40, 41]. Respiratory compensation aims to eliminate CO2 and restore pH to normal levels by increasing alveolar ventilation [42]. The maximum instantaneous values of CO2 concentrations were obtained for masks 4 and 5, and were about 10,000 ppm. It should be noted that, according to the literature [43], inhaled carbon dioxide at concentrations < 10,000 ppm has practically no toxic effect.
Fig. 4.
Sample graphs showing the concentration of CO2 under the mask as a function of time over one hour (person 1, person 2): a) mask 1, b) mask 2, c) mask 3, d) mask 4, e) mask 5
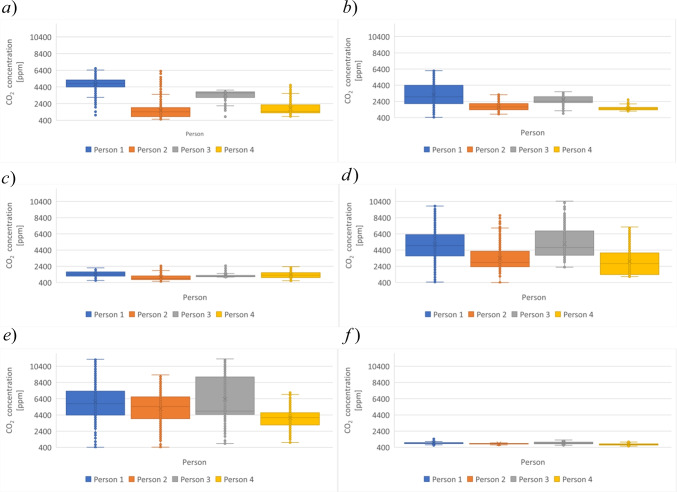
Figure 5a–f show box plots for the exemplary series of CO2 concentration measurements for masks 1, 2, 3, 4, 5, and measurement without the mask, respectively. The plots show a significant dispersion of data, which is probably related to respiratory compensation. The graphs also show significant outliers that are determined by the lower CO2 concentration values when the CO2 measurement is started, and upper outliers that are likely also due to respiratory compensation.
Fig. 5.
Examples of box graphs showing the concentration of CO2 under the mask as a function of time in an hour for four people: a) mask 1, b) mask 2, c) mask 3, d) mask 4, e) mask 5, f) without a mask
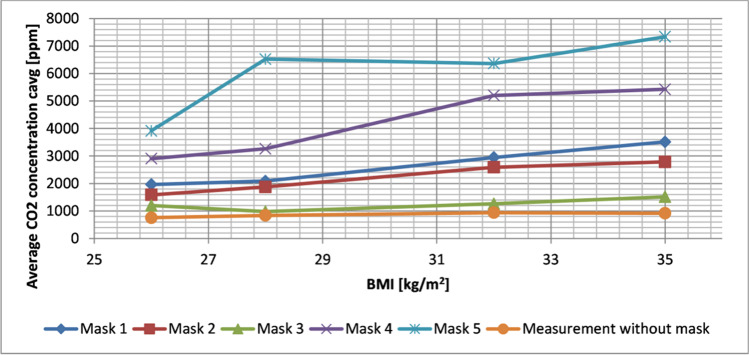
Figure 6 shows the dependence of the average values of CO2 concentrations under masks for selected people depending on the BMI and the type of mask and measurements of CO2 concentrations without mask. Figure 6 shows an increase in CO2 concentration as BMI increases.
Fig. 6.
The dependence of the concentration of CO2 under the masks depending on the BMI and the type of mask and CO2 measurement without the mask
The average values of CO2 concentration during work at a computer in the case of masks 1 and 4 were higher by approximately 20% and 45% respectively than the values of CO2 concentration for the tested surgical mask and KN95 mask from [44]. Such significant differences in the results obtained for average CO2 concentrations may result from the different research method used in [44], as well as from the individual characteristics of the person using the mask. In [44] the concentration of CO2 in the breathing zone was determined by aspirating air through a silicone tube from the breathing zone behind the mask, where the sampling point was on the bridge of the nose, just above the tip. The placement of the inlet of the tube over the tip of the nose may cause additional fresh air intake through the face of the mask, and therefore the results for the CO2 concentration in the mask may be understated.
Significant values of CO2 concentration in N95 masks were obtained in [45], amounting to as much as 30,000 ppm. Such high values of CO2 concentration are possibly influenced by the location of the probe between the nose and the mouth, which may result in the measurement of exhaled air, with a significant increase in the concentration of CO2 during the measurement. In [46] high concentrations of CO2 were also obtained in cloth and paper face masks.
Conclusions
This paper has described measurements of carbon dioxide concentration in different masks. The following conclusions are drawn from the research:
The highest concentrations of carbon dioxide in the space between the mask and the face occurred for convex masks (7334 ppm), and the lowest for flat masks (976 ppm).
The greatest fluctuations in carbon dioxide concentrations were obtained for convex masks, which may be caused by respiratory compensation.
An increase in carbon dioxide concentration was observed with increasing BMI.
Due to the significant concentration of carbon dioxide in the mask space, it is worth considering the maximum period of use of the protective mask, followed by a break in wearing the mask. Introducing the maximum duration of use of the mask requires additional tests to be carried out in subsequent works.
Acknowledgements
This scientific project was financed from funds of WZ/WB-IIŚ/7/2022 and Institute of Environmental Engineering, Warsaw University of Life Sciences (SGGW).
Author contribution
Katarzyna Gładyszewska-Fiedoruk: Conceptualization, Methodology, Formal analysis, Resources, Investigation, Supervision. Tomasz Janusz Teleszewski: Software, Visualization, Validation, Methodology, Resources, Investigation.
Declarations
Competing interest
The authors declare that they have no known competing financial interests or personal relationships that could have appeared to influence the work reported in this paper.
Footnotes
Publisher's note
Springer Nature remains neutral with regard to jurisdictional claims in published maps and institutional affiliations.
References
- 1.Asif A, Zeeshan M. Indoor temperature, relative humidity and CO2 monitoring and air exchange rates simulation utilizing system dynamics tools for naturally ventilated classrooms. Build Environ. 2020;180:106980. doi: 10.1016/j.buildenv.2020.106980. [DOI] [Google Scholar]
- 2.Piasecki M, Kostyrko K. Development of weighting scheme for indoor air quality model using a multi-attribute decision making method. Energies. 2020;13(12):3120. doi: 10.3390/en13123120. [DOI] [Google Scholar]
- 3.Szczurek A, Maciejewska M, Wyłomańska A, Zimroz R, Żak G, Dolega A. Detection of occupancy profile based on carbon dioxide concentration pattern matching. Measurement. 2016;93:265–271. doi: 10.1016/j.measurement.2016.07.036. [DOI] [Google Scholar]
- 4.Kapalo P, Sulewska M, Adamski M. Examining the Interdependence of the Various Parameters of Indoor Air. In: Blikharskyy Z. (eds) Proceedings of EcoComfort 2020. EcoComfort 2020. Lecture Notes in Civil Engineering. 2021; 100: 150–157.
- 5.Kapalo P, Sulewska M, Adamski M. Examining the Interdependence of the Various Parameters of Indoor Air. Lect Notes Civ Eng 100 LNCE 2021;150–157. Code 243839.
- 6.ASHRAE, 2016 62.1, Ventilation for Acceptable Indoor Air Quality, American Society of Heating, Refrigerating and Air-Conditioning Engineers, Inc., Atlanta, GA (2016).
- 7.Dutta J, Roy S. IndoorSense: context based indoor pollutant prediction using SARIMAX model. Multimed Tools Appl. 2021;80(13):19989–20018. doi: 10.1007/s11042-021-10666-w. [DOI] [Google Scholar]
- 8.Szczepanik-Scislo N, Scislo L. Comparison of CFD and Multizone Modeling from Contaminant Migration from a Household Gas Furnace. Atmosphere. 2021;12(1):79. doi: 10.3390/atmos12010079. [DOI] [Google Scholar]
- 9.Asere L, Blumberga A. Energy Efficiency - Indoor Air Quality Dilemma in Educational Buildings: A Possible Solution. Environ Clim Technol. 2020;24(1):357–367. doi: 10.2478/rtuect-2020-0020. [DOI] [Google Scholar]
- 10.Nandan A, Siddiqui NA, Singh C, Aeri A. Occupational and environmental impacts of indoor air pollutant for different occupancy: a review. Toxicol Environ Health Sci. 2021;13(4):303–322. doi: 10.1007/s13530-021-00102-9. [DOI] [Google Scholar]
- 11.ACGIH. TLV and BEIs Based on the Documentation of the Threshold Limit Values for Chemical Substance and Physical Agents. 2019.
- 12.OSHA. Permissible Exposure Limits for Chemical Contaminants - Annotated Tables. Occupational Safety and Health Administration. 2018. Retrieved March 31, 2019 (https://www.osha.gov/dsg/annotated-pels/tablez-1.html).
- 13.PN-EN 13779:2008 Ventilation for non-residential buildings. Performance requirements for ventilation and room-conditioning systems.
- 14.NIOSH. National Institute for Occupational Safety and Health, Research Compendium. 2012
- 15.OSHA. Occupational Safety and Health Administration, United States Department of Labor. 2012
- 16.IDPH, Illinois Department of Public Health http://dph.illinois.gov/topics-services/environmental-health-protection/toxicology/indoor-air-quality-healthy-homes [Available 15.04.2021].
- 17.Zhang J, Pang L, Cao X, Wanyan X, Wang X, Liang J, Zhang L. The effects of elevated carbon dioxide concentration and mental workload on task performance in an enclosed environmental chamber. Build Environ. 2020;178:106938. doi: 10.1016/j.buildenv.2020.106938. [DOI] [Google Scholar]
- 18.Riham Jaber A, Dejan M, Marcella U. The Effect of Indoor Temperature and CO2 Levels on Cognitive Performance of Adult Females in a University Building in Saudi Arabia. Energy Procedia. 2017;122:451–456. doi: 10.1016/j.egypro.2017.07.378. [DOI] [Google Scholar]
- 19.Alahmadi A. Design an optimum climate control system for efficient smart universities educational environment. IJSTR. 2020;9(3):440–449. [Google Scholar]
- 20.Hviid ChA, Pedersen Ch, Dabelsteen KH. A field study of the individual and combined effect of ventilation rate and lighting conditions on pupils’ performance. Build Environ. 2020;171:106608. doi: 10.1016/j.buildenv.2019.106608. [DOI] [Google Scholar]
- 21.Snow S, Boysona AS, Paas KHW, Gough H, King M-F, Barlow J, Noakes CJ, Schraefel MC. Exploring the physiological, neurophysiological and cognitive performance effects of elevated carbon dioxide concentrations indoors. Build Environ. 2019;156:243–252. doi: 10.1016/j.buildenv.2019.04.010. [DOI] [Google Scholar]
- 22.Goh Y, Tan BYQ, Bhartendu Ch, Ong JJY, Sharma VK. The face mask: How a real protection becomes a psychological symbol during Covid-19? Brain Behav Immun. 2020;88:1–5. doi: 10.1016/j.bbi.2020.05.060. [DOI] [PMC free article] [PubMed] [Google Scholar]
- 23.Colebunders R, Siewe Fodjo JN, Vanham G, Van den Bergh R. A call for strengthened evidence on targeted, non-pharmaceutical interventions against COVID-19 for the protection of vulnerable individuals in sub-Saharan Africa. Int J Infect Dis. 2020;99:482–484. doi: 10.1016/j.ijid.2020.08.060. [DOI] [PMC free article] [PubMed] [Google Scholar]
- 24.Loey M, Manogaran G, Taha MHN, Khalifad NEM. A hybrid deep transfer learning model with machine learning methods for face mask detection in the era of the COVID-19 pandemic. Measurement. 2021;167:108288. doi: 10.1016/j.measurement.2020.108288. [DOI] [PMC free article] [PubMed] [Google Scholar]
- 25.Huang Z, Zhao S, Li Z, Chen W, Zhao L, Deng L, Song B. The Battle Against Coronavirus Disease 2019 (COVID-19): Emergency Management and Infection Control in a Radiology Department. J Am Coll Radiol. 2020;17(6):710–716. doi: 10.1016/j.jacr.2020.03.011. [DOI] [PMC free article] [PubMed] [Google Scholar]
- 26.Sobti A, Fathi M, Mokhtar MA, Mahana K, Rashid MS, Polyzois I, Narvani AA, Imam MA. Aerosol generating procedures in trauma and orthopaedics in the era of the Covid-19 pandemic; What do we know? Surgeon. 2021;19(2):e42–e48. doi: 10.1016/j.surge.2020.08.001. [DOI] [PMC free article] [PubMed] [Google Scholar]
- 27.Zhao Ch, Viana A, Wang Y, Wei H-Q, Yan A-H, Capasso R. Otolaryngology during COVID-19: Preventive care and precautionary measures. Am J Otolaryngol. 2020;41(4):102508. doi: 10.1016/j.amjoto.2020.102508. [DOI] [PMC free article] [PubMed] [Google Scholar]
- 28.Bashirian S, Jenabi E, Khazaei S, Barati M, Karimi-Shahanjarini A, Zareian S, Rezapur-Shahkolai F, Moeini B. Factors associated with preventive behaviours of COVID-19 among hospital staff in Iran in 2020: an application of the Protection Motivation Theory. J Hosp Infect. 2020;105(3):430–433. doi: 10.1016/j.jhin.2020.04.035. [DOI] [PMC free article] [PubMed] [Google Scholar]
- 29.Samannan R, Holt G, Calderon-Candelario R, Mirsaeidi M, Campos M. Effect of Face Masks on Gas Exchange in Healthy Persons and Patients with COPD. Ann Am Thorac Soc. 2020 doi: 10.1513/AnnalsATS.202007-812RL. [DOI] [PMC free article] [PubMed] [Google Scholar]
- 30.Lim EC, Seet RC, Lee KH, Wilder-Smith EP, Chuah BY, Ong BK. Headaches and the N95 face-mask amongst healthcare providers. Acta Neurol Scand. 2006;113(3):199–202. doi: 10.1111/j.1600-0404.2005.00560.x. [DOI] [PMC free article] [PubMed] [Google Scholar]
- 31.www.thoracic.org American Thoracic Society. Face masks unlikely to cause over-exposure to carbon dioxide, even in patients with lung disease. [Updated January 11, 2021].
- 32.Tong PSY, Kale AS, Ng K, Loke AP, Choolani MA, Lim ChL, Chan YH, Chong YS, Tambyah PA, Yong E-L. Respiratory consequences of N95-type Mask usage in pregnant healthcare workers—a controlled clinical study. Antimicrob Resist Infect Control. 2015;4(1):48. doi: 10.1186/s13756-015-0086-z. [DOI] [PMC free article] [PubMed] [Google Scholar]
- 33.Teleszewski T, Gładyszewska-Fiedoruk K. The concentration of carbon dioxide in conference rooms – a simplified model and experimental verification. Int J Environ Sci Technol. 2019;16(12):8031–8040. doi: 10.1007/s13762-019-02412-5. [DOI] [Google Scholar]
- 34.Tureková I, Marková I, Sventeková E, Harangózo J. Evaluation of microclimatic conditions during the teaching process in selected school premises. Slovak case study. Energy. 2022;239:122161. doi: 10.1016/j.energy.2021.122161. [DOI] [Google Scholar]
- 35.Lee Y-K, Kim YI. Analysis of indoor air pollutants and guidelines for space and physical activities in multi-purpose activity space of elementary schools. Energies. 2022;15(1):220. doi: 10.3390/en15010220. [DOI] [Google Scholar]
- 36.Recknagel H, Sprenger E, Honmann W, Schramek ER. Taschenbuch fur Heizung und Klimatechnik. 3rd edition. Munchen: Ernst-Rudolf Schramek, 2008.
- 37.ASHRAE. Thermal Environmental Conditions for Human Occupancy ANSI/ASHRAE Standard 55–2013. 2013.
- 38.ASHRAE, STANDARD 55 – Thermal Environmental Conditions for Human Occupancy. 2020. https://www.ashrae.org/technical-resources/bookstore/standard-55-thermal-environmental-conditions-for-human-occupancy. Accessed 21 June 2021
- 39.Moffat RJ. Establishing the credibility of experimental work. Department of Mechanical Engineering. Stanford University, Stanford, CA 94305, USA, 1989.
- 40.Mason RJ, Slutsky A, Murray JF, Nadel JA, Gotway MB. Murray & Nadel's Textbook of Respiratory Medicine. 2-Volume Set, 6th Edition, 2016.
- 41.Chen Y, Yuan Y, Cai C, Li F, Zhou X. Effects of assist parameter on the performance of proportional assist ventilation in a lung model of chronic obstructive pulmonary disease. Respir Med Res. 2020;78:100766. doi: 10.1016/j.resmer.2020.100766. [DOI] [PubMed] [Google Scholar]
- 42.Higgins Ch. An introduction to acid-base balance in health and disease. 2004. https://acutecaretesting.org/en/articles/an-introduction-to-acidbase-balance-in-health-and-disease. [Available 15.05.2022].
- 43.Permentier K, Vercammen S, Soetaert S, Schellemans C. Carbon dioxide poisoning: Aliterature review of an often forgotten cause of intoxication in the emergency department. Int J Emerg Med. 2017;10:17–20. doi: 10.1186/s12245-017-0142-y. [DOI] [PMC free article] [PubMed] [Google Scholar]
- 44.Geiss O. Effect of Wearing Face Masks on the Carbon Dioxide Concentration in the Breathing Zone, Special Issue on COVID-19 Aerosol Drivers. Air Qual Res. Impacts Mitig (X) 2021;21(2).
- 45.Roberge RJ, Coca A, Williams W, Powell J, Palmiero A. Physiological impact of the N95 filtering facepiece respirator on healthcare workers. Respir Care. 2010;55:569–577. [PubMed] [Google Scholar]
- 46.Dattel AR, O’Toole N, Lopez G, Byrnes KP. Face mask effects of CO2, haert rate, respiration rate, and oxygen saturation on instructor pilots. Collegiate Aviat Rev-Int. 2020;38:1–11. [Google Scholar]


