

Introduction
Ambient air pollution, including particulate matter micrometers in aerodynamic diameter [fine particulate matter ()], is a leading cause of morbidity and mortality in the United States.1 The U.S. Environmental Protection Agency’s (EPA) National Ambient Air Quality Standard for () has resulted in consistently declining levels over the past decades but has not benefited racial/ethnic groups equally.2,3
The United States has a history of environmental injustice, and studies from the 1980s through the present document racial/ethnic disparities in air pollution exposure.4–6 These studies have generally quantified disparities using population-weighted averages,2–4 with a handful additionally including linear regression estimates,7,8 which can adjust for known confounders. Population-weighted averages and linear regression models can mask the shape and magnitude of the relationship between racial/ethnic composition and ambient air pollution concentration. For example, as a result of zoning, racial segregation, and environmental racism, we might expect a 10% area-level increase in non-Hispanic Black individuals to be more strongly related to poor air quality in communities comprising 80–90% compared with communities comprising 30–40% Black residents. In this case, a linear model would yield a point estimate that respectively over- and underestimates the association at the lower and higher ends of the distribution.
Here, we explore departures from linearity in the relationship between racial/ethnic composition and concentration across the United States. We also quantitatively compare the strength of the nonlinear association to the linear one and highlight implications for the quantification of resulting racial/ethnic disparities.
Methods
Our analysis covered urban census tracts [ tracts contained within core-based statistical areas (CBSAs)] in the contiguous United States in 2010. We obtained modeled publicly available annual surface-level concentrations of for 2010 from a gridded () data set,9 which we aggregated to census tracts. We compiled census tract-level percentage non-Hispanic Black and non-Hispanic White residents, percentage in poverty, and population density from the 2010 census.
We conducted descriptive analyses and evaluated the association between percentage racial/ethnic composition and concentration using linear mixed models with cubic natural splines whose number of degrees of freedom were selected with the Akaike information criterion. We adjusted models for census tract-level poverty and population density and included state-specific fixed effects and CBSA-specific random intercepts. We also fit models with linear terms and calculated the bias in estimates had we used a linear term by subtracting the linear point estimate from the nonlinear one. All analyses were conducted with R (version 4.1.2; R Development Core Team).
Results and Discussion
Across 58,030 U.S. urban census tracts in 2010, the median percentages of non-Hispanic Black and non-Hispanic White residents were 4.6% and 69.7%, respectively. The highest percentage of non-Hispanic Black residents was found in tracts in the highest concentration quartiles (Table 1).
Table 1.
Distribution of 2010 U.S. Census tract-level non-Hispanic Black and non-Hispanic White percentages by quartiles of 2010 tract-level concentration across 58,030 urban census tracts located in core-based statistical areas.
| Racial/ethnic percentages | quartiles () | |||
|---|---|---|---|---|
| Q1 (1.75, 8.34) () | Q2 (8.34, 9.87) () | Q3 (9.87, 11.1) () | Q4 (11.1, 16) () | |
| Black (%) | ||||
| Median | 1.7 | 4.8 | 7.7 | 7.1 |
| 25th, 75th | 0.7, 5.2 | 1.5, 14.4 | 2.3, 25.3 | 2.3, 27.2 |
| 10th, 90th | 0.3, 13.7 | 0.6, 34.3 | 0.8, 68.9 | 0.9, 75.5 |
| White (%) | ||||
| Median | 78.2 | 72.4 | 65.6 | 55.9 |
| 25th, 75th | 56.0, 89.6 | 46.3, 87.0 | 28.8, 84.6 | 17.6, 82.5 |
| 10th, 90th | 27.0, 94.7 | 17.5, 93.7 | 5.4, 92.8 | 3.6, 92.1 |
Note: , fine particulate matter; Q, quartile.
Linear and nonlinear models showed the same direction of association between racial/ethnic composition and ambient (positive for non-Hispanic Black and negative for non-Hispanic White) but different magnitudes across the distribution (Figure 1). For non-Hispanic Black residents, the linear model provided a point estimate of 0.09 [95% confidence interval (CI): 0.09, 0.10] for a 10%-point increase in percentage Black, which particularly underestimated the strength of this association in census tracts with a relatively small non-Hispanic Black population (Figure 1A). Using the nonlinear approach, moving from 0% to 10% and from 10% to 20% was respectively associated with a 1.11 (95% CI: 1.09, 1.14)- and a 0.008 (95% CI: 0.006, 0.010)- higher ambient concentration, which resulted in respective differences of 1.02 and when comparing the linear point estimate to the nonlinear one. Similarly, for non-Hispanic White residents, the magnitude of difference between the linear and nonlinear point estimates substantially varied across the distribution (Figure 1B).
Figure 1.
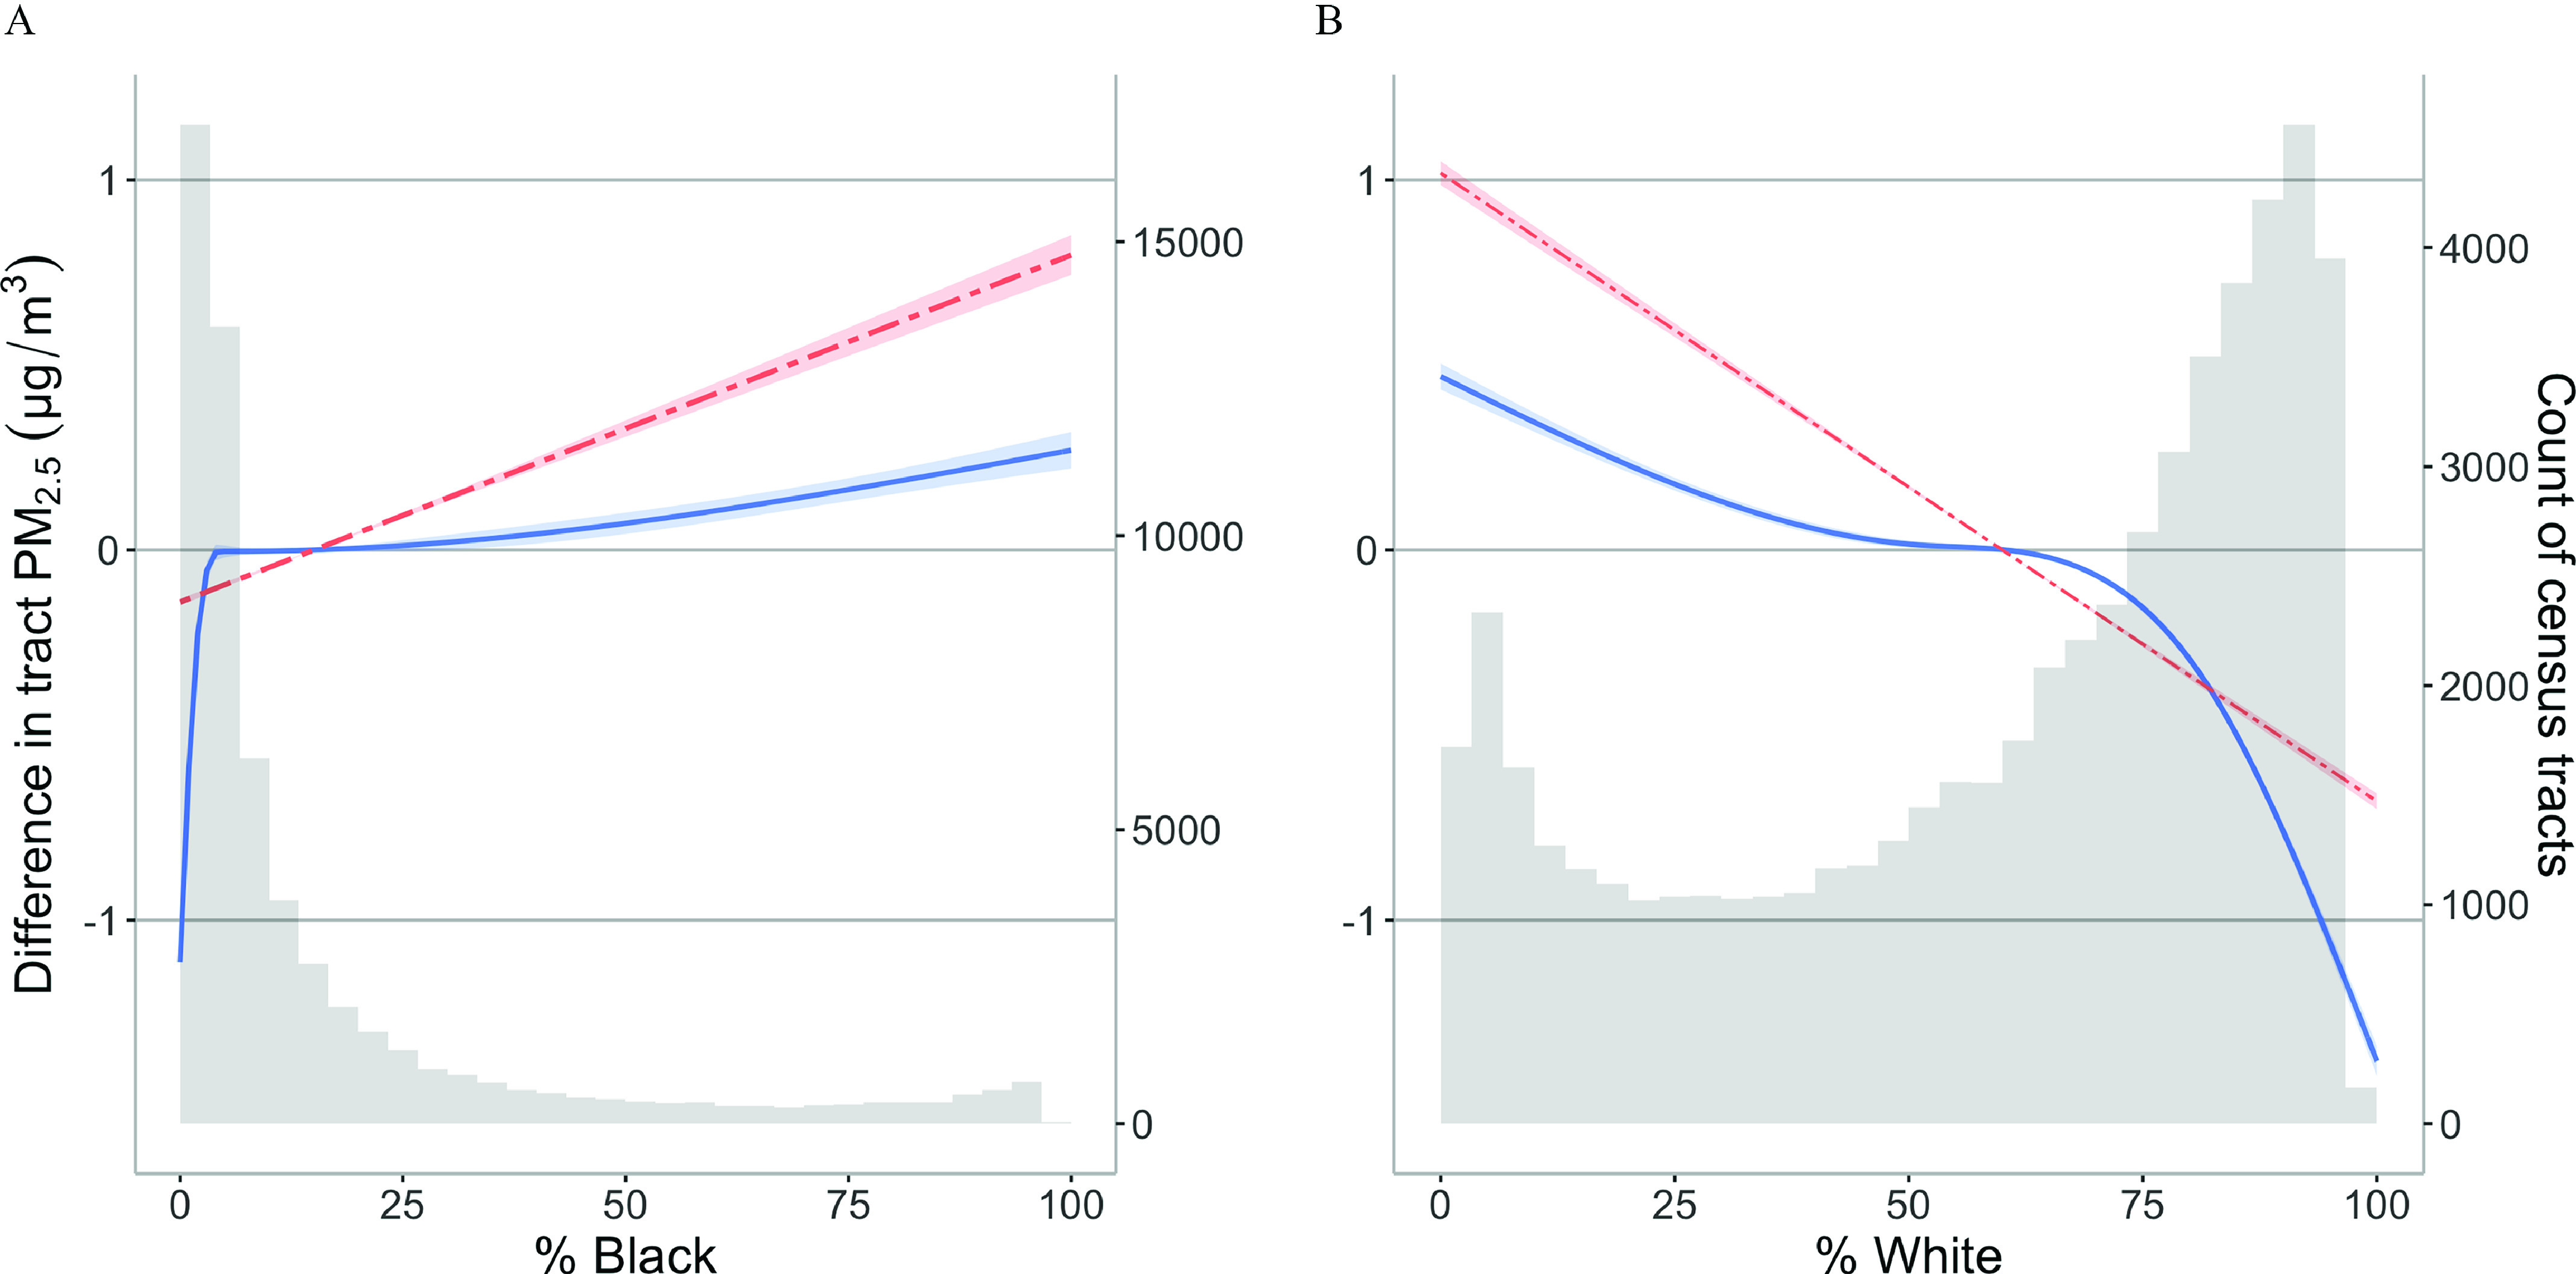
Difference in 2010 U.S. Census tract-level () associated with increases in racial/ethnic group percentage [(A) Black; (B) White] relative to the mean percentage of that racial/ethnic group. This change was modeled linearly (dashed lines) and nonlinearly with cubic natural splines (solid lines). Models were adjusted for tract-level poverty (defined as percentage of individuals with income below the U.S. Census Bureau poverty threshold) and for population density (defined as number of people per kilometer squared). Both models included state-specific fixed effects and nonlinear models additionally included a CBSA-specific random intercept. The gray bars represent the distribution of percentage Black and White in urban U.S. Census tracts. Urban census tracts with non-Hispanic Black residents make up 75% of urban census tracts. For non-Hispanic Black residents, in nonlinear models, moving from 0% to 10% and from 10% to 20% was respectively associated with a 1.11 (95% CI: 1.09, 1.14)- and a 0.008 (95% CI: 0.006, 0.010)- higher ambient concentration. The linear point estimate for a 10%-point increase in percentage Black was 0.09 (95% CI: 0.09, 0.10) . For non-Hispanic White residents, in nonlinear models, moving from 70% to 80% and from 80% to 90% was associated with ambient concentrations that were respectively 0.23 (95% CI:,)- and 0.47 (95% CI:,)- lower. The linear point estimate for a 10%-point increase in percentage White was (95% CI: ,). Note: CI, confidence interval.
Most studies describe exposure disparities using population-weighted averages in agreement with our results: Non-Hispanic Black individuals were exposed to higher levels of compared with non-Hispanic White individuals.2–4,7 In 2010, 8.8% of the overall U.S. population lived in block groups where concentrations exceeded the 90th percentile; for the non-Hispanic Black population, this percentage grew to 16%.3 Jbaily et al.2 expanded on previous studies that focused on population-weighted exposure at the extremes of the demographic distribution (i.e., the 10th and 90th percentiles).4 They estimated population-weighted averages across the distribution and documented a positive trend at the ZIP code–tabulation area level, which, in contrast to our findings, slightly strengthened at higher percentiles of non-Hispanic Black residents.2 Liu et al. conducted a block group-level correlation analysis and found a positive unadjusted relationship between concentrations and the fraction of racial/ethnic minority residents.3 We build on these findings by a) modeling concentrations as a nonlinear function of proportion Black and White residents and b) accounting for poverty and population density. We found the steepest difference in concentrations for small variations in low percentages of Black residents. Our method identified segments of the population for whom exposure has been substantially underestimated.7,8 Our results are not directly comparable to those of Jbaily et al.2 and Liu et al.3 who did not model an association but, rather, likely differ because of a) our adjustment for known confounders, b) our restriction to urban areas, and c) differing spatial units of analysis. Future studies should investigate whether such nonlinear associations vary regionally or temporally or are modified by factors such as residential segregation.
Multiple studies confirm inequities in air pollution exposure by racial/ethnic group in the United States. However, standard linear models appear to substantially underestimate the relationship between race/ethnicity and in urban U.S. Census tracts with non-Hispanic Black residents, which make up of urban tracts. These results may reflect the policies implemented due to relatively small increases in non-White populations, for example, racially restrictive zoning observed in the 1900s that may have resulted in disproportionate siting of industrial facilities or highways and rapid increases in air pollution.10 Our findings, combined with results indicating persistent,3,4 as well as increasing, disparities in exposures exceeding the U.S. EPA threshold,2 highlight the importance of centering equity in air quality policy to address long-standing disparities.
Acknowledgments
M.D., L.H., J.G., M.-A.K., and J.A.C. developed the study design. M.D., L.H., and J.A.C. conducted the literature review. M.D. was responsible for writing code and analyzing the data with input from all other authors. All authors contributed to interpretation of findings, writing, and editing of manuscript.
References
- 1.GBD 2019 Diseases and Injuries Collaborators. 2020. Global burden of 369 diseases and injuries in 204 countries and territories, 1990–2019: a systematic analysis for the Global Burden of Disease Study 2019. Lancet 396(10258):1204–1222, PMID: , 10.1016/S0140-6736(20)30925-9. [DOI] [PMC free article] [PubMed] [Google Scholar]
- 2.Jbaily A, Zhou X, Liu J, Lee TH, Kamareddine L, Verguet S, et al. 2022. Air pollution exposure disparities across US population and income groups. Nature 601(7892):228–233, PMID: , 10.1038/s41586-021-04190-y. [DOI] [PMC free article] [PubMed] [Google Scholar]
- 3.Liu J, Clark LP, Bechle MJ, Hajat A, Kim SY, Robinson AL, et al. 2021. Disparities in air pollution exposure in the United States by race/ethnicity and income, 1990–2010. Environ Health Perspect 129(12):127005, PMID: , 10.1289/EHP8584. [DOI] [PMC free article] [PubMed] [Google Scholar]
- 4.Colmer J, Hardman I, Shimshack J, Voorheis J. 2020. Disparities in PM2.5 air pollution in the United States. Science 369(6503):575–578, PMID: , 10.1126/science.aaz9353. [DOI] [PubMed] [Google Scholar]
- 5.Mohai P, Lantz PM, Morenoff J, House JS, Mero RP. 2009. Racial and socioeconomic disparities in residential proximity to polluting industrial facilities: evidence from the Americans’ Changing Lives Study. Am J Public Health 99(suppl 3):S649–S656, PMID: , 10.2105/AJPH.2007.131383. [DOI] [PMC free article] [PubMed] [Google Scholar]
- 6.Clark LP, Millet DB, Marshall JD. 2014. National patterns in environmental injustice and inequality: outdoor NO2 air pollution in the United States. PLoS One 9(4):e94431, PMID: , 10.1371/journal.pone.0094431. [DOI] [PMC free article] [PubMed] [Google Scholar]
- 7.Bell ML, Ebisu K. 2012. Environmental inequality in exposures to airborne particulate matter components in the United States. Environ Health Perspect 120(12):1699–1704, PMID: , 10.1289/ehp.1205201. [DOI] [PMC free article] [PubMed] [Google Scholar]
- 8.Woo B, Kravitz-Wirtz N, Sass V, Crowder K, Teixeira S, Takeuchi DT. 2019. Residential segregation and racial/ethnic disparities in ambient air pollution. Race Soc Probl 11(1):60–67, PMID: , 10.1007/s12552-018-9254-0. [DOI] [PMC free article] [PubMed] [Google Scholar]
- 9.Hammer MS, van Donkelaar A, Li C, Lyapustin A, Sayer AM, Hsu NC, et al. 2020. Global estimates and long-term trends of fine particulate matter concentrations (1998–2018). Environ Sci Technol 54(13):7879–7890, PMID: , 10.1021/acs.est.0c01764. [DOI] [PubMed] [Google Scholar]
- 10.Taylor DE. 2014. The rise of racial zoning: residential segregation. In: Toxic Communities: Environmental Racism, Industrial Pollution, and Residential Mobility. New York, NY: NYU Press, 147–191. [Google Scholar]