

Abstract
Telemedicine is a word that the world has been hearing about since the early days of the telephonic technology used to exchange information for delivering medical care. Medical practitioners need the holistic information of the patients to treat them effectively. Telemedicine is relatively limited compared to direct appointments; hence a prototype is needed to create an environment that is identical to the direct appointments where the practitioners can see the patient and their physiological data. A novel prototype with state-of-the-art software and hardware is developed for establishing a holistic telemedicine environment in this work. The designed system measures the skin temperature, SpO2, pulse rate, heart rate, breath rate, and Non-invasive Blood Pressure (NIBP). The SpO2 of the system is measured with Beer-Lambert’s law, and the NIBP is measured using a single synchronous ECG and PPG sensor. Quality video conferencing is provided between the patient and the practitioners.
Graphical abstract

Keywords: Telemedicine, Pulse transit time, NIBP, SpO2, ECG, PPG
Introduction
Healthcare is the primary concern of human life as people frequently get ill. With the shortage of medical practitioners, inadequate distribution of medical facilities, and exploration of pandemics, telemedicine has great importance in healthcare [1]. Telemedicine enables medical practitioners to reach out to large populations quickly and avoid unnecessary traveling [2]. Measurement of physiological measurements is shifted from mercury-based instruments to electronic instruments with the advent of technology. Telemedicine encompasses the measurement of physiological parameters, sharing the measured parameters, and getting the doctor’s advice from a remote location. The measurement of crucial health parameters such as temperature, heart rate, pulse rate, oxygen saturation, and blood pressure is performed by the practitioners to assess the condition of patients with different devices. With homoeothermic nature, humans maintain a specific temperature defined by the hypothalamus for proper body metabolism [3]. The temperature of the human body is affected in most illnesses, and hence practitioners primarily check the body temperature to detect hyperthermia and hypothermia in patients. Mercury-based temperature measurement is considered the gold standard in measuring core body temperature. The skin temperature can be measured with contact-based semiconductor ICs or contact-less IR-based thermometers. To avoid the risks in mercury thermometers and the inaccuracies in IR-based thermometers, the present work used an intelligent contact-based semiconductor sensor [4, 5].
The heart rate, pulse rate, and interbeat interval (IBI) give information about the heart and the rest of the cardiovascular system. Tachycardia, bradycardia, and heart rate variability can be diagnosed by regularly measuring the heart and pulse rates and IBI [6]. The electrocardiography (ECG) and photoplethysmography (PPG) signals obtained from the patients are processed to track the heart and pulse signals. The ECG signals are obtained by using three electrodes connected to the patients in the form of an Einthoven’s triangle, and the PPG signals are collected by using a reflective type pulse oximetry sensor to the fingertip of the patients [7, 8]. Amidst SARS-COV-2, silent hypoxia became one of the most threatening diseases for the virus-affected patients; hence, the regular measurement of oxygen saturation becomes essential [9, 10]. To measure the SpO2 for remote telemedicine applications, the PPG signal from a non-invasive reflective type sensor is processed. The Beer-Lambert law, employed in calculating SpO2, determines the properties of the liquids by calculating the amount of light observed by the substance at different frequencies. The reflection type oximetry has some distinct advantages over the conventional transmittance type as they can be mounted in a single chip with source and detectors of the light signals [11]. With both sections mounted on a single side and separated by a minimal distance, the device needs less power, and it can be connected to more body sites. In contrast, the conventional devices have the source, and detector circuits are mounted on different integrated circuits, and they can be connected to only certain body parts such as the earlobe, toe, and finger.
The blood pressure (BP) measurement is pivotal in assessing the condition of the cardiovascular system as the abnormality in the BP is one of the primary causes of mortality in the past few decades. The intra-arterial blood pressure monitoring is performed using an invasive cannula needle inserted into an artery, but the usage of this technique is too invasive [12]. The other technique for BP measurement is the cuff-based technique, where the patient’s arm is wrapped with a cuff. The cuff, wrapping around the arm, is filled with the air using a bulb or electrical motor; the observer uses a stethoscope to listen to the Korotkoff’s sounds by using a stethoscope at different pressure points in the air. The highest and lowest pressure points that generate Korotkoff’s sounds are the systolic and diastolic values of the blood pressure [13]. Electronic cuff-based measurements have the mechanism to fill and release the air automatically. They are programmed to record the systolic and diastolic pressure values without needing a stethoscope. The limitation of these cuff-based systems is that they are not suitable for constant monitoring as the vibrations from the cuff causes discomfort to the patients, and the cuff-based electronic sphygmomanometers need few minutes between the readings. Hence, pulse transit time-based blood pressure monitoring is performed in the present work by employing asynchronous single-chip ECG and PPG sensors.
For effective implementation of telemedicine, the complete information of the patients is needed to be transmitted to the medical practitioners in a remote location. Along with the physiological parameters, the virtual presence of the patients at the practitioners gives a holistic environment for the treatment. Therefore, the data visualization of the measured parameters in remote locations and quality video conferencing is critical for envisaged telemedicine applications. Advanced hardware and software tools are utilized to develop a system for holistic telemedicine applications.
Hardware Implementation
The hardware implementation of the system is performed around the processing unit with the blocks shown in Fig. 1. The processing unit consists of an Advanced Micro Devices processor Ryzen Embedded V1202B, and an Advanced Virtual Reduced instruction set computer microcontroller, ATmega32u4 [14, 15]. The embedded microprocessor is a 64-bit system-on-chip (SoC) with a 3.2 GHz quad-thread dual-core processor and a 1000 MHz graphical processing unit with three graphical computing units. The processor supports many communication protocols; hence it can handle a bountiful of peripherals. The graphical processing unit in the SoC decodes/encodes the HD video signals at a rate of 60 frames per second with a maximum resolution of 4096 × 2160. The processor consists of an on-chip real-time circuitry connected to an external button cell for keeping the time even when the system is powered off. The microcontroller in the processing unit assists the microprocessor by collecting the samples from the sensors.
Fig. 1.

Block diagram of the designed system
The sensing unit consists of three sensors for measuring the physiological parameters; the sensor MAX30205 is employed for human body temperature measurement, the MAX30102 is utilized for SpO2 measurement, and the sensor MAX86150 for collecting the synchronous ECG and PPG signals. The temperature sensor MAX30205 is factory calibrated to measure the human body temperature in degree centigrade with maximum accuracy of ± 0.1 °C [16]. The temperature sensor has a 16-bit sigma-delta ADC that converts the analog temperature values into digital with a resolution of 0.00390625 °C [17]. The 8-pin sensor has a repeatability of 0.009 °C and measures the body temperature samples with an interval of 50 ms. The sensor is communicated with the microcontroller using the I2C protocol with a signal conditioning circuitry consisting of a CMOS voltage regulator of 3.3 V, pull-up resistors, and an N-channel MOSFET-based level shifting circuit. The address lines A0, A1, and A2 are connected to the ground for selecting the I2C address of the temperature sensor. Apart from the clock and data pins, the sensor also possesses an over-temperature shutdown pin that can be used for generating an interrupt or an alarm in case of abnormally lower or higher temperature values.
The SpO2 measurement is performed using a robust reflective type sensor MAX30102 with the blocks shown in Fig. 2 [18]. The optical section of the sensor consists of a pair of LEDs where the red LED generates the light with a length between 650 and 670 nm and the IR LED emits the light with a frequency between 870 and 900 nm; the reflected light is collected by the photodetector. The analog signal generated by the photodetector is subjected to an ambient noise cancellation circuit and fed to the 18-bit current ADC in the analog section. The analog section also possesses another ADC connected to a die temperature sensor to measure the LED temperature. The LED temperature value is stored by the data registers in the digital section. The data section also stores the signal collected from 18-bit current ADC in 32-deep FIFO. The oscillatory circuitry in the control section provides the required clock signals for the analog to digital converters. The driver circuitry provides the current to operate the LEDs that can be programmable using a microcontroller by accessing the registers. The communication section provides an interface between the microcontroller and digital section using the I2C protocol [19]. The sensor requires two different voltage levels; one is the supply voltage of 1.8 V to run the integrated circuit and a voltage of 3.3 V to power the LEDs. The CMOS voltage regulator IC 662 K is employed to supply 3.3 V and is followed by IC 65K5 for supplying 1.8 V. The NMOSFETs are utilized for level shifting the I2C signals between the controller and the MAX30102, and the pull-up resistors are used for eliminating the effects of bus capacitance.
Fig. 2.

Blocks of SpO2 sensor MAX30102
The sensor MAX86150, with the sections depicted in Fig. 3, is used for collecting synchronous and simultaneous electrocardiogram and photoplethysmogram [20]. The PPG section is identical to the sensor MAX30102, except that it does not possess an accessible on-chip temperature sensor. The ECG section of the MAX86150 shown in Fig. 4 consists of an 18-bit ADC and an analog front end (AFE). The analog front end is connected to the three electrodes through an audio jack that picks the ECG signal from the human body. The ECG signal collected by the terminals is passed through different signal conditioning sections of AFE before it gets digitized. The AFE is designed in such a way that it eliminates the noise from the RF interface, common-mode signals, and other muscular and electrical signals with internal reference circuitry. The first part of the AFE consists of a couple of high pass filters to eliminate the high-frequency noise from electrodes to get a high SNR ratio.
Fig. 3.

Blocks of NIBP sensor MAX86150
Fig. 4.

ECG section of MAX86150 sensor
Further, the signal is fed to the ac coupled instrumental amplification circuit [21] with an excellent common-mode rejection ratio [22]. The instrumental amplifier’s gain is programmable from 5 to 50. Later, the signal goes through a programmable gain amplifier [23] for further amplification that can be programmed to gain from 1 to 8 times. The filtered signals are fed to the 18-bit sigma-delta ADC, whose sampling rate and oversampling ratio can be programmed for improved signal-to-noise ratio and effective resolution. The samples of the ECG and PPG are stored in the FIFO, which is accessed through the I2C protocol. The MAX86150 also requires two different voltage levels hence a couple of CMOS voltage regulators are used, and high-speed switching NMOSFETs perform the level shifting. The data acquisition from the sensors is made using Inter-Integrated Circuit protocol. The data are collected at a maximum clock rate of 400 kHz. The I2C protocol may suffer from clock-stretching, which may slowdowns the data acquisition’s speed. The bus capacitance causes the clock-stretching. The effect of bus capacitance and thence the clock-stretching is compensated by using suitable pull-up resistors along with the signal conditioning circuitry. The data acquisitions from the multiple sensors are performed with time-division multiplexing. The signals captured by these sensors are captured in the allotted time slots and are stored in different buffers for further process. Some measures were followed during the data acquisition and signal conditioning stage to improve the system’s performance. The transmission error and packet losses may occur due to bus arbitration in the serial protocol when multiple masters try to transmit data simultaneously. The effects of bus arbitration are eliminated by using the serial bus in the single-master multi-slave mode. The serial protocol is established with a clock speed of 400kbps, and the clock stretching due to bus capacitance is eliminated by using suitable signal conditioning circuitry. The signal conditioning circuitry includes pull-up resistors that compensate for the effects of bus capacitance and consist of fast switching level shifters. Hence, the device works with low latency and high efficiency. The utilization of the acknowledgment bit for each byte of transactions makes the data transfer more reliable.
The processing unit is connected to the memory unit with 32 GB flash eMMC and an 8 GB of DDR4 SDRAM. The memory capacity can be further extended if required using the SATA and DDR4 memory module sockets. A quality camera module is interfaced to the processing unit using USB protocol to provide video conferencing between the patient and practitioner. A 7-inch HDMI display unit is interfaced to the processing unit to display the patients’ information locally and interact with the medical practitioner. A Wi-Fi module is interfaced through a USB protocol for connecting the designed system to the internet of things. The circuit diagram and the pictorial view of the designed hardware are shown in Fig. 5.
Fig. 5.


a Hardware Schematic of the designed system. b Internal view of the designed system. c External view of the designed system
Software Implementation
The software implementation is commenced with installing an open-source operation system Disco Dingo (Ubuntu 19.04), with Linux Kernel 5.0, which is perfectly suitable for the ARM processor used in the designed system. The operating system has a state-of-the-art toolchain for the programmers to script the code for the system. The software algorithm for the designed hardware is implemented with the steps depicted in Fig. 6. The controller is coded with the interfacing programs to collect the samples using the I2C protocol and perform initial processing on the samples from the sensors. The processor is programmed for further processing the data and to display the information. The temperature sensor is configured with the help of the CONFIG register in one-shot shutdown mode. The over-temperature and lower threshold temperature registers are written with the highest and lowest limits of the temperature that can be used to trigger an alarm in case of hypothermia and hyperthermia. After writing these registers, the processing unit collects the temperature data in the 16-bit (D0-D15) TEMP register of the MAX30205. The factory-calibrated sensor gives 16-bit temperature data with the resolution of 28 degrees centigrade. The value of temperature can be computed by multiplying the decimal equivalents of the 2’s complement two-byte data [24] and with resolution (28 °C) by using Eq. (1).
| 1 |
Fig. 6.

a Flowchart of the software implementation. b Temperature. c SpO2 algorithm. d NIBP algorithm
The oxygen saturation percentage of the patients is computed by programming the reflection type sensor MAX30102. The sensor is configured to work in SpO2 mode, and then the sampling rate is set to 100 samples per second. The sensor is programmed to convert the samples with 15-bit resolution by setting the pulse width of the LEDs to 69 µs. The resolution can be increased up to 18-bits by increasing the pulse width, but the power consumption of the sensor increases with the increase in the pulse width. The values of the resolution, pulse width, and sampling rate are optimized for a better tradeoff between the power consumption and the accuracy of the measurements [25]. The sensor also possesses an inbuilt die temperature sensing circuitry that measures the sensor's temperature with an accuracy of ± 1 °C and a resolution of 0.0625 degrees centigrade. The die temperature is measured once the ADC measures a buffer of reflected light samples. The sensor stores data in 32-deep FIFO. To read the data from FIFO, the controller sends a read request to the MAX30102 sensor and waits for a response. The samples of both the two Light-emitting diodes are captured in two different buffers. The temperature of the sensor is measured in regular intervals and used for the thermal compensation of the samples. As depicted in Fig. 7, the peak wavelengths (λ) of the LEDs are affected by the temperature and driving currents.
Fig. 7.
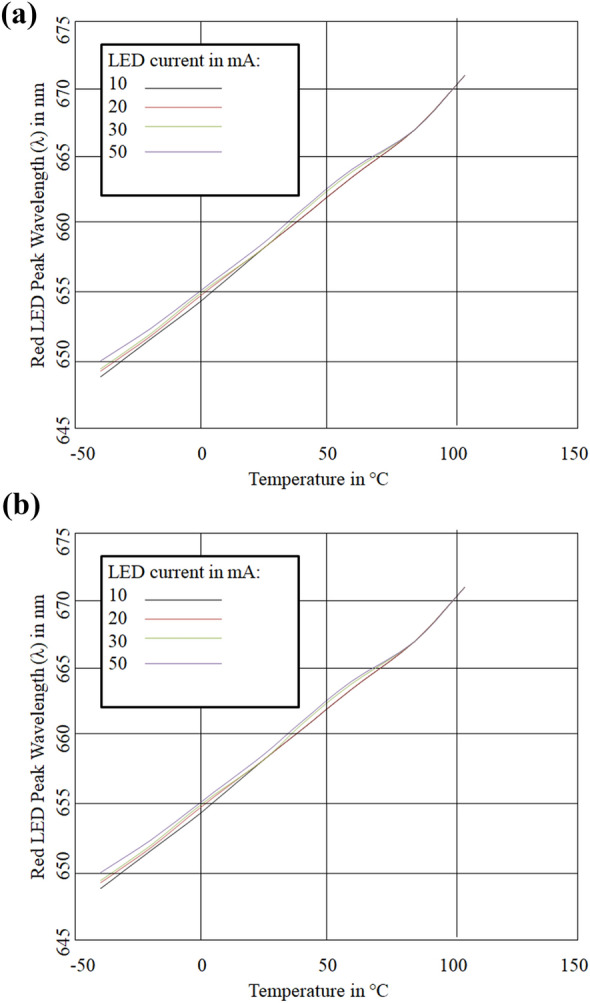
a Electro-thermal properties of IR LED. b Electro-thermal properties of Red LED
The computed values of wavelength are employed in the SpO2 algorithm to compensate the electro-thermal effects. The RMS and average values of the red and IR LED buffers are computed with Eqs. (2) and (3).
| 2 |
| 3 |
The computed average and root mean square values of the buffers are substituted in Eq. (4) for calculating the SpO2 ratio.
| 4 |
The extinction coefficients (ε) of oxygenated hemoglobin (HbO2) and non-oxygenated (Hb) hemoglobin are calculated as shown Fig. 8. The values of the ε and SpO2 ratio are substituted in Eq. (5) to calculate SpO2 value.
| 5 |
Fig. 8.
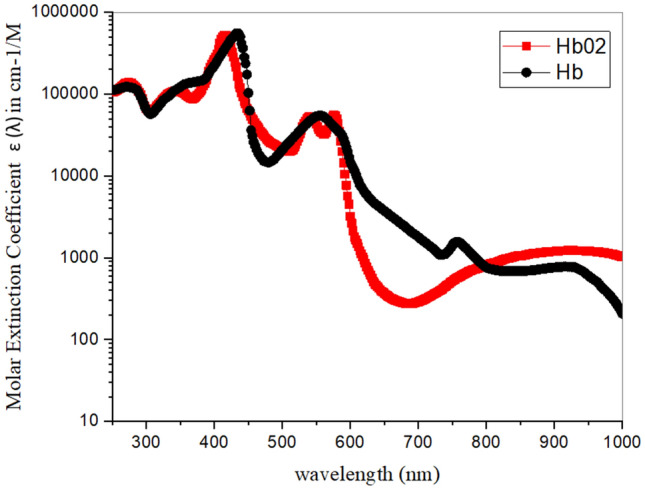
Molar Extinction coefficients of Hemoglobin
The microcontroller in the processing unit assists the microprocessor by collecting the samples from the sensors. The low-cost 16 MHz microcontroller gives a maximum throughput of 16 Million Instructions per Second. The microcontroller and microprocessor exchange the information with the USB 2.0 serial communication.
The samples of ECG and PPG are collected in separate buffers before they get processed by the processing unit. The computation of the parameters with signals commences with filtering the signals to make them noise-free. The foremost filter used in processing the two signals is the moving average filter to eliminate the baseline wandering as there is a high possibility of baseline wandering noise because of the movement, respiration of the subjects, and impedance of the electrodes [26]. The signals after baseline wandering removal are subjected to notch filtering for clearly identifying the peaks and valley points. Later, the signals are put through the peak detection algorithms to find the R peaks in ECG and peak points of PPG signals. The PPG signals are passed through the inverse peak detection algorithms to identify the valley points in the signal. Now the interval between the R peaks is calculated for measuring the interbeat interval of heart rate. The inter-beat interval (in milliseconds) is substituted in Eq. (6) to compute the heart rate in beats per minute. The measured R–R interval is also employed to measure breath rate in breaths per minute [27].
| 6 |
Similarly, the pulse rate is computed by using the interval between the two consecutive pulses of PPG. The inverse of the interval (in milliseconds) is multiplied by the number of milliseconds in a minute to compute the pulse per minute. The NIBP algorithm measures the pulse transit time (PTT) between the ECG and PPG waves. The system calculates the PTT from the R-peak of ECG to the immediate PPG valley point and is saved as the PTT-Valley, as shown in Fig. 9. It also computes the PTT from ECG R-peak to the PPG peak point and stores it as PTT-Peak. The PTT-valley and PTT-peak are calibrated to obtain the blood pressure. The values are substituted in Eqs. (7) and (8) for systolic and diastolic BP computation.
| 7 |
| 8 |
Fig. 9.
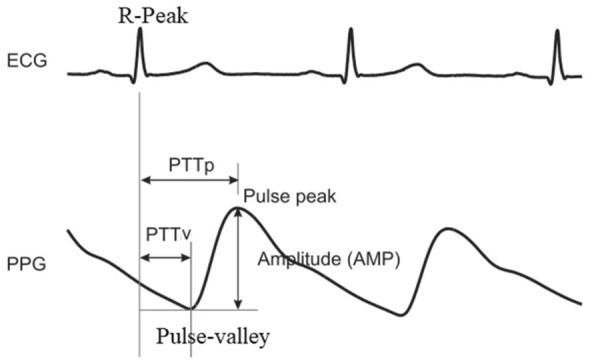
Pulse transit time between the ECG and PPG waves
The calibration constants are α, β, γ, x, y, and z are computed by comparing the obtained PTT and heart rate versus the readings of a cuff-based mercury sphygmomanometer. The computed constant values for α, β, γ, x, y, and z are 119, − 10, 0.6, 82, − 15 and 1.6, respectively.
The MySQL commands are embedded in Python programming to store and retrieve the information. The MySQL is installed in the local system; the database is also maintained online using the MySQL Cloud. The data are organized as databases consisting of tables that have information about different details such as the subject’s name, physiological parameters of the subject, and the timestamp of the data collection. The device is connected to the internet of things through a Wi-Fi module. The local gateway provides access to connect to the internet, and the local data is shared to the MySQL cloud. The remote devices can access the data in the cloud by connecting to the remote gateway with the help of login credentials such as user name and password. The MySQL database in the system can also be accessed by using an administration tool, phpMyAdmin. The phpMyAdmin offers a wide variety of database management features. The database of a subject can be visualized as a graph using this administration tool [28]. It also gives users access to the database with the help of query-by-example, by which the user can easily create complex queries. The observers need to quickly assess the subject’s condition; the signals need to be clear, and the information must be easily understandable. The system is programmed with PHP embedded with d3.js to design a web page visualizing the ECG and PPG signals. The webpage displays the values of temperature, NIBP, breath rate, heart rate, interbeat interval, and SpO2, along with ECG and PPG signals fetched from the database through the Apache webserver. The signals and the numerical values update dynamically as soon as the new samples arrived. The webpage can be accessed through a web browser such as Firefox, Internet Explorer, Edge Chromium, and Google Chrome. The IoT-enabled devices, with different operating systems such as Linux, Android, and macOS, with a web browser, can access the information without needing to install any extra software. The system also has a digital camera to provide access to virtual interfacing of the subject and the practitioners. For this, different video calling platforms such as Zoom, Meet, and Skype can be accessed in a split-screen mode that enables video conferencing and physiological parameters displaying a web page, as shown in Fig. 10.
Fig. 10.

Screen shot visualizing the physiological parameters with multimedia conference
Results and Discussion
The designed system monitors the parameters temperature, pulse rate, SpO2, heart rate, systolic and diastolic blood pressures. The system also visualizes the ECG and PPG signals. The system provides access to the video graphics information of the patients from a remote location for teleconferencing. The developed system is carried to GITAM Institute of Medical Science and Research hospital, Visakhapatnam, for comparing the records with the records of the standard systems as shown in Fig. 11. The records are captured in four different wards of the hospital, namely, outpatient ward, general ward, Intensive Care Unit, and Operation Theatre. The outpatient and general wards are well ventilated, and the ICU and OT are air-conditioned. The parameters of a population of 80 adult patients with an average age of 37 ± 12 (standard deviation (SD)) years are measured using the designed and standard systems in the hospital. The designed system is used to measure the data of the outpatient ward patients for collecting one sample set of data from each person shown in Table 1. In other wards of the hospital, the system collects the parameters for half an hour from each patient. The average values of the parameters recorded for each patient are plotted in Fig. 12.
Fig. 11.

Experimental setup in hospital environment
Table 1.
Physiological parameters at outpatient ward
| Patient No. | Temperature (in °C) | Pulse rate (in PPM) | SpO2 (in %) | Heart rate (in BPM) | Respiration rate (in RPM) | SBP (in mmHg) | DBP (in mmHg) | |||||||
|---|---|---|---|---|---|---|---|---|---|---|---|---|---|---|
| Measured | Standard | Measured | Standard | Measured | Standard | Measured | Standard | Measured | Standard | Measured | Standard | Measured | Standard | |
| P1 | 34.31 | 34.39 | 72 | 75 | 99.36 | 99.15 | 72 | 73 | 12 | 14 | 117 | 119 | 77 | 79 |
| P2 | 35.32 | 35.24 | 80 | 81 | 96.23 | 96.21 | 82 | 85 | 15 | 16 | 118 | 121 | 79 | 81 |
| P3 | 34.62 | 34.66 | 73 | 71 | 97.31 | 98.12 | 74 | 72 | 18 | 17 | 124 | 127 | 80 | 78 |
| P4 | 34.82 | 34.89 | 77 | 75 | 99.88 | 97.66 | 76 | 75 | 21 | 22 | 119 | 115 | 75 | 77 |
| P5 | 35.33 | 35.37 | 83 | 85 | 98.38 | 99.24 | 84 | 87 | 19 | 17 | 121 | 124 | 73 | 75 |
| P6 | 34.92 | 35.01 | 86 | 84 | 93.36 | 94.26 | 84 | 87 | 20 | 22 | 120 | 124 | 73 | 70 |
| P7 | 34.89 | 34.91 | 73 | 75 | 99.99 | 98.36 | 70 | 70 | 14 | 16 | 118 | 117 | 78 | 80 |
| P8 | 35.24 | 35.19 | 77 | 74 | 97.36 | 98.15 | 79 | 80 | 11 | 12 | 125 | 123 | 81 | 83 |
| P9 | 36.23 | 36.18 | 69 | 72 | 96.36 | 95.36 | 67 | 65 | 16 | 18 | 115 | 116 | 80 | 78 |
| P10 | 33.19 | 33.28 | 81 | 83 | 95.99 | 94.86 | 80 | 83 | 17 | 16 | 118 | 120 | 78 | 75 |
| P11 | 35.86 | 35.92 | 66 | 69 | 99.36 | 98.26 | 66 | 63 | 18 | 16 | 120 | 122 | 80 | 78 |
| P12 | 35.68 | 35.73 | 70 | 73 | 99.32 | 99.11 | 70 | 67 | 14 | 13 | 122 | 119 | 76 | 74 |
| P13 | 36.11 | 36.18 | 90 | 87 | 94.61 | 94.91 | 91 | 90 | 12 | 12 | 121 | 119 | 77 | 78 |
| P14 | 35.32 | 35.33 | 68 | 66 | 98.63 | 99.31 | 66 | 65 | 14 | 13 | 123 | 120 | 80 | 81 |
| P15 | 36.15 | 36.24 | 93 | 90 | 99.36 | 98.92 | 95 | 96 | 15 | 17 | 123 | 121 | 82 | 83 |
| P16 | 35.19 | 35.18 | 88 | 85 | 99.37 | 99.82 | 86 | 87 | 13 | 13 | 121 | 120 | 81 | 79 |
| P17 | 35.11 | 35.21 | 99 | 96 | 97.46 | 97.16 | 99 | 96 | 15 | 14 | 122 | 117 | 78 | 80 |
| P18 | 36.37 | 36.46 | 80 | 83 | 99.99 | 98.89 | 77 | 80 | 12 | 13 | 118 | 120 | 77 | 81 |
| P19 | 36.82 | 36.73 | 61 | 64 | 93.16 | 93.94 | 62 | 59 | 18 | 18 | 120 | 123 | 80 | 75 |
| P20 | 35.89 | 35.92 | 93 | 90 | 94.86 | 94.36 | 95 | 92 | 16 | 17 | 126 | 121 | 79 | 76 |
| P21 | 36.34 | 36.26 | 87 | 90 | 98.68 | 98.94 | 84 | 81 | 17 | 19 | 120 | 121 | 78 | 77 |
| P22 | 35.95 | 36.04 | 91 | 88 | 96.36 | 97.01 | 92 | 95 | 14 | 14 | 119 | 122 | 77 | 78 |
| P23 | 36.12 | 36.18 | 73 | 71 | 99.68 | 99.94 | 71 | 72 | 16 | 18 | 121 | 123 | 81 | 85 |
| P24 | 35.16 | 35.19 | 66 | 68 | 96.64 | 97.36 | 64 | 63 | 14 | 16 | 121 | 124 | 82 | 83 |
Fig. 12.

Error bars of the physiological parameters at different wards of hospital
The portable system is taken to the outpatient ward of the GIMSR to measure the patients' parameters. In the outpatient ward, the records of 24 people are collected with the designed system and the systems in the hospital. A mercury thermometer and IR thermometers for temperature measurement, a commercial pulse oximeter for SpO2 measurement, a stethoscope for heartbeat measurement, and a mercury sphygmomanometer for blood pressure measurement are employed as the standard instruments in the outpatient ward. The pulse rate is measured by gently placing the fingers on the wrist and the breath rate by counting the breaths in 60 s with the help of the hospital staff. The temperature of the patients in the outpatient ward is recorded at an average of 35.45 °C (SD of 0.8 °C). The patient's pulse rate is recorded at an average of 79 PPM (pulse per minute) with a standard deviation of 10.21 PPM. Pulse oximetry of the patients is recorded at an average SpO2 of 97.57% with an SD of 2%. The heart rate is identical to the pulse rate and is recorded at an average of 78.58 BPM (Beats per minute) with an SD of 10.76 BPM. The breath rate of the patients is measured at around 15.4 RPM (respirations per minute) with an SD of 2.7 RPM. The system recorded the patients' systolic blood pressure at an average of 120.5 mmHg with an SD of 2.5 mmHg. The diastolic blood pressure measured in the outpatient averages 78.41 mmHg with a standard deviation of 2.5 mmHg.
The system is carried to the general ward, where the patients are admitted for treatment. In the general ward, the designed system’s values are compared against the standard system uMEC10 from Mindray Medical International Limited [29]. The standard and designed systems are simultaneously connected to the patients for monitoring the physiological parameters. The values are obtained from 24 different patients in the general ward and the average of the parameters over the 30 min is tabulated in Table 2. The temperature values of the patients in the general ward are measured at an average of 34.43 °C with an accuracy of ± 0.1 °C. The pulse rate and the patient's heart rate are recorded at an average of 77.5PPM and 77.5BPM, respectively, with an accuracy of ± 2 beats/pulses per minute. The system measured the respiration rate of the patients with an average of 15.4RPM with an average error of ± 3 RPM. The saturation percentage of oxygen is measured at an average of 98.87. The blood pressure is measured at an average of 121.5 mmHg SBP and 79.8 mmHg DBP with average errors of ± 3 mmHg and ± 3 mmHg. The room temperature of the general ward is around 30 °C when the parameters are collected.
Table 2.
Physiological parameters at general ward
| Patient No | Temperature (in °C) | Pulse rate (in PPM) | SpO2 (in %) | Heart rate (in BPM) | Respiration rate (in RPM) | SBP (in mmHg) | DBP (in mmHg) | |||||||
|---|---|---|---|---|---|---|---|---|---|---|---|---|---|---|
| Measured | Standard | Measured | Standard | Measured | Standard | Measured | Standard | Measured | Standard | Measured | Standard | Measured | Standard | |
| P25 | 34.22 | 34.15 | 65.60 | 64.10 | 98.23 | 98.21 | 65.13 | 65.20 | 12.27 | 12.63 | 120.17 | 119.50 | 78.20 | 77.67 |
| P26 | 34.21 | 34.20 | 70.90 | 70.50 | 98.12 | 98.13 | 70.67 | 70.43 | 13.53 | 14.60 | 123.13 | 122.17 | 81.30 | 80.50 |
| P27 | 34.21 | 34.20 | 71.10 | 70.87 | 98.15 | 98.12 | 70.37 | 70.70 | 14.67 | 14.20 | 123.43 | 122.17 | 81.37 | 80.33 |
| P28 | 33.95 | 33.54 | 78.4 | 79 | 98.44 | 98.46 | 75.2 | 75.8 | 14.2 | 13.4 | 122.4 | 120 | 82.6 | 79 |
| P29 | 34.30 | 34.23 | 77.53 | 77.67 | 99.01 | 98.86 | 77.43 | 77.40 | 12.30 | 12.60 | 123.27 | 122.00 | 80.47 | 81.17 |
| P30 | 34.99 | 34.87 | 77.17 | 77.07 | 98.91 | 98.99 | 76.83 | 77.30 | 15.87 | 16.33 | 123.37 | 122.33 | 81.03 | 80.50 |
| P31 | 34.27 | 34.20 | 81.23 | 81.10 | 99.08 | 98.93 | 81.57 | 81.90 | 16.03 | 15.97 | 123.47 | 123.00 | 81.03 | 81.50 |
| P32 | 34.28 | 34.20 | 81.47 | 80.80 | 99.09 | 99.04 | 81.00 | 80.50 | 15.73 | 15.27 | 121.10 | 122.03 | 81.27 | 81.50 |
| P33 | 34.27 | 34.20 | 79.80 | 79.73 | 99.06 | 98.86 | 80.73 | 80.43 | 16.03 | 16.23 | 121.00 | 122.33 | 80.90 | 81.00 |
| P34 | 34.38 | 34.28 | 78.67 | 78.90 | 98.93 | 98.87 | 78.50 | 78.43 | 16.17 | 15.70 | 121.20 | 122.50 | 80.70 | 79.83 |
| P35 | 34.38 | 34.30 | 78.67 | 79.07 | 98.87 | 99.06 | 79.60 | 79.93 | 16.80 | 17.03 | 121.07 | 122.50 | 80.97 | 81.67 |
| P36 | 34.38 | 34.29 | 78.97 | 79.00 | 99.00 | 99.06 | 78.73 | 78.63 | 15.57 | 15.57 | 120.80 | 122.67 | 81.17 | 81.33 |
| P37 | 34.43 | 34.38 | 74.60 | 75.33 | 99.00 | 99.04 | 74.53 | 74.97 | 15.50 | 15.03 | 120.70 | 122.33 | 81.00 | 81.50 |
| P38 | 34.33 | 34.23 | 74.33 | 75.00 | 99.01 | 99.02 | 74.43 | 74.20 | 16.37 | 16.40 | 121.27 | 122.33 | 81.20 | 79.83 |
| P39 | 34.48 | 34.41 | 76.37 | 76.27 | 99.11 | 98.98 | 76.33 | 77.13 | 15.20 | 14.97 | 121.03 | 122.50 | 80.87 | 81.00 |
| P40 | 34.50 | 34.42 | 77.20 | 77.20 | 99.06 | 99.07 | 76.73 | 76.47 | 15.63 | 16.13 | 120.83 | 122.00 | 80.77 | 80.50 |
| P41 | 34.57 | 34.48 | 77.67 | 77.83 | 98.95 | 98.90 | 77.83 | 77.83 | 15.77 | 16.17 | 121.00 | 122.83 | 80.83 | 80.00 |
| P42 | 34.52 | 34.46 | 86.07 | 85.00 | 98.93 | 99.03 | 86.43 | 86.43 | 15.50 | 15.13 | 120.97 | 122.67 | 81.10 | 82.50 |
| P43 | 34.53 | 34.47 | 84.83 | 85.23 | 98.96 | 98.87 | 84.97 | 84.77 | 16.03 | 16.43 | 121.03 | 122.67 | 81.07 | 82.17 |
| P44 | 34.53 | 34.47 | 85.13 | 84.80 | 99.06 | 98.93 | 85.27 | 85.83 | 16.13 | 16.40 | 120.97 | 122.33 | 80.83 | 80.50 |
| P45 | 34.51 | 34.47 | 83.77 | 83.50 | 98.87 | 99.06 | 84.03 | 83.87 | 16.20 | 16.13 | 121.17 | 122.50 | 80.90 | 83.33 |
| P46 | 34.57 | 34.49 | 73.13 | 73.13 | 99.05 | 99.10 | 73.73 | 73.73 | 16.57 | 16.20 | 121.13 | 122.33 | 81.00 | 79.50 |
| P47 | 34.56 | 34.51 | 73.67 | 73.63 | 99.01 | 99.00 | 74.00 | 73.87 | 16.60 | 16.23 | 120.87 | 123.00 | 80.97 | 80.83 |
| P48 | 34.57 | 34.50 | 74.20 | 74.37 | 99.07 | 99.16 | 74.27 | 74.33 | 15.63 | 15.90 | 120.93 | 122.00 | 81.07 | 80.17 |
The system is ported to the intensive care unit to measure the parameters of the patients against a standard instrument from the Mindray patient monitoring system uMEC12. The measurements are taken from 20 patients in the ICU. The measurement of the physiological parameters is performed with the systems simultaneously, and the records are captured for 30 min for each patient and the average values over the period are tabulated in Table 3. The temperature measurement values are recorded at an average of 32.16 (± 0.1 °C accuracy). The pulse rate is measured at an average of 81(± 3 accuracy) pulses per minute. The saturation of the percentage of oxygen in the patients' blood is measured at an average of 98.9(± 3 accuracy) %. The system recorded the heart rate of the patients at an average of 78BPM. The respiration rate is measured at an average of 16(± 3 accuracy) breaths per minute. The blood pressure is measured with an average of 124(± 5 accuracy) mmHg of SBP and 82(± 5 accuracy) mmHg of DBP.
Table 3.
Physiological parameters at ICU
| Patient No | Temperature (in °C) | Pulse rate (in PPM) | SpO2 (in %) | Heart rate (in BPM) | Respiration rate (in RPM) | SBP (in mmHg) | DBP (in mmHg) | |||||||
|---|---|---|---|---|---|---|---|---|---|---|---|---|---|---|
| Measured | Standard | Measured | Standard | Measured | Standard | Measured | Standard | Measured | Standard | Measured | Standard | Measured | Standard | |
| P49 | 32.57 | 32.50 | 71.90 | 71.03 | 98.97 | 99.03 | 71.73 | 72.10 | 16.20 | 16.20 | 125.03 | 124.17 | 82.17 | 80.67 |
| P50 | 32.57 | 32.50 | 71.07 | 71.00 | 99.00 | 99.01 | 71.40 | 71.27 | 16.20 | 15.67 | 124.87 | 125.67 | 82.23 | 81.00 |
| P51 | 32.54 | 32.49 | 73.57 | 73.90 | 99.09 | 99.00 | 73.70 | 73.90 | 16.07 | 16.60 | 125.20 | 124.33 | 82.03 | 81.67 |
| P52 | 32.55 | 32.49 | 80.17 | 79.87 | 98.89 | 98.87 | 76.6 | 77 | 16.50 | 16.53 | 125.13 | 123.83 | 81.90 | 82.00 |
| P53 | 32.58 | 32.54 | 80.03 | 79.20 | 98.88 | 98.96 | 79.50 | 80.10 | 16.33 | 16.73 | 124.90 | 124.50 | 81.97 | 81.83 |
| P54 | 32.60 | 32.53 | 80.60 | 80.80 | 99.12 | 98.97 | 80.03 | 80.03 | 16.47 | 16.53 | 124.77 | 125.33 | 81.80 | 82.67 |
| P55 | 32.58 | 32.53 | 80.03 | 79.87 | 99.23 | 98.87 | 78.27 | 79.33 | 17.67 | 17.13 | 125.03 | 125.17 | 81.87 | 81.00 |
| P56 | 32.55 | 32.50 | 80.97 | 81.37 | 99.00 | 98.88 | 80.67 | 80.53 | 14.97 | 14.77 | 124.90 | 124.17 | 82.03 | 81.17 |
| P57 | 31.94 | 31.85 | 78.97 | 79.87 | 98.98 | 98.87 | 80.03 | 79.83 | 15.80 | 16.23 | 124.87 | 125.33 | 82.03 | 81.33 |
| P58 | 31.95 | 31.85 | 83.80 | 82.93 | 98.32 | 98.26 | 83.80 | 83.83 | 16.00 | 16.23 | 124.90 | 121.67 | 82.07 | 79.83 |
| P59 | 32.24 | 32.17 | 83.13 | 83.20 | 98.84 | 98.91 | 82.23 | 81.30 | 16.77 | 15.70 | 124.77 | 123.83 | 82.27 | 80.17 |
| P60 | 32.25 | 32.15 | 83.80 | 84.40 | 99.08 | 98.93 | 83.73 | 84.27 | 17.03 | 15.13 | 124.83 | 125.00 | 82.40 | 80.00 |
| P61 | 31.47 | 31.36 | 82.93 | 83.33 | 98.88 | 99.20 | 82.97 | 82.90 | 16.97 | 16.87 | 125.17 | 125.17 | 82.13 | 80.67 |
| P62 | 31.68 | 31.64 | 86.50 | 86.73 | 99.05 | 98.84 | 87.20 | 86.40 | 15.63 | 15.57 | 125.33 | 123.67 | 82.30 | 83.17 |
| P63 | 31.44 | 31.34 | 87.03 | 86.83 | 99.19 | 98.96 | 87.53 | 86.80 | 16.03 | 16.03 | 124.53 | 124.67 | 82.13 | 83.17 |
| P64 | 32.47 | 32.38 | 79.20 | 79.73 | 99.14 | 98.91 | 78.27 | 79.33 | 15.73 | 15.60 | 124.63 | 122.50 | 82.13 | 81.67 |
| P65 | 32.06 | 32.00 | 83.67 | 83.43 | 98.23 | 98.21 | 83.90 | 84.03 | 15.87 | 16.17 | 124.77 | 125.00 | 82.00 | 80.00 |
| P66 | 32.55 | 32.49 | 80.17 | 79.87 | 98.89 | 98.87 | 80.07 | 79.60 | 15.50 | 15.57 | 125.03 | 122.67 | 81.83 | 82.00 |
| P67 | 31.06 | 31.01 | 86.30 | 85.90 | 98.94 | 99.12 | 86.23 | 85.63 | 15.53 | 15.33 | 124.90 | 123.33 | 82.13 | 80.50 |
| P68 | 31.69 | 31.60 | 86.60 | 86.53 | 98.98 | 98.87 | 86.40 | 86.40 | 14.87 | 14.93 | 125.00 | 124.50 | 81.83 | 80.83 |
The system is further utilized for the measurement of parameters in the operation theater. The values of the system are compared against the standard instrument of patient monitoring system Goldway-G40 of Philips [30] in the operation theatre. The measurement procedure is commenced immediately after the anesthesia is given to the patients. The readings are obtained from twelve patients in the operation theater. The system is connected to each patient for thirty minutes and average the values are tabulated in Table 4. The temperature recorded from the patients in OT has averaged 31.28(± 0.1 accuracy) °C, and the patients' pulse rate is measured at an average of 88(± 3 accuracy) PPM. The recoded values of SpO2 are computed at an average of 97.8(± 3 accuracy) %. The average heart rate is measured as 88(± 3 accuracy) BPM. The breath rate of the patients has averaged 16(± 3 accuracy) respirations per minute. The average BP measurements of the patients are measured at an average of 118(± 5 accuracy) mmHg of SBP and 82.7(± 5 accuracy) mmHg of DBP. The need for telemedicine is inevitable with the inadequate facilities in medicine and during the pandemics like COVID-19. The developed system is aimed at providing a holistic environment for telemedicine applications with multiple peripherals. The measurements are taken at different environments of a hospital having different ambient temperatures. The obtained results agree with the standard systems utilized in the hospital for measuring different physiological parameters. The averages of the parameters with error bars at four wards are plotted in Fig. 13.
Table 4.
Physiological parameters at OT
| Patient No | Temperature (in °C) | Pulse rate (in PPM) | SpO2 (in %) | Heart rate (in BPM) | Respiration rate (in RPM) | SBP (in mmHg) | DBP (in mmHg) | |||||||
|---|---|---|---|---|---|---|---|---|---|---|---|---|---|---|
| Measured | Standard | Measured | Standard | Measured | Standard | Measured | Standard | Measured | Standard | Measured | Standard | Measured | Standard | |
| P69 | 31.47 | 31.39 | 89.40 | 89.40 | 97.70 | 97.52 | 89.30 | 89.47 | 16.57 | 16.47 | 126.03 | 125.83 | 82.70 | 81.33 |
| P70 | 31.46 | 31.39 | 88.63 | 88.57 | 98.10 | 98.00 | 88.53 | 88.43 | 15.87 | 16.10 | 125.67 | 124.00 | 82.83 | 82.50 |
| P71 | 31.45 | 31.39 | 94.43 | 93.90 | 97.95 | 98.01 | 94.30 | 94.30 | 15.97 | 15.83 | 125.77 | 125.50 | 82.63 | 82.33 |
| P72 | 30.97 | 30.91 | 91.77 | 91.07 | 98.07 | 97.99 | 91.93 | 92.03 | 15.90 | 15.87 | 125.83 | 126.33 | 82.60 | 81.67 |
| P73 | 30.96 | 30.91 | 87.57 | 87.83 | 97.56 | 97.50 | 86.80 | 86.60 | 16.30 | 15.53 | 125.53 | 127.00 | 82.70 | 84.00 |
| P74 | 31.26 | 31.20 | 85.97 | 85.93 | 98.07 | 97.96 | 85.87 | 85.93 | 15.97 | 16.47 | 125.67 | 124.00 | 82.87 | 81.33 |
| P75 | 31.27 | 31.20 | 86.50 | 86.33 | 98.09 | 98.02 | 86.13 | 85.87 | 16.53 | 16.70 | 125.87 | 124.50 | 82.73 | 82.83 |
| P76 | 31.55 | 31.50 | 86.43 | 86.33 | 97.54 | 97.74 | 86.67 | 86.07 | 16.13 | 15.80 | 125.77 | 124.00 | 82.83 | 80.33 |
| P77 | 30.96 | 30.91 | 87.57 | 87.83 | 97.56 | 97.50 | 86.80 | 86.60 | 16.30 | 15.53 | 125.53 | 127.00 | 82.70 | 84.00 |
| P78 | 31.26 | 31.20 | 85.97 | 85.93 | 98.07 | 97.96 | 85.87 | 85.93 | 15.97 | 16.47 | 125.67 | 124.00 | 82.87 | 81.33 |
| P79 | 31.27 | 31.20 | 86.50 | 86.33 | 98.09 | 98.02 | 86.13 | 85.87 | 16.53 | 16.70 | 125.87 | 124.50 | 82.73 | 82.83 |
| P80 | 31.55 | 31.50 | 86.43 | 86.33 | 97.54 | 97.74 | 86.67 | 86.07 | 16.13 | 15.80 | 125.77 | 124.00 | 82.83 | 80.33 |
Fig. 13.

Error bars of the physiological parameters at different wards of hospital
The temperature is measured at the arm as the patient feels comfortable measuring for long periods. Hence the temperature readings are recorded in the low-thirties [31]. The temperature in the outpatient ward is higher as the ward tends to have more people. It is a bit warmer even though it is well ventilated. The room temperature slightly impacts the human body temperature readings, and therefore the average temperature of the patients in the outpatients' ward is high. The general ward is also relatively warmer, and hence the average temperature of the patients is on the higher side. The higher temperatures of the human body might have been caused by hyperthermia due to illness. The ICU and OT are air-conditioned for having temperatures around 20 °C that may account for lower body temperatures [32]. Hence the average temperature values of these patients in these two wards are lower than the other two wards.
The saturation percentage of oxygen is computed with the designed system at various locations. The typical values of this parameter are close to 100% and the values lower than 90 percent are considered mild hypoxia [33]. The COVID-19 pandemic causes silent hypoxia, affecting without any symptoms; hence, it is advised for people to constantly monitor oxygen saturation. The system measures the SpO2 in outpatient, general wards, and intensive care units relatively stable. However, the values at operation theatre are reduced concerning time. The saturation percentage of oxygen in the patients after anesthesia is recorded generally in the first 10 min, and later the values started decreasing [34]. Hence, it is essential to measure oxygen saturation in humans after anesthesia to take necessary actions before the patient gets affected by hypoxia. The practitioners take necessary actions when the oxygen saturation levels are decreased to regularize in the patient’s SpO2 values.
Heart rate is the sign of the cardiovascular system that indicates the number of times the heart beats per one minute. The heart rate in the designed system is measured by counting the number of R-peaks in the electrocardiogram. The heart rate is measured for tracking the possible tachycardia and bradycardia. The heart rate in adults usually is about 60–100 beats per minute [35], and the records in the system under normal circumstances in the hospital except the operation theater. The heart rate in the Operation Theater patients has changed somewhat abnormally due to some of the patients get excited with the Operation Theater environment and anesthesia [36]. The pulse rate is almost identical to the heart rate, as the heartbeats are the cause for generating a pulse. The pulse rate in the designed system is measured by computing the number of peaks in a minute in a photoplethysmograph. The inter-beat interval is also measured and displayed in the system that can be utilized for computing and analyzing the heart rate variability.
The respiration rate in adults (people older than twelve years) is generally between 12 and 20. The respiration rate is vital in the cardiovascular system to supply oxygen to the body. A breath rate of more than 20 is an indication of an abnormality in the cardiovascular system. In the designed system, the breath rate of the system is computed from the ECG signal. The values measured by the system in the hospital are mostly in the typical range of 12–20 [37]. In the operation theater, a few patients who had a high breath rate for a brief amount of time may be due to anxiety.
The BP measurement is vital in analyzing the cardiovascular system. The blood pressure is measured from photoplethysmography and electrocardiography. The typical values of the blood pressure are 120 mmHg of systolic pressure and 80 mmHg of diastolic pressure [38]. The blood pressure of the patients is dependent on the ambient temperature. The ambient temperatures of the general and outpatient wards are relatively high; hence the blood pressure values are recorded at lower levels. The higher systolic blood pressure levels are observed in the intensive care unit and Operation Theater as they are air-conditioned [39]. The values in the operation theatre recorded values of the blood pressure may also get affected by anesthesia given to the patient. The medical experts take necessary action if the blood pressure changes abnormally during the anesthesia; hence the BP monitoring system is mandatory in the Operation Theater. The average values of the designed system in the four wards of the hospital are plotted with the error bars compared to the standard systems in Fig. 10. The error in temperature sensor readings is ± 0.1 °C. The average values of the human body temperature are averaged at all the wards is 33.35 °C. The pulse and heart rate errors concerning the standard system are about ± 3BPM/PPM, and the average heart rate recorded at all wards is 81BPM. The SpO2 values are recorded at around 98%, an error of about ± 3%. The Blood pressure is recorded around 123 mmHg SBP and 81 mmHg DBP with an accuracy of ± 5 mmHg.
Conclusions
An integrated system is developed with the advanced processing unit in this study, having a processor and a controller, handling multiple smart sensors. The high accurate sensors integrated with the system can be very easily plugged into the system. The electrocardiogram and photoplethysmograph signals are dynamically updated in the system. These signals are processed every few seconds to compute the data of the cardiovascular system, such as temperature, breathing rate, heart rate, pulse rate, saturation percentage of oxygen, and cuff-less blood pressure. The computed data is dynamically updated on the webpage that can be accessed from a remote location. The information can be visualized from various locations, such as the systems at the patient end, the mobile of a practitioner, and in a computer connected to IoT for telemedicine applications.
The performance of the portable system is validated against the standard instruments in GIMSR hospital under the supervision of medical experts. The accuracy of the system is good when compared with the ISO standard systems for the measurement of multiple physiological parameters. The standard uncertainty of the reference instruments is ± 0.1 °C for temperature, ± 3 mmHg for blood pressure, ± 1 BPM/PPM for heart rate/ pulse rate, and ± 2% for the SpO2. The proposed system has the uncertainty values of ± 0.1 °C, ± 5 mmHg, ± 3 BPM/PPM, and ± 3% for temperature, blood pressure, heart rate/pulse rate, and SpO2 values, respectively. The designed system works with a power consumption of 60 watts, about 50% of the standard system’s power consumption (120 watts).
As an extension of the work, the system can be equipped with more sensors. The system can be designed as a holistic medical kiosk by incorporating the mechanism for payments to the doctors and placed in every corner of the world to access the medical facilities. The big data generated from more such systems placed in different areas can be utilized for adequate medical care by implementing machine learning algorithms. Artificial intelligence can be added to the system for analyzing the parameters in a more detailed manner to recognize the possible illness for quality health care.
Acknowledgements
We convey our sincere gratitude to GIMSR (GITAM Institute of Medical Science and Research) for support during the validation of the system. We are thankful to the University Grants Commission (UGC), India, as one of the authors received fellowship under the scheme of UGC-NET-SRF.
Footnotes
Publisher's Note
Springer Nature remains neutral with regard to jurisdictional claims in published maps and institutional affiliations.
References
- [1].Cassar MR, Denise B, Lianne C, Aaron S, Eloise AA, Kenneth B, Claire C, Michelle G. A novel use of telemedicine during the COVID-19 pandemic. International Journal of Infectious Diseases. 2021;103:182–187. doi: 10.1016/j.ijid.2020.11.170. [DOI] [PMC free article] [PubMed] [Google Scholar]
- [2].Liu YM, Katie M, Andrew V, Taylan B, Jeffrey CS, Jaye H, John TS, Shawn PF, Jeremy G. Urban telemedicine: The applicability of teleburns in the rehabilitative phase. Journal of Burn Care & Research. 2017;38(1):e235–e239. doi: 10.1097/BCR.0000000000000360. [DOI] [PMC free article] [PubMed] [Google Scholar]
- [3].Hammel HT, Jackson DC, Stolwijk JAJ, Hardy JD, Stromme SB. Temperature regulation by hypothalamic proportional control with an adjustable set point. Journal of Applied Physiology. 1963;18(6):1146–1154. doi: 10.1152/jappl.1963.18.6.1146. [DOI] [PubMed] [Google Scholar]
- [4].Blumenthal, I., (1992). Should we ban the mercury thermometer? Discussion paper, Journal of the Royal Society of Medicine, 85, pp. 553–555. PMID: 1433125, PMCID: PMC1293645. [DOI] [PMC free article] [PubMed]
- [5].Paes BF, Vermeulen K, Brohet RM, et al. Accuracy of tympanic and infrared skin thermometers in children. Archives of Disease in Childhood. 2010;95:974–978. doi: 10.1136/adc.2010.185801. [DOI] [PubMed] [Google Scholar]
- [6].Lay-Ekuakille A, Vergallo P, Trabacca A, De Rinaldis M, Angelillo F, Conversano F, Casciaro S. Low-frequency detection in ECG signals and joint EEG-Ergospirometric measurements for precautionary diagnosis. Measurement. 2013;46(1):97–107. doi: 10.1016/j.measurement.2012.05.024. [DOI] [Google Scholar]
- [7].Jin BE, Wulff H, Widdicombe JH, Zheng J, Bers DM, Puglisi JL. A simple device to illustrate the Einthoven triangle. Advances in Physiology Education. 2012;36(4):319–324. doi: 10.1152/advan.00029.2012. [DOI] [PMC free article] [PubMed] [Google Scholar]
- [8].Wan, J., Zou, Y., Li, Y., Wang, J., (2017). Reflective type blood oxygen saturation detection system based on MAX30100. International Conference on Security, Pattern Analysis, and Cybernetics (SPAC), pp. 615–619. 10.1109/SPAC.2017.8304350.
- [9].Wilkerson RG, Adler JD, Shah NG, Brown R. Silent hypoxia: A harbinger of clinical deterioration in patients with COVID-19. The American Journal of Emergency Medicine. 2020;38(10):2243.e5–2243.e6. doi: 10.1016/j.ajem.2020.05.044. [DOI] [PMC free article] [PubMed] [Google Scholar]
- [10].Tyagi I, Mahfooz Y, Kashif M, et al. (2021) COVID-19: Journey so far and deep insight using Crowdsourced data in India. MAPAN-J. Metrol. Soc India. 2021;36:33–46. doi: 10.1007/s12647-020-00416-y. [DOI] [Google Scholar]
- [11].Mehrabi M, Setayeshi S, Ghannadi Maragheh M, Ardehali SH, Arabalibeik H. Design of a new reflectance pulse oximeter by obtaining the optimal source-detector space. Optik. 2018;168:34–45. doi: 10.1016/j.ijleo.2018.04.039. [DOI] [Google Scholar]
- [12].Dameshek, W. and Loman, J., (1932). Direct intra-arterial blood-pressure readings in man. American Journal of Physiology. pp. 140–148. 10.1152/ajplegacy.1932.101.1.140
- [13].Fahd G, Ait Mokhtar O, Boiron O, Morgado I, Paganelli F, Otal P, Deplano V. Design of a secondary standard for measuring arterial blood pressure. Measurement. 2012;45(10):2490–2493. doi: 10.1016/j.measurement.2011.10.033. [DOI] [Google Scholar]
- [14].Bruhn FC, Tsog N, Kunkel F, Flordal O, Troxel I. Enabling radiation tolerant heterogeneous GPU-based onboard data processing in space. CEAS Space Journal. 2020;12:551–564. doi: 10.1007/s12567-020-00321-9. [DOI] [Google Scholar]
- [15].Areed MF. A keyless entry system based on Arduino board with Wi-Fi technology. Measurement. 2019;139:34–39. doi: 10.1016/j.measurement.2019.02.028. [DOI] [Google Scholar]
- [16].Wang Q. A design and research of sports smart wearable devices. International Conference on Artificial Intelligence and Electromechanical Automation. 2020 doi: 10.1109/AIEA51086.2020.00026. [DOI] [Google Scholar]
- [17].MAXIM integrated, https://datasheets.maximintegrated.com/en/ds/MAX30205.pdf (last accessed on 28.06.2021)
- [18].MAXIM integrated, https://datasheets.maximintegrated.com/en/ds/MAX30102.pdf (last accessed on 28.06.2021)
- [19].Kumar R, Dubey PK, Zafer A, et al. Development of remote wireless environmental conditions measurement, monitoring and recording device for metrological and other scientific applications. MAPAN-J. Metrol. Soc India. 2020;35:193–199. doi: 10.1007/s12647-020-00368-3. [DOI] [Google Scholar]
- [20].MAXIM integrated, https://datasheets.maximintegrated.com/en/ds/MAX86150.pdf (last accessed on 28.06.2021)
- [21].Wang Z, Jiang H, Zhang C, Jiang H, Wang Z. A chopper current feedback instrument amplifier with bandpass amplification stage. Analog Integrated Circuits and Signal Processing. 2014;81(3):763–775. doi: 10.1007/s10470-014-0415-9. [DOI] [Google Scholar]
- [22].Pallas-Areny R, Webster JG. Common mode rejection ratio in differential amplifiers. IEEE Transactions on Instrumentation and Measurement. 1991;40(4):669–676. doi: 10.1109/19.85332. [DOI] [Google Scholar]
- [23].Jiang W, Sumit M, Kumar S, Sophini S, et al. A wearable Tele-health system towards monitoring COVID-19 and chronic diseases. IEEE Reviews in Biomedical Engineering. 2022;15:61–84. doi: 10.1109/RBME.2021.3069815. [DOI] [PMC free article] [PubMed] [Google Scholar]
- [24].Ercegovac MD, Lang T. Review of basic number representations and arithmetic algorithms. Digital Arithmetic. 2004 doi: 10.1016/b978-155860798-9/50003-8. [DOI] [Google Scholar]
- [25].Rodrigues EMG, Godina R, Cabrita CMP, Catalão JPS. Experimental low cost reflective type oximeter for wearable health systems. Biomedical Signal Processing and Control. 2017;31:419–433. doi: 10.1016/j.bspc.2016.09.013. [DOI] [Google Scholar]
- [26].L. Yurong, H. H. Rosalyn, B. Ashwin, et al. (2013). A hierarchical method for removal of baseline drift from biomedical signals: Application in ECG analysis. The Scientific World Journal, 2013 (2013) 896056 10.1155/2013/896056 [DOI] [PMC free article] [PubMed]
- [27].J.M. Kim, J.H. Hong, N.J. Kim, E.J. Cha, and T.S. Lee, (2007). Two algorithms for detecting respiratory rate from ECG signal. In: Magjarevic R., Nagel J.H. (eds) World congress on medical physics and biomedical engineering 2006. IFMBE Proceedings, vol 14. Springer, Berlin, Heidelberg (2007). 10.1007/978-3-540-36841-0_1030
- [28].R.E. Standsyah, and I.E. Restu, (2017). Implementasi phpmyadmin pada rancangan sistem pengadministrasian, Unisda Journal of Mathematics and Computer Science, 3(2) (2017) 38–44. 10.52166/ujmc.v3i2.467
- [29].MINDRAY, http://www.integral-process.com/iso_album/h-046-002371-00(2.0)_imec_service_manual_en.pdf (Last accessed on 20.04.2021)
- [30].Philips, https://5.imimg.com/data5/VL/GM/PC/SELLER-1987930/patient-monitor-gs20-philips.pdf (Last accessed on 20.04.2021).
- [31].White MD, Bosio CM, Duplantis BN, Nano FE. Human body temperature and new approaches to constructing temperature-sensitive bacterial vaccines. Cellular and Molecular Life Sciences. 2011;68(18):3019–3031. doi: 10.1007/s00018-011-0734-2. [DOI] [PMC free article] [PubMed] [Google Scholar]
- [32].Wang D, Zhang H, Arens E, Huizenga C. Observations of upper-extremity skin temperature and corresponding overall-body thermal sensations and comfort. Building and Environment. 2007;42(12):3933–3943. doi: 10.1016/j.buildenv.2006.06.035. [DOI] [Google Scholar]
- [33].Louie A, Feiner JR, Bickler PE, Rhodes L, Bernstein M, Lucero J. Four types of pulse oximeters accurately detect hypoxia during low perfusion and motion. Anesthesiology. 2018;128(3):520–530. doi: 10.1097/aln.0000000000002002. [DOI] [PubMed] [Google Scholar]
- [34].Peduto VA, Tani R, Pani S. Pulse oximetry during lumbar epidural Anesthesia. Anesthesia & Analgesia. 1994;78(5):921–924. doi: 10.1213/00000539-199405000-00015. [DOI] [PubMed] [Google Scholar]
- [35].Chattopadhyay M, Chowdhury D. Design and performance analysis of MEMS capacitive pressure sensor array for measurement of heart rate. Microsyst Technol. 2017;23:4203–4209. doi: 10.1007/s00542-016-2842-2. [DOI] [Google Scholar]
- [36].Sharma A, Pant R, Priyadarshi S, Agarwal N, Tripathi S, Chaudhary M. Cardiovascular changes due to dental anxiety during local Anesthesia injection for extraction. J. Maxillofac. Oral Surg. 2019;18:80–87. doi: 10.1007/s12663-018-1085-4. [DOI] [PMC free article] [PubMed] [Google Scholar]
- [37].Qadir MI, Asif MA. Correlation exists between normal breathing rate and watching horror movies. Journal of Lung, Pulmonary & Respiratory Research. 2016;6(1):17–18. doi: 10.15406/jlprr.2019.06.00198. [DOI] [Google Scholar]
- [38].Ramakrishnan S, Zachariah G, Gupta K, Shivkumar Rao J, Mohanan PP, Venugopal K, et al. Prevalence of hypertension among Indian adults: Results from the great India blood pressure survey. Indian Heart Journal. 2019 doi: 10.1016/j.ihj.2019.09.012. [DOI] [PMC free article] [PubMed] [Google Scholar]
- [39].Tham S, Thompson R, Landeg O, Murray KA, Waite T. Indoor temperature and health: a global systematic review. Public Health. 2020;179:9–17. doi: 10.1016/j.puhe.2019.09.005. [DOI] [PubMed] [Google Scholar]