Abstract
During chronic viral infection, CD8+ T cells develop into three major phenotypically and functionally distinct subsets: Ly108+TCF-1+ progenitors, Ly108−CX3CR1− terminally exhausted cells and the recently identified CX3CR1+ cytotoxic effector cells. Nevertheless, how CX3CR1+ effector cell differentiation is transcriptionally and epigenetically regulated remains elusive. Here, we identify distinct gene regulatory networks and epigenetic landscapes underpinning the formation of these subsets. Notably, our data demonstrate that CX3CR1+ effector cells bear a striking similarity to short-lived effector cells during acute infection. Genetic deletion of Tbx21 significantly diminished formation of the CX3CR1+ subset. Importantly, we further identify a previously unappreciated role for the transcription factor BATF in maintaining a permissive chromatin structure that allows the transition from TCF-1+ progenitors to CX3CR1+ effector cells. BATF directly bound to regulatory regions near Tbx21 and Klf2, modulating their enhancer accessibility to facilitate the transition. These mechanistic insights can potentially be harnessed to overcome T cell exhaustion during chronic infection and cancer.
During chronic viral infection or cancer, CD8+ T cells gradually differentiate into a dysfunctional state, commonly known as T cell exhaustion, which is accompanied by the upregulation of multiple inhibitory receptors1. Notably, several recent studies have identified that the exhausted T cell pool consists of multiple phenotypically and functionally distinct subsets. Importantly, a TCF-1+ progenitor subset that displays intermediate levels of programmed cell death protein (PD)-1 expression and high expression levels of receptors Ly108 and CXCR5, functions as a population of resource cells that continuously replenish the pool of more terminally differentiated T cells during chronic infection and cancer2–7. In addition, recent work indicates that, if sufficient CD4+ ‘help’ in the form of interleukin (IL)-21 production is present, some Ly108+ progenitor cells are able to break away from the path toward exhaustion and differentiate into a CX3CR1+ effector subset that expresses lower levels of PD-1 and displays enhanced cytotoxicity when compared to exhausted or progenitor cells8. However, the detailed molecular and genetic mechanisms that underlie this progenitor-to-effector transition remain unknown.
The transcription factor (TF) TCF-1 is critical to maintain stem cell-like features of progenitor CD8+ T cells under conditions of chronic viral infection and cancer3–7. Likewise, several TFs that drive the gene expression program of terminally exhausted T cells have been well characterized, including NR4A proteins9,10, EOMES3,11, IRF4 (ref. 12), NFAT13, FOXO1 (ref. 14) and BLIMP-1 (ref. 15). Furthermore, TOX, a TF that is selectively induced in settings of persistent antigen exposure, was recently shown to transcriptionally and epigenetically program CD8+ T cell exhaustion16–19. Despite these recent advances in our understanding of genetic pathways that promote T cell exhaustion, little is known about how CX3CR1+ effector CD8+ T cell differentiation is transcriptionally and epigenetically regulated.
The epigenetic landscape of CD8+ T cells plays an essential role in establishing and maintaining the transcriptional program required for effector cell differentiation and function20. Exhausted T cells acquire a unique and permanent epigenetic profile that severely limits their functional reinvigoration21–23. Nevertheless, whether the three major CD8+ T subsets from chronic infection are also epigenetically heterogeneous or whether the Ly108+ progenitor-to-CX3CR1+ effector cell transition requires a permissive chromatin structure remains unknown. Intriguingly, our previous work showed that CD4+ T cell-derived IL-21 upregulates the expression of the basic leucine zipper TF ATF-like (BATF) in CD8+ T cells, which is essential to sustain their effector function during chronic viral infection24. Although detailed mechanisms by which BATF modulates chromatin looping and recruitment of RNA polymerase II were only recently unraveled25, it is well established that BATF regulates chromatin accessibility at lineage-specifying genetic loci in multiple immune cells26,27. Therefore, we hypothesized that pioneer chromatin modifiers, such as BATF, could encourage a permissive epigenetic landscape that facilitates the differentiation of Ly108+ progenitor CD8+ T cells into CX3CR1+ effector cells.
Results
SCENIC reveals distinct transcriptional regulatory circuits.
Previous studies have identified multiple transcriptionally heterogeneous populations, including Ly108+ progenitor (TPRO), CX3CR1−Ly108− exhausted (TEXH) and CX3CR1+ cytolytic (TEFF) CD8+ T cell subsets during persistent infection with the clone 13 strain of lymphocytic choriomeningitis virus (LCMV Cl13)8,28. Given that these three major CD8+ T cell subsets appear to be phenotypically and functionally distinct8, we hypothesized that their differentiation is regulated by respective transcriptional programs. To this end, we applied single-cell regulatory network inference and clustering (SCENIC) analysis to our previously published single-cell (sc)RNA-seq data on GP33–41+CD8+ T cells from day 30 post-infection (p.i.) with LCMV Cl13 (GSE129139). In brief, each TF and its putative direct binding targets, which are coexpressed in the same cells, are identified as a regulon. Next, the activity of each regulon in each cell is scored as active or inactive, which can be used to cluster cells to identify stable cell states and key gene regulatory networks (GRNs) associated with each cell type. We identified 27 regulons that were active in at least 1% of total cells (Fig. 1a). Notably, unsupervised cell clustering based on regulon activity yielded three distinct groups that closely corresponded to the three major subsets (TPRO, TEXH and TEFF) that we initially identified based on their gene expression profiles8, such as those for Tcf7, Cx3cr1 and Pdcd1 (Fig. 1a,b and Extended Data Fig. 1a). Thus, progenitor, effector and exhausted subsets not only have distinct transcriptional profiles and effector functions, but their differentiation also appears to be regulated by different GRNs. Furthermore, we found that SCENIC-predicted GRNs captured regulatory relationships between core TFs and previously published gene signatures of these three respective CD8+ T cell subsets (Fig. 1c–e)8,28.
Fig. 1 |. SCENIC analysis revealed distinct transcriptional regulatory circuits for CD8+ T cell subsets during chronic viral infection.
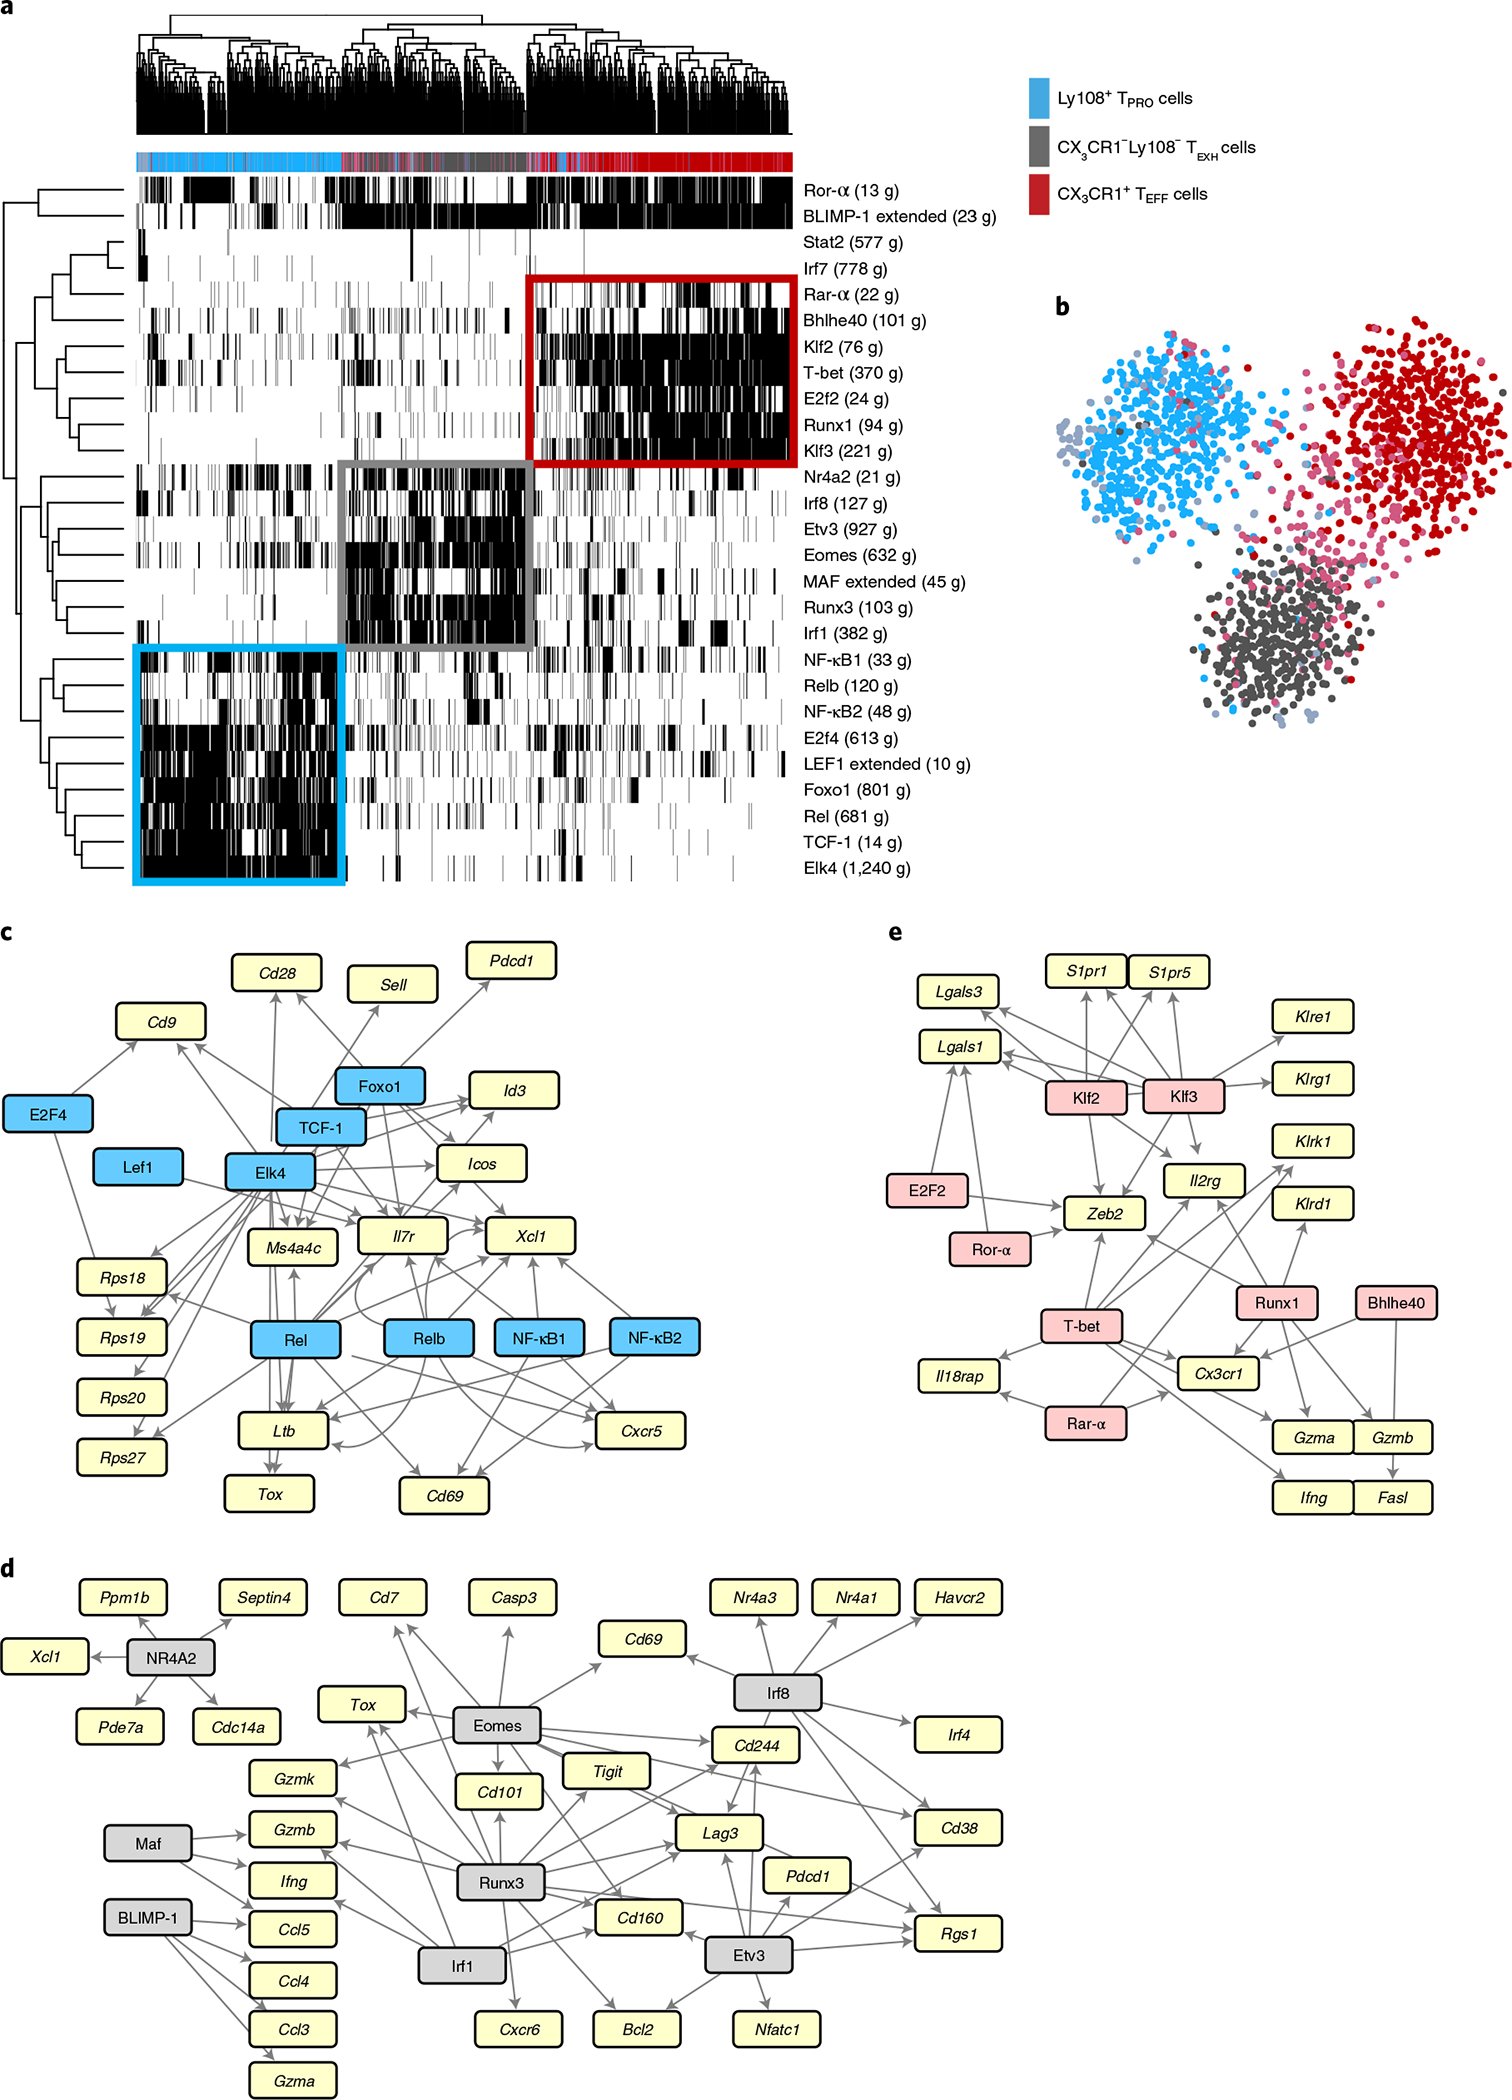
Previously published scRNA-seq data from GP33–41+CD8+ T cells from day 30 p.i. with LCMV Cl13 (GSE129139) were analyzed using SCENIC. a, Heatmap showing binary regulon activities (black, active; white, inactive) of the 27 regulons found in at least 1% of cells that correlated (absolute Pearson correlation >0.30) with that of at least one other regulon. Columns correspond to cells; rows correspond to regulons, with the number of downstream target genes (g) coexpressed with each TF in parentheses. Cells were clustered by regulon activity. The color bar above the heatmap denotes major CD8+ subsets identified by gene expression profiles as previously described8. b, t-distributed stochastic neighbor embedding projection depicting clustering of cells by regulon activity. c–e, GRNs for Ly108+ TPRO cells, CX3CR1−Ly108− TEXH cells and CX3CR1+ TEFF cells. Key TFs for each CD8+ T cell subset are highlighted in blue, pink and gray, respectively. Signature genes for each subset that were identified in our previously published paper are highlighted in yellow. TF–target interactions were visualized by Cytoscape.
Consistent with previous studies3–7, Ly108+ TPRO cells displayed high activity in the TCF-1 regulon (Fig. 1a and Extended Data Fig. 1b). In TPRO cells, TCF-1 is predicted to directly promote the expression of Cd9, Il7r, Ms4a4c and Id3 (Fig. 1c). Furthermore, LEF1, FOXO1 and E2F4 regulons, known to regulate memory CD8+ T cell differentiation29–31 or sustain the TPRO subset32, were uniquely enriched in Ly108+ cells (Fig. 1a and Extended Data Fig. 1b). Surprisingly, regulons of the nuclear factor (NF)-κB family (REL, RELB, NF-κB1 and NF-κB2) and ELK4 were more active in Ly108+ cells (Fig. 1a and Extended Data Fig. 1b), suggesting possible roles for the NF-κB signaling pathway and the TF ELK4 in regulating the formation or maintenance of TPRO cells. Of note, we found that NF-κB family members were predicted to reinforce genes involved in homing, including Cxcr5, Xcl1 and Cd69 (Fig. 1c).
Importantly, CX3CR1−Ly108− TEXH cells had high activity of NR4A TF family members9,10 and EOMES3,11 regulons (Fig. 1a and Extended Data Fig. 1c) as reported previously. Notably, TFs RUNX3, IRF1, IRF8 and ETV3 were also predicted to regulate T cell exhaustion (Fig. 1a and Extended Data Fig. 1c). These TFs reinforce genes encoding inhibitory receptors (Havcr2, Cd160, Pdcd1, Lag3, Cd244 and Tigit), known markers of exhaustion (Cd38 and Cd101) and TFs with previously known roles in promoting T cell exhaustion (Tox, Nr4a TF family members and Irf4) (Fig. 1d). Additionally, terminally exhausted cells shared high BLIMP-1 regulon activity with CX3CR1+ TEFF cells, consistent with a role for the regulator BLIMP-1 (encoded by Prmd1) in controlling effector function by promoting Gzmb expression33 and terminal differentiation15.
Finally, CX3CR1+ TEFF cells exhibited high activity levels of T-bet, BHLHE40, RUNX1, ROR-α, RAR-α, E2F2, KLF2 and KLF3 regulons (Fig. 1e and Extended Data Fig. 1d). Given that T-bet (encoded by Tbx21), either alone or in cooperation with ZEB2 (encoded by Zeb2), programs cytotoxic T cell terminal differentiation during acute viral infection34,35, T-bet and ZEB2, uniquely expressed by TEFF cells (Fig. 1e)8, might also regulate the function and terminal differentiation of TEFF cells. Inspecting putative TF–target interactions, we found that TFs T-bet, BHLHE40, RUNX1 and RAR-α formed a gene regulatory module for Cx3cr1 (Fig. 1e). Furthermore, we found that TFs KLF2 and KLF3 may regulate the emigration of TEFF cells from lymphoid organs by promoting the expression of S1pr1 and S1pr5 (Fig. 1e). Collectively, these results construct subset-specific GRNs in antigen-specific CD8+ T cells during the late phase of chronic LCMV infection.
Analogous CD8+ T cell subsets.
Given the potent cytotoxicity observed in TEFF cells8,28, we hypothesized that late TEFF cells are analogous to KLRG1hiCD127lo short-lived effector cells (SLECs) from acute viral infection. To test this, we integrated single-cell gene expression profiles of virus-specific CD8+ T cells from day 30 of LCMV Cl13 infection (GSE129139) and day 9 of LCMV Armstrong infection (GSE130130) using Seurat (Fig. 2a). Notably, unsupervised clustering analysis identified three major populations when visualized by uniform manifold approximation and projection (UMAP) (Fig. 2b). Cluster 0 and cluster 1 consisted of cells from both acute and chronic LCMV infections, whereas cells in cluster 2 almost exclusively came from the chronic infection (Fig. 2c,d). Based on the enrichment of gene signatures, nearly all cells in cluster 0 showed significantly enriched SLEC signatures from the acute infection (Fig. 2e, upper left) (GSE8678). Furthermore, the top enriched genes in cluster 0 were Cx3cr1, Zeb2 and Klr, encoding multiple killer cell lectin-like receptors (Extended Data Fig. 2a), suggesting that cluster 0 consists of SLECs from acute infection36 and TEFF cells from chronic infection8,28. Conversely, cluster 1 was enriched for Tcf7, Id3, Il7r and Slamf6 (Extended Data Fig. 2a), which are associated with memory potential2–6,8, and other KLRG1loCD127hi memory precursor effector cell (MPEC) gene signatures from acute infection (Fig. 2e, bottom left) (GSE8678) and TPRO cell signatures from chronic infection (Fig. 2e, bottom right) (GSE84105). Cluster 2 cells, unique to chronic LCMV infection, were enriched for exhaustion features as previously defined (Fig. 2e, upper right) (GSE84105), including Lag3, Pdc, Nr4a1 and Tox (Extended Data Fig. 2a)9,10,16–18.
Fig. 2 |. Integrated analysis of single-cell transcriptomes reveals analogous CD8+ subsets arising during acute and chronic viral infections.
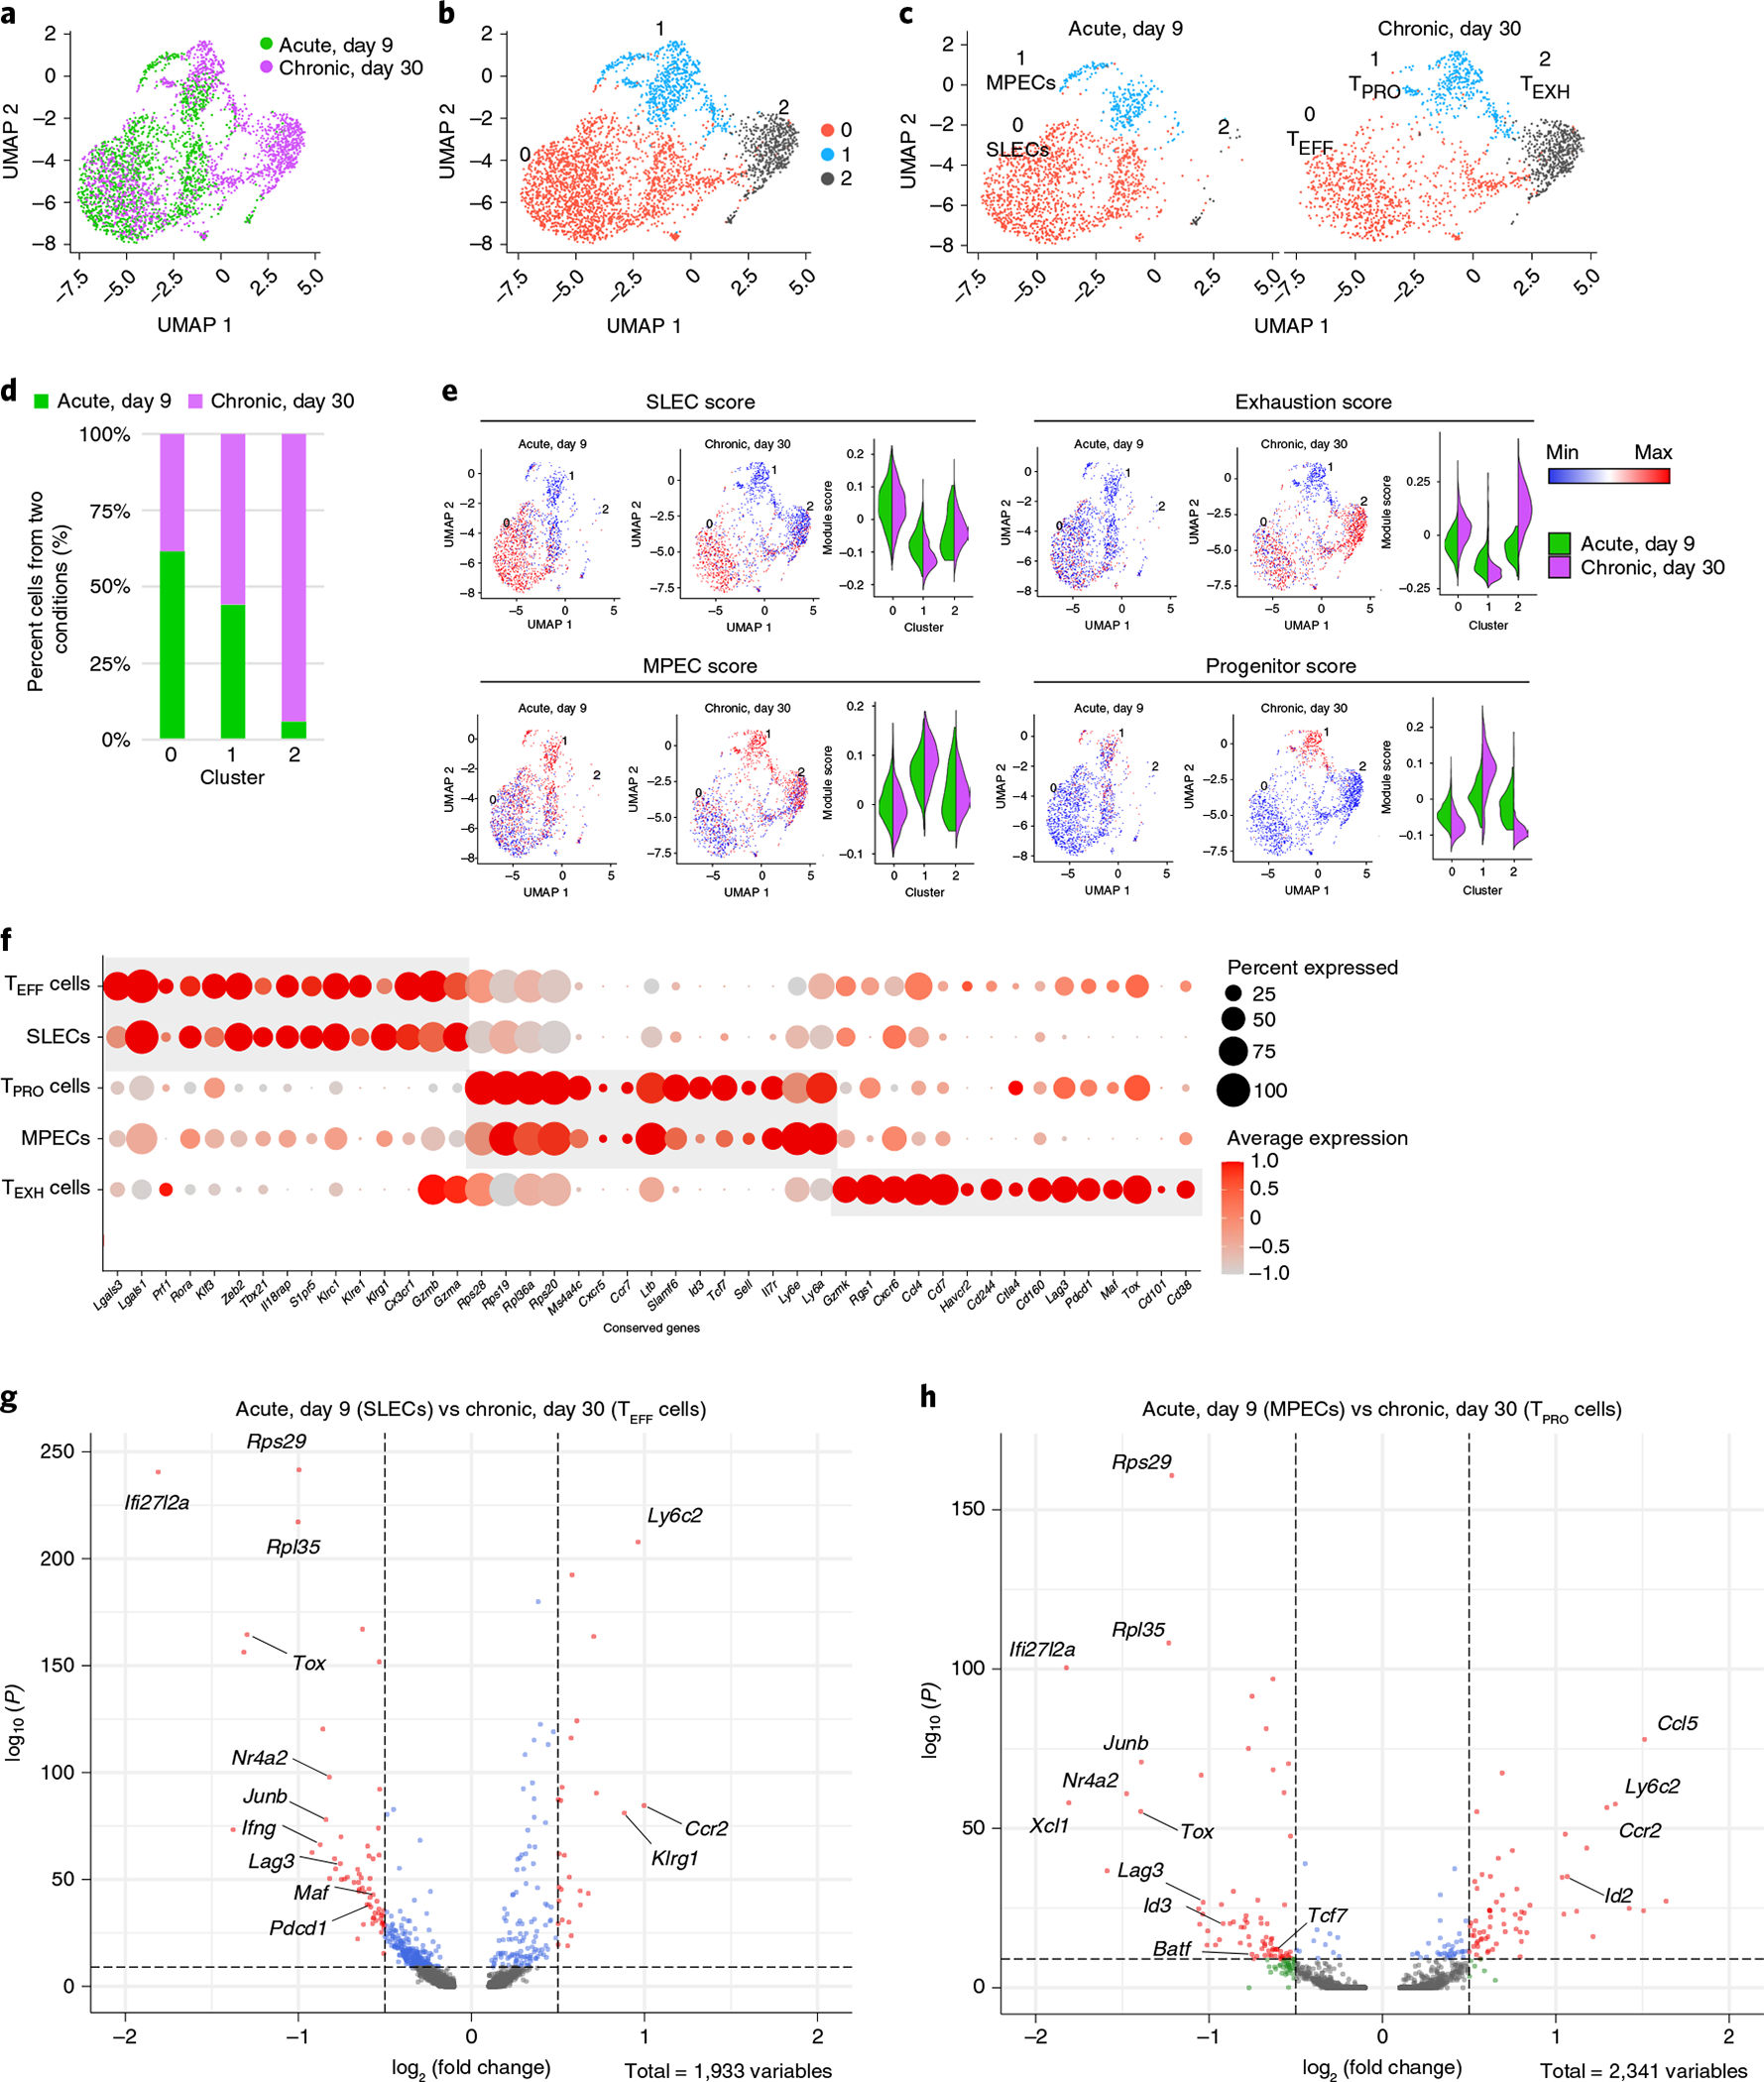
a, UMAP plot showing antigen-specific CD8+ T cells from day 9 p.i. with LCMV Armstrong (GSE130130) and day 30 p.i. with LCMV Cl13 (GSE129139) after integrated analysis. b, Unsupervised clustering identified three major clusters in the combined dataset. c, UMAP plots showing cells from different infection conditions. d, The fraction of cells falling into each cluster from different infection conditions. e, Individual cells were scored for enrichment of gene signatures identified in previously published papers (GSE8678, GSE84105). Min, minimum; max, maximum. f, Dot plot of conserved genes across different infection conditions. g,h, Volcano plots showing genes differentially expressed between SLECs and TEFF cells (g) and MPECs and TPRO cells (h).
To determine whether the similarity in gene expression profiles correlated with protein expression and effector function, we compared the two effector subsets and found that TEFF cells and SLECs displayed comparable expression levels of Cx3cr1, whereas SLECs had higher Klrg1 expression levels (Fig. 2f,g and Extended Data Fig. 2b, left). Although the CX3CR1+ effector subset exhibited lower expression levels of granzyme B (GzmB), interferon (IFN)-γ, tumor necrosis factor (TNF) and T-bet than those of SLECs (Extended Data Fig. 2c,d), they showed similar levels of cytotoxicity (Extended Data Fig. 2e). Furthermore, regulon activities of TEFF cells correlated more closely with SLECs than with those of either TPRO or TEXH cells from chronic infection (Extended Data Fig. 2f,g), with both effector subsets displaying high activity of T-bet, KLF2, KLF3, ROR-α, RAR-α and RUNX1 regulons (Extended Data Fig. 2f). Between the two memory subsets, we found that TPRO cells had decreased protein expression of CD127 and increased expression of Ly108 and TCF-1 (Extended Data Fig. 2b, right, and Extended Data Fig. 2d). Intriguingly, we also found that TEFF and TPRO cells expressed a few markers, such as TOX and PD-1, that are unique to chronic infection when compared with their counterparts from acute infection (Fig. 2g,h and Extended Data Fig. 2d,h). Furthermore, chronic infection promoted the activation of unique regulons in CD8+ T cells (Extended Data Fig. 2f). In sum, our data demonstrate that TEFF and TPRO cells share similar transcriptomes with SLECs and MPECs from acute infection, respectively, but acquire unique features for adaptation to chronic viral infection.
T-bet regulates TEFF subset formation and function.
Given that the TEFF subset-specific T-bet regulon (Fig. 1a,e) was shown to regulate SLEC differentiation in acute viral infection34,36,37, we next wished to determine whether T-bet is required for TEFF formation and function during chronic LCMV infection. To do this, we generated mixed bone marrow chimeric (BMC) mice with Tbx21 deletion restricted to CD8+ T cells. Consistent with previous studies11, we found that the GP33–41 tetramer+CD8+ T cell response was reduced in Tbx21−/− BMC mice as compared to that in their WT counterparts at days 21–30 p.i. (Fig. 3a,b). Furthermore, the capacity of LCMV-specific CD8+ T cells to degranulate and produce IFN-γ was significantly reduced in the absence of T-bet (Fig. 3c). Similar to a previous study38, we found that T-bet deficiency also resulted in a significant reduction in the proportion of TEFF cells at days 21–30 p.i. (Fig. 3a,d). These results collectively suggest that T-bet is intrinsically required for the formation of the effector subset at both early and late stages of chronic viral infection. In addition, T-bet-deficient TEFF cells displayed elevated expression of inhibitory receptors such as PD-1 and TIM3 (Fig. 3e), likely due to the suppressive function of T-bet on PD-1 and TIM3 expression39,40. Conversely, we found that EOMES expression, known to promote exhaustion, was increased in T-bet-deficient TEFF cells (Fig. 3e). Notably, the absence of T-bet had no appreciable impact on TPRO subset formation or on expression of TCF-1 (Fig. 3a,d,e). Furthermore, there was no significant impact of T-bet deficiency on the frequency of TEXH cells or their expression of PD-1, TIM3 and EOMES (Fig. 3a,d,e). Consistent with previous work11, impaired viral control was observed in Tbx21−/− BMC mice (Fig. 3f). Overall, these data demonstrate that T-bet is intrinsically required in CD8+ T cells for TEFF subset formation and function during chronic viral infection.
Fig. 3 |. T-bet deficiency significantly diminishes TEFF subset formation and function.
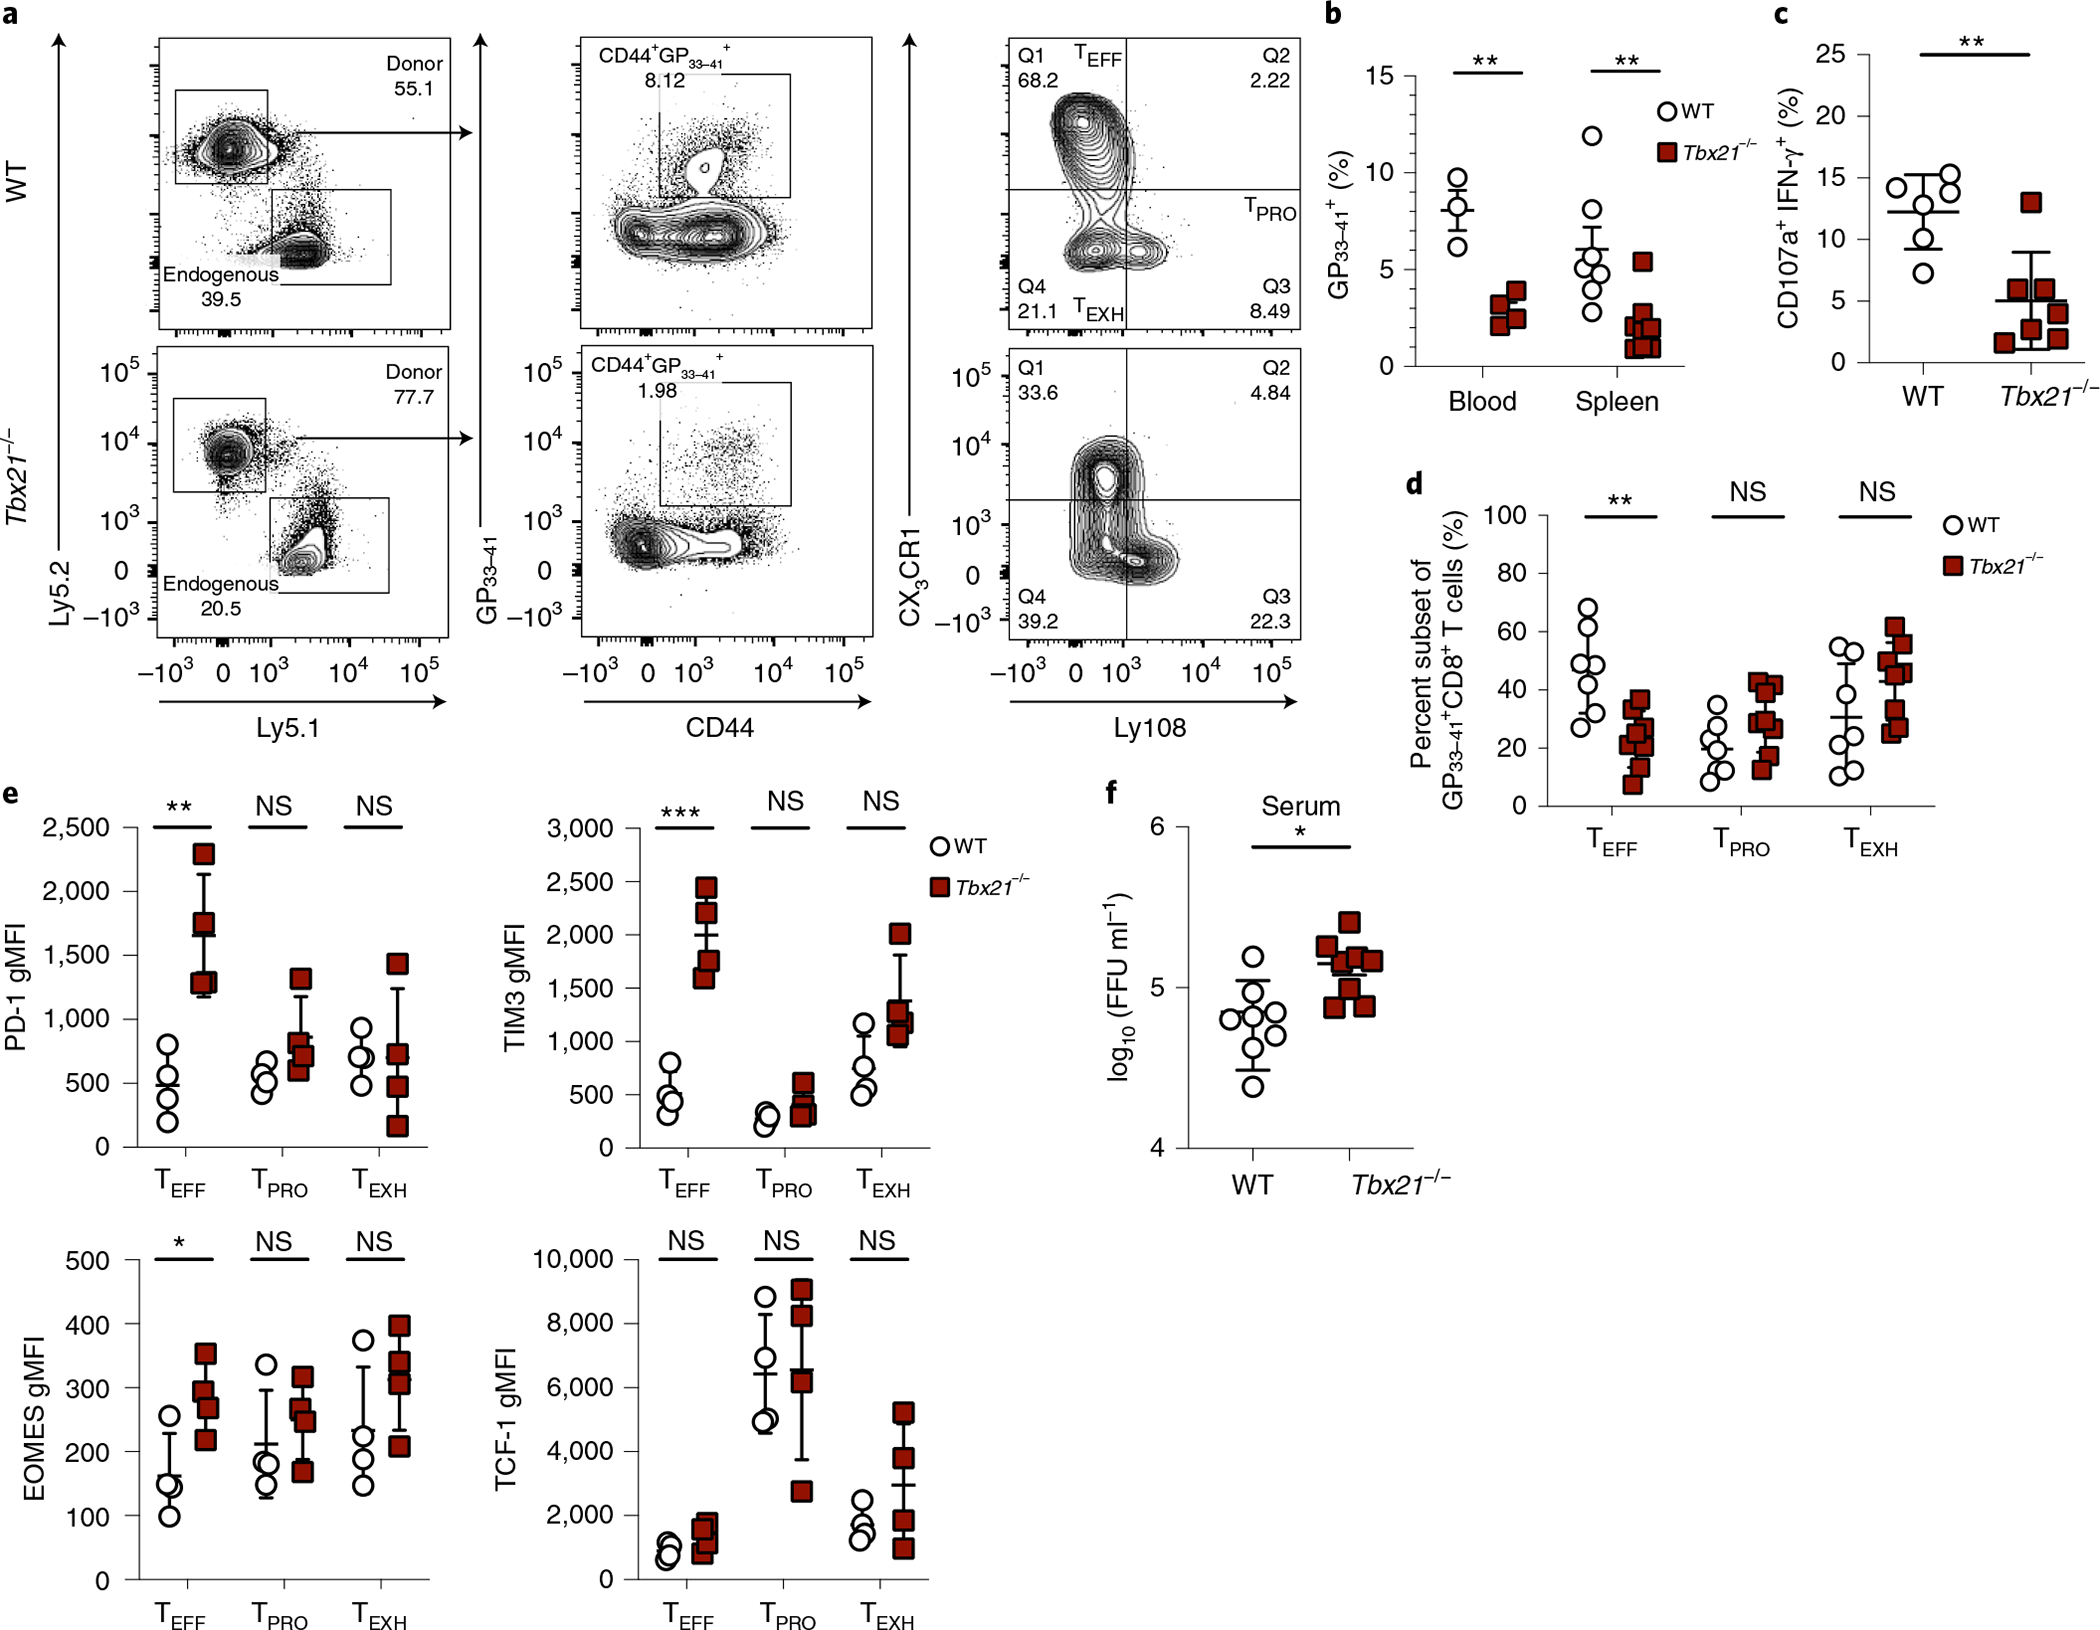
a,b,d, Representative flow plots and summary data depicting the percentage of virus-specific CD8+ T cells as well as proportions of the three CD8+ subsets in WT and Tbx21−/− BMC mice on days 21–30 p.i with LCMV Cl13. Q, quartile. c, Summary data showing the proportion of CD8+ T cells degranulating (CD107a+) and producing IFN-γ upon ex vivo stimulation with the GP33–41 peptide. e, Summary data showing the relative expression of inhibitory molecules and TFs in the three virus-specific CD8+ T cell subsets. gMFI, geometric mean fluorescence intensity. f, Summary data showing viral titers in the sera of experimental mice on day 21 p.i. b, Blood was collected from three WT and four Tbx21−/− BMC mice. Spleens were collected from seven WT and eight Tbx21−/− BMC mice. c, Data were collected from six WT and seven Tbx21−/− BMC mice. d, Data were collected from seven WT and eight Tbx21−/− BMC mice. e, Data were collected from four WT and four Tbx21−/− BMC mice. f, Data were collected from eight WT and eight Tbx21−/− BMC mice. FFU, focus-forming units. b–f, Data were pooled from two independent experiments. Data are expressed as mean ± s.e.m. NS, not significant; *P < 0.05, **P < 0.01, ***P < 0.001. b,d,e, Unpaired t-test with the Benjamini and Hochberg method or the Holm–Šídák method. c,f, Two-tailed unpaired t-test.
Distinct H3K4me3 and H3K27me3 patterns in CD8+ T cell subsets.
To determine whether the three major subsets of virus-specific CD8+ T cells acquire unique chromatin architectures that correlate with their dynamic gene expression, three subsets were purified by sorting from C57BL/6 mice at 3–5 weeks p.i. (Extended Data Fig. 3a). Genome-wide histone 3 lysine 4 trimethyl (H3K4me3) and histone 3 lysine 27 trimethyl (H3K27me3) marks by CUT&Tag sequencing (CUT&Tag-seq) were revealed along the promoter, gene body and intergenic regions (Fig. 4a). Consistent with previous reports41,42, the majority of H3K4me3 peaks were located at gene promoters and gene bodies, while the majority of H3K27me3 peaks were found in intergenic regions and introns (Fig. 4a). Overall, minimal changes in the proportionality of H3K4me3 and H3K27me3 deposition were observed among the three subsets (Fig. 4a).
Fig. 4 |. Distinct H3K4me3 and H3K27me3 patterns are associated with gene expression profiles of progenitor, effector and exhausted CD8+ T cell subsets.
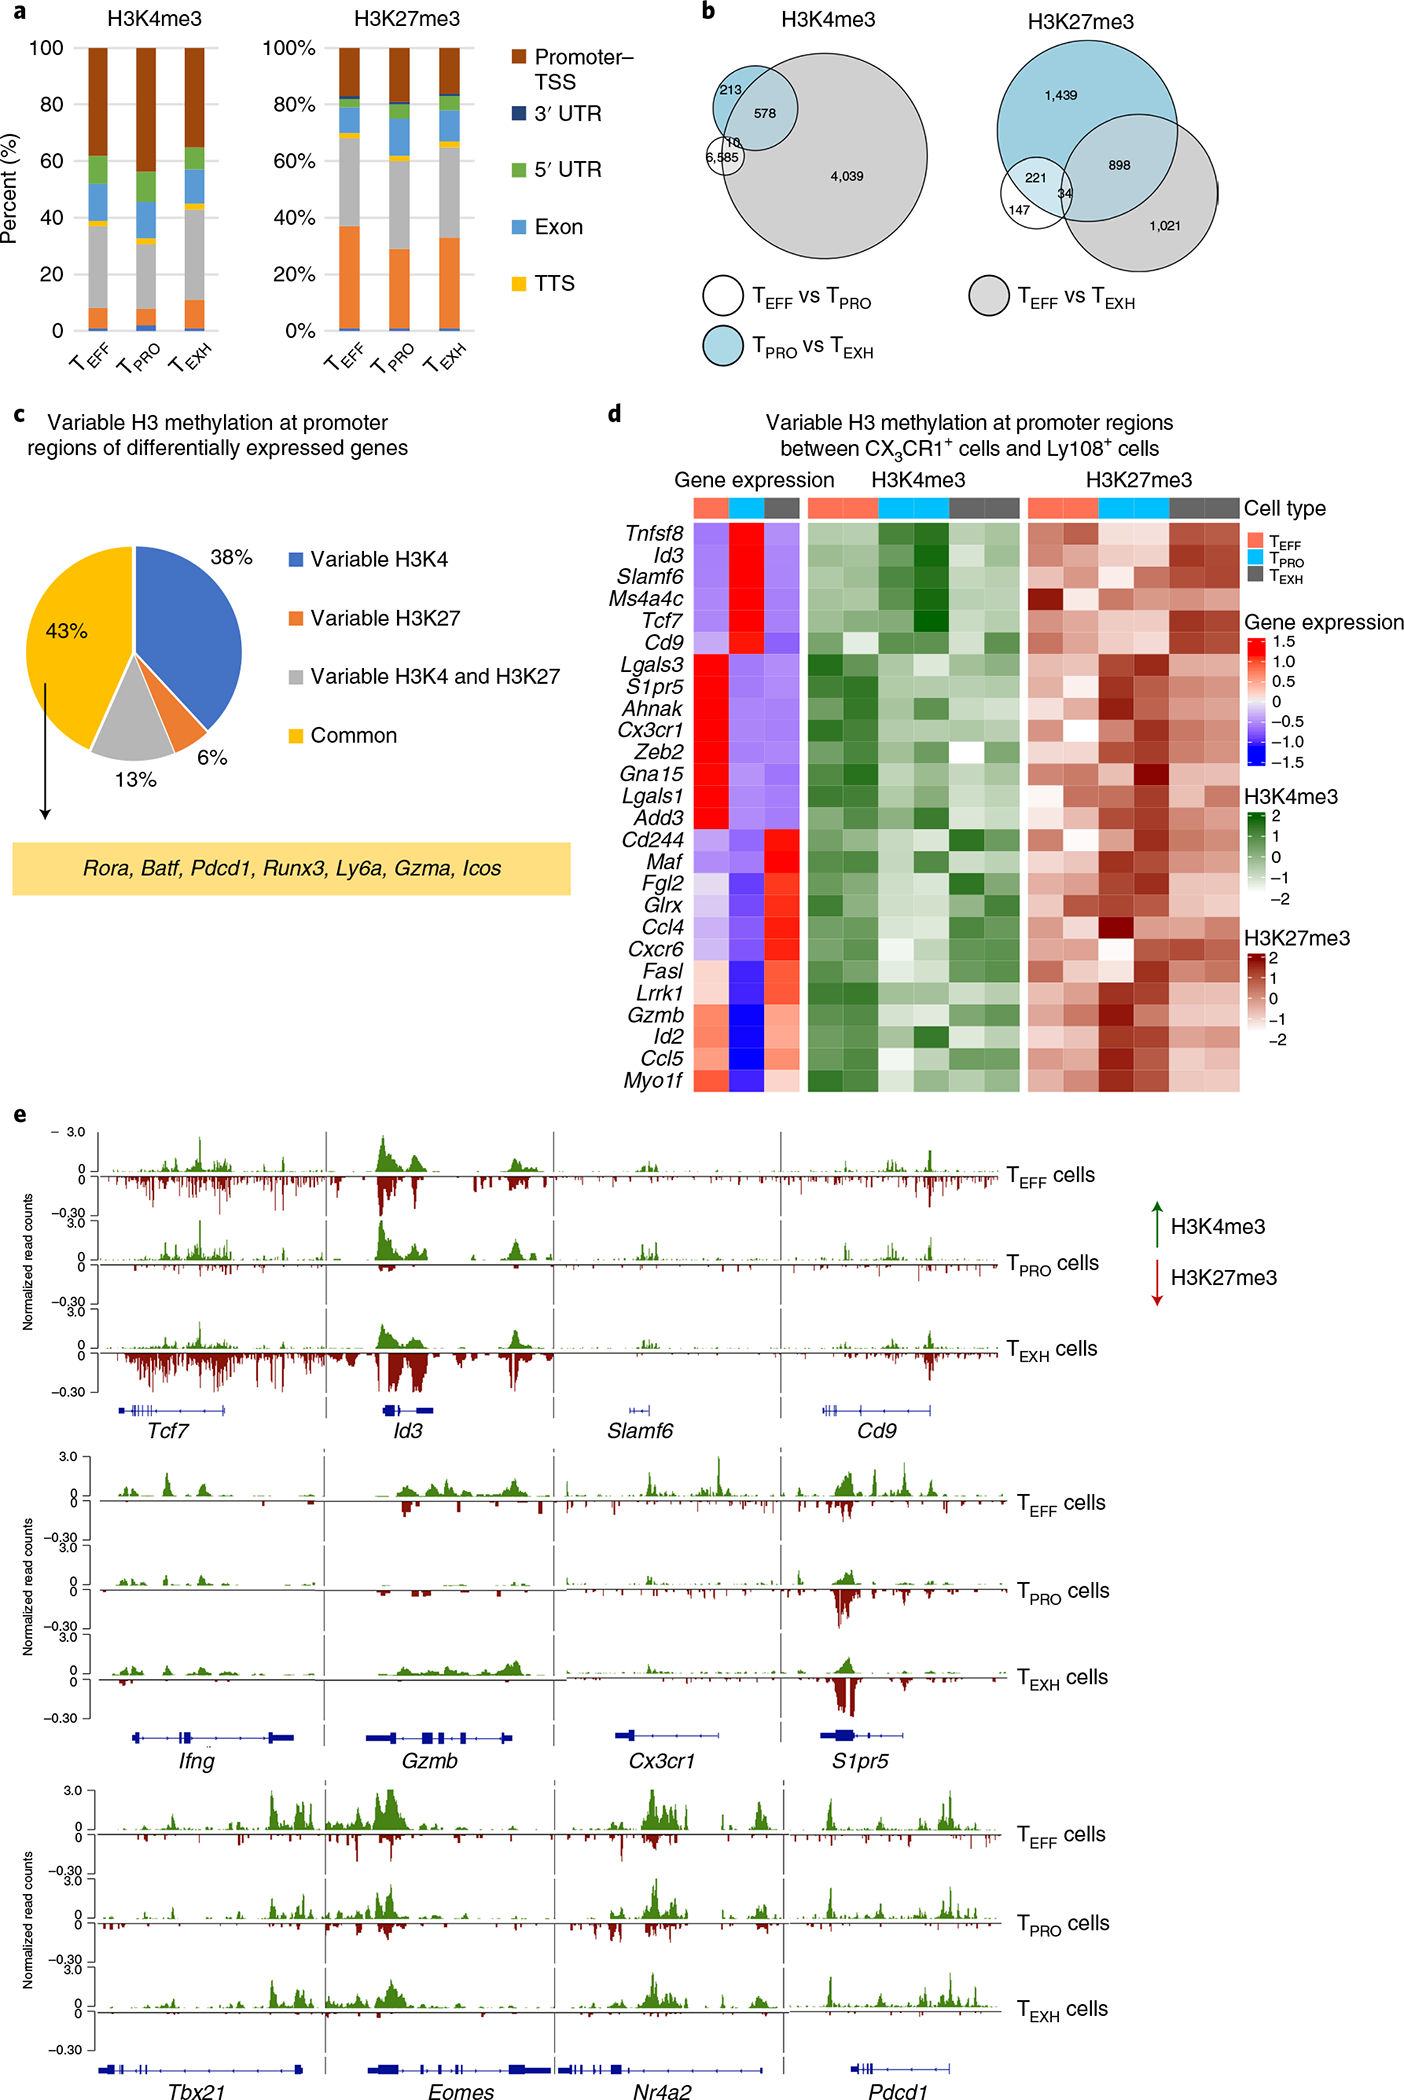
a, Bar plot showing the percentage of H3K4me3 or H3K27me3 peaks at promoter regions (±2 kb from the TSS), gene body regions or intergenic regions. Peak annotation was performed by HOMER. UTR, untranslated region; TTS, transcription termination site. b, Venn diagrams illustrating intersection of gene promoters that exhibited differential H3K4me3 (left) or H3K27me3 (right) signal intensities from pairwise comparisons of TPRO cells, TEFF cells and TEXH cells. c,d, Differentially expressed genes among three CD8+ subsets were identified from scRNA-seq data (with P < 0.05 and log2 (fold change) > 0.5; Wilcoxon rank-sum test was used), and their expression levels were correlated to H3K4me3 and H3K27me3 modifications at promoter regions. c, Pie chart showing the proportion of differentially expressed genes that differentially exhibited one or both H3 methylation marks among TPRO cells, TEFF cells and TEXH cells (Wald test was used for differential binding analysis in DESeq2; the significance cutoff was adjusted P value ≤ 0.05). d, Heatmap showing H3K4me3 and H3K27me3 enrichment as well as expression profiles of genes that exhibited differences in H3K4me3 or H3K27me3 enrichment in their promoter regions between TPRO cells and TEFF cells. Scale bars represent z scores that were generated from log2 (read counts). e, Genome track view of representative gene loci showing H3K4me3 (green, above the line) or H3K27me3 (red, below the line) peaks. CUT&Tag-seq data are from two independent replicates. Each replicate was pooled together from two to three mice.
To identify genome-wide changes in H3K4me3 and H3K27me3 at gene promoter regions during CD8+ T cell differentiation, we computed the normalized density of reads in 29,750 primary promoter regions (Supplementary Table 1). First, we compared the read density of H3K4me3 or H3K27me3 at promoters pairwise among TEFF, TEXH and TPRO subsets and overlapped significantly different promoter regions from these pairwise comparisons (Fig. 4b). Notably, about 93% of the variability in H3K4me3 at promoter regions came from the comparison between TEFF and TEXH cells (Fig. 4b, left). Of these, TEFF-enriched H3K4me3 marks appeared more at gene promoters than did those from TEXH cells (Extended Data Fig. 3b). Gene ontology analysis identified that these genes were involved in biological functions related to transcription, translation and proliferation (Extended Data Fig. 3c). Furthermore, TEXH cells displayed a more unique H3K27me3 pattern at promoter regions than TEFF or TPRO cells (Fig. 4b, right). Surprisingly, the difference in H3K4me3 and H3K27me3 signals between TEFF and TPRO cells was relatively small (Fig. 4b), suggesting that other cis-regulatory elements may control transcriptional signatures of these two subsets.
To correlate H3K4me3 and H3K27me3 modifications with gene expression, we calculated the signal of both H3 methylation states in promoter regions of differentially expressed genes identified from scRNA-seq data (P < 0.05 and log2 (fold change) > 0.5) (Supplementary Table 2) (Fig. 4c,d). In TPRO cells, signature genes, such as Tcf7, Id3, Slamf6 and Cd9, were marked by a permissive methylation signature (H3K4me3hiH3K27me3lo), which switched to a suppressive methylation signature (by acquiring H3K27me3 or removing H3K4me3) following TEFF or TEXH differentiation (Fig. 4d,e). These observations suggest that TEFF or TEXH cells silence signature genes of progenitor cells while becoming terminally differentiated. Furthermore, TEFF or TEXH cells acquired an activating histone methylation pattern at promoter regions of Fasl, Gzmb and Ccl5 to initiate gene expression to improve viral control (Fig. 4d,e and Extended Data Fig. 3d). TPRO cells exhibited silenced expression of these effector genes; however, they were not epigenetically repressed by H3K27me3 (Fig. 4d,e and Extended Data Fig. 3d) but rather remained poised. At the Ifng locus, H3K27me3 was uniquely acquired by TEXH cells (Fig. 4e). Consistently, expression of IFN-γ is significantly lower in TEXH cells than that in the other two subsets8,28. During the TPRO-to-TEFF transition, signature genes, including Cx3cr1, S1pr5, Klrg1 and Zeb2, were activated by the loss of H3K27me3 and gain of H3K4me3 (Fig. 4d,e and Extended Data Fig. 3d). Notably, we found that Tox and Nr4a2 displayed H3K4me3 in all three subsets during chronic infection but acquired H3K27me3 marks in TPRO and TEFF cells (Fig. 4e and Extended Data Fig. 3d). Overall, our findings add to a growing appreciation of how distinct histone methylation patterns contribute to the regulation of gene transcription for TPRO-to-TEFF or TPRO-to-TEXH differentiation.
Studies with acute infection have demonstrated that Tbx21 and Eomes are bivalently marked by H3K4me3 and H3K27me3 in naive CD8+ T cells but transition to permissive states through loss of H3K27me3 in effector and memory cells, which correlates with an increase in gene transcription41,42. In the chronic infection, the Tbx21 locus maintained a permissive histone methylation state and was minimally altered among the three subsets, whereas the gene expression level was substantially different (Fig. 4e). This result indicates that other cis-regulatory elements at the Tbx21 locus may be functioning to result in its differential expression among the three subsets. Conversely, Eomes acquired a bivalent state at its promoter region in both TEFF and TPRO cells but uniquely displayed a permissive state (H3K4me3+H3K27me3−) in TEXH cells, which is consistent with its enriched expression in TEXH cells (Fig. 4e). These results collectively suggest that different epigenetic mechanisms contribute to regulating the transcription of T-box TFs during CD8+ T cell differentiation in chronic infection.
Lastly, among all differentially expressed genes, 43% maintained similar H3K4me3 and H3K27me3 patterns, including Pdcd1 (Fig. 4c,e). These data suggest that regulation of the dynamics of gene expression controlling CD8+ T cell subset differentiation cannot be solely ascribed to epigenetic changes at promoter regions and that other cis-regulatory elements, such as enhancers, may be involved in regulating subset-specific differential gene expression.
Distinct enhancer repertoires among the three subsets.
To determine the distinct enhancer repertoires of TEFF, TEXH and TPRO cells by an assay for transposase-accessible chromatin using sequencing (ATAC-seq), we found that the TPRO subset showed the most chromatin-accessible regions (ChARs), indicating that these cells are more plastic and capable of differentiating toward more terminal states (Extended Data Fig. 4a). By contrast, the TEXH subset had the fewest number of ChARs, suggesting an inflexible epigenetic state22 (Extended Data Fig. 4a). Furthermore, when compared to the shared ChARs, most of the differential ChARs between any two of the subsets analyzed were located in cis-regulatory regions (Extended Data Fig. 4b). This observation indicates that enhancers may play a critical role in establishing the epigenetic heterogeneity of the three subsets. To determine whether subpopulations of CD8+ T cells in chronic infection share a similar epigenetic state with their counterparts in acute infection, we compared accessibilities of enhancer regions to those of naive CD8+ T cells, MPECs, SLECs and memory cells from an LCMV Armstrong infection (GSE150442). Consistent with our transcriptomic comparisons, enhancer profiles of TEFF cells and SLECs correlated closely with one another and were mostly distinct from those of TEXH and TPRO subsets (Fig. 5a).
Fig. 5 |. Distinct enhancer repertoires regulate transcriptional programs of three subsets of CD8+ T cells.
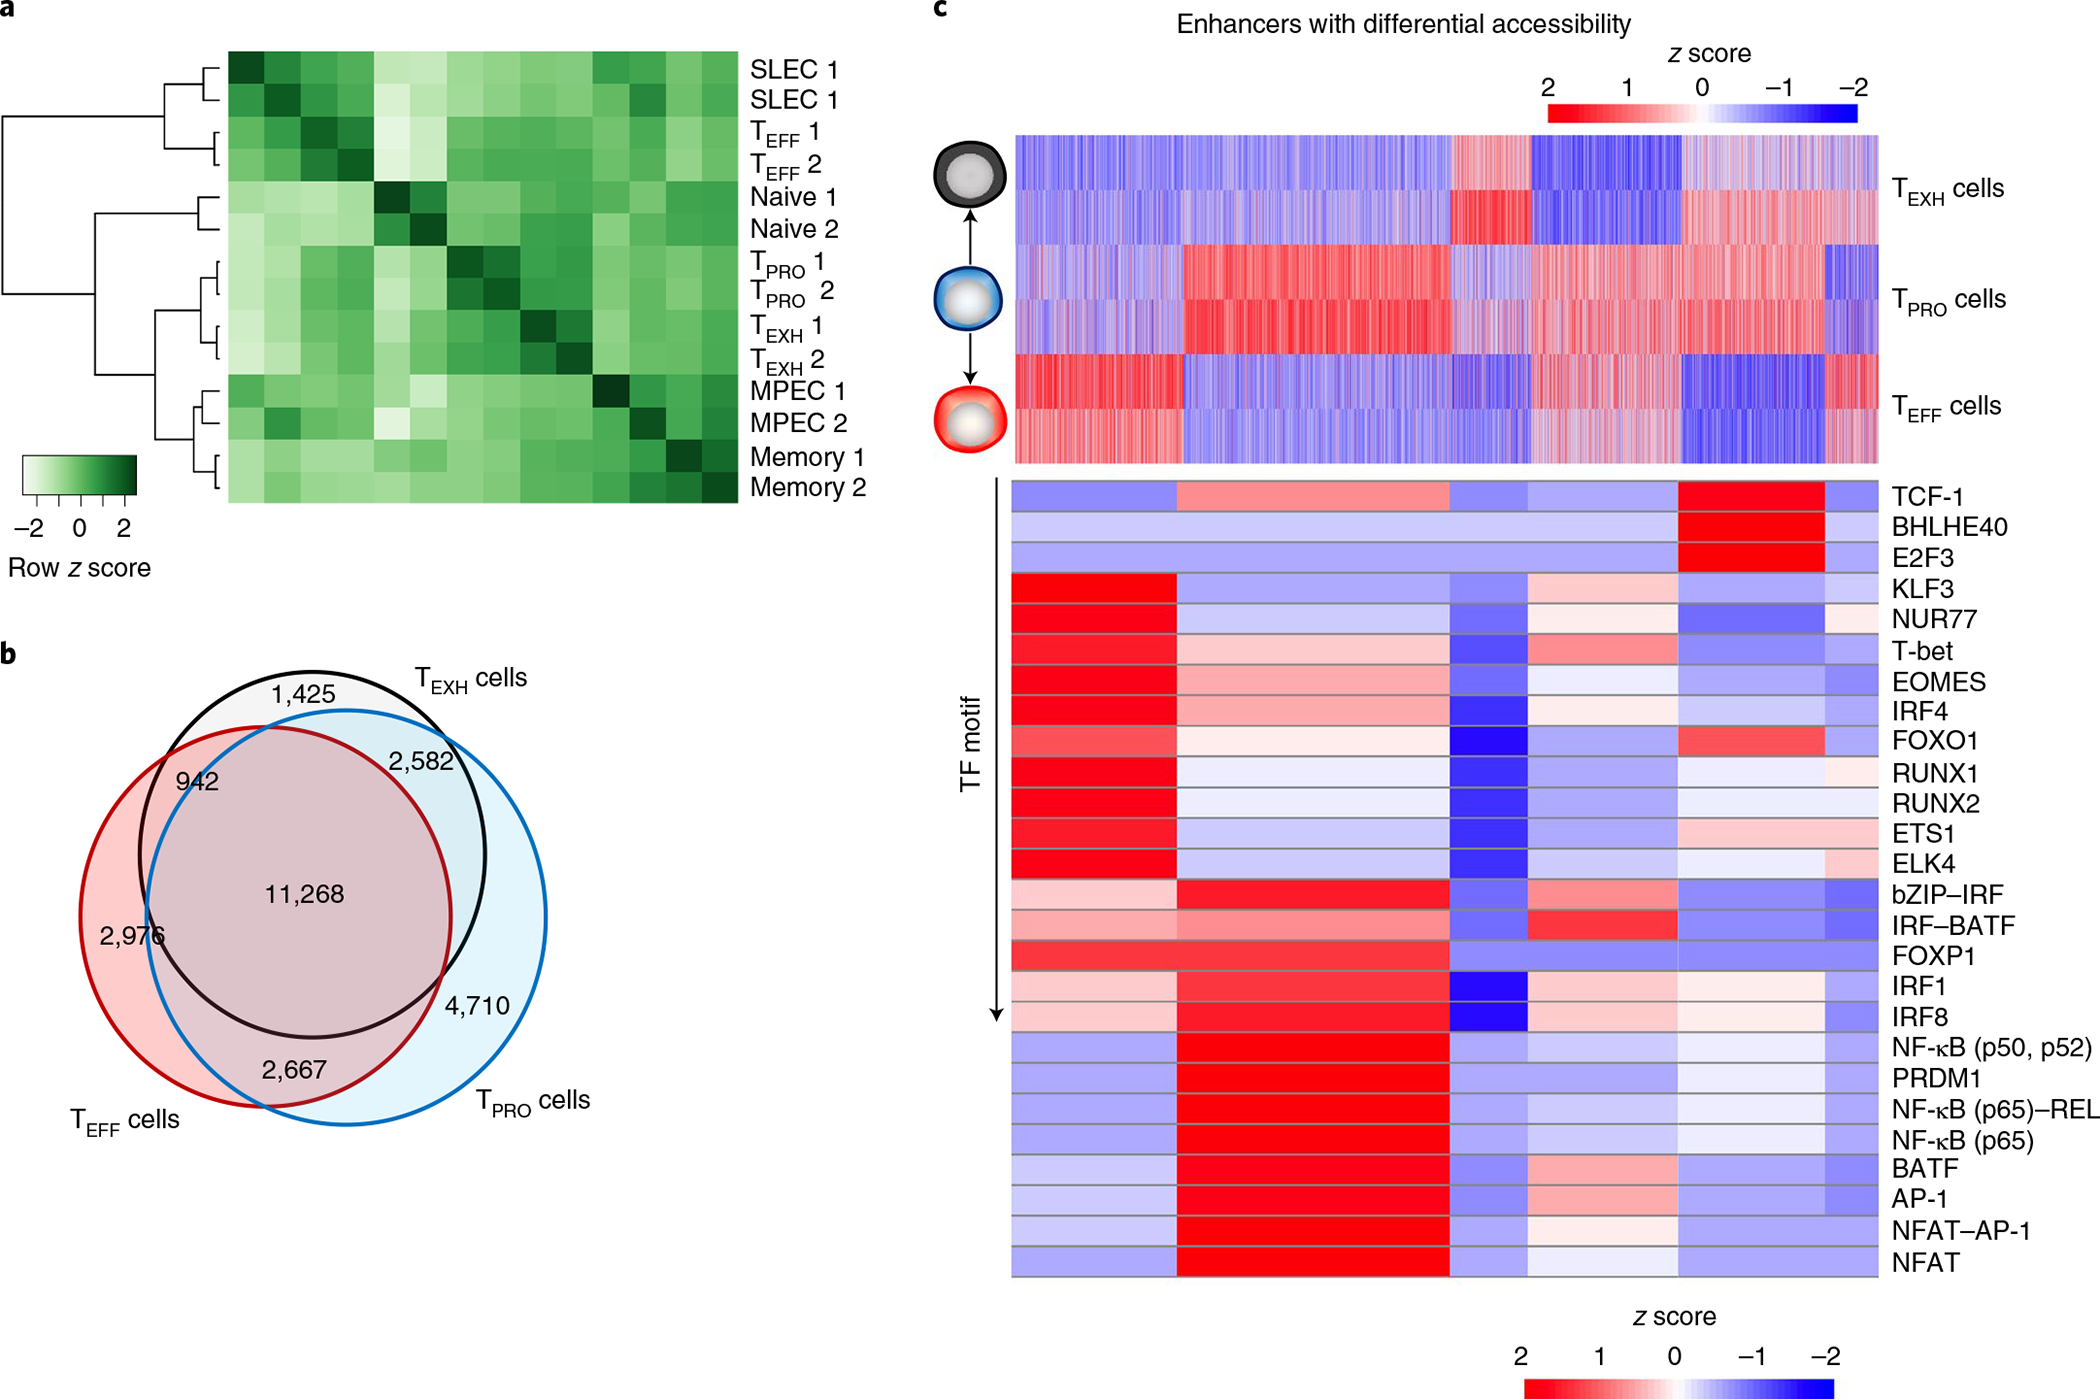
a, Heatmap showing correlation analysis of enhancer profiles (ATAC-seq peaks that are >2 kb from the TSS). Shown are the three CD8 subsets from the chronic LCMV infection as well as naive CD8+ T cells, MPECs, SLECs and memory cells from the LCMV Armstrong infection (GSE150442). The scale bar represents z scores that were generated from log2 (reads per kb per million mapped reads (RPKM)) values. b, Venn diagram showing overlapping and unique enhancer regions among the three CD8+ T cell subsets. c, Top, heatmap showing enhancer regions with differential accessibility. Scale bar represents z scores that were generated from log2 (RPKM) values. Bottom, heatmap showing the enrichment of TF-binding motifs in six enhancer peak sets using HOMER motif analysis. Scale bar represents z scores that were generated from −log10 (P values). ATAC-seq data are from two independent replicates. Each replicate was pooled together from two to three mice.
Next, we examined enhancer regions that varied in accessibility among the three subsets in chronic infection. We identified six groups of enhancer regions that were either unique to TEFF, TEXH or TPRO subsets or shared by two of them (Fig. 5b,c, top, and Extended Data Fig. 5a–d). To investigate whether these enhancer groups regulated functionally distinct genes, pathway enrichment of genes near enhancers was performed. This analysis highlighted signatures of cytotoxicity and the Janus kinase (JAK)–signal transducer and activator of transcription (STAT) signaling pathway as unique enhancers in TEFF and TPRO subsets (Extended Data Fig. 4c). Furthermore, the IL-2 signaling pathway was uniquely enriched in TPRO cells (Extended Data Fig. 4c). Notably, the nuclear factor of activated T cells (NFAT) signaling pathway, which promotes exhaustion, was enriched in the TEXH subset13 (Extended Data Fig. 4c).
To investigate activating and repressive histone markers within enhancer regions, we checked histone 3 lysine 27 acetyl (H3K27ac) and H3K27me3 signals, respectively, at enhancers identified in our ATAC-seq data. Interestingly, we found that enhancers of progenitor signature genes such as Tcf7 and Id3 were active (H3K27ac+H3K27me3−) in TPRO cells. These enhancer regions switched to a suppressive state (H3K27ac−H3K27me3+) after differentiation into either TEFF or TEXH cells (Extended Data Fig. 5b), similar to that of their promoter regions (Fig. 4e). Furthermore, Pdcd1 maintained similar H3K4me3 and H3K27me3 patterns at its promoter region in all three subsets, while TEFF cells uniquely displayed H3K27me3 signals at the −23.8 kb enhancer region (Extended Data Fig. 5c), which is an exhaustion-specific enhancer identified in a previous study21. This may explain why TEFF cells have the lowest PD-1 expression among the three subsets.
To determine potential TFs that maintain the unique transcriptional program of each subset, TF motif-enrichment analysis was performed using HOMER. Consistent with our SCENIC analysis, we found that TF-binding motifs of T-bet, RUNX1 and KLF3 were enriched in TEFF cells (Fig. 5c, bottom). Furthermore, we found that these TFs had putative binding sites at the enhancers of Tbx21, Klf2, S1pr1 and Cx3cr1 (Extended Data Fig. 5a). These data suggested that the potential direct regulation of signature genes in TEFF cells identified by SCENIC and HOMER accurately predicted TF binding. Similarly, binding motifs of TCF-1 and NF-κB were enriched in TPRO cells (Fig. 5c, bottom). A previous study found that binding motifs of the BATF–JUN complex were enriched early but lost at the late phase of chronic infection21. Notably, we observed binding motifs for BATF to be mostly enriched in enhancers shared by TEFF and TPRO cells but not by TEXH cells (Fig. 5c, bottom). Furthermore, two of the top ranked TFs enriched in TEFF cells, when compared to the TEXH subset, were BATF and T-bet (Extended Data Fig. 4d). In sum, previously published work and our ATAC-seq data suggest a potential role for BATF in regulating CX3CR1+ cell differentiation and circumventing T cell exhaustion.
BATF regulates the TPRO-to-TEFF transition.
To determine the requirement of BATF in regulating TEFF differentiation during chronic infection, we generated Gzmb-Cre+;Batffl/fl;RosamT/mG mice to conditionally delete BATF in virus-specific CD8+ T cells following LCMV Cl13 infection. At day 8 p.i., a similar percentage of LCMV-specific TEFF cells formed in WT and Batf +/− cells (Fig. 6a,c,e), which led to similar viral loads in these two groups of mice (Extended Data Fig. 6a, left). However, by day 21 p.i., loss of one Batf allele resulted in the reduced accumulation of LCMV-specific CD8+ T cells, measured by the percentage of GP33–41+ cells and IFN-γ-producing cells (Fig. 6d,g). Strikingly, BATF haplodeficiency caused a profound reduction in TEFF formation and a significant increase in the TEXH subset (Fig. 6b,f). Together, these data suggest that BATF is required for the generation of TEFF cells during the late stage of chronic infection. Furthermore, TEFF cells in Batffl/+;Gzmb-Cre+ mice showed significantly reduced expression of IFN-γ, GzmB, KLRG1 and T-bet (Fig. 6g–i and Extended Data Fig. 6b), which was associated with impaired viral control (Extended Data Fig. 6a, right). In addition, PD-1 expression was increased in the TEFF subset of BATF-haplodeficient (HET) mice but did not differ in the other two subsets when compared to their WT counterparts (Fig. 6j). These data suggest that, while BATF has a negligible impact on PD-1 expression in TPRO and TEXH subsets, it may be required to prevent PD-1 upregulation in TEFF cells, possibly by reinforcing expression of T-bet39,40. Similar to Tbx21−/− BMC mice, loss of one Batf allele did not cause any significant changes in the percentage of the TPRO subset or the expression of TCF-1 at day 21 p.i. (Fig. 6f and Extended Data Fig. 6c). To further test the temporal role of of BATF, we used an inducible Batf-deletion mouse model (Batffl/fl;ER-Cre+;mTmG mice) to delete Batf at day 14 p.i. (Extended Data Fig. 6d). Consistently, we found that the proportion of TEFF cells was significantly reduced in BATF-deficient cells when compared to that in their WT counterparts (Extended Data Fig. 5e–g). Collectively, these data demonstrate that BATF is required for TPRO cells to transition to TEFF cells.
Fig. 6 |. BATF is required for TPRo cell differentiation into TEFF cells.
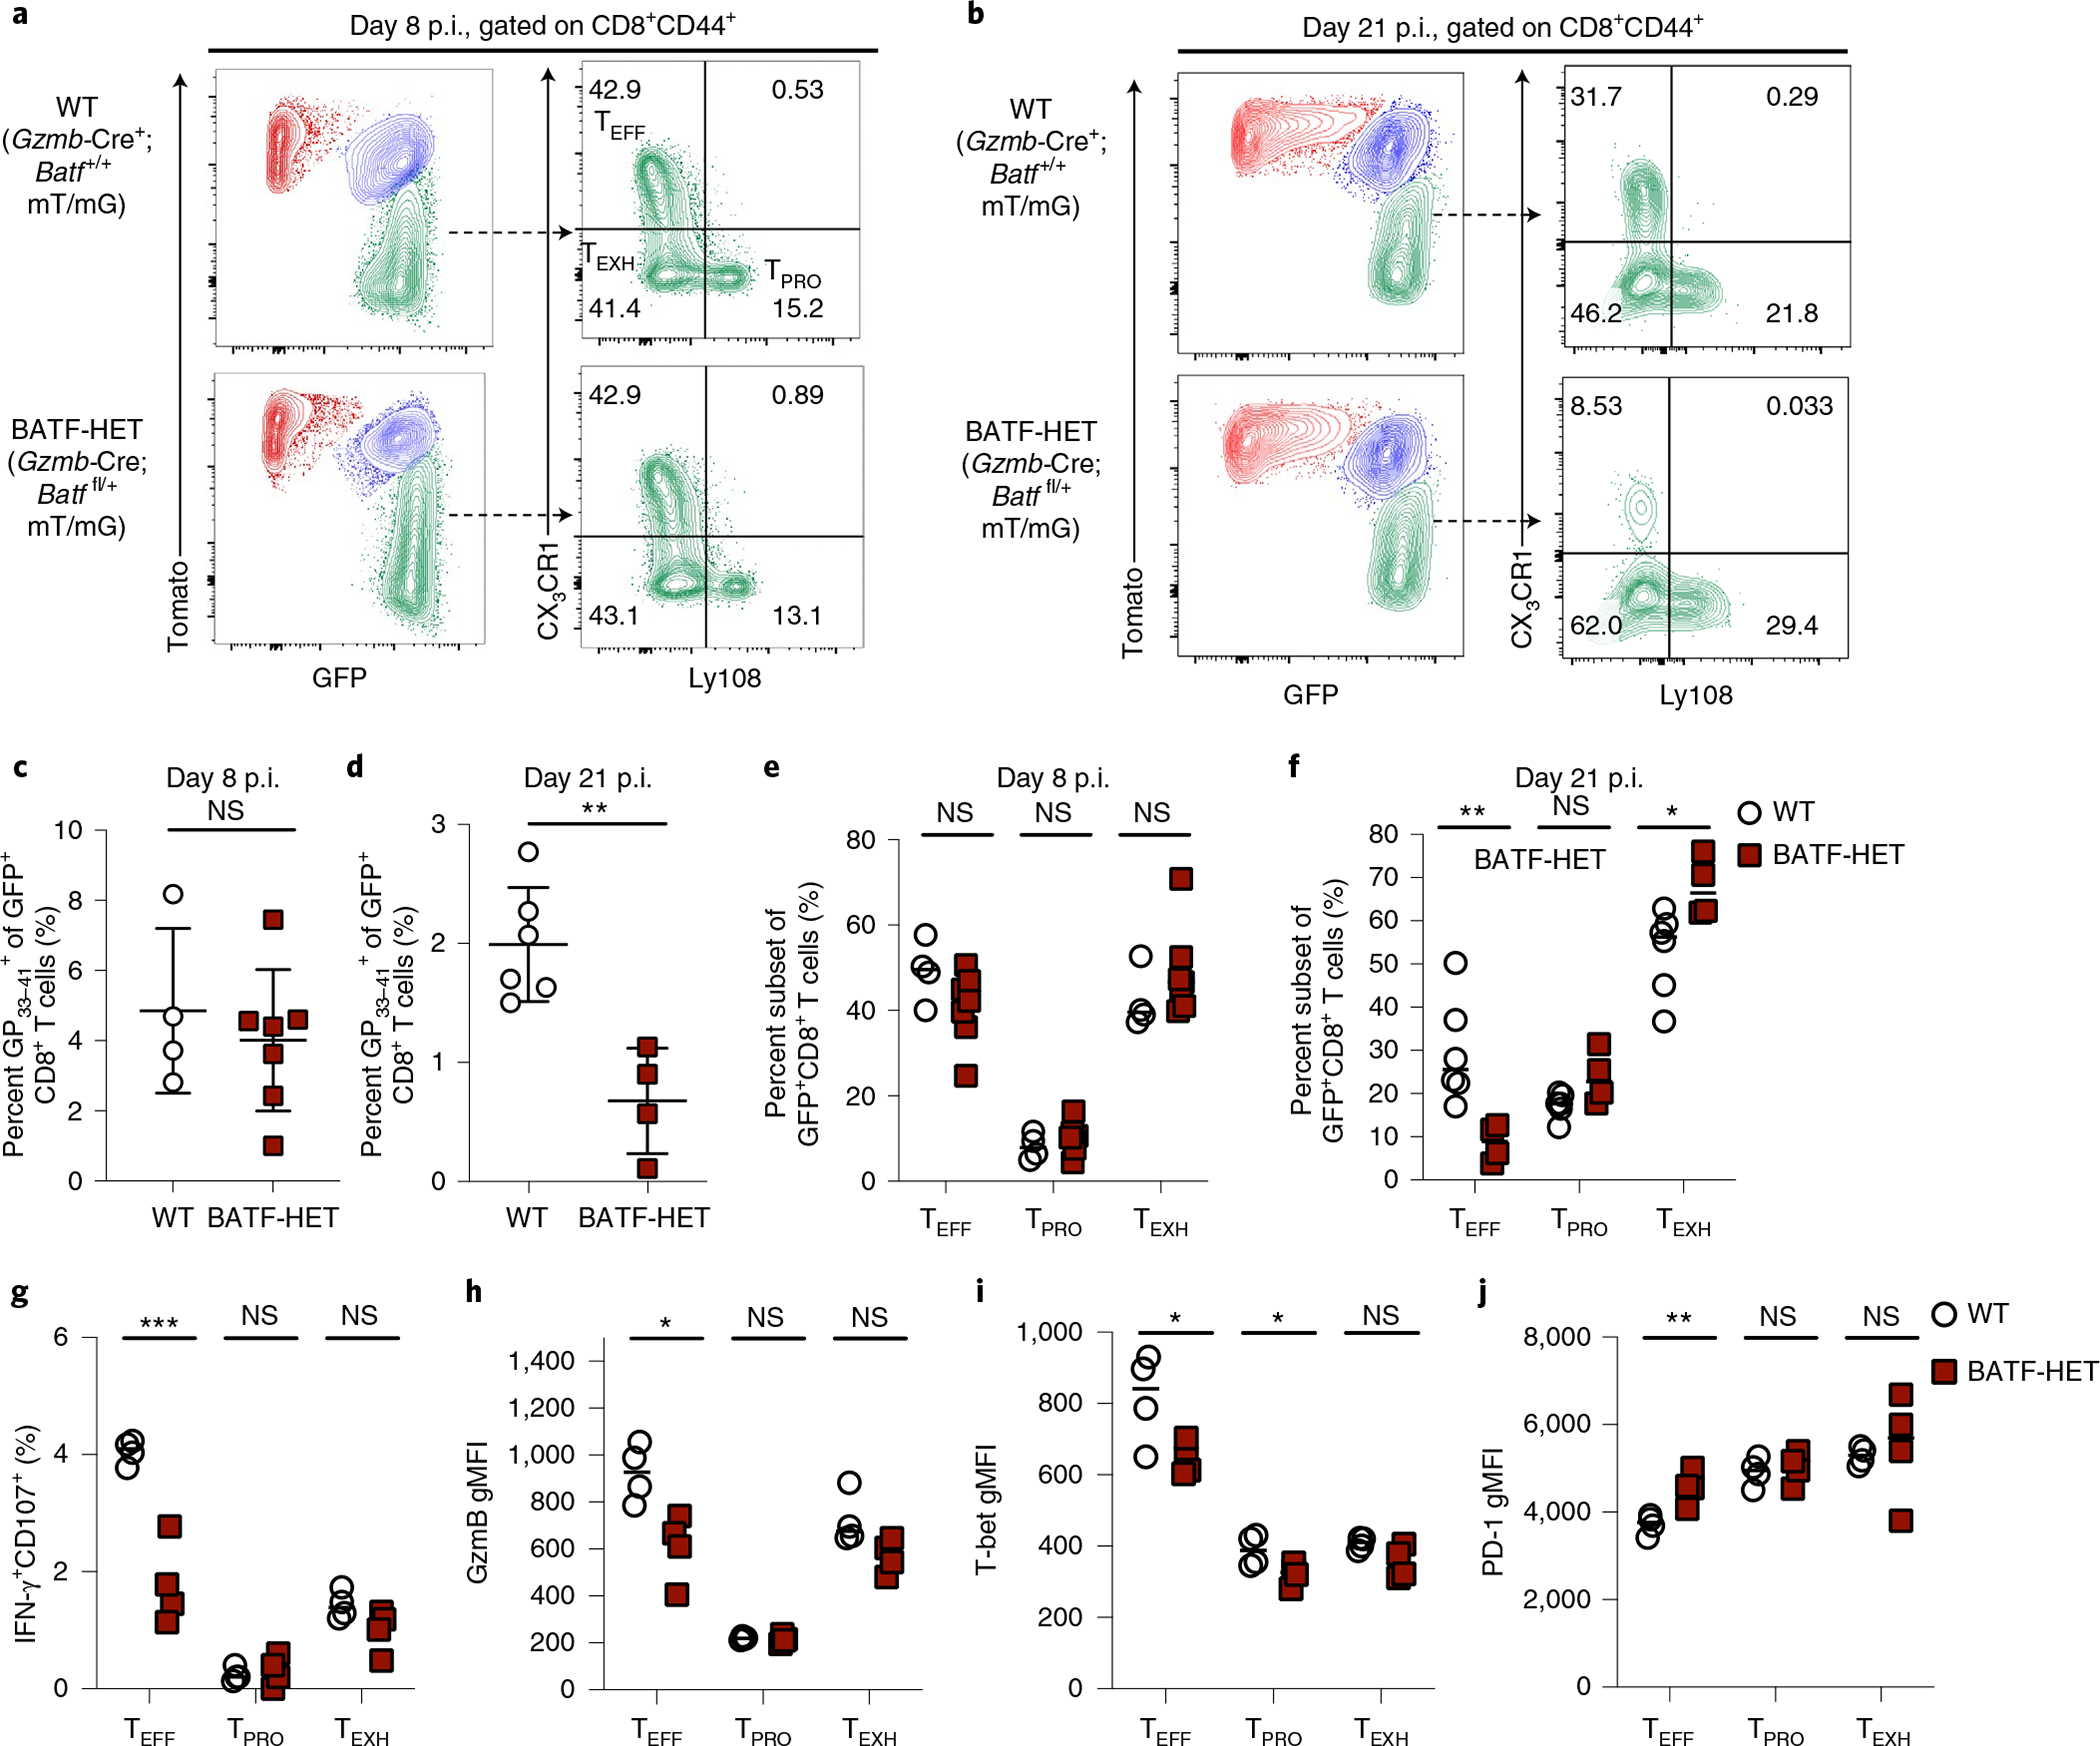
a–f, Representative flow plots and summary data showing the percentage of virus-specific CD8+ T cells as well as the proportion of three antigen-specific CD8+ T cell subsets in WT and BATF-HET mice on day 8 or day 21 p.i. with LCMV Cl13. g, Summary data showing the proportion of CD8+ T cells degranulating (CD107a+) and producing IFN-γ upon ex vivo stimulation with the GP33–41 peptide. h–j, Summary data showing the relative expression of GzmB, T-bet and PD-1 in three virus-specific CD8+ T cell subsets. These subsets were all gated on CD8+CD44+GFP+ cells first, which represent polyclonal LCMV-specific CD8+ T cells. c,e, Data were collected from four WT and seven BATF-HET mice. d,f, Data were collected from six WT and four BATF-HET mice. g–j, Data were collected from four WT and four BATF-HET mice. c–j, Data were pooled from two independent experiments. Data are expressed as mean ± s.e.m. *P < 0.05, **P < 0.01, ***P < 0.001. c,d, Two-tailed unpaired t-test. e–j, Unpaired t-test with the Benjamini and Hochberg method or the Holm–Šídák method.
BATF regulates enhancer accessibility for TEFF formation.
To determine whether BATF regulates chromatin accessibility of distinct enhancer repertoires of TEFF cells, we performed ATAC-seq on WT, BATF-HET and Batf-knockout LCMV-specific CD8+ T cells at day 28 p.i. Compared to WT cells, there were 3,918 and 4,583 enhancer peaks lost in chromatin accessibility in BATF-HET cells and Batf-knockout cells, respectively (Extended Data Fig. 7a). These lost enhancers were located at regions associated with TEFF differentiation, such as Cx3cr1, Klre1, Gzma, Gzmb, Ifng and S1pr1 (Extended Data Fig. 7b), suggesting that BATF regulates the accessibility of genes involved in TEFF function. We then examined putative BATF-binding sites in the three subsets by BATF CUT&Tag-seq. First, we found that TEFF cells had the most BATF-binding peaks of all three subsets (Fig. 7a,b). To check the occupancy of BATF at active enhancer regions during the TPRO-to-TEFF transition, we first selected active enhancer regions with both H3K27ac and ATAC peaks from TPRO and TEFF cells. Next, these active enhancer regions were clustered in an unsupervised manner into three categories based on their presence in TPRO and TEFF cells: regions gained, retained or lost by TEFF cells during the TPRO-to-TEFF transition (Fig. 7c, left). After that, BATF-binding signals were examined within these regions. Interestingly, we found that, during this transition, BATF bound 39% and 45% of the newly acquired enhancers and retained enhancer regions, respectively (Fig. 7c, right). Genes nearby these active enhancer regions included key effector-related genes, such as S1pr1, Klrg1, Ifng, Gzma, Gzmb, Tbx21, Klf2, Cx3cr1 and Prf1 (Fig. 7c,d and Extended Data Fig. 8b). For example, we found that BATF selectively bound to enhancers at +2.4 kb and −12 kb from the Tbx21 transcription start site (TSS) and the distal enhancer of Klf2, which were shared by TEFF and TPRO cells but not by TEXH cells (Fig. 7d). Furthermore, BATF uniquely bound to distal enhancers of Tbx21 (−8.2 kb and −18 kb) and Cx3cr1 that were only open and active in the TEFF subset (Fig. 7d and Extended Data Fig. 8b). In TPRO cells, BATF bound to enhancers close to progenitor signature genes, such as Cxcr5, Tcf7, Id3, Cd9 and Tox (Fig. 7c and Extended Data Fig. 8a). Notably, these enhancers were lost in both TEFF cells and TEXH cells (Fig. 7c). We also found BATF-binding peaks shared by all three subsets, such as the +11 kb peak at the Tbx21 locus and the +17.1 kb peak at the Pdcd1 locus (Fig. 7d and Extended Data Fig. 8a). Furthermore, there were BATF-binding peaks unique to TEXH cells, such as the +9.5 kb peak at the Pdcd1 locus and the enhancer peak at the Irf8 locus (Extended Data Fig. 8a,b). Collectively, these results suggest that BATF is likely involved in maintaining enhancer accessibility during the TPRO-to-TEFF transition in chronic LCMV infection.
Fig. 7 |. BATF modulates enhancer accessibility to facilitate the TPRO-to-TEFF cell transition.
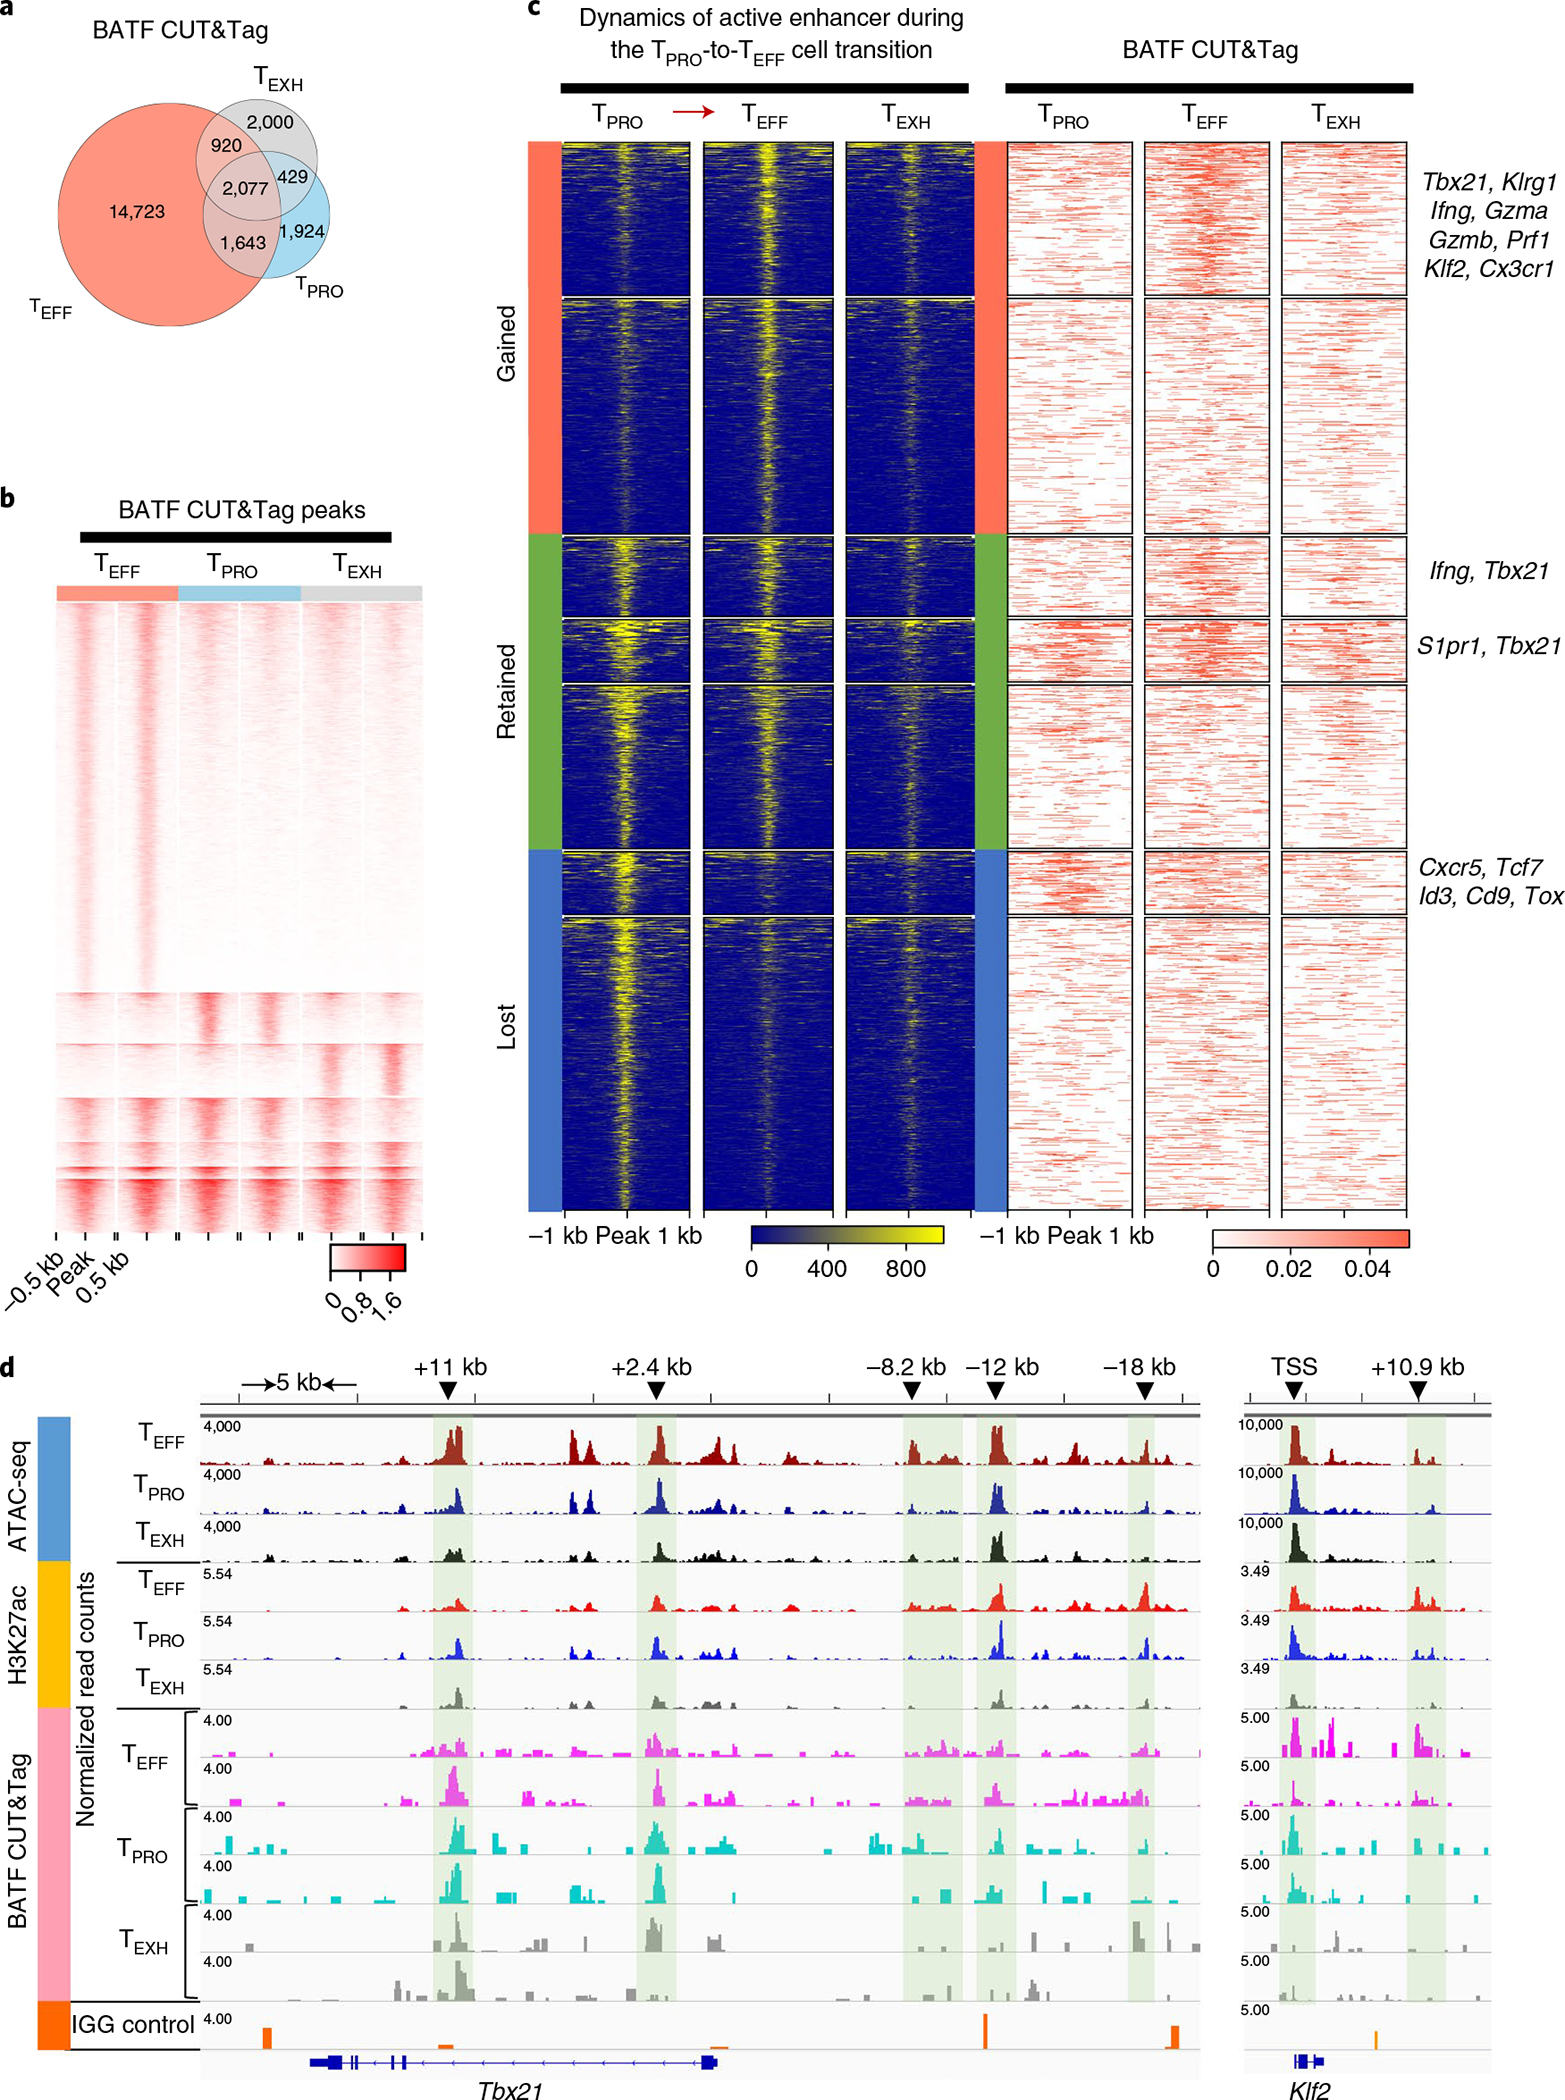
a,b, Comparison of global BATF CUT&Tag-seq peaks in three virus-specific CD8+ T cell subsets. a, Venn diagram demonstrating numbers of BATF CUT&Tag-seq peaks commonly or differentially present in the three CD8+ T cell subsets. b, Heatmap showing signal intensity (reads per 50 bp) of each BATF CUT&Tag-seq peak. k-means clustering in seqMINER was used to group the BATF CUT&Tag-seq peaks based on their signal intensities (linear normalization method). c, Left, dynamics of active enhancers (ATAC+H3K27ac+) during the TPRO-to-TEFF cell transition. Active enhancers were grouped into three categories based on their presence in TPRO cells and TEFF cells. Right, occupancy of BATF at these active enhancers. BATF-bound active enhancers were annotated to nearby genes using HOMER annotatePeaks. Representative genes in each group are listed on the right. d, Genome track view of the Tbx21 locus showing ATAC-seq, H3K27ac and BATF CUT&Tag peaks in TPRO cells, TEFF cells and TEXH cells. TFs with predictive binding sites at the enhancers (green shadows) are listed. For ATAC-seq data, the scale bar represents RPKM values. For BATF CUT&Tag-seq data, the scale bar represents Escherichia coli DNA–normalized read counts. BATF CUT&Tag-seq data are from three independent replicates. Each replicate was pooled together from two to three mice.
Discussion
Our work has revealed that the differentiation of TEFF, TEXH and TPRO cells during chronic viral infection is driven by distinct GRNs and enhancer repertories. Our findings further suggest that different epigenetic features and transcriptional networks are involved in the differentiation of TPRO cells toward either TEFF or TEXH cells. Lastly, we found that BATF modulates enhancer accessibility to facilitate the TPRO-to-TEFF transition and circumvent T cell exhaustion. These findings have important implications for therapeutic strategies aimed at improving T cell-mediated control over chronic infections and cancer.
Our transcriptome, regulon activity and enhancer accessibility analyses collectively demonstrate that TEFF cells are likely an analogous subset of cytolytic effector CD8+ T cells, sharing a similar T-bet-dependent differentiation program with SLECs. Despite their striking similarities, TEFF cells uniquely express exhaustion signature genes Tox and Nr4a2. Previous studies have identified distinct chromatin accessibility profiles of stem-like and exhausted CD8+ T cells from chronic infection and tumors33,43. However, these studies have demonstrated that ChARs of these two CD8+ T cell subsets are more similar when compared to those of effector and memory CD8+ T cells generated during acute viral infection33,43. Consistently, we have found that TPRO cells closely resemble MPECs transcriptionally but that the enhancer accessibility of TPRO cells is more closely related to that of exhausted cells than that of MPECs. These findings indicate that, while TPRO cells and MPECs share some common phenotypic markers, they are epigenetically distinct populations.
In this study, we applied SCENIC analysis to scRNA-seq data on CD8+ T cells during chronic viral infection and found that the differentiation of TEFF, TEXH and TPRO cells is driven by distinct GRNs. Notably, some predicted associations of transcriptional regulators with respective cell types are consistent with published findings. More strikingly, many TFs predicted by SCENIC, which have previously unappreciated roles in regulating the differentiation of each subset, were experimentally validated by TF motif-enrichment analysis. For example, we identified that binding motifs of the NF-κB TF family are uniquely enriched in TPRO cells, while T-bet-, RUNX1- and KLF3-binding motifs are mostly enriched in TEFF cells. However, some crucial TFs involved in T cell exhaustion, such as Irf4 and Tox, were not enriched in the SCENIC analysis. One potential reason for this is that transcriptional repressors are unlikely to be detected by this algorithm, given that regulon activities are based on the coexpression of TFs and their putative targets. The other reason could be due to the low recovery of Irf4 transcripts by scRNA-seq, which were filtered out during SCENIC. Lastly, the putative TOX-binding motif and its downstream targets have not been well defined yet, which makes regulon analysis unavailable for TOX during SCENIC- as well as HOMER-based TF motif analysis. Despite these limitations, SCENIC is a very useful method to inform possible GRNs that regulate cellular differentiation.
BATF is highly enriched in CD8+ T cells during chronic viral infection44 and was shown to form a transcriptional circuit with IRF4 and NFAT to drive T cell exhaustion12. However, BATF was also shown to be required for programming both antitumor45 and antiviral CD8+ T cell responses24,26. Consistent with our previous studies24, we demonstrated here that BATF, possibly downstream of CD4+ T cell-derived IL-21 signaling, is required for the differentiation and function of TEFF cells. Interestingly, a previous study found that Batf+/− CD8+ T cells exhibited reduced PD-1 and increased IFN-γ expression12. These phenotypic differences from our study could possibly be explained by the impaired activation and function of T cells and/or other immune cells, such as antigen-presenting cells and antibody-producing B cells46, both of which play important roles in chronic viral control. Notably, although no significant difference in BATF expression was observed among the three CD8+ T subsets during LCMV Cl13 infection8, BATF genomic occupancy was quantitatively and spatially different among the subsets, with TEFF cells acquiring the most BATF-binding peaks. Nevertheless, there are also a number of unique BATF CUT&Tag peaks observed in the exhausted subset. As BATF lacks a transactivation domain, it relies on dimerization with other AP-1 family members (c-Jun, JunB and JunD)46,47 and/or its collaboration with IRF4 and/or IRF8 to influence gene expression26,48,49. Therefore, distinct binding partners of BATF that are enriched in different subsets, such as Irf4 in exhausted cells, may form co-regulated regions with BATF to regulate unique transcriptional profiles of the three CD8+ T cell subsets. Future studies are warranted to determine whether BATF cooperates with other TFs to modulate these distinct enhancer landscapes.
Online content
Any methods, additional references, Nature Research reporting summaries, source data, extended data, supplementary information, acknowledgements, peer review information; details of author contributions and competing interests; and statements of data and code availability are available at https://doi.org/10.1038/s41590-021-00965-7.
Methods
Mice and LCMV infection.
Six- to 8-week-old female C57BL/6 and C57BL/6 CD45.1 congenic mice were purchased from Charles River. Otherwise, 6–10-week-old male and female mice were used. Individual experiments are sex and age matched. Tbx21−/− mice (004648), Cd8a−/− mice (002665), RosamT/mG;CreERT2 mice (008463) and RosamT/mG mice (007576) were purchased from Jackson Laboratory. Granzyme B Cre (Gzmb-Cre) mice were kindly provided by J. Jacobs (Emory University) via S. Kaech (Salk Institute) and were crossed with RosamT/mG mice to generate Gzmb-Cre+;RosamT/mG mice. Batffl/fl mice50 were further crossed with Gzmb-Cre+;RosamT/mG mice to generate Gzmb-Cre+;RosamT/mG;Batffl/+ mice and Gzmb-Cre+;RosamT/mG;Batf+/+ mice. Batffl/+ ER-Cre+ mTmG mice were generated by crossing RosamT/mG;CreERT2 mice with Batf+/+ mice. Mouse handling complied with the requirements of the Institutional Animal Care and Use Committee guidelines of the Medical College of Wisconsin (MCW).
Mice were infected with LCMV Cl13 intravenously (i.v.) (2 × 10⁶ PFU per mouse) to establish chronic infection and were infected with LCMV Armstrong (2 × 10⁵ PFU per mouse) by intraperitoneal injection to establish acute infection. LCMV Armstrong and LCMV Cl13 were grown in BHK-21 cells, and viral titers were determined by performing focus-forming assays on Vero cells.
Mixed bone marrow chimeras.
For Tbx21−/− mixed BMC experiments, endogenous CD8+ T cells from recipient mice were depleted with an anti-CD8 antibody (0.25 mg per mouse, intraperitoneally, clone 2.43 from BioXCell, BE0061). Next, irradiation was administered at two dose rates to the recipient mice, 6.5 and 5.5 Gy, separated by 8 h. Recipient mice were reconstituted with mixed bone marrow cells from Cd8a−/− mice (70%) with either WT or Tbx21−/− mice (30%) (a total of 3 × 10⁶ cells were transferred i.v.). For generating Batffl/+;ER-Cre+ mTmG MBC mice, we use Cd8a−/− animals as recipient mice, which were irradiated with 6.5 and 5.5 Gy, separated by 8 h, and reconstituted with mixed bone marrow cells from Cd8−/− mice (70%) and Batffl/+;ER-Cre+ mTmG mice (30%) (a total of 3 × 10⁶ cells were transferred i.v.). Mice were given oral sulfamethoxazole for 2 weeks. Bone marrow reconstitution was checked 8 weeks later.
Flow cytometry.
All flow cytometry data were collected on an LSR II instrument (BD Biosciences) with BD FACSDiva software (version 8) and analyzed with FlowJo (version 9). Lymphocytes were isolated from blood using Lymphoprep (Stemcell, 07801). Spleens were collected and homogenized using a steel mesh. Red blood cells were lysed using LCK lysis buffer (Thermo Fisher, A1049201) for 4 min at room temperature. For surface staining, cells were stained with tetramer and antibodies for 30–60 min at 4 °C. For TF staining, cells were fixed and permeabilized using the True-Nuclear Transcription Factor buffer set (BioLegend, 424401) before adding antibodies to TFs.
Antibodies.
The following antibodies were used for flow cytometry: anti-mouse CD8a (53–6.7, BioLegend, 100751, 1:200), anti-mouse/human CD44 (IM7, BioLegend, 103027, 1:400), anti-mouse PD-1 (RMP1–30, BioLegend, 109110, 1:200), anti-mouse CX3CR1 (SA011F11, BioLegend, 149014), anti-mouse Ly108 (330-AJ, BioLegend, 134608, 1:200), anti-mouse TIM3 (BD Biosciences, 747625, 1:200), anti-mouse KLRG1 (2F1, BioLegend, 138416, 1:200), anti-mouse CD107a (1D4B, BioLegend, 121616, 1:200), anti-mouse IFN-γ (XMG1.2, BioLegend, 505826, 1:200), anti-mouse TNF-α (MP6-XT22, BioLegend, 506306, 1:200), anti-human/mouse granzyme B (GB11, Invitrogen, GRB04, 1:200), anti-TCF-1 (C63D9, rabbit mAb, Cell Signaling, 2203S, 1:400), anti-BATF (D7C5, rabbit mAb, Cell Signaling, 8638, 1:400), goat anti-rabbit IgG (H+L) cross-adsorbed secondary antibody, Alexa Fluor 647 (Thermo Fisher, A-21244, 1:400), anti-mouse EOMES (Dan11mag, Invitrogen, 25-4875-82, 1:200), anti-mouse T-bet (4B10, BioLegend, 644806, 1:200). The following antibodies were used for CUT&Tag-seq: rabbit anti-BATF (Brookwood Medical, pab4003, 1:100), anti-histone H3 (trimethyl K4) (Abcam, ab8580, 1:100), anti-histone H3 (acetyl K27) (Abcam, ab4729, 1:100), anti-histone H3 (trimethyl K27) (Abcam, ab6002, 1:100), guinea pig anti-rabbit IgG (heavy and light chain, antibodies-online, ABIN101961, 1:100).
Incucyte cytotoxicity assay.
We used EL4 cells (ATCC, TIB-39) as target cells. EL4 cells were loaded with either GP33 or the irrelevant ovalbumin SIINFEKL (OT-I) peptide for 2 h and then co-cultured with sorted GP33–41+CD44+CD8+ T cells from either day 9 of the acute infection or day 30 of the chronic infection (5:1 effector:target). Next, Incucyte Annexin V Red Reagent (Essen BioScience, 4641) was added, which marks cells that are undergoing apoptosis. The Incucyte S3 Live-Cell Analysis System was used for data collection and analysis. Images were acquired every 2 h.
Focus-forming assay for virus titer quantification.
Serum was isolated, snap frozen on dry ice and moved to a −80 °C freezer for long-term storage. Vero cells were seeded in a 96-well plate at a density of 30,000 cells per well and cultured overnight. Serum samples were added to Vero cells (1:25 dilution) and incubated at 37 °C with 5% CO2 for ~20 h. Infected cells were detected by probing with rat anti-LCMV nucleoprotein InVivoMab, clone VL-4, at 2.53 mg ml−1 (BioXCell, BED106), followed by goat anti-rat IgG2a-FITC at 1 mg ml−1 (Bethyl, A110-109F). Clusters of infected cells (foci) were counted with the Incucyte S3 Live-Cell Analysis System and reported as focus-forming units.
Single-cell RNA-seq data analysis.
Single-cell regulatory network inference and clustering analysis.
Previously published scRNA-seq data of GP33–41+CD8+ T cells from day 30 p.i. with LCMV Cl13 (GSE129139)8 and day 9 p.i. with LCMV Armstrong (GSE130130)51 were used for SCENIC analysis52. Log-normalized UMI counts were used as input gene expression values. All cells were colored according to their Seurat cluster identities as previously described8; however, this grouping had no effect on the SCENIC analysis and was only used as a visual guide. To determine whether the regulon was active (or not) in a given cell, AUCell thresholds were automatically calculated. For some regulons, AUCell thresholds were manually adjusted as recommended by the SCENIC developers.
Chronic and acute single-cell RNA-seq dataset integration.
scRNA-seq data from day 30 of the chronic infection were generated from GP33–41+CD44+CD8+ T cells that were sorted by flow cytometry from mice infected with LCMV Cl13 on day 30 p.i. (GSE129139). For scRNA-seq data from day 9 of the acute infection, naive P14 CD8+ T cells expressing a transgenic T cell receptor that recognizes the GP33–41 epitope were adoptively transferred into C57BL/6 recipients. Mice were then infected with LCMV Armstrong, which causes acute infection. On day 9 p.i., splenic P14 CD44+CD8+ T cells were sorted by flow cytometry and used for scRNA-seq (GSE130130). In brief, both datasets were generated with the Chromium Single Cell 3′ version 2 Reagent kit (10x Genomics) according to the manufacturer’s protocol. The Mus musculus mm10 genome was used as the reference transcriptome for alignment using Cell Ranger (10x Genomics) (version 2.1.1). A total of 1,642 cells from the acute infection and 1,823 cells from the chronic infection were integrated computationally using the Seurat package (version 3.1.2)53 in R (version 3.6.0) to identify shared cell states. First, the number of genes detected per cell, the number of UMIs and the percent of mitochondrial genes were calculated. To filter out doublets and dead cells, cells with number of genes over 2,500, number of UMIs over 8,000 and percent of mitochondrial genes over 8% were removed. Next, log normalization and variable-feature identification were performed for each dataset individually. Following this, 3,432 anchors identified using the FindIntegrationAnchors function were used to overlay the two datasets. The ScaleData function was used for scaling RNA expression values with cell cycle genes, number of UMIs and mitochondrial genes regressed out. After running the IntegrateData function, integrated data were scaled. After running PCA analysis, we visualized the results with UMAP. The FindConservedMarkers function was used to identify cell type marker genes that are conserved across two conditions. To do this, it performs differential gene expression analysis for each dataset and then combines P values using meta-analysis methods from the MetaDE R package (version 1.0.5). To identify genes that were differentially expressed between different infection conditions for cells of the same cluster, FindMarkers was used, with P values calculated using the Wilcoxon rank-sum test with Bonferroni adjustment. AddModuleScore was used to score individual cells for enrichment of gene signatures identified in previously published papers (each signature consisted of 200 genes).
CUT&Tag-seq.
The three LCMV-specific (GP33–41 tetramer+ or GP276–286 tetramer+) CD8+ subsets (CX3CR1+, Ly108+ and CX3CR1−Ly108−PD-1hi) were sorted by flow cytometry from spleens and lymph nodes of C57BL/6 mice 3–5 weeks after LCMV Cl13 infection. A total of 50,000–100,000 cells from each CD8+ subset were used for library construction using the CUT&Tag-seq approach (version 2)54 (the stepwise protocol can be found at https://www.protocols.io/view/bench-top-cut-amp-tag-z6hf9b6). Thirty-seven cycles of paired-end sequencing were performed on an Illumina NextSeq 500, and 5–10 million reads were generated for each sample.
CUT&Tag-seq analysis.
FastQC (version 0.11.8) was used to check the sequencing read quality. Each dataset was downsampled to equal read depths. For standardization between experiments, E. coli DNA derived from transposase protein production was used to normalize sample read counts based on the recommendation of the CUT&Tag protocol54. Reads were aligned to the M. musculus mm10 genome and that of E. coli (strain K12) using Bowtie 2 (version 2.2.5)55 with options ‘–local–very- sensitive-local–no-unal–no-mixed–no-discordant–phred33 -I 10 -X 700’. Peaks were called using SEACR (version 1.1)56 with options ‘0.01 non stringent’. Peaks were annotated with HOMER (version 4.9.1)57, and visualizations were created using deepTools (version 3.3.0) and IGV (version 2.8.2). k-means clustering of BATF CUT&TAG-seq data was performed using seqMINER (version 1.3.3)58.
Assay for transposase-accessible chromatin using sequencing.
Gzmb-Cre+;RosamT/mG mice were used for ATAC-seq experiments. In these mice, activated CD8+ T cells express high levels of GzmB, which initiates Cre recombinase expression. As a result, these GzmBhi cells will change from Tomato positive to GFP positive. Thus, GFP+CD8+ T cells represent polyclonal LCMV-specific CD8+ T cells. After LCMV Cl13 infection (3–5 weeks), three subsets of LCMV-specific CD8+ T cells from the spleen and lymph nodes were sorted by flow cytometry using surface markers Ly108, CX3CR1 and PD-1. ATAC-seq was performed based on a published protocol59. A total of 50,000 cells from each CD8+ subset were used for library construction. Thirty-seven cycles of paired-end sequencing were performed on an Illumina NextSeq 550, and approximately 50 million reads were generated for each sample.
ATAC-seq analysis.
FastQC (version 0.11.8) was used to check the sequencing read quality. Reads were aligned to the M. musculus mm10 genome using Bowtie 2. Reads that were unpaired, unmapped, not primary aligned, with low MAPQ values and PCR duplicates were filtered out using SAMtools (version 1.9)60. Reads aligning to the mitochondrial genome were removed as well. Peaks were then called using MACS2 (‘–no model–shift −100–ext size 200 -q 0.01’) (version 2.1.1)61. Next, data from different samples were analyzed with DiffBind (version 2.12.0); only peaks identified within both replicates were used. Differentially accessible regions were identified with DESeq2 (version 1.24.0)62 within the DiffBind analysis (version 2.12.0) and MAnorm (version 1.1.4)63. Motif analysis was performed using HOMER (version 4.9.1). Gene ontology analysis of subset-specific enhancers was performed using GREAT (version 3.0.0)64. We used FIMO (version 5.1.1)65 to scan enhancer peaks for individual motif occurrences with a P value cutoff of 10−4. We used non-redundant motifs from the JASPAR vertebrates database. ATAC-seq data for naive CD8+ T cells, MPECs, SLECs and memory cells from the LCMV Armstrong infection were downloaded from GEO with the accession code GSE150442 (ref. 51).
Statistical analyses.
Data are expressed as mean ± s.e.m. P ≤ 0.05 was considered statistically significant.
Statistical tests were performed using GraphPad Prism version 9.
Reporting Summary.
Further information on research design is available in the Nature Research Reporting Summary linked to this article.
Data availability
Both raw data files and processed data files from ATAC-seq and CUT&Tag-seq experiments were deposited in the GEO database with accession codes GSE149752, GSE149796 and GSE149810. Source data are provided with this paper.
Extended Data
Extended Data Fig. 1 |. SCENIC analysis revealed distinct transcriptional regulatory circuits for CD8+ T cell subsets during chronic viral infection.
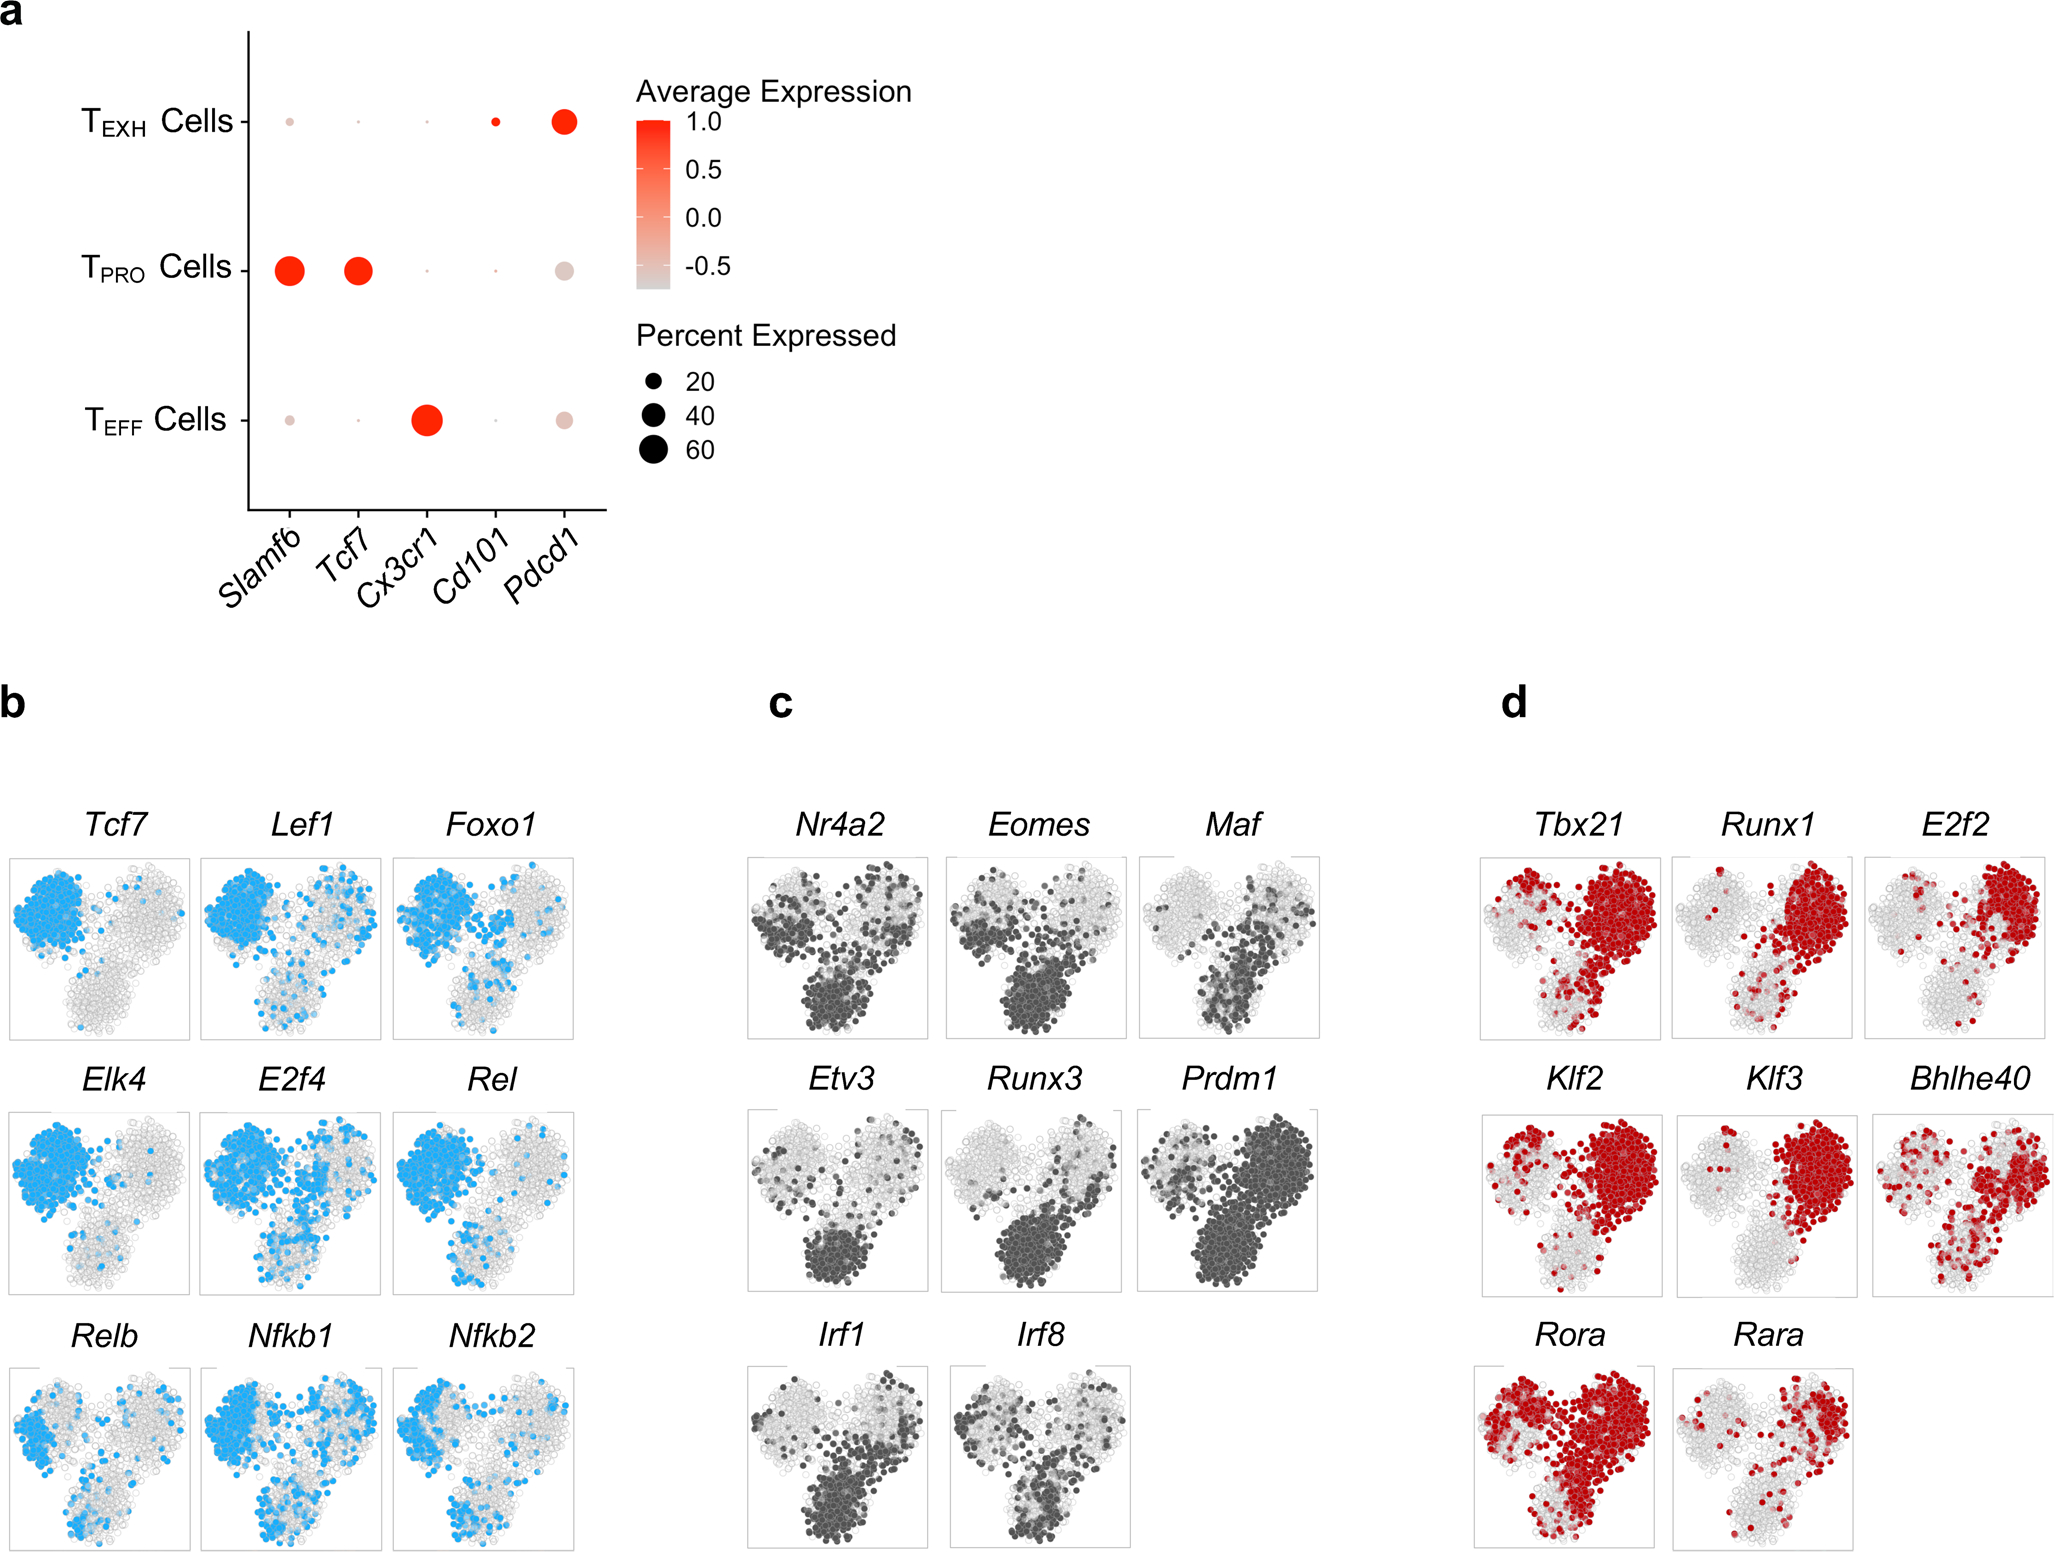
a, Dot plot showing expression of signature genes for the TPRO cells, TEFF cells, and TEXH cells. b,c,d, t-SNE projections showing binary regulon activity of cell-specific regulons for the TPRO, TEXH and TEFF subsets.
Extended Data Fig. 2 |. Unsupervised clustering analysis identified three major cell populations in the integrated dataset.
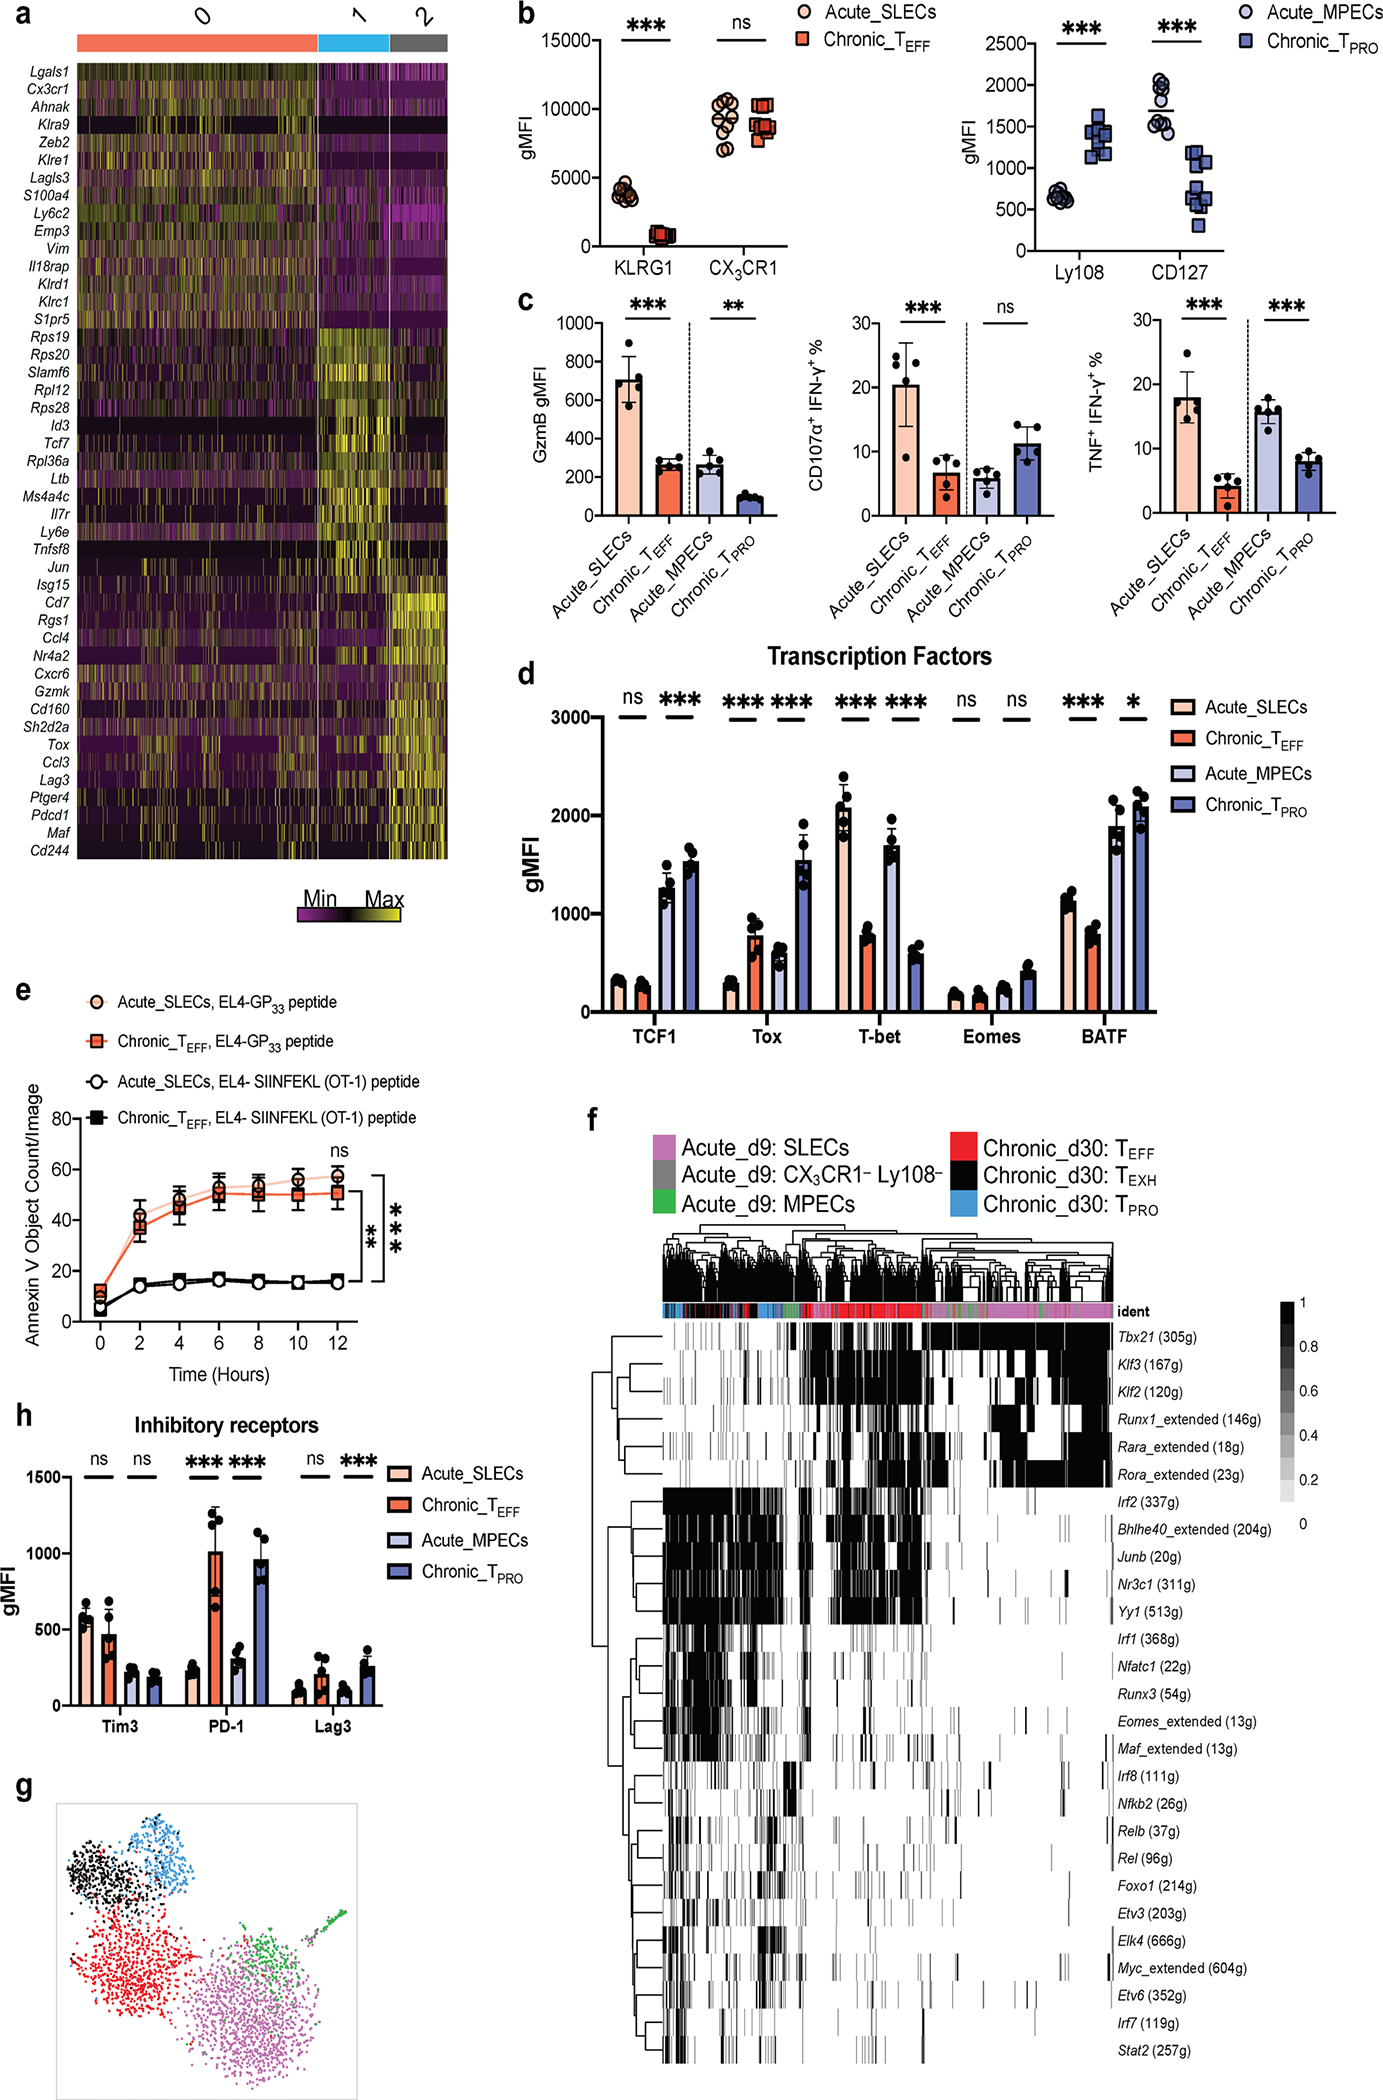
a, Heatmap showing the top 15 differentially expressed genes for each cluster as defined in Fig. 2b. Columns and rows correspond to cells and genes, respectively. Cells from the same cluster are grouped together. The color scale representing Z-Score that is generated from log2 read counts. b,c,d,e,h, Showing the comparison of CD8 T cells from day 9 post-acute infection and day 30 post-chronic infection. Cells are gated on CD8+CD44+ GP33–41+ cells. b, left. Summary data showing the expression of surface makers for SLECs and TEFF cells. b, right. Summary data showing the expression of surface makers for MPECs and TPRO cells. c, Summary data showing the expression of GzmB, proportion of CD8+ T cell degranulating (CD107a+) and producing IFN-γ, and proportion of CD8+ T cell producing TNF and IFN-γ upon ex vivo stimulation with GP33–41 peptide. d,h, Summary data showing the expression of transcription factors and inhibitory receptors. e, Summary data showing the relative cytotoxicity of SLECs and TEFF cells against peptide-pulsed target cells. f, Heatmap showing binary regulon activities of CD8 T cells from day 9 post-acute infection and day 30 post-chronic infection. g, t-SNE projection depicting clustering of cells by regulon activity. b, 10 mice for acute infection and 10 mice for chronic infection. c,d,h, 5 mice for acute infection and 5 mice for chronic infection. e, 10 mice for acute infection and 7 mice for chronic infection. b-h, Data pooled from 2 independent experiments. Data are expressed as mean ± s.e.m. ns = not significant, * p < 0.05, ** p < 0.01, *** p < 0.001. b, Unpaired t-test with two-stage step-up method of Benjamini, Krieger, and Yekutieli. c,d,e,h, Ordinary one-way ANOVA.
Extended Data Fig. 3 |. Distinct H3K4me3 and H3K27me3 patterns associated with gene expression profiles of the three CD8+ T cell subsets.
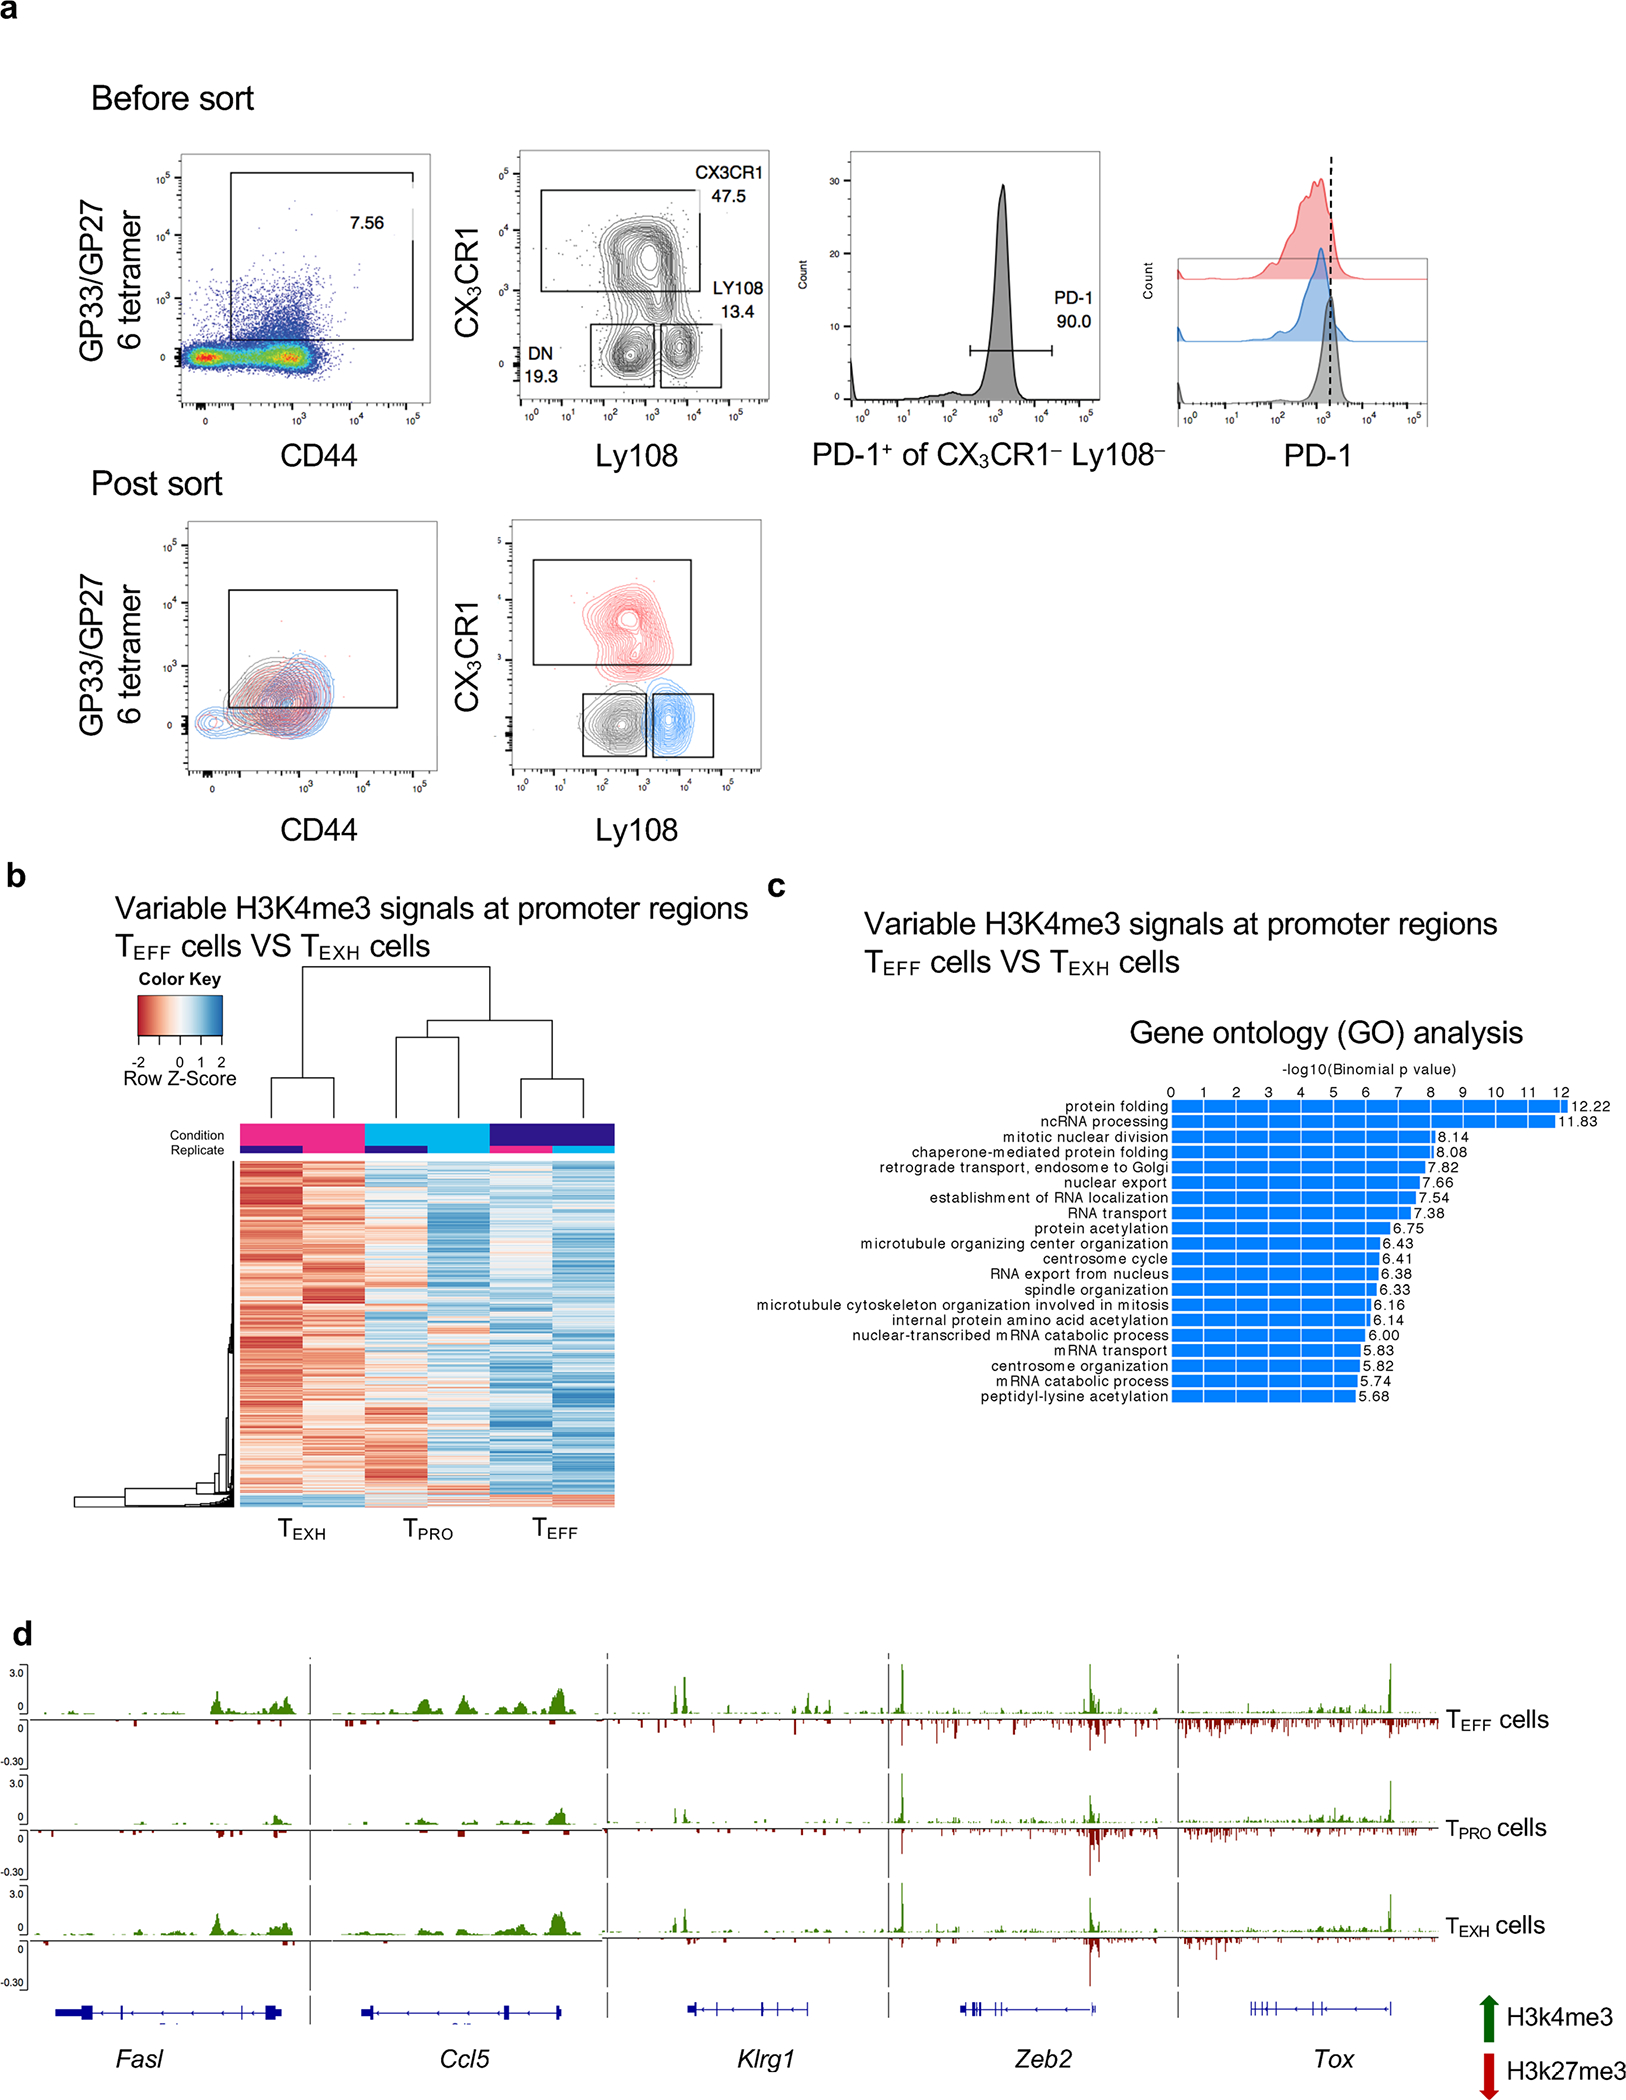
a, Sorting strategy and sort purity of GP33–41 tetramer+ or GP276–286 tetramer+ virus-specific CD8+ T cell subsets that were sorted from C57BL/6 mice at 3–5 weeks post LCMV Cl13 infection. b,c, Heatmap showing gene promoter regions that exhibited differential H3K4me3 enrichment between TEFF cells and TEXH cells. Scale bar representing Z-Score that is generated from log2 RPKM. Bar plot showing the top pathways correlated with these genes by gene ontology (GO) analysis. d, Genome track view of representative gene loci showing H3K4me3 (green, above line) or H3K27me3 (red, below line) peaks. CUT & Tag-seq data are from two independent replicates. Each replicate was pooled together from 2–3 mice.
Extended Data Fig. 4 |. Distinct enhancer repertoires regulate transcriptional programs of the three CD8+ T cell subsets.
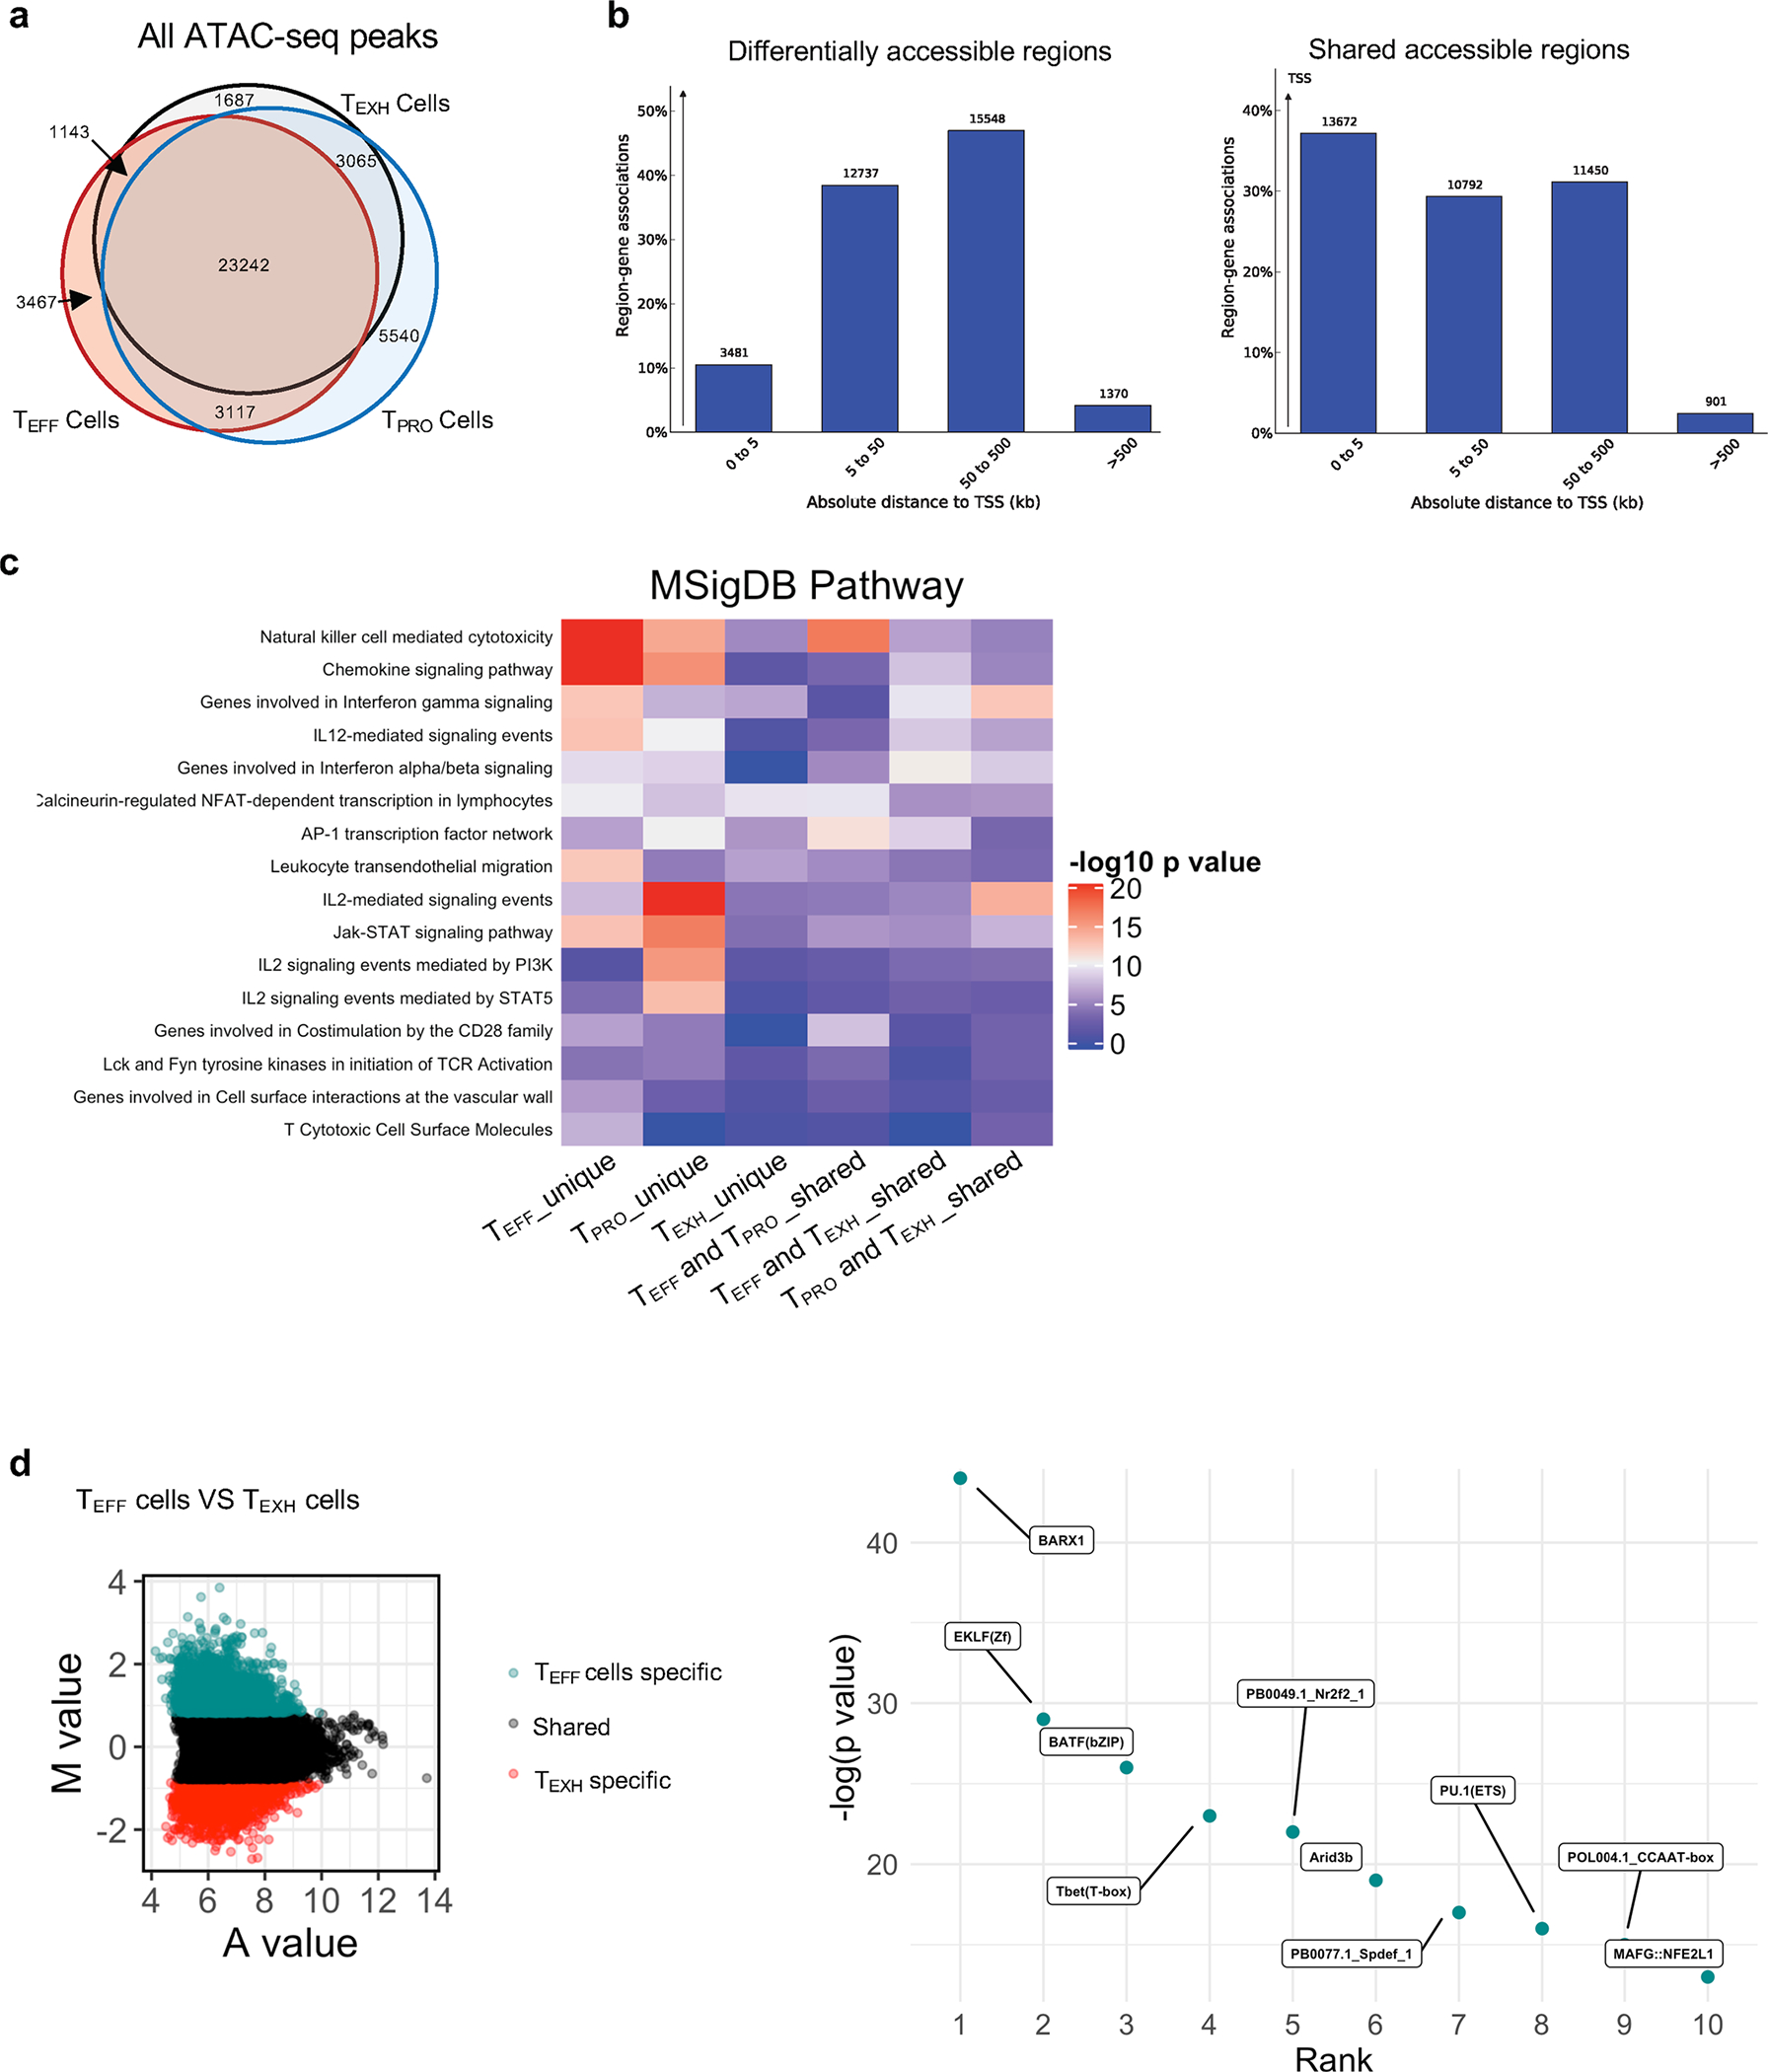
Venn diagram showing overlap of all chromatin-accessible regions (ChARs) detected by ATAC-seq. b, Bar plot showing the distance of ChARs to TSS. Left are ChARs with differential accessibility among the three CD8+ T cells subsets. Right are ChARs shared by the three subsets. c, Heatmap showing MSigDB pathway enrichment signatures in six enhancer peak sets as shown in Fig. 5c (Top). d, MA plot showing M value vs A value of the merged set of TEFF cell and TEXH cell enhancer peaks after normalization. Top 5,000 peaks are highlighted for TEFF cells (cyan) and TEXH cells (red). Dot plot showing the top 10 TFs whose motifs were significantly enriched in TEFF cell-specific enhancers compared to TEXH cell-specific enhancers.
Extended Data Fig. 5 |. Active and suppressive states of enhancer regions regulate gene expression in the three CD8 T cell subsets.
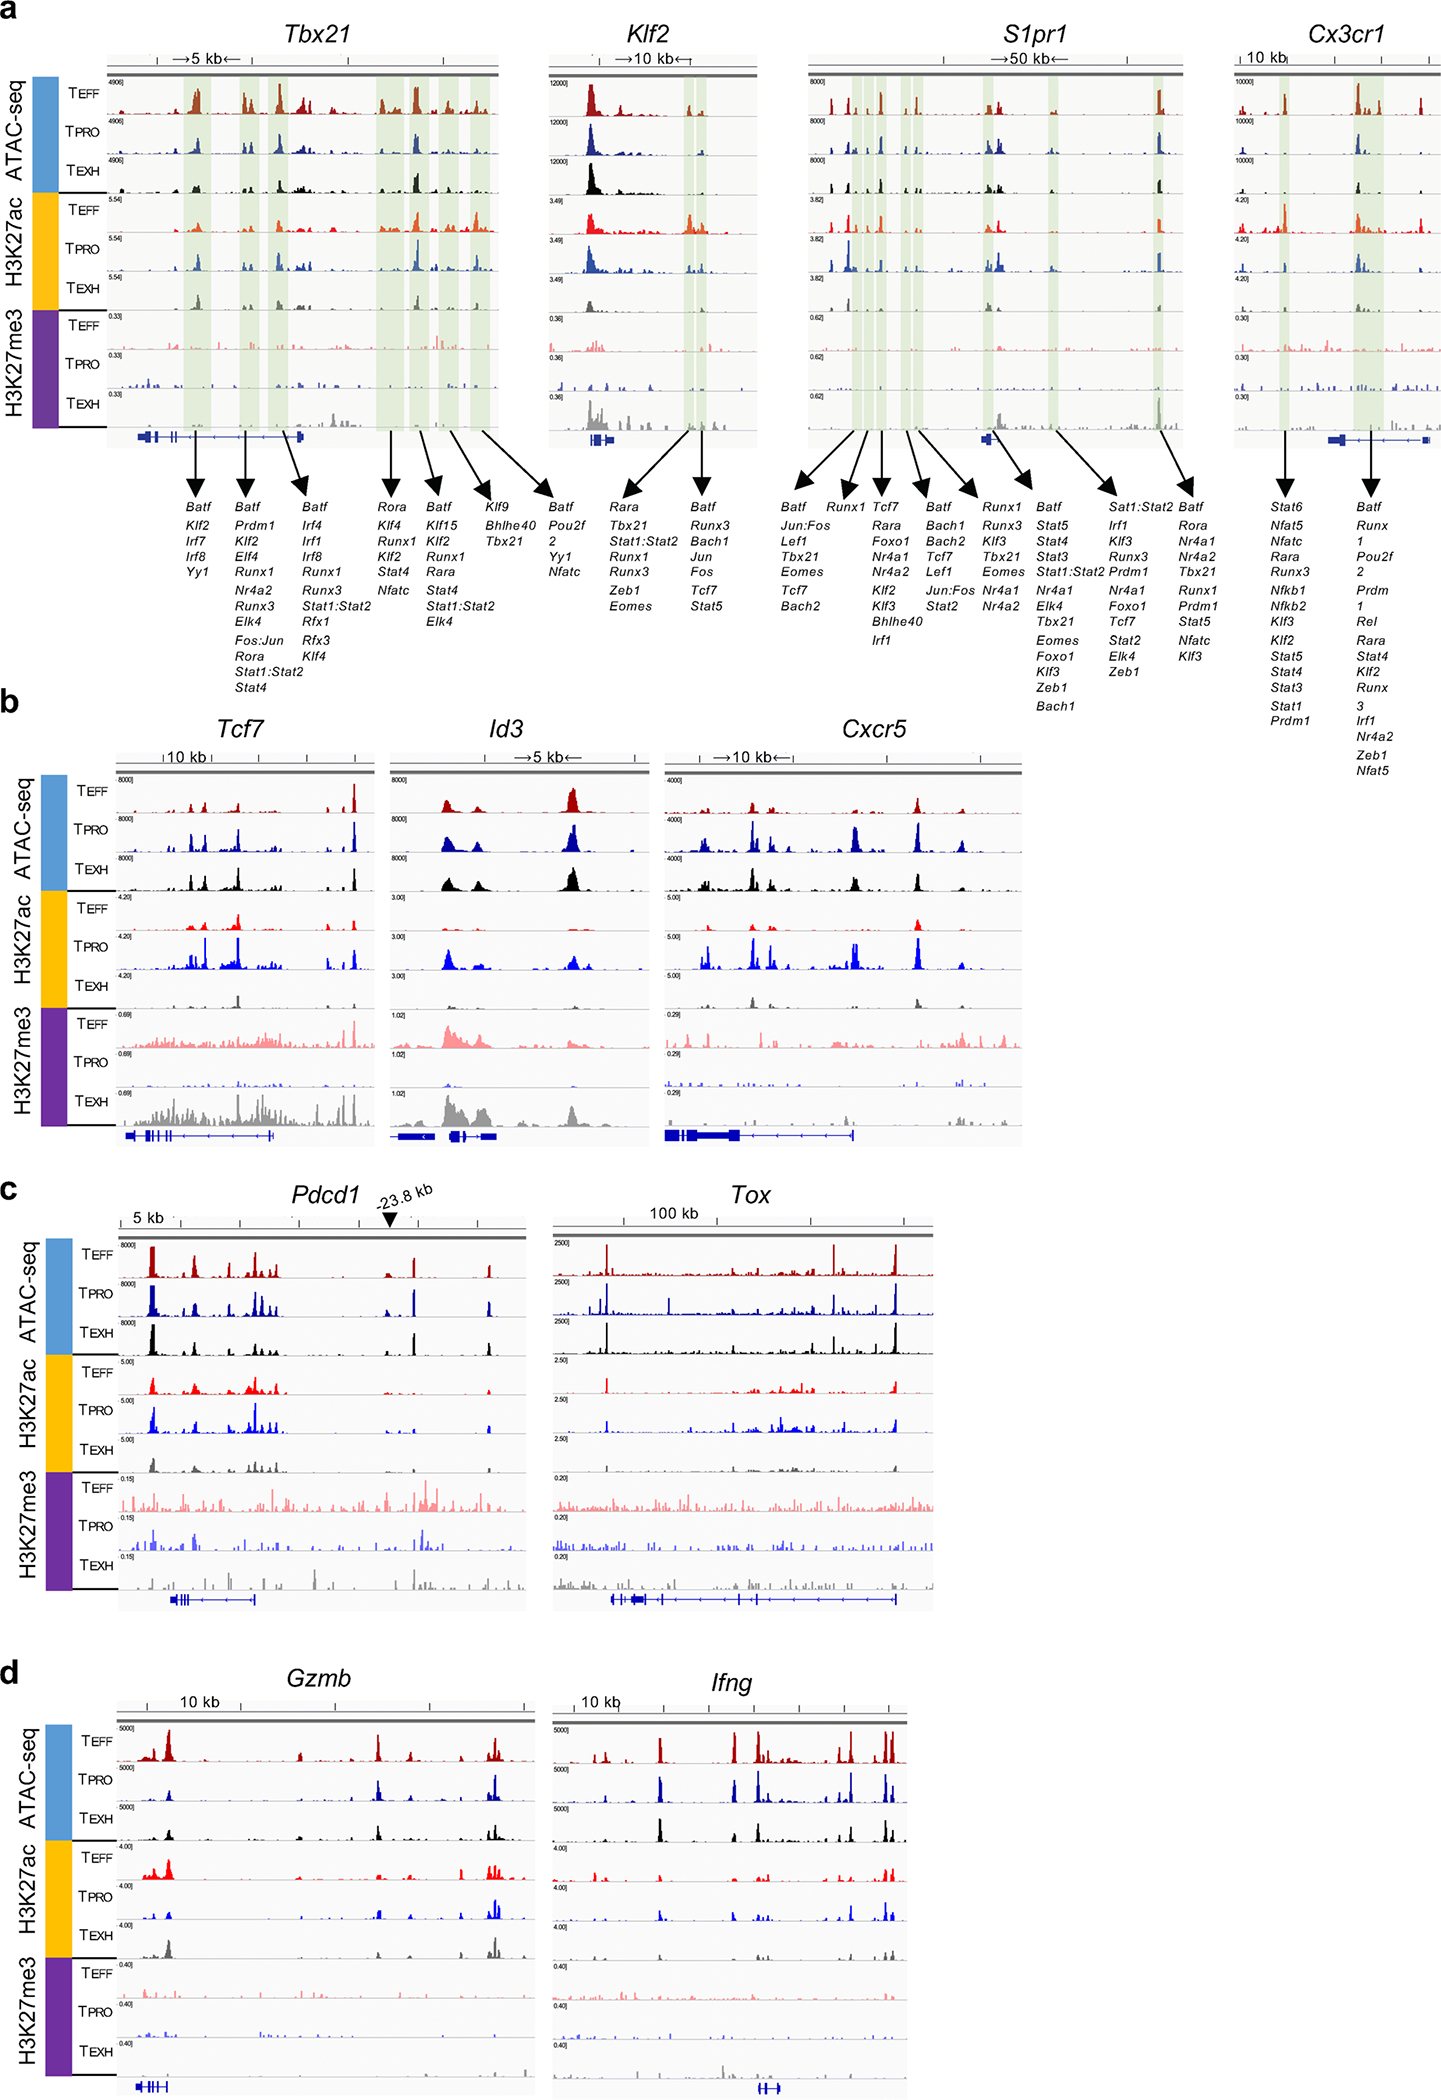
a, Genome track view of the gene loci showing ATAC-seq, H3K27ac, and H3K27me3 peaks in TPRO, TEXH and TEFF subsets, TFs with predictive binding sites at the enhancers (green shadow) were listed.
Extended Data Fig. 6 |. BATF is required for TPRO progenitor cell differentiation into TEFF cells.
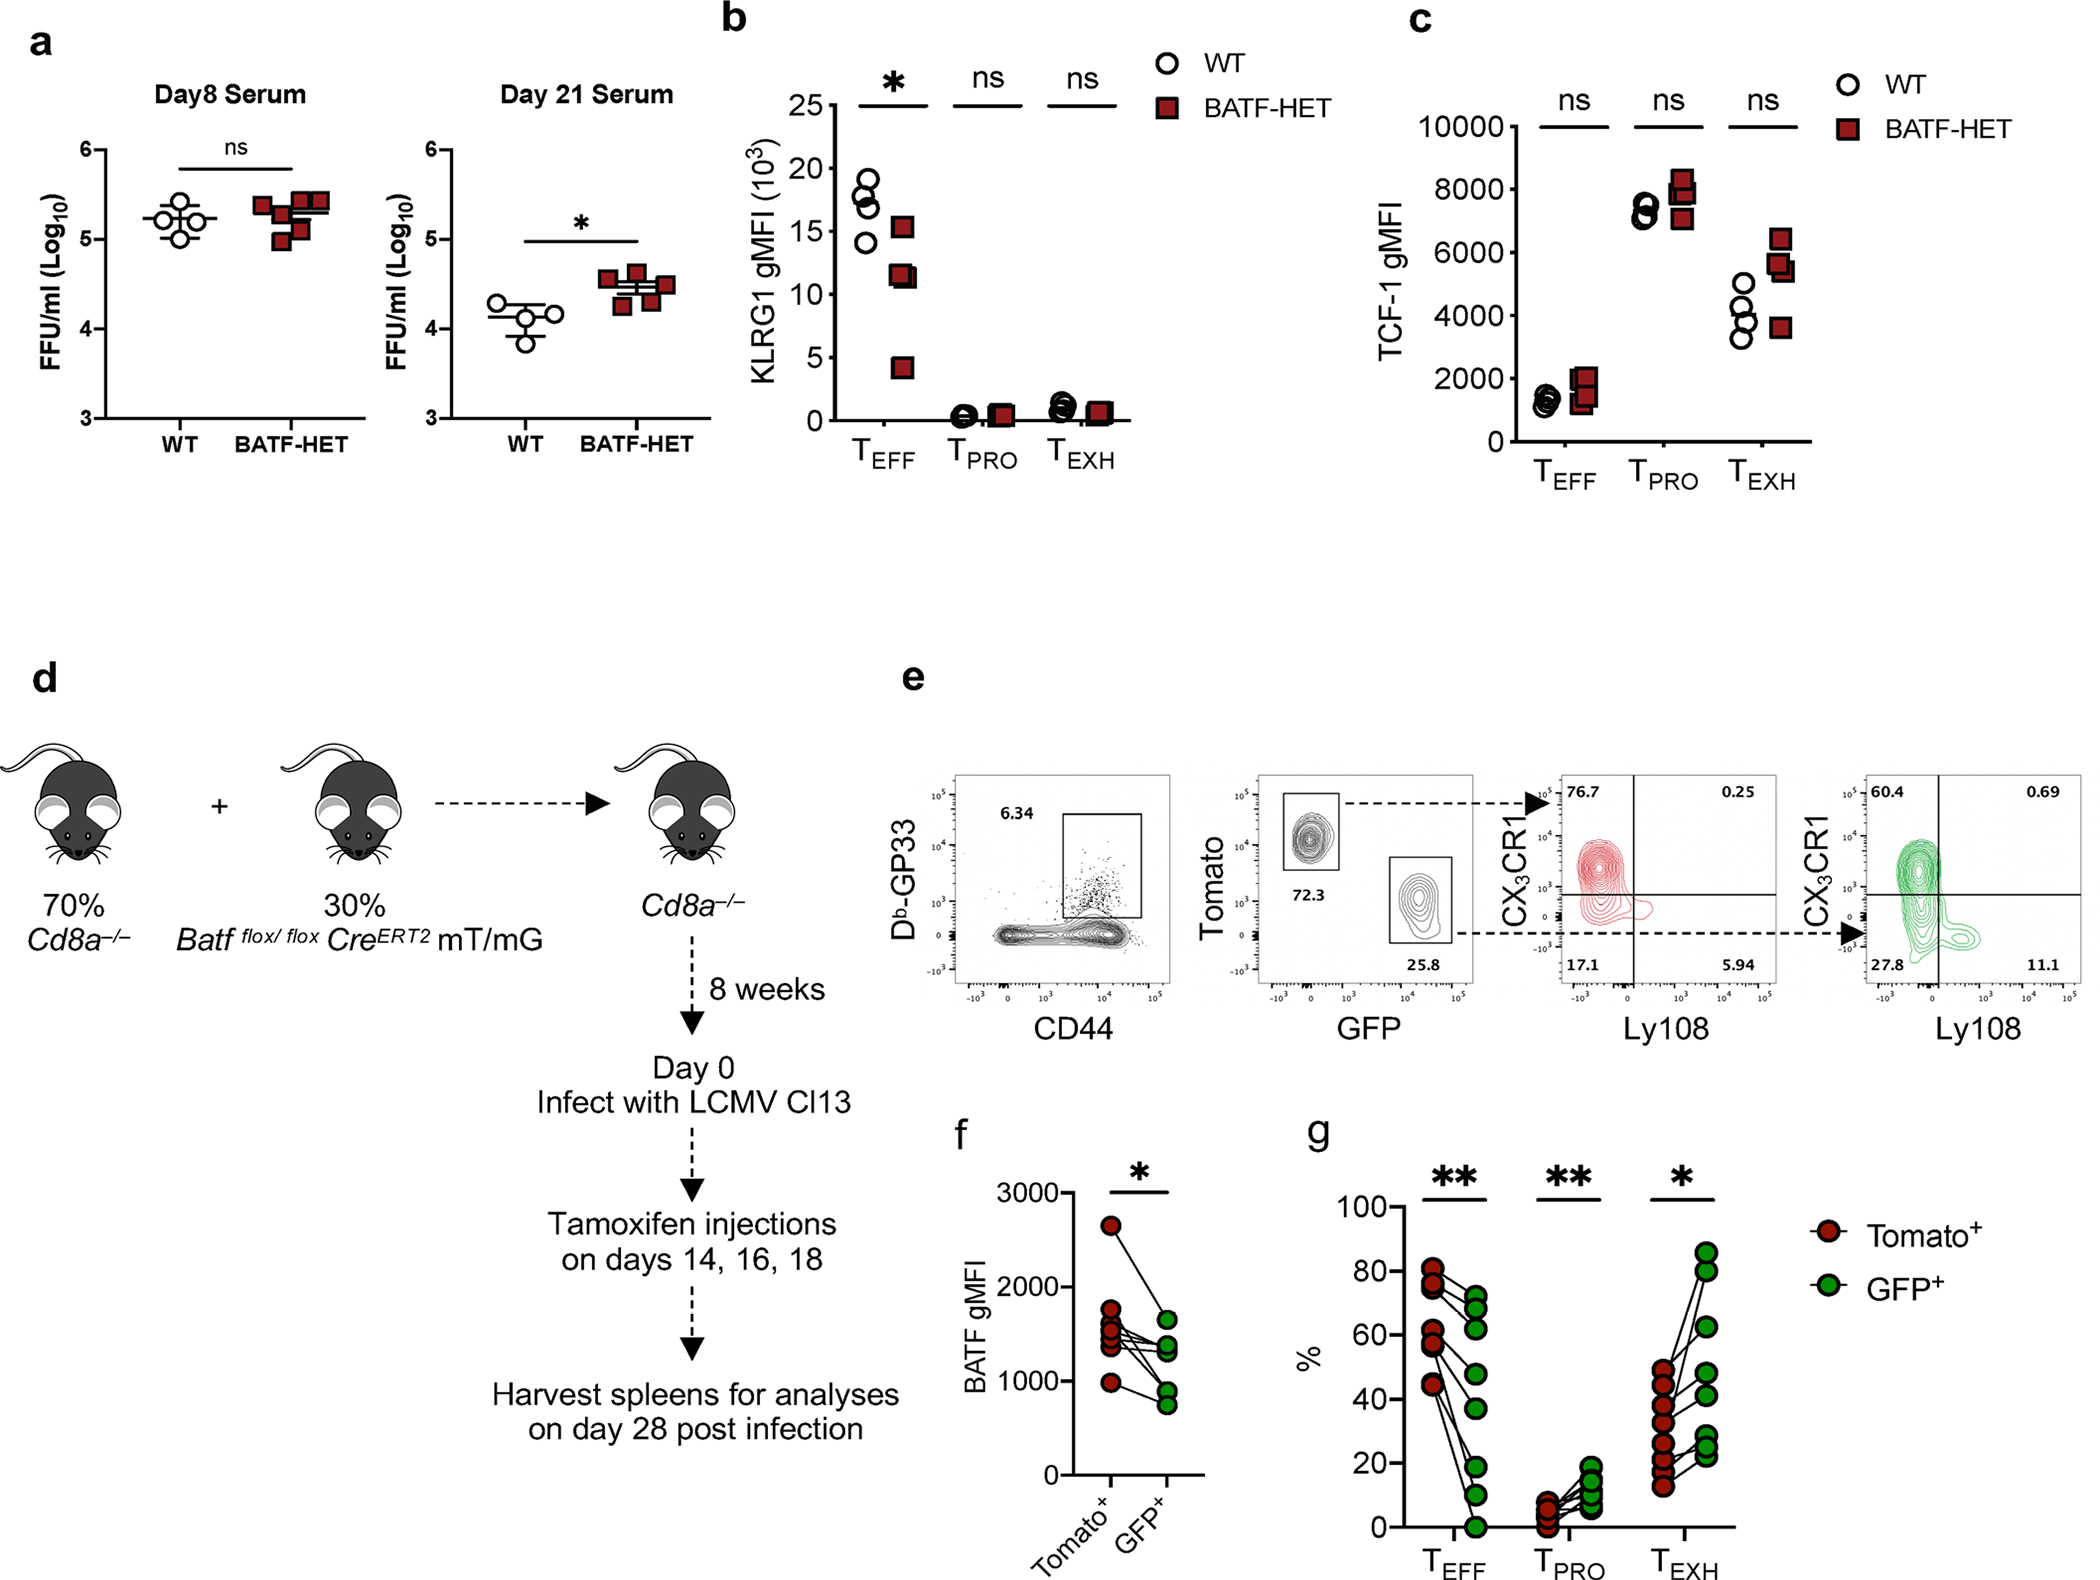
a, Summary data showing viral titers in the serum of experimental mice on day 8 p.i. and day 30 p.i. b, c, Summary data showing the relative expression of KLRG1 and TCF-1 in three virus-specific CD8+ T cell subsets. d, Experimental design. e, g, Representative flow plots and summary data showing the proportion of three antigen-specific CD8+ T cell subsets in WT and BATF deficient cells on day 28 p.i. with LCMV Cl13. f, Summary data showing the expression of BATF in WT and BATF deficient cells. a, Day 8 data was collected from 4 WT and 6 BATF-HET mice. Day 21 data was collected from 4 WT and 5 BATF-HET mice. b,c, Data was collected from 4 WT and 4 BATF-HET mice. f,g, Data was collected from 8 Batf flox/flox CreERT2 mT/mG mice. c-j, Data pooled from 2 independent experiments. Data are expressed as mean ± s.e.m. ns = not significant, * p < 0.05, ** p < 0.01, *** p < 0.001. a, Two-tailed unpaired t-test. b,c, Unpaired t-test with Holm-Šídák method. f, Two-tailed paired t-test. g, Paired t-test with two-stage step-up method of Benjamini, Krieger, and Yekutieli.
Extended Data Fig. 7 |. BATF regulates chromatin accessibility of CD8+ T cells during chronic infection.
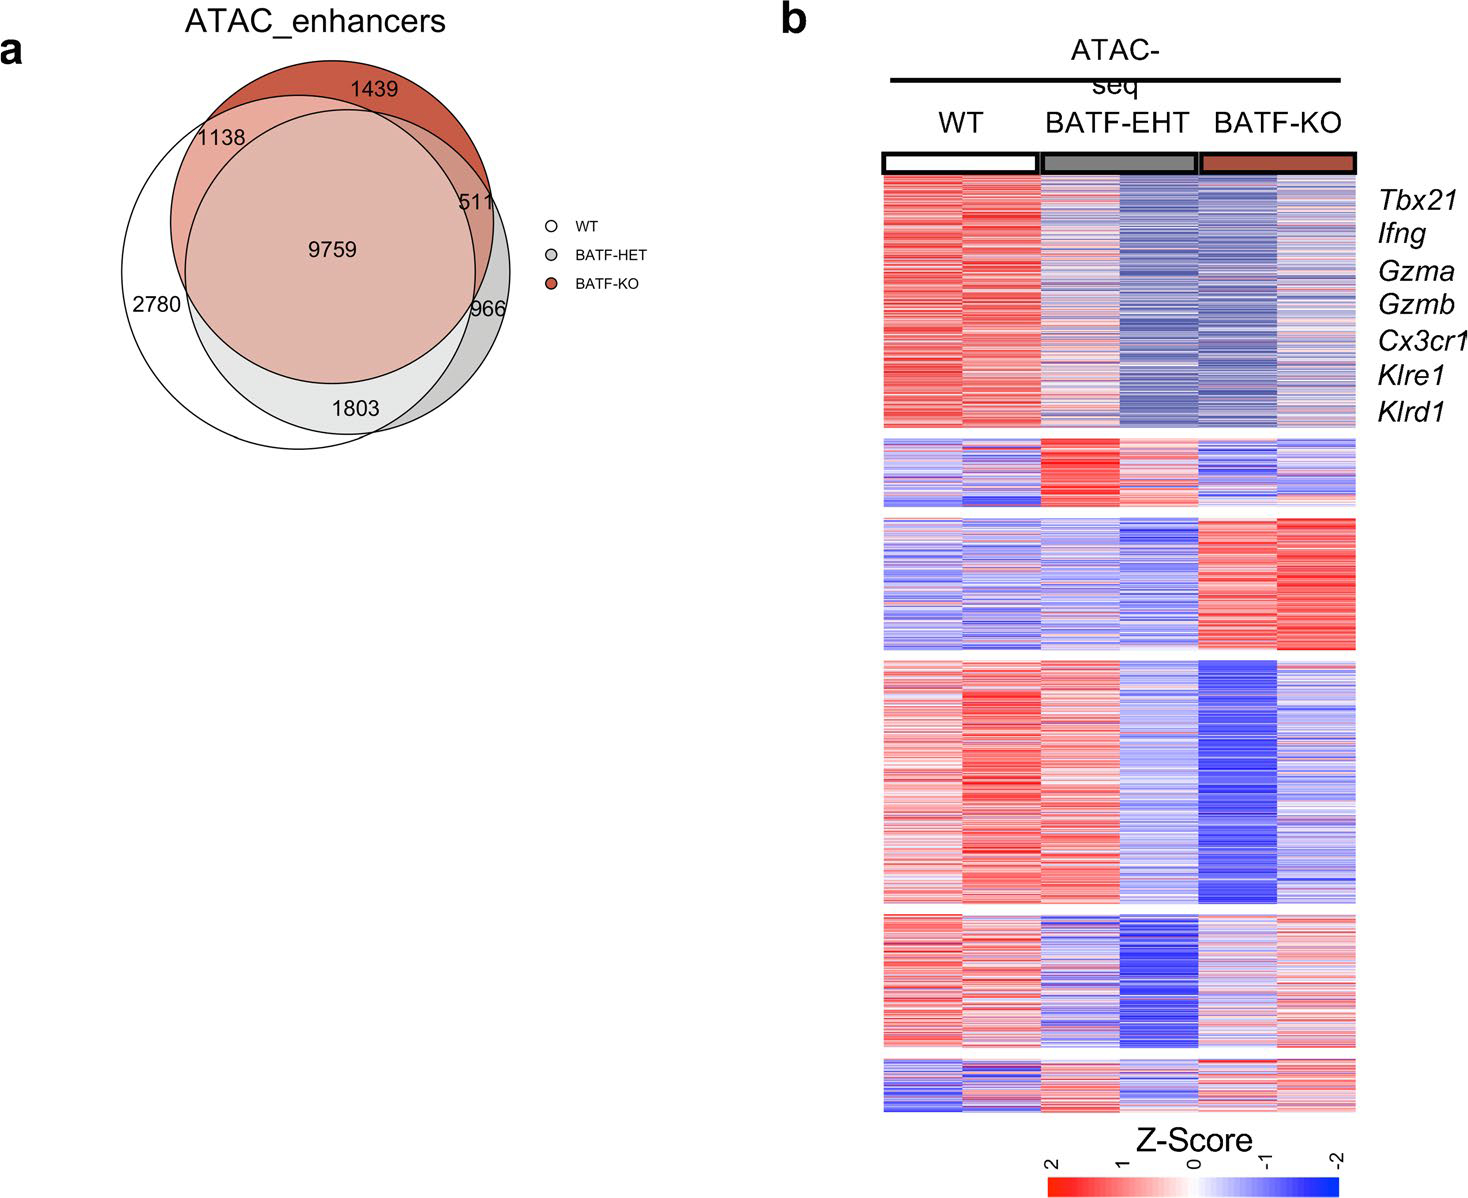
Gzmb−Cre+;Batf+/+;RosamT/mG (WT), Gzmb-Cre+;Batffl/+;RosamT/mG (BATF-HET), and Gzmb-Cre+;Batffl/fl;RosamT/mG mice (BATF-KO) were used for this experiment. At 4 weeks post-LCMV Cl13 infection, CD8+CD44+GFP+ cells, which represent polyclonal LCMV-specific CD8+ T cells, were FACS sorted to perform ATAC-seq experiments. a, Venn diagram showing overlapping and unique enhancer regions in WT, BATF-HET, and BATF-KO CD8+ T cells b, Heatmap showing enhancer regions with differential accessibility. Scale bar representing Z-Score that is generated from log2 FPKM. Each replicate was an individual mouse.
Extended Data Fig. 8 |. Genome track view of Pdcd1, Tcf7, Id3, Cxcr5, Cx3cr1, and Irf8.
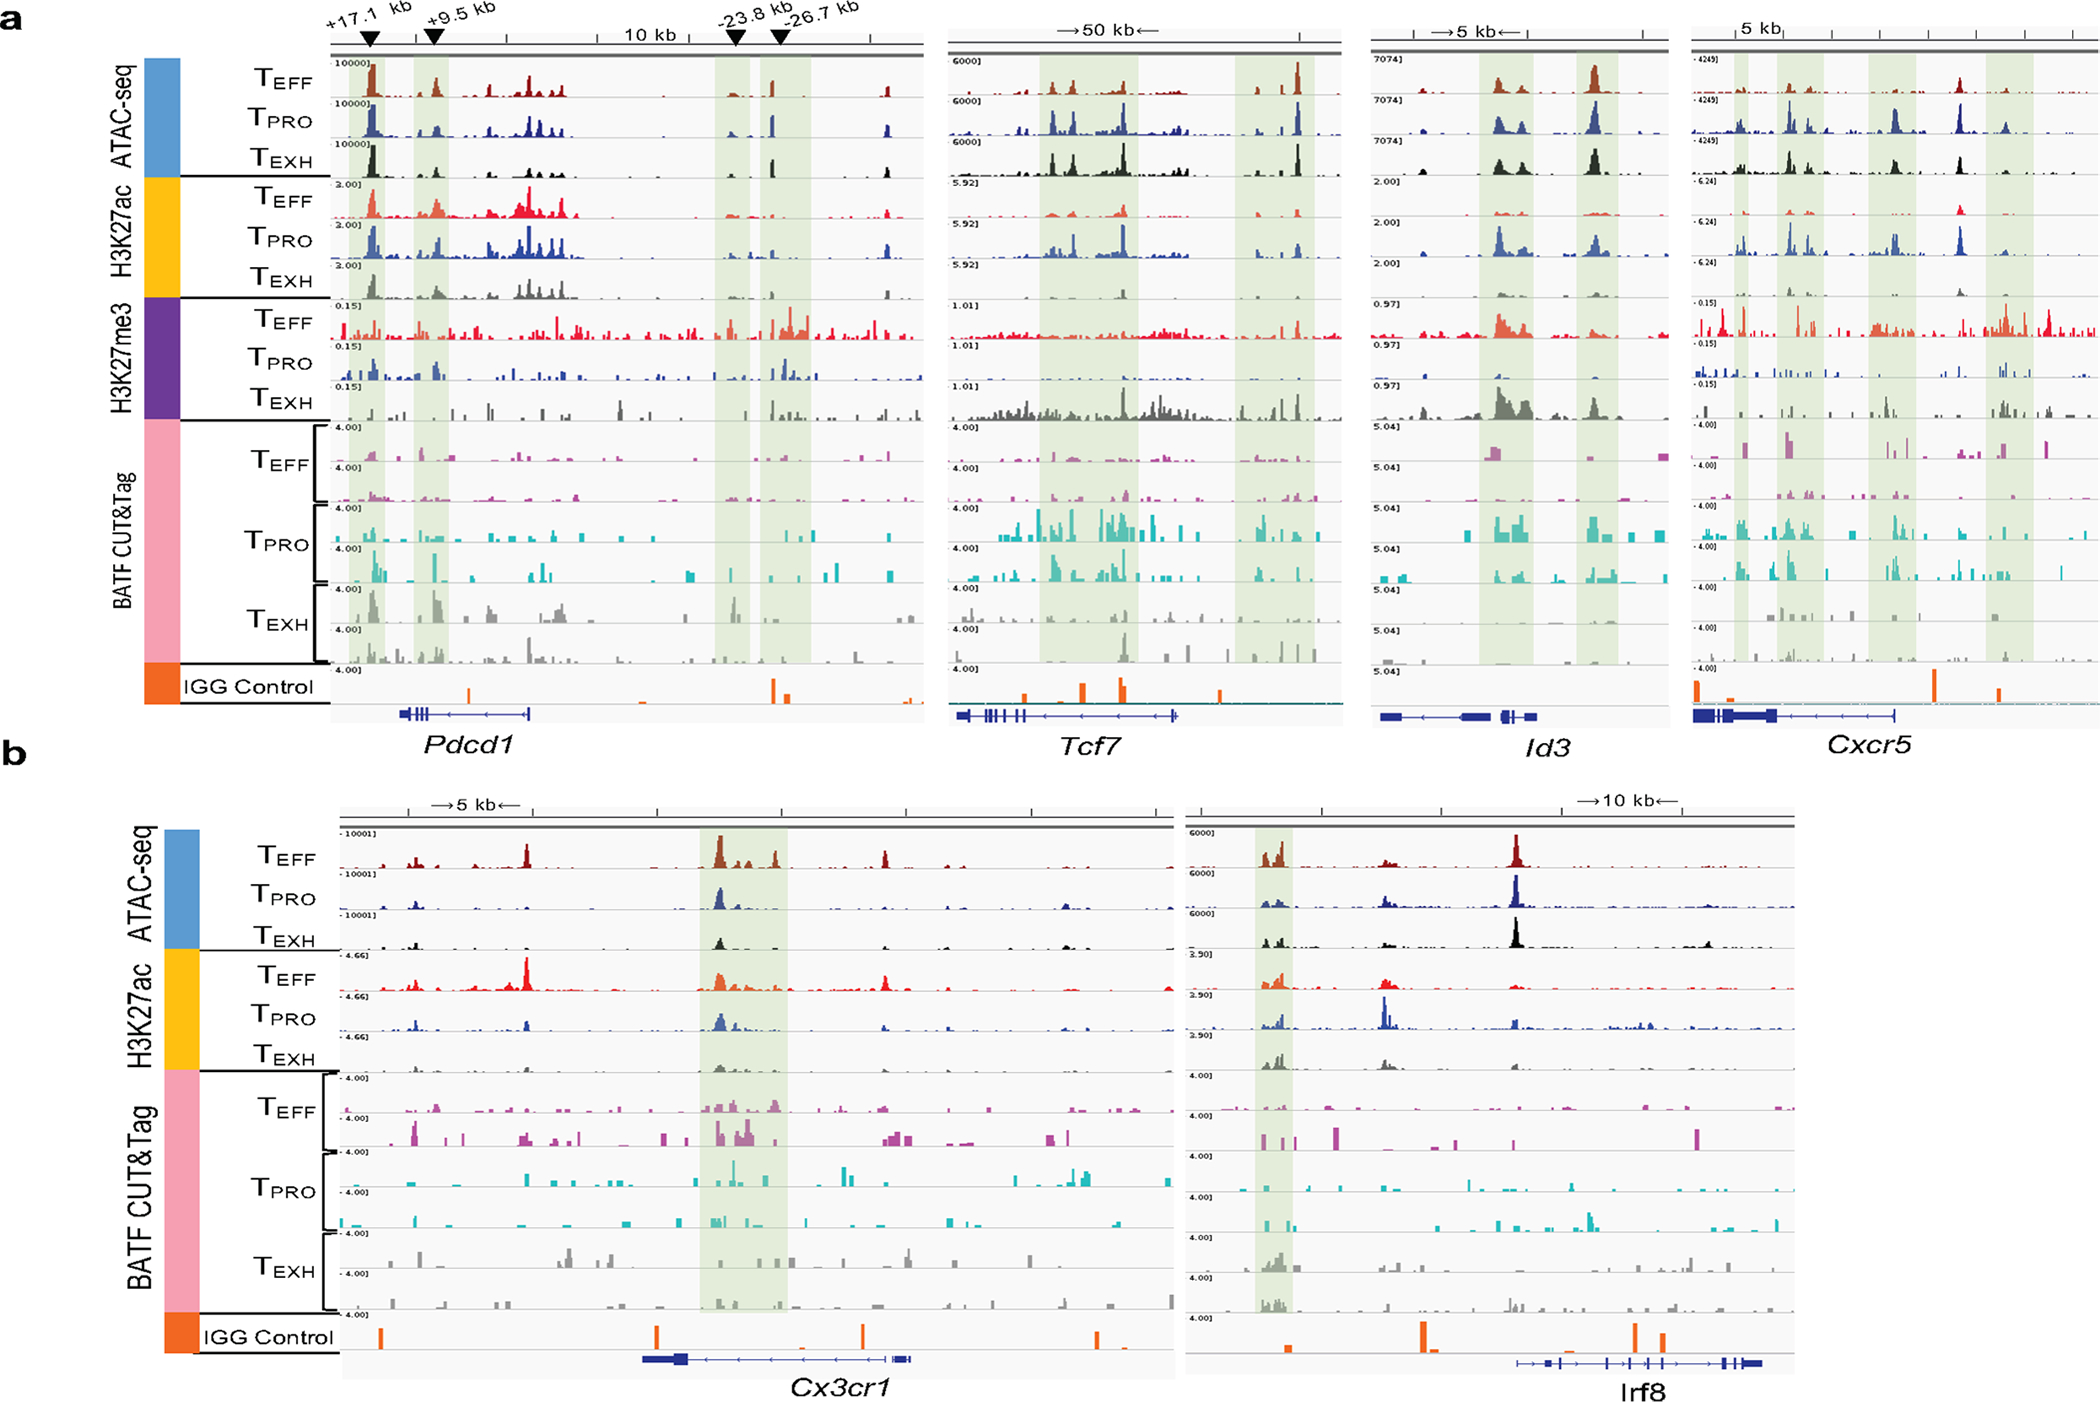
a,b, Genome track view of the gene loci showing ATAC-seq, H3K27ac, and BATF CUT&Tag peaks in TPRO, TEXH and TEFF subsets.
Supplementary Material
Acknowledgements
This work is supported by NIH grants AI125741 (W.C.), AI148403 (W.C.), AI153537 (R.A.Z.), DK108557 (D.M.S.) and DK127526 (M.Y.K.); by an American Cancer Society Research Scholar grant (W.C.); and by an Advancing a Healthier Wisconsin Endowment grant (W.C.). R.A.Z. is supported by a Cancer Research Institute Irvington fellowship. D.M.S. and M.Y.K. are members of the Medical Scientist Training Program at the MCW, which is partially supported by a training grant from the NIGMS (T32-GM080202). This research was completed in part with computational resources and technical support provided by the Research Computing Center at the MCW. We thank S. Henikoff for providing the 3×Flag-pA-Tn5-Fl plasmid and N. Zhu for providing the protein A–Tn5 fusion protein.
Footnotes
Competing interests
The authors declare no competing interests.
Additional information
Extended data is available for this paper at https://doi.org/10.1038/s41590-021-00965-7.
Supplementary information The online version contains supplementary material available at https://doi.org/10.1038/s41590-021-00965-7.
References
- 1.Wherry EJ & Kurachi M Molecular and cellular insights into T cell exhaustion. Nat. Rev. Immunol. 15, 486–499 (2015). [DOI] [PMC free article] [PubMed] [Google Scholar]
- 2.He R et al. Follicular CXCR5-expressing CD8+ T cells curtail chronic viral infection. Nature 537, 412–428 (2016). [DOI] [PubMed] [Google Scholar]
- 3.Im SJ et al. Defining CD8+ T cells that provide the proliferative burst after PD-1 therapy. Nature 537, 417–421 (2016). [DOI] [PMC free article] [PubMed] [Google Scholar]
- 4.Utzschneider DT et al. T cell factor 1-expressing memory-like CD8+ T cells sustain the immune response to chronic viral infections. Immunity 45, 415–427 (2016). [DOI] [PubMed] [Google Scholar]
- 5.Leong YA et al. CXCR5+ follicular cytotoxic T cells control viral infection in B cell follicles. Nat. Immunol. 17, 1187–1196 (2016). [DOI] [PubMed] [Google Scholar]
- 6.Wu T et al. The TCF1–Bcl6 axis counteracts type I interferon to repress exhaustion and maintain T cell stemness. Sci. Immunol. 1, eaai8593 (2016). [DOI] [PMC free article] [PubMed] [Google Scholar]
- 7.Chen Z et al. TCF-1-centered transcriptional network drives an effector versus exhausted CD8 T cell-fate decision. Immunity 51, 840–855 (2019). [DOI] [PMC free article] [PubMed] [Google Scholar]
- 8.Zander R et al. CD4+ T cell help is required for the formation of a cytolytic CD8+ T cell subset that protects against chronic infection and cancer. Immunity 51, 1028–1042 (2019). [DOI] [PMC free article] [PubMed] [Google Scholar]
- 9.Chen J et al. NR4A transcription factors limit CAR T cell function in solid tumours. Nature 567, 530–534 (2019). [DOI] [PMC free article] [PubMed] [Google Scholar]
- 10.Liu X et al. Genome-wide analysis identifies NR4A1 as a key mediator of T cell dysfunction. Nature 567, 525–529 (2019). [DOI] [PMC free article] [PubMed] [Google Scholar]
- 11.Paley MA et al. Progenitor and terminal subsets of CD8+ T cells cooperate to contain chronic viral infection. Science 338, 1220–1225 (2012). [DOI] [PMC free article] [PubMed] [Google Scholar]
- 12.Man K et al. Transcription factor IRF4 promotes CD8+ T cell exhaustion and limits the development of memory-like T cells during chronic infection. Immunity 47, 1129–1141 (2017). [DOI] [PubMed] [Google Scholar]
- 13.Martinez GJ et al. The transcription factor NFAT promotes exhaustion of activated CD8+ T cells. Immunity 42, 265–278 (2015). [DOI] [PMC free article] [PubMed] [Google Scholar]
- 14.Staron MM et al. The transcription factor FoxO1 sustains expression of the inhibitory receptor PD-1 and survival of antiviral CD8+ T cells during chronic infection. Immunity 41, 802–814 (2014). [DOI] [PMC free article] [PubMed] [Google Scholar]
- 15.Shin H et al. A role for the transcriptional repressor Blimp-1 in CD8+ T cell exhaustion during chronic viral infection. Immunity 31, 309–320 (2009). [DOI] [PMC free article] [PubMed] [Google Scholar]
- 16.Alfei F et al. TOX reinforces the phenotype and longevity of exhausted T cells in chronic viral infection. Nature 571, 265–269 (2019). [DOI] [PubMed] [Google Scholar]
- 17.Khan O et al. TOX transcriptionally and epigenetically programs CD8+ T cell exhaustion. Nature 571, 211–218 (2019). [DOI] [PMC free article] [PubMed] [Google Scholar]
- 18.Scott AC et al. TOX is a critical regulator of tumour-specific T cell differentiation. Nature 571, 270–274 (2019). [DOI] [PMC free article] [PubMed] [Google Scholar]
- 19.Yao C et al. Single-cell RNA-seq reveals TOX as a key regulator of CD8+ T cell persistence in chronic infection. Nat. Immunol. 20, 890–901 (2019). [DOI] [PMC free article] [PubMed] [Google Scholar]
- 20.Henning AN, Roychoudhuri R & Restifo NP Epigenetic control of CD8+ T cell differentiation. Nat. Rev. Immunol. 18, 340–356 (2018). [DOI] [PMC free article] [PubMed] [Google Scholar]
- 21.Sen DR et al. The epigenetic landscape of T cell exhaustion. Science 354, 1165–1169 (2016). [DOI] [PMC free article] [PubMed] [Google Scholar]
- 22.Pauken KE et al. Epigenetic stability of exhausted T cells limits durability of reinvigoration by PD-1 blockade. Science 354, 1160–1165 (2016). [DOI] [PMC free article] [PubMed] [Google Scholar]
- 23.Ghoneim HE et al. De novo epigenetic programs inhibit PD-1 blockade-mediated T cell rejuvenation. Cell 170, 142–157 (2017). [DOI] [PMC free article] [PubMed] [Google Scholar]
- 24.Xin G et al. A critical role of IL-21-induced BATF in sustaining CD8-T-cell-mediated chronic viral control. Cell Rep. 13, 1118–1124 (2015). [DOI] [PMC free article] [PubMed] [Google Scholar]
- 25.Cheung KL et al. Distinct roles of Brd2 and Brd4 in potentiating the transcriptional program for TH17 cell differentiation. Mol. Cell 65, 1068–1080 (2017). [DOI] [PMC free article] [PubMed] [Google Scholar]
- 26.Kurachi M et al. The transcription factor BATF operates as an essential differentiation checkpoint in early effector CD8+ T cells. Nat. Immunol. 15, 373–383 (2014). [DOI] [PMC free article] [PubMed] [Google Scholar]
- 27.Ciofani M et al. A validated regulatory network for TH17 cell specification. Cell 151, 289–303 (2012). [DOI] [PMC free article] [PubMed] [Google Scholar]
- 28.Hudson WH et al. Proliferating transitory T cells with an effector-like transcriptional signature emerge from PD-1+ stem-like CD8+ T cells during chronic infection. Immunity 51, 1043–1058 (2019). [DOI] [PMC free article] [PubMed] [Google Scholar]
- 29.Rao RR, Li Q, Gubbels Bupp MR & Shrikant PA Transcription factor Foxo1 represses T-bet-mediated effector functions and promotes memory CD8+ T cell differentiation. Immunity 36, 374–387 (2012). [DOI] [PMC free article] [PubMed] [Google Scholar]
- 30.Zhou X & Xue H-H Cutting edge: generation of memory precursors and functional memory CD8+ T cells depends on T cell factor-1 and lymphoid enhancer-binding factor-1. J. Immunol. 189, 2722–2726 (2012). [DOI] [PMC free article] [PubMed] [Google Scholar]
- 31.Bancos S, Cao Q, Bowers WJ & Crispe IN Dysfunctional memory CD8+ T cells after priming in the absence of the cell cycle regulator E2F4. Cell. Immunol. 257, 44–54 (2009). [DOI] [PMC free article] [PubMed] [Google Scholar]
- 32.Utzschneider DT et al. Active maintenance of T cell memory in acute and chronic viral infection depends on continuous expression of FOXO1. Cell Rep. 22, 3454–3467 (2018). [DOI] [PMC free article] [PubMed] [Google Scholar]
- 33.Miller BC et al. Subsets of exhausted CD8+ T cells differentially mediate tumor control and respond to checkpoint blockade. Nat. Immunol. 20, 326–336 (2019). [DOI] [PMC free article] [PubMed] [Google Scholar]
- 34.Dominguez CX et al. The transcription factors ZEB2 and T-bet cooperate to program cytotoxic T cell terminal differentiation in response to LCMV viral infection. J. Exp. Med. 212, 2041–2056 (2015). [DOI] [PMC free article] [PubMed] [Google Scholar]
- 35.Omilusik KD et al. Transcriptional repressor ZEB2 promotes terminal differentiation of CD8+ effector and memory T cell populations during infection. J. Exp. Med. 212, 2027–2039 (2015). [DOI] [PMC free article] [PubMed] [Google Scholar]
- 36.Joshi NS et al. Inflammation directs memory precursor and short-lived effector CD8+ T cell fates via the graded expression of T-bet transcription factor. Immunity 27, 281–295 (2007). [DOI] [PMC free article] [PubMed] [Google Scholar]
- 37.Intlekofer AM et al. Effector and memory CD8+ T cell fate coupled by T-bet and eomesodermin. Nat. Immunol. 6, 1236–1244 (2005). [DOI] [PubMed] [Google Scholar]
- 38.Beltra JC et al. Developmental relationships of four exhausted CD8+ T cell subsets reveals underlying transcriptional and epigenetic landscape control mechanisms. Immunity 52, 825–841 (2020). [DOI] [PMC free article] [PubMed] [Google Scholar]
- 39.Kao C et al. Transcription factor T-bet represses expression of the inhibitory receptor PD-1 and sustains virus-specific CD8+ T cell responses during chronic infection. Nat. Immunol. 12, 663–671 (2011). [DOI] [PMC free article] [PubMed] [Google Scholar]
- 40.Anderson AC et al. T-bet, a TH1 transcription factor regulates the expression of Tim-3. Eur. J. Immunol. 40, 859–866 (2010). [DOI] [PMC free article] [PubMed] [Google Scholar]
- 41.Crompton JG et al. Lineage relationship of CD8+ T cell subsets is revealed by progressive changes in the epigenetic landscape. Cell. Mol. Immunol. 13, 502–513 (2016). [DOI] [PMC free article] [PubMed] [Google Scholar]
- 42.Russ BE et al. Distinct epigenetic signatures delineate transcriptional programs during virus-specific CD8+ T cell differentiation. Immunity 41, 853–865 (2014). [DOI] [PMC free article] [PubMed] [Google Scholar]
- 43.Jadhav RR et al. Epigenetic signature of PD-1+ TCF1+ CD8 T cells that act as resource cells during chronic viral infection and respond to PD-1 blockade. Proc. Natl Acad. Sci. USA 116, 14113–14118 (2019). [DOI] [PMC free article] [PubMed] [Google Scholar]
- 44.Scott-Browne JP et al. Dynamic changes in chromatin accessibility occur in CD8+ T cells responding to viral infection. Immunity 45, 1327–1340 (2016). [DOI] [PMC free article] [PubMed] [Google Scholar]
- 45.Wei J et al. Targeting REGNASE-1 programs long-lived effector T cells for cancer therapy. Nature 576, 471–476 (2019). [DOI] [PMC free article] [PubMed] [Google Scholar]
- 46.Murphy TL, Tussiwand R & Murphy KM Specificity through cooperation: BATF–IRF interactions control immune-regulatory networks. Nat. Rev. Immunol. 13, 499–509 (2013). [DOI] [PubMed] [Google Scholar]
- 47.Grigoryan G, Reinke AW & Keating AE Design of protein-interaction specificity gives selective bZIP-binding peptides. Nature 458, 859–864 (2009). [DOI] [PMC free article] [PubMed] [Google Scholar]
- 48.Glasmacher E et al. A genomic regulatory element that directs assembly and function of immune-specific AP-1–IRF complexes. Science 338, 975–980 (2012). [DOI] [PMC free article] [PubMed] [Google Scholar]
- 49.Li P et al. BATF–JUN is critical for IRF4-mediated transcription in T cells. Nature 490, 543–546 (2012). [DOI] [PMC free article] [PubMed] [Google Scholar]
- 50.Betz BC et al. Batf coordinates multiple aspects of B and T cell function required for normal antibody responses. J. Exp. Med. 207, 933–942 (2010). [DOI] [PMC free article] [PubMed] [Google Scholar]
- 51.Schauder DM et al. E2A-regulated epigenetic landscape promotes memory CD8 T cell differentiation. Proc. Natl Acad. Sci. USA 118, e2013452118 (2021). [DOI] [PMC free article] [PubMed] [Google Scholar]
- 52.Aibar S et al. SCENIC: single-cell regulatory network inference and clustering. Nat. Methods 14, 1083–1086 (2017). [DOI] [PMC free article] [PubMed] [Google Scholar]
- 53.Stuart T et al. Comprehensive integration of single-cell data. Cell 177, 1888–1902 (2019). [DOI] [PMC free article] [PubMed] [Google Scholar]
- 54.Kaya-Okur HS et al. CUT&Tag for efficient epigenomic profiling of small samples and single cells. Nat. Commun. 10, 1930 (2019). [DOI] [PMC free article] [PubMed] [Google Scholar]
- 55.Langmead B & Salzberg SL Fast gapped-read alignment with Bowtie 2. Nat. Methods 9, 357–359 (2012). [DOI] [PMC free article] [PubMed] [Google Scholar]
- 56.Meers MP, Tenenbaum D & Henikoff S Peak calling by Sparse Enrichment Analysis for CUT&RUN chromatin profiling. Epigenetics Chromatin 12, 42 (2019). [DOI] [PMC free article] [PubMed] [Google Scholar]
- 57.Heinz S et al. Simple combinations of lineage-determining transcription factors prime cis-regulatory elements required for macrophage and B cell identities. Mol. Cell 38, 576–589 (2010). [DOI] [PMC free article] [PubMed] [Google Scholar]
- 58.Ye T, Ravens S, Krebs AR & Tora L Interpreting and visualizing ChIP–seq data with the seqMINER software. Methods Mol. Biol. 1150, 141–152 (2014). [DOI] [PubMed] [Google Scholar]
- 59.Buenrostro JD, Giresi PG, Zaba LC, Chang HY & Greenleaf WJ Transposition of native chromatin for fast and sensitive epigenomic profiling of open chromatin, DNA-binding proteins and nucleosome position. Nat. Methods 10, 1213–1218 (2013). [DOI] [PMC free article] [PubMed] [Google Scholar]
- 60.Li H et al. The Sequence Alignment/Map format and SAMtools. Bioinformatics 25, 2078–2079 (2009). [DOI] [PMC free article] [PubMed] [Google Scholar]
- 61.Zhang Y et al. Model-based analysis of ChIP–seq (MACS). Genome Biol. 9, R137 (2008). [DOI] [PMC free article] [PubMed] [Google Scholar]
- 62.Love MI, Huber W & Anders S Moderated estimation of fold change and dispersion for RNA-seq data with DESeq2. Genome Biol. 15, 550 (2014). [DOI] [PMC free article] [PubMed] [Google Scholar]
- 63.Shao Z, Zhang Y, Yuan GC, Orkin SH & Waxman DJ MAnorm: a robust model for quantitative comparison of ChIP–seq data sets. Genome Biol. 13, R16 (2012). [DOI] [PMC free article] [PubMed] [Google Scholar]
- 64.McLean CY et al. GREAT improves functional interpretation of cis-regulatory regions. Nat. Biotechnol. 28, 495–501 (2010). [DOI] [PMC free article] [PubMed] [Google Scholar]
- 65.Grant CE, Bailey TL & Noble WS FIMO: scanning for occurrences of a given motif. Bioinformatics 27, 1017–1018 (2011). [DOI] [PMC free article] [PubMed] [Google Scholar]
Associated Data
This section collects any data citations, data availability statements, or supplementary materials included in this article.
Supplementary Materials
Data Availability Statement
Both raw data files and processed data files from ATAC-seq and CUT&Tag-seq experiments were deposited in the GEO database with accession codes GSE149752, GSE149796 and GSE149810. Source data are provided with this paper.


