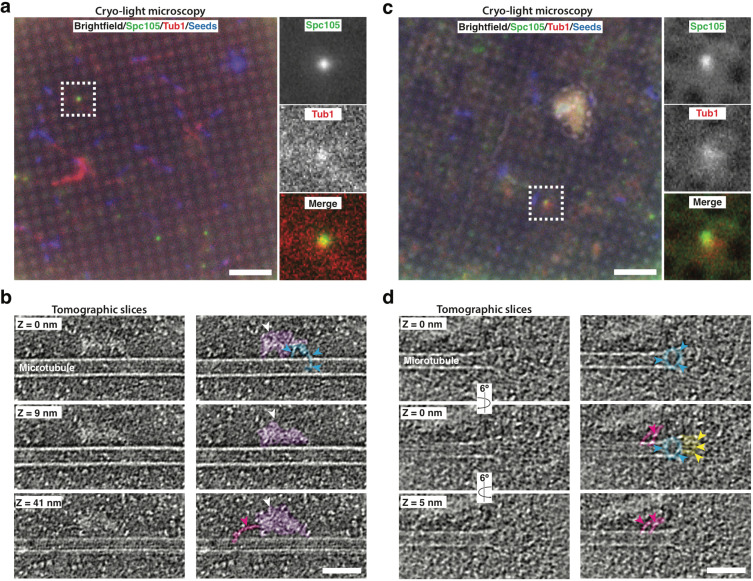
Figure 3. Cryo-correlative light microscopy and electron tomography shows microtubule-associated intact kinetochore complexes.
(a, c) Overlay of brightfield and fluorescent channel cryo-light micrographs showing Spc105-GFP in green, mRuby-Tub1 in red and microtubule seeds in blue. The brightfield channel highlights the holey carbon film pattern. Insets show 2.7x magnified views of boxed regions. (b) Slices of tomogram recorded in the region of the highlighted Spc105 focus in (a) at Z-positions relative to the top slice. Slices show a kinetochore bound to the lateral surface of a microtubule. The largest part of the kinetochore appears as an electron-dense proteinaceous cloud similar to what has been reported for purified yeast kinetochores (white arrowheads; Gonen et al., 2012). A ring-like density (blue arrowheads) and a rod-like density (pink arrowheads), potentially representing Dam1 and Ndc80 sub-complexes, respectively, extend from the cloud-like density. (d) Slices of tomogram recorded in the region of the highlighted Spc105 focus in (c) at Z-positions relative to the top slice, showing a kinetochore complex bound to the end of a microtubule. Arrowheads point at a ring-like (blue) and rod-like (pink) density similar to the ones observed in (b) Additional rod-like extensions (yellow arrowheads) might represent the MIND complex. Right columns in (b,d) show the same images as in the left column, but protein densities are colored to match the arrows. Scale bars, 10 µm in (a, c), 60 nm in (b, d).

