Abstract
Background:
We had previously conducted a double-blind, randomized placebo-controlled, partial cross-over trial showing that 12 weeks of dipyridamole decreased CD8+ T cell activation among treated HIV(+) individuals by increasing extracellular adenosine levels.
Methods:
In this substudy, rectosigmoid biopsies were obtained from 18 participants (9 per arm), to determine whether 12 weeks of dipyridamole affects mucosal immune cells. Participants randomized to placebo were then switched to dipyridamole for 12 weeks while the treatment arm continued dipyridamole for another 12 weeks. We evaluated T cell frequencies and plasma markers of microbial translocation and intestinal epithelial integrity. Linear regression models on log-transformed outcomes were used for the primary 12-week analysis.
Results:
Participants receiving dipyridamole had a median 70.2% decrease from baseline in regulatory T cells (p=0.007), and an 11.3% increase in CD8+ T cells (p=0.05). There was a non-significant 10.80% decrease in plasma IFAB levels in the dipyridamole arm compared to a 9.51% increase in the placebo arm. There were no significant differences in plasma levels of β-D-glucan. In pooled analyses, there continued to be a significant decrease in regulatory T cells (−44%; p=0.004). There was also a trend for decreased CD4+ and CD8+ T cell activation.
Conclusion:
Increasing extracellular adenosine levels using dipyridamole in virally-suppressed HIV (+) individuals on antiretroviral therapy can affect regulation of gut mucosal immunity.
Keywords: HIV, Dipyridamole, Adenosine, Treg, Mucosa
BACKGROUND
Despite successful viral suppression with antiretroviral therapy (ART), persons living with HIV (PLWH) have persistent immune activation1 which is associated with greater risk for non-AIDS chronic conditions including cancer and cardiovascular disease2. Disruption of the gut-associated lymphoid tissue (GALT) caused by human immunodeficiency virus (HIV) persists even after and restoration of circulating CD4+ T cell counts has been achieved on ART3. These changes result in dysregulation of the immune-epithelial barrier and subsequent microbial translocation that has been associated with persistent systemic inflammation in PLWH4.
Adenosine is a nucleoside that is produced during conditions of stress and acts as a potent immunoregulatory molecule by binding to surface receptors on various immune cells, dampening cell activation, and decreasing pro-inflammatory cytokines to limit inflammation and tissue damage5. Our group and others have found that T cells expressing the rate-limiting enzyme (ecto-5’-nucleotidase; CD73) in extracellular adenosine production are decreased among PLWH independent of viral suppression and CD4+ T cell count6,7. We have also recently shown in a randomized, placebo-controlled pilot trial of dipyridamole, which increases extracellular adenosine levels by blocking equilibrative nucleoside transporters that transport adenosine into the cell, in PLWH on virally-suppressive ART, that dipyridamole increased plasma levels of inosine (adenosine surrogate) and cyclic adenosine monophosphate (cAMP), and decreased CD8+ T cell activation in blood 8. Within this trial, we conducted a sub-study to evaluate if modulation of the adenosine signaling pathway by dipyridamole affects the alterations in mucosal integrity and immune landscape in PLWH 4,9.
METHODS
Study Design.
In a placebo-controlled, 2-arm partial cross-over study, eligible participants virally-suppressed on ART were randomized 1:1 to either 100mg of dipyridamole taken orally four times daily or matching placebo for 12 weeks, with the placebo arm switching to dipyridamole after week 12 through week 24 (NCT02121756)8. A subset of participants in each arm underwent gut mucosal biopsies at baseline, week 12, and week 24. The study was approved by the University of Pittsburgh Institutional Review Board. Written informed consent was obtained from all participants.
Mucosal Biopsy Processing, Flow Cytometry, and HIV-1 DNA assay.
Rectosigmoid mucosal biopsies obtained by flexible sigmoidoscopy were digested using a solution of collagenase II (Sigma-Alrich, St. Louis, MO), DNAse 1 (New England Biolabs, Ipswich, MA), and transport RPMI (RPMI 1640 with L-glutamine and HEPES, 7.5% Fetal Bovine Serum, and 1% Antibiotic/antimycotic, all Invitrogen, Carlsbad, CA) and incubated in a shaker incubator at 37°C and 250rpm for 30 minutes, washed with a buffer containing Dulbecco’s phosphate-buffered saline and ethylenediaminetetraacetic acid (both Invitrogen), and strained. The mucosal mononuclear cell (MMC) suspension was centrifuged at 800g for 5 minutes and the pellet was resuspended in RPMI. Gut mucosal T cell frequencies, levels of activation, and ectoenzyme expression were determined by surface staining MMCs with Live/Dead stain (Invitrogen), CD3 Alexa488, CD4 Alexa Fluor700, CD8 APC-H7, CD38 PE-Cy7, HLA-DR BV421, CD39 PECF594, and CD73 PerCP-Cy5.5 (all BD Biosciences, San Jose, CA), while regulatory T cell (Treg) frequencies were obtained by additional staining for surface CD25 APC and intracellular staining of FOXP3 PE (BD Biosciences). To determine Th17 cell frequencies, MMCs were stimulated with PMA-ionomycin for 4 hours and then stained with Live/Dead stain, CD45 PerCP, CD3 Alexa488, CD4 Alexa Fluor700, CD8 APC-H7, IL-17A PE, and IFN gamma APC (all BD Biosciences). Cryopreserved peripheral blood mononuclear cells (PBMC) obtained at similar timepoints as the rectosigmoid biopsies were thawed and underwent the same staining protocol as the MMCs. Following staining, cells were fixed in 1% paraformaldehyde and analyzed using BD LSR Fortessa within 24 hours. Additional MMCs were cryopreserved and later thawed in batch to determine levels of HIV-1 DNA by qPCR targeting the pol gene as previously described8.
Soluble Biomarker Testing.
To evaluate levels of soluble markers of microbial translocation and epithelial intestinal integrity, frozen plasma samples from the baseline and week 12 timepoint were thawed and analyzed in batch. Plasma concentrations of intestinal fatty acid-binding protein (IFABP; R&D, Minneapolis, MN), beta D glucan (BDG, BioVision, Exton, PA) and human lipopolysaccharide binding protein (LBP, Abcam, Cambridge, MA) were assayed following the manufacturer’s protocol. Results were analyzed using a BioTex ELx808 ELISA reader and Gen5 software.
Statistical Analyses.
Percent changes from baseline to week 12 in frequencies of CD4+ CD8+ T cells, Treg (CD4+ CD25HI FOXP3+), Th17 cells (CD4+ IL17A+ stimulated cells – unstimulated), activated (HLA-DR/CD38+) T cells, levels of HIV-1 DNA, and plasma levels of IFABP, BDG, and LBP were summarized as medians and interquartile ranges. Between-arm comparisons on demographic characteristics and baseline T cell counts were made using 2-sample t tests, χ 2 tests, or their nonparametric equivalents. Analysis only includes participants with available data at specified timepoints. Secondary pooled analysis of within participant changes in dipyridamole-arm (baseline to week 12) and placebo-arm (week 12 to week 24) used linear regression models combining both arms. All hypotheses were tested with a 5% type I error rate. Analyses were done using SAS v9.4.
RESULTS
Study Population.
Twenty-two participants were enrolled in the substudy, 18 had data at baseline and week 12 timepoints and were included in the analyses (Suppl Table 1). There were no differences between the arms in age or percent and absolute number of peripheral blood CD4+ and CD8+ T cells.
Changes in T cell frequencies, immune activation, and ectoenzyme expression.
We assessed changes in percent CD4+ and CD8+ T cells, Treg, and Th17 cells in the gut mucosa after 12 weeks of dipyridamole. Although percent changes in CD4+ T cell frequency were not significantly different between the two arms (−13.4% in dipyridamole vs −1.4% in placebo; p=0.11), the dipyridamole arm had a significant increase in %CD8+ T cells in gut mucosa at week 12 (median +11.3% vs −0.47% in placebo; p=0.05; Figure 1A–B). These changes were not observed in peripheral blood. Similarly, there was a significant decrease in the frequency of Treg following 12 weeks of dipyridamole compared to placebo (median −70.2% change vs +17.7%; p=0.007; Figure 1C), but there were no changes in %Th17 cells (p=0.33; Figure 1D). No changes were observed in peripheral blood %Treg and %Th17. We observed non-significant decreases in gut mucosa in CD4+ (−44.3% vs −8.2% in placebo; p=0.15) and CD8+ T cell (−46.5% vs −15.6%; p=0.13) immune activation measured by %HLA-DR+CD38+. As in peripheral blood, dipyridamole did not increase MMC T cell expression of CD39 and CD73, which are ectoenzymes that generate extracellular adenosine from adenosine triphosphate.
Figure 1.
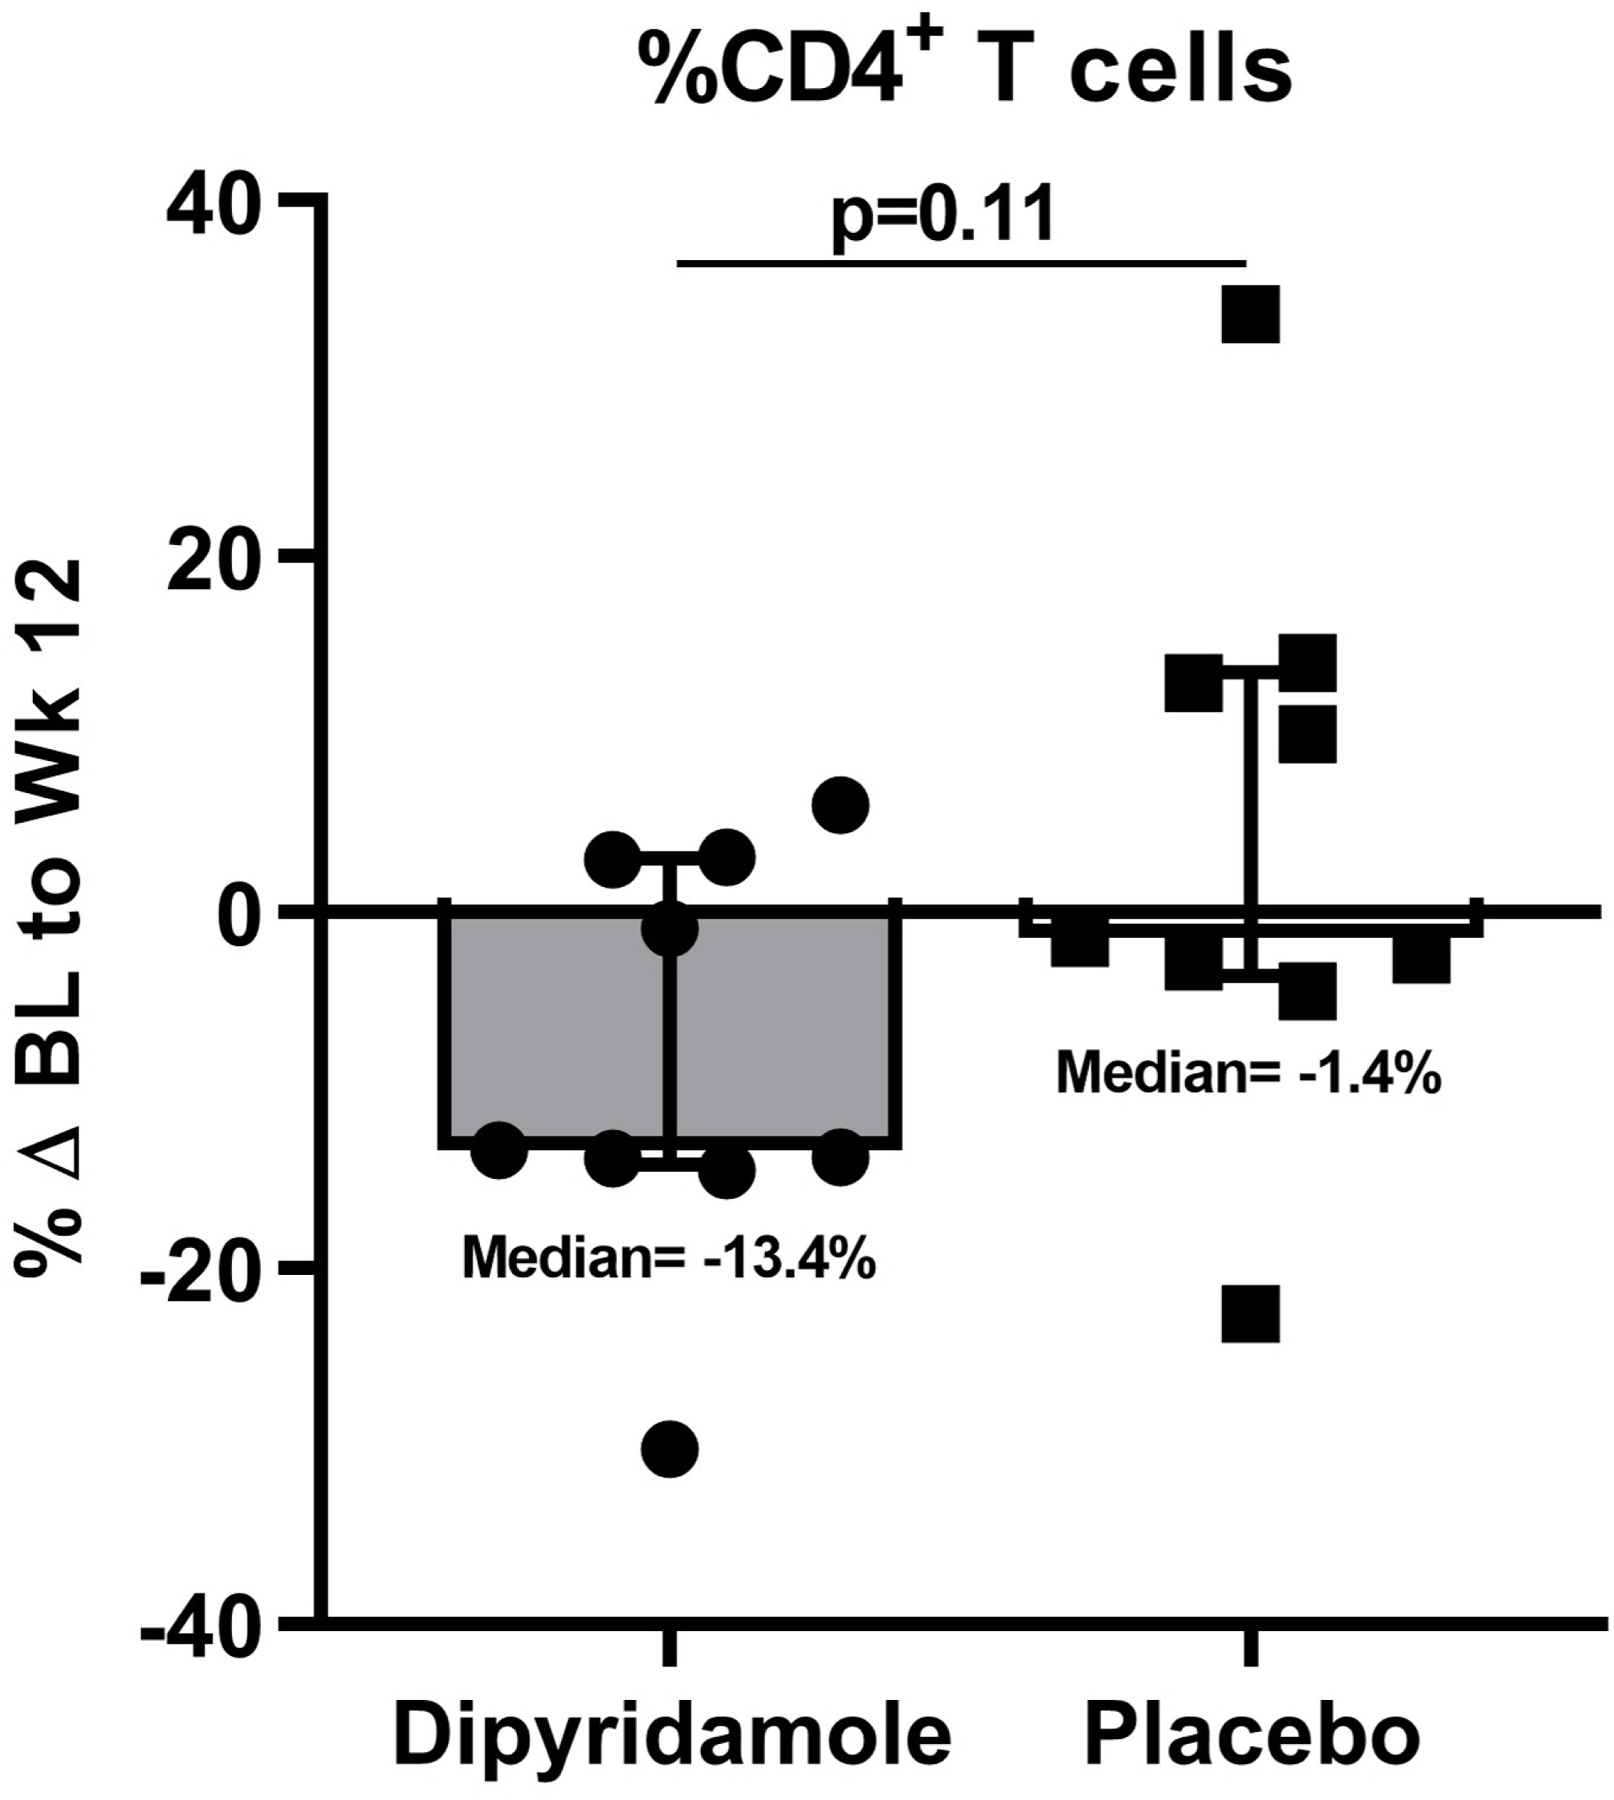
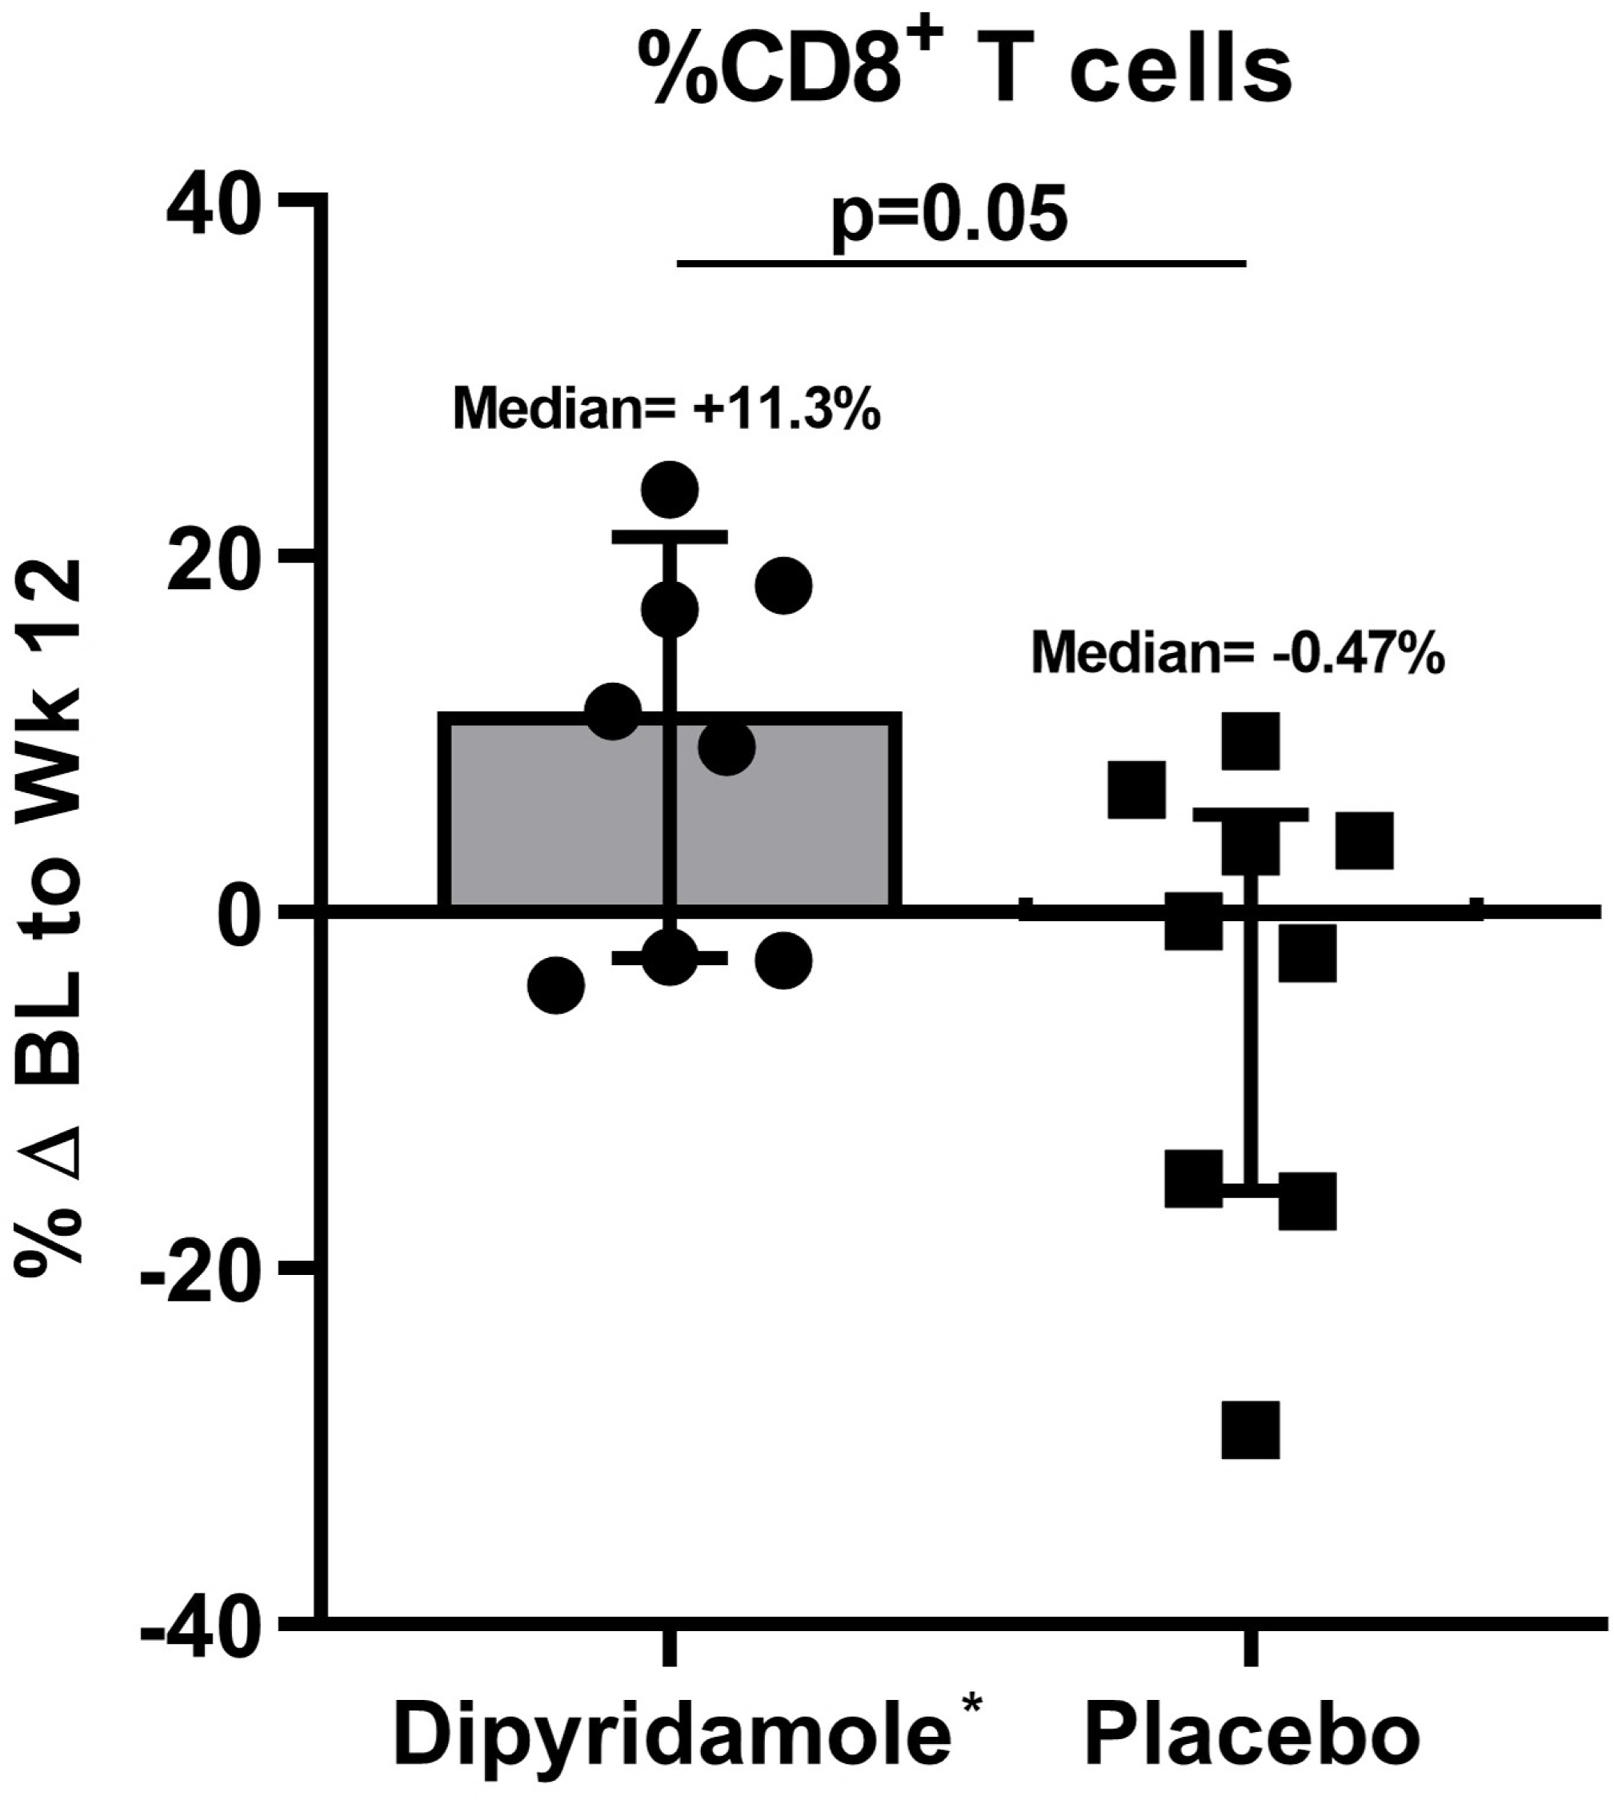
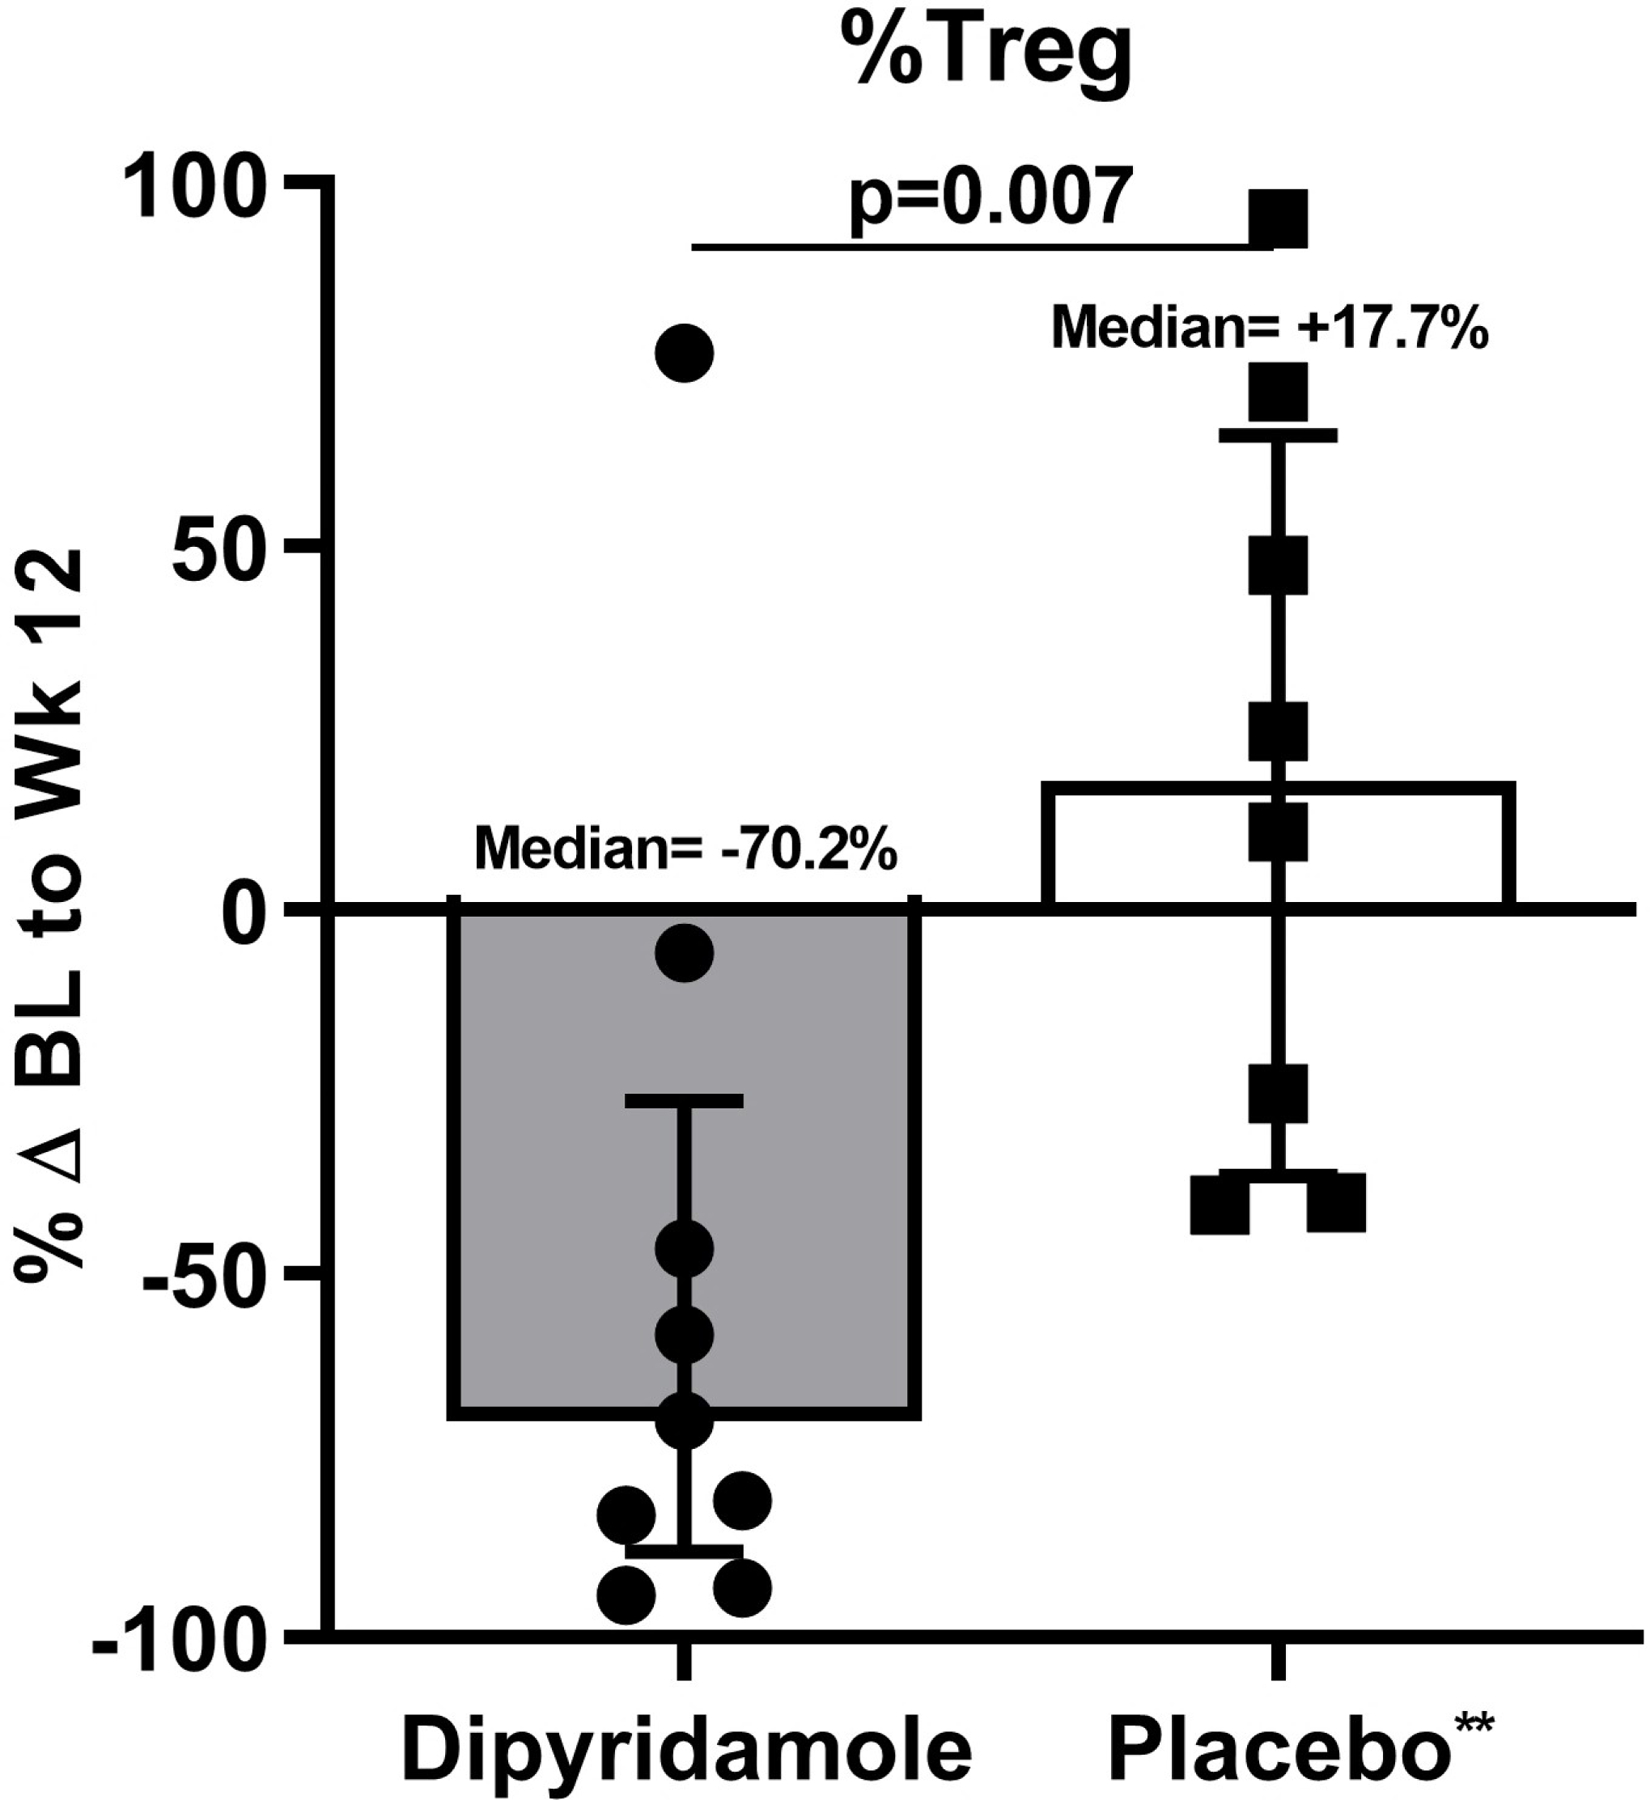
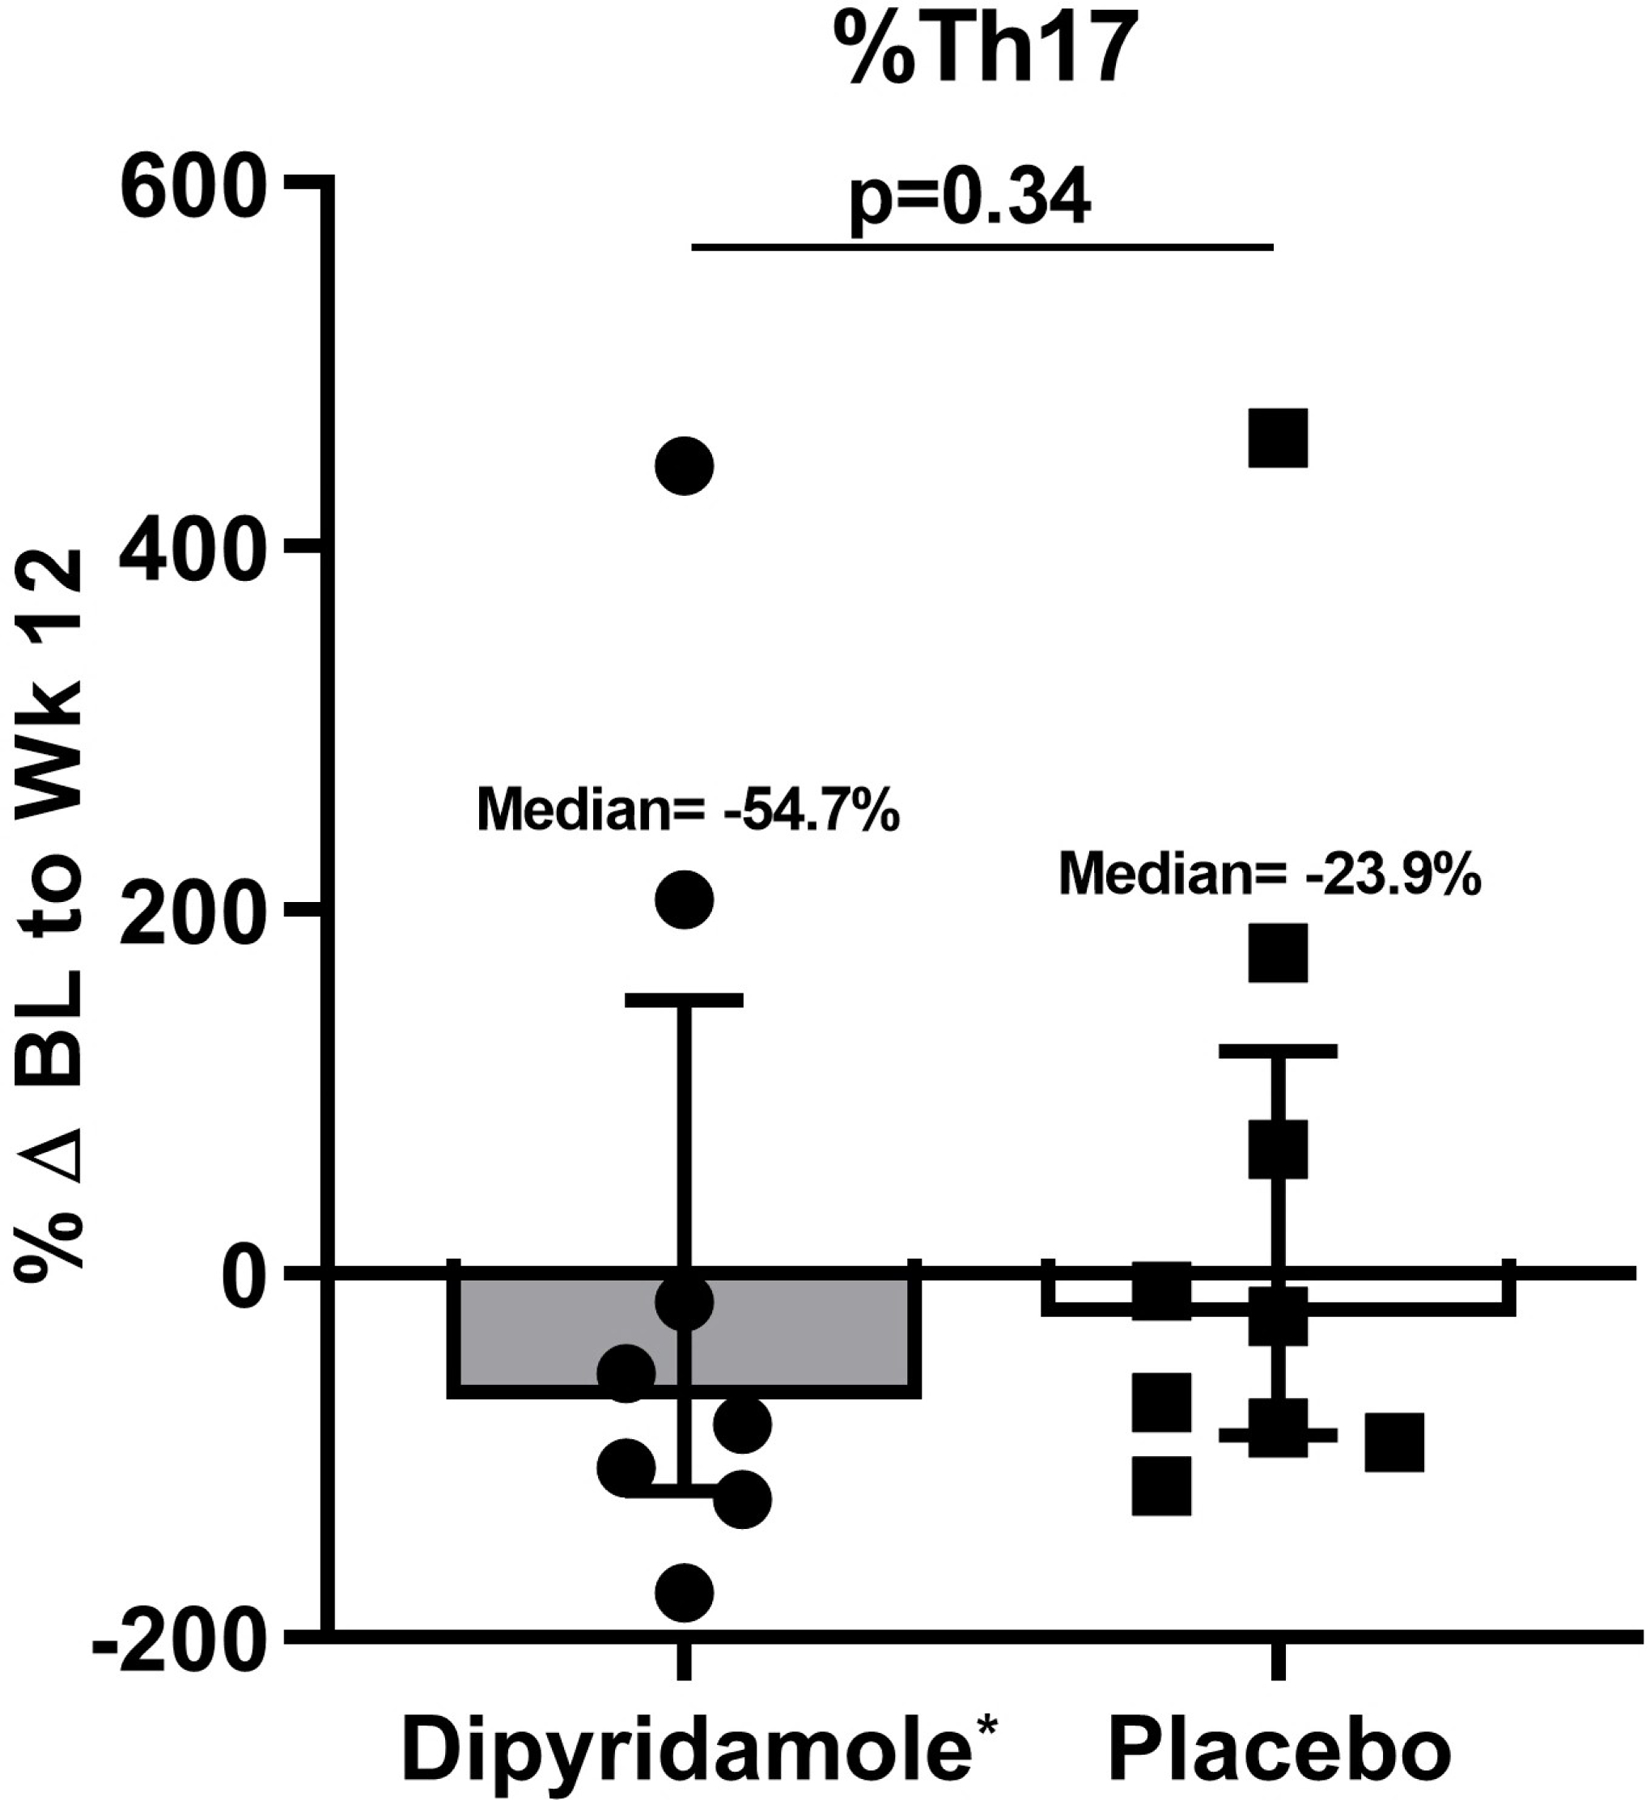
Baseline (BL) to Week (Wk) 12 percent changes in the gut mucosal frequencies of (A) CD4+ T cells, (B) CD8+ T cells, (C) regulatory T cells (Treg; CD4+ CD25HI FOXP3+), and (D) Th17 cells (CD4+ IL17A+ T cells following stimulation). Graphs show median and interquartile range. *Outlier values in the dipyridamole arm (102.5% change in mucosal CD8+ T cell and 4255% change in gut Th17 cells) and an **outlier value in the placebo arm (1346.8% change in gut Treg) was excluded in the graphs but included in the statistical analyses.
Plasma Soluble Markers.
Given the changes in frequencies of gut mucosal T cells following dipyridamole use, we evaluated whether there were corresponding changes in levels of BDG and LBP, markers of microbial translocation10,11. Among participants with available specimens at baseline and week 12 (n=16), we observed no difference between the two arms in the levels of plasma BDG and LBP post-dipyridamole. We also evaluated changes in gut epithelial integrity by measuring plasma levels of IFABP, a marker of enterocyte death12 and observed a non-significant decrease in the dipyridamole arm (−10.8% vs +9.51%; p=0.16, data not shown).
HIV-1 DNA levels in gut MMC.
Given the significant decrease in Treg and increase in CD8+ T cells in the gut mucosa, we determined whether there were corresponding changes in the levels of HIV-1 DNA in MMCs and HIV-1 DNA levels normalized to gut CD4+ T cell frequencies. There were no differences in either measurements of HIV-1 DNA at baseline and after 12 weeks of dipyridamole between the two arms.
Pooled changes.
When we pooled percent changes from baseline to week 12 in the dipyridamole arm and from week 12 to 24 in the placebo arm, we observed a significant increase in CD8+ T cell frequency (+10% change; p=0.05; Figure 2A). The decrease in Treg frequencies post-dipyridamole remained significant (−44% change; p=0.004; Figure 2B) but no change was observed in Th17 frequencies despite pooling (pre-drug 1.54% vs post-drug 0.91%; p=0.34; data not shown). We observed a trend for decreased CD4+ (−30% change; p=0.08; Figure 2C) and CD8+ T cell activation (−27% change; p=0.06; Figure 2D).
Figure 2.
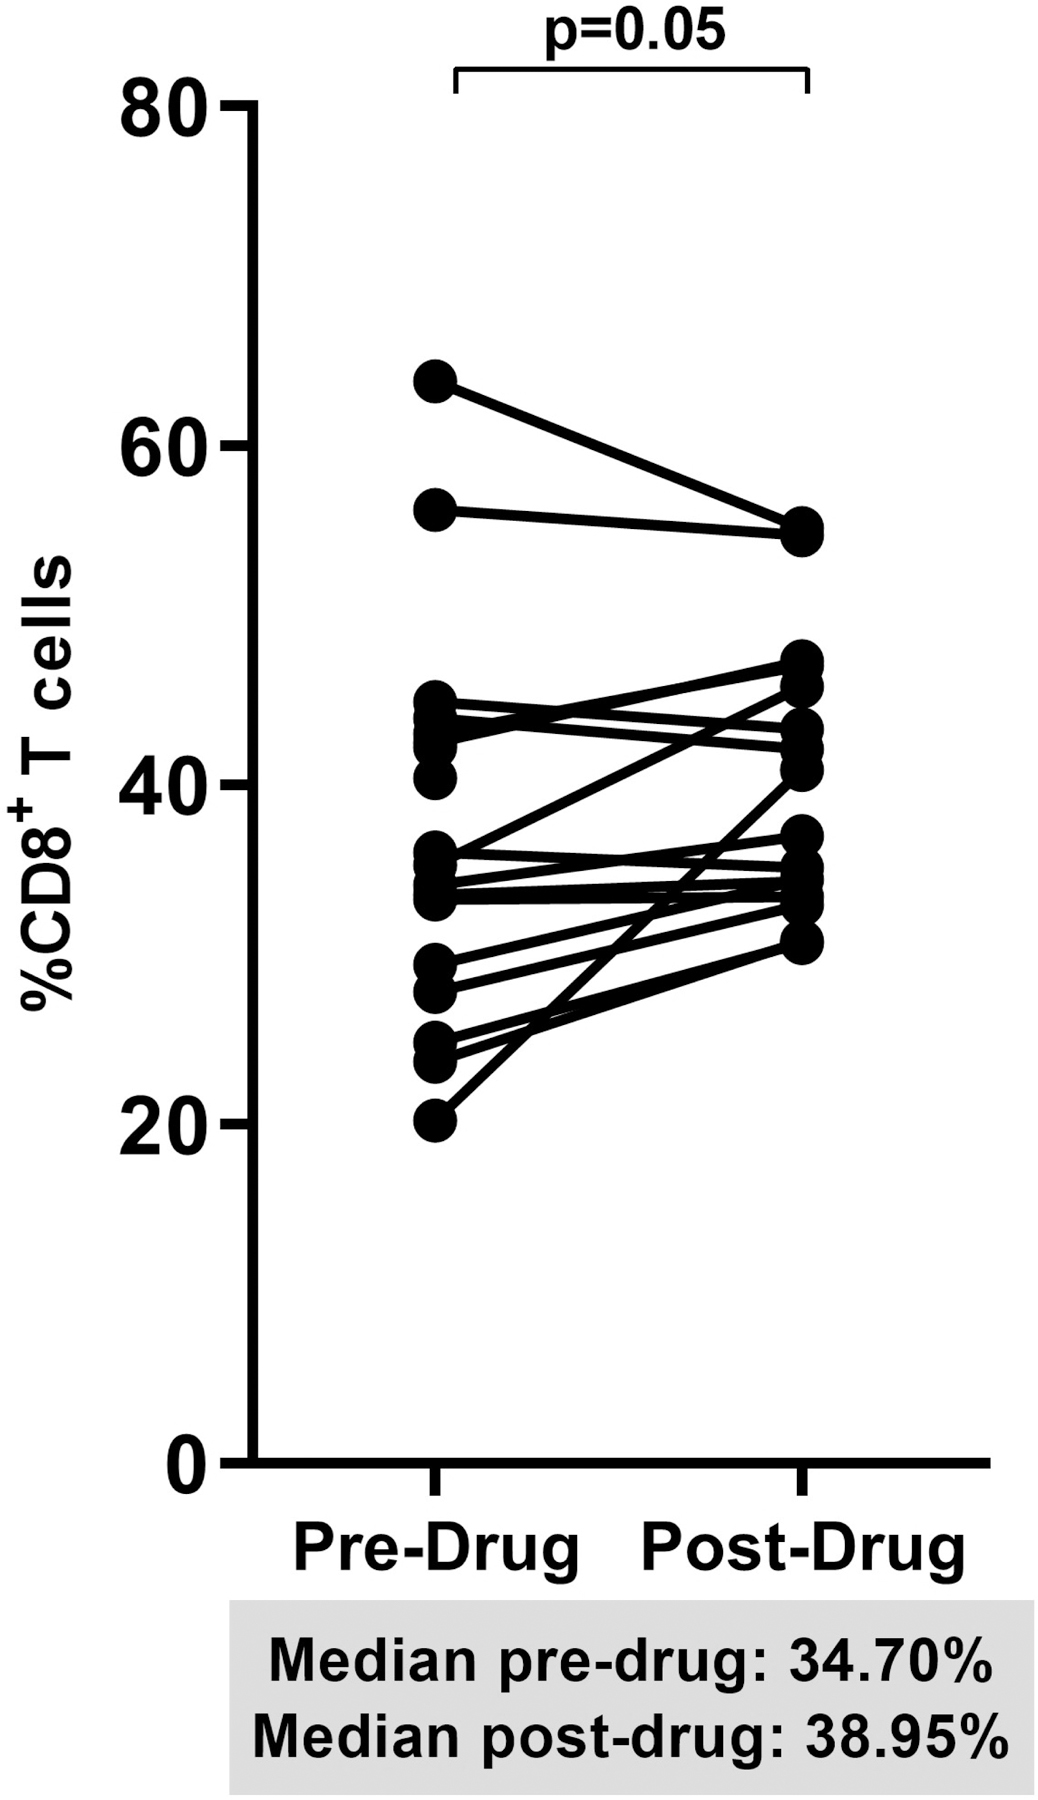
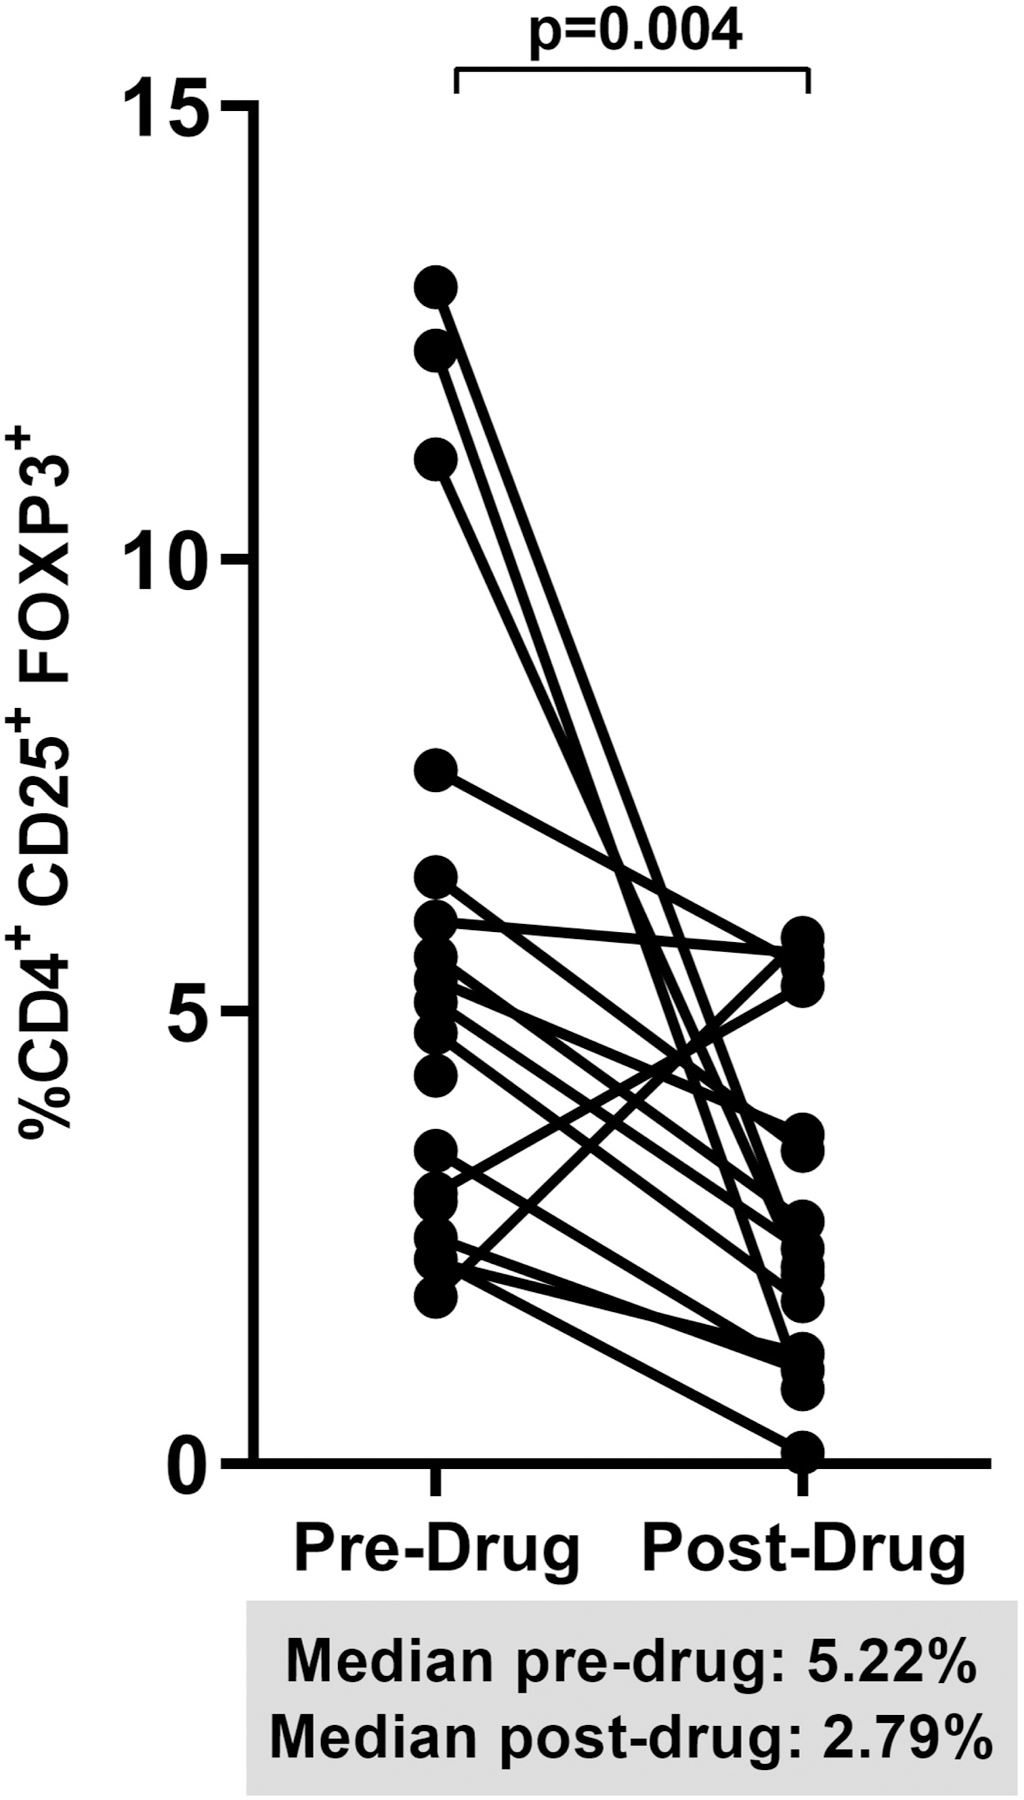
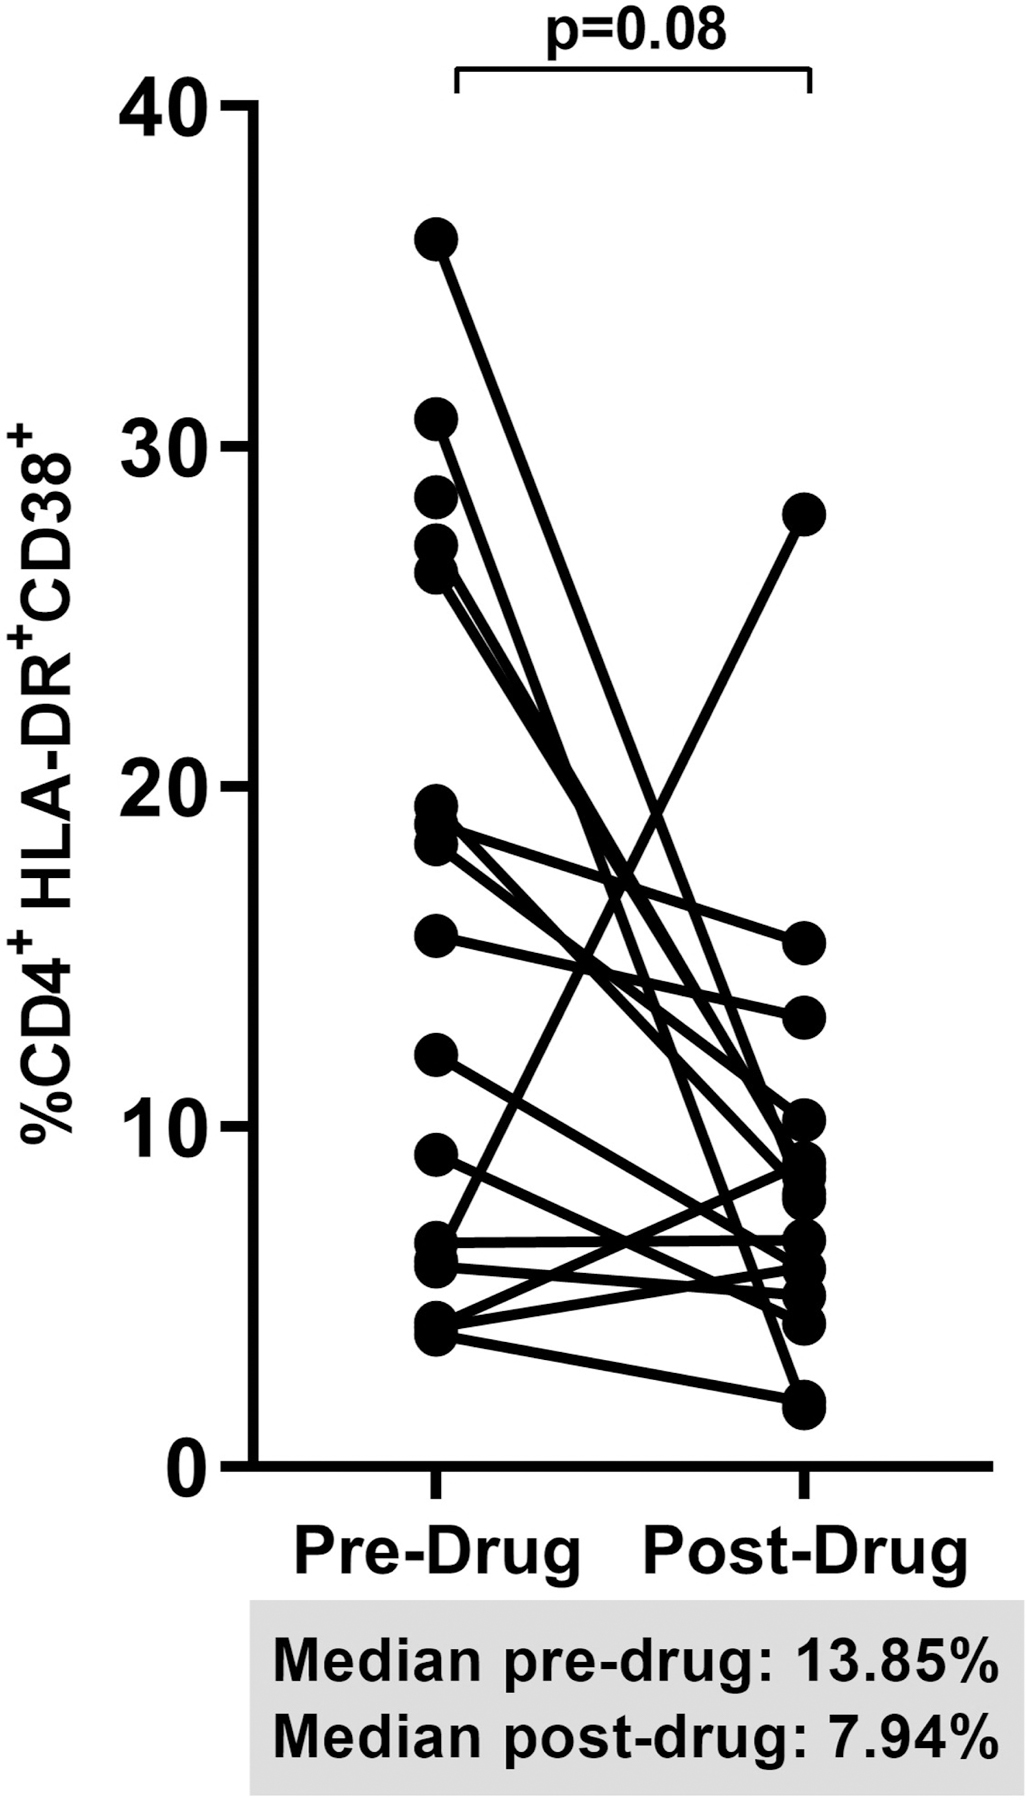
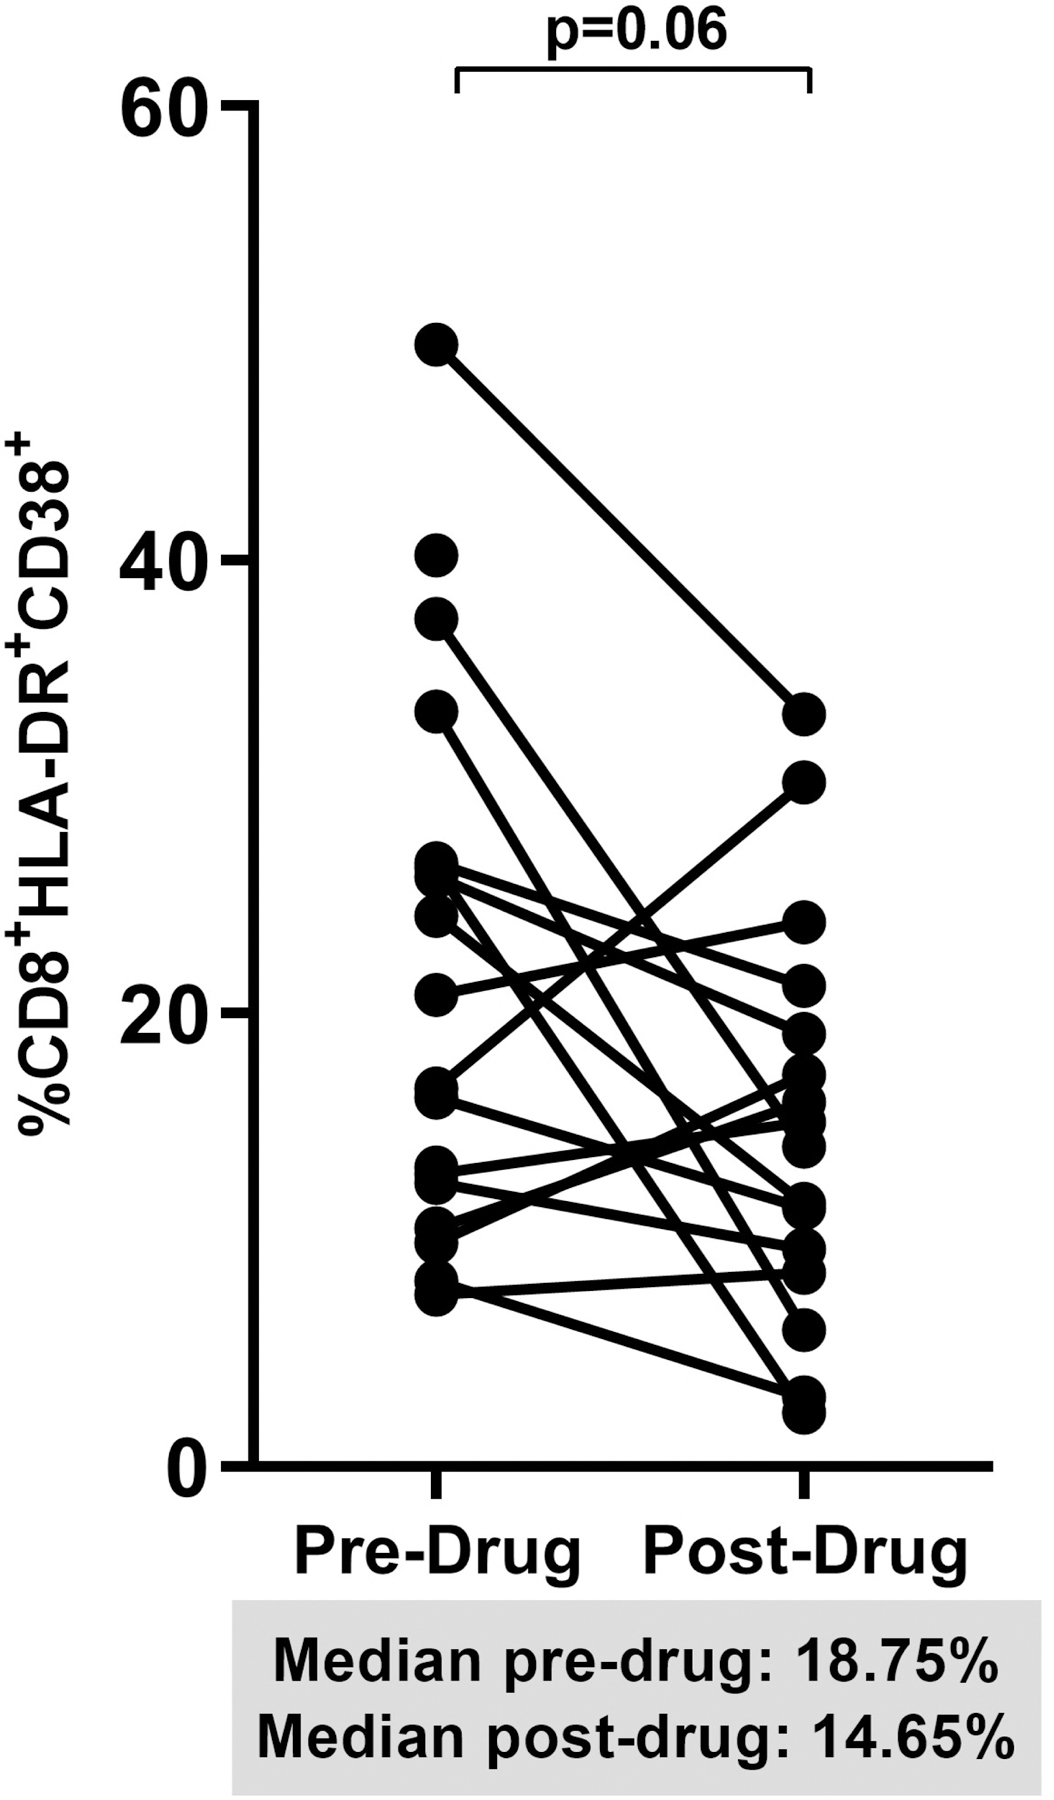
Spaghetti plots show pooled 12-week changes in pre- and post-dipyridamole treatment among all study participants (Dipyridamole arm: baseline to week 12; Placebo arm: week 12 to 24) with available specimens at the pre- and post-drug timepoints (N=16) in (A) gut mucosal CD8+ T cell frequencies; (B) gut mucosal Treg frequencies; (C) mucosal CD4+ and (D) CD8+ T cell activation (HLA-DR+ CD38+).
DISCUSSION
Increased levels of systemic inflammation and immune activation among PLWH despite viral suppression on ART have been associated with greater risk of non-AIDS chronic diseases. There are a number of factors that are believed to contribute to the inflammation.1 We have shown in previous studies6,8 that immune dysregulation, specifically alterations in the adenosine signaling pathway that are critical for controlling inflammation-induced tissue damage, is a significant factor contributing to chronic inflammation. Given the role of gut mucosal immunity in HIV pathogenesis, we conducted this substudy to determine whether an intervention that increased extracellular adenosine levels can also affect gut mucosal integrity and immunity. We have shown in our pilot clinical trial that study participants given dipyridamole had decreased CD8+ T cell activation and higher plasma levels of inosine, an adenosine surrogate, and cAMP, which is a downstream effect of adenosine binding to its receptor8, thus supporting the conclusion that modulation of the adenosine pathway by dipyridamole was responsible for the immune effects we observed.
In the current study, we show a median 70% decrease in gut mucosal Treg frequencies from baseline in the dipyridamole arm. This decrease in mucosal Treg is not consistent with data showing that extracellular adenosine can drive expansion and immunosuppressive function of Treg13. It is possible though that the decrease in mucosal Treg is a response to lowered T cell activation in the gut because of dipyridamole-mediated increases in gut adenosine levels, especially since dipyridamole undergoes enterohepatic recirculation leading to higher concentration of dipyridamole in the gut epithelial cells14. Although there were greater decreases in T cell activation in gut mucosa in the dipyridamole arm, these were not significantly different than the placebo arm. However, given the smaller sample size in this substudy, our ability to detect a similar effect size as in the peripheral blood8 would be lower. Indeed, on pooled analyses, we did see trends for decreased CD4+ (−30% change) and CD8+ (−27% change) T-cell activation following 12 weeks of dipyridamole. In addition, we saw a significant, albeit modest, increase in %CD8+ T cells. This increase in % CD8+ T cells could be in response to the decrease in Treg frequencies since Treg can inhibit CD8+ T cell proliferation as one mechanism of suppressing effector responses15. Overall, these results suggest that dipyridamole, by increasing levels of extracellular adenosine, decreased T cell activation, as previously shown in ex vivo studies6, leading to the decrease in Treg frequencies. The decreased suppression then resulted in increased CD8+ T cell frequencies. Although we were not able to evaluate changes in HIV transcriptional activity and integrated proviral DNA, we speculate that the decreased mucosal Treg and increased CD8+ T cells could have decreased these gut mucosal measures of the HIV reservoir.
We also hypothesized that dipyridamole-associated changes in mucosal immunity could also affect levels of microbial translocation and epithelial cell integrity. However, we did not observe any changes in these parameters. This negative result could be due to the lack of change in the frequencies of Th17 cells, the loss of which have been associated with defects in the intestinal epithelium resulting in microbial translocation9. That said, given our small sample size, it is difficult to completely exclude any potential clinically significant effects especially given the intraspecific variability that these soluble markers have
Our study has several limitations, including a small sample size, with 18% of enrolled participants not having both baseline and week 12 data, and limited tissue volume prohibiting the evaluation adenosine metabolites or dipyridamole levels in the tissue. These additional data could have further supported our conclusion that modulation of extracellular adenosine by dipyridamole is indeed responsible for the changes in gut mucosal immunity. In addition, because of limited MMCs available, we were unable to evaluate CD8+ T cell function, specifically HIV-specific responses, to determine whether the decrease in Treg and increase in CD8+ T cells corresponded to an increase in HIV-specific immunity in the gut mucosa. Despite these limitations, the significant changes in gut immune cells, specifically the marked decrease in gut Treg frequencies suggest that modulation of the adenosine pathway in HIV infection could have important end-organ effects that should be evaluated further.
Supplementary Material
Supplemental Figure 1. Baseline to week 12 percent changes in the plasma levels of (A) beta D glucan (BDG), (B) intestinal fatty acid binding protein (IFAB), and (C) lipopolysaccharide-binding protein (LBP). Graphs show median and interquartile range.
ACKNOWLEDGMENTS
The authors would like to thank Dr. Charles Rinaldo from the University of Pittsburgh Graduate School of Public Health; Drs. Karin Klingman, Akinlolu Ojuma, and Susan Brobst from the National Institute of Allergy and Infectious Diseases, NIH; Drs. Randall Brand and Richard Duerr from the Division of Gastroenterology, Hepatology, and Nutrition, University of Pittsburgh School of Medicine; Angel Pappalardo, Patricia Peters, Stacey Edick, Renee Weinman, Jamie Nemeth, Amanda Saylor, Jennifer Sullivano, Cathy Naccarelli, Sherri Karas, James Gavel, and Sarah Onesi from the University of Pittsburgh Clinical Research Site; Lori Caruso, Benjamin Morris, and Kiran Bandi from the Macatangay Laboratory; Luann Borowski, Janet McLaughlin, and Kathy Kulka from the Rinaldo Laboratory; and most importantly, the study participants.
This study was supported by NIH grants U01-AI110410/AI110410-03S1 and Clinical and Translational Award grant UL1TR000005.
Footnotes
Conflicts of Interest: JWM has received grant support from Gilead Sciences, is a consultant to Gilead Sciences, Merck, and IDConnect, and owns share options in Co-Crystal Pharma, Inc. and Abound Bio, Inc.; IMG is Chief Medical Officer at Orion Biotechnology, owns share options in Orion Biotechnology and AELIX Therapeutics, and is Chair of Scientific Advisory Board for Abivax; SAR has received research grant support from GlaxoSmithKline, Merck, and Gilead Sciences; BJCM has received research grant support from Gilead Sciences.
Results of this study were presented in part at the 2019 Conference on Retroviruses and Opportunistic Infection in Seattle (Poster #0207).
REFERENCES
- 1.Younas M, Psomas C, Reynes J, Corbeau P. Immune activation in the course of HIV-1 infection: Causes, phenotypes and persistence under therapy. HIV Med 2016;17(2):89–105. [DOI] [PubMed] [Google Scholar]
- 2.Althoff KN, McGinnis KA, Wyatt CM, et al. Comparison of risk and age at diagnosis of myocardial infarction, end-stage renal disease, and non-AIDS-defining cancer in HIV-infected versus uninfected adults. Clin Infect Dis 2015;60(4):627–638. [DOI] [PMC free article] [PubMed] [Google Scholar]
- 3.Mavigner M, Cazabat M, Dubois M, et al. Altered CD4+ T cell homing to the gut impairs mucosal immune reconstitution in treated HIV-infected individuals. J Clin Invest 2012;122(1):62–69. [DOI] [PMC free article] [PubMed] [Google Scholar]
- 4.Paiardini M, Frank I, Pandrea I, Apetrei C, Silvestri G. Mucosal immune dysfunction in AIDS pathogenesis. AIDS Rev 2008;10(1):36–46. [PubMed] [Google Scholar]
- 5.Hasko G, Cronstein B. Regulation of inflammation by adenosine. Front Immunol 2013;4:85. [DOI] [PMC free article] [PubMed] [Google Scholar]
- 6.Schuler PJ, Macatangay BJ, Saze Z, et al. CD4(+)CD73(+) T cells are associated with lower T-cell activation and C reactive protein levels and are depleted in HIV-1 infection regardless of viral suppression. AIDS 2013;27(10):1545–1555. [DOI] [PMC free article] [PubMed] [Google Scholar]
- 7.Toth I, Le AQ, Hartjen P, et al. Decreased frequency of CD73+CD8+ T cells of HIV-infected patients correlates with immune activation and T cell exhaustion. J Leukoc Biol 2013;94(4):551–561. [DOI] [PubMed] [Google Scholar]
- 8.Macatangay BJC, Jackson EK, Abebe KZ, et al. A Randomized, Placebo-Controlled, Pilot Clinical Trial of Dipyridamole to Decrease Hiv-Associated Chronic Inflammation. J Infect Dis 2019. [DOI] [PMC free article] [PubMed] [Google Scholar]
- 9.Shacklett BL. Mucosal Immunity in HIV/SIV Infection: T Cells, B Cells and Beyond. Curr Immunol Rev 2019;15(1):63–75. [DOI] [PMC free article] [PubMed] [Google Scholar]
- 10.Mehraj V, Ramendra R, Isnard S, et al. Circulating (1-->3)-beta-D-glucan Is Associated With Immune Activation During Human Immunodeficiency Virus Infection. Clin Infect Dis 2020;70(2):232–241. [DOI] [PMC free article] [PubMed] [Google Scholar]
- 11.Leon A, Leal L, Torres B, et al. Association of microbial translocation biomarkers with clinical outcome in controllers HIV-infected patients. AIDS 2015;29(6):675–681. [DOI] [PubMed] [Google Scholar]
- 12.Funderburg NT, Boucher M, Sattar A, et al. Rosuvastatin Decreases Intestinal Fatty Acid Binding Protein (I-FABP), but Does Not Alter Zonulin or Lipopolysaccharide Binding Protein (LBP) Levels, in HIV-Infected Subjects on Antiretroviral Therapy. Pathog Immun 2016;1(1):118–128. [DOI] [PMC free article] [PubMed] [Google Scholar]
- 13.Ohta A, Sitkovsky M. Extracellular adenosine-mediated modulation of regulatory T cells. Front Immunol 2014;5:304. [DOI] [PMC free article] [PubMed] [Google Scholar]
- 14.Nielsen-Kudsk F, Pedersen AK. Pharmacokinetics of dipyridamole. Acta Pharmacol Toxicol (Copenh) 1979;44(5):391–399. [DOI] [PubMed] [Google Scholar]
- 15.Nikolova M, Wiedemann A, Muhtarova M, Achkova D, Lacabaratz C, Levy Y. Subset- and Antigen-Specific Effects of Treg on CD8+ T Cell Responses in Chronic HIV Infection. PLoS Pathog 2016;12(11):e1005995. [DOI] [PMC free article] [PubMed] [Google Scholar]
Associated Data
This section collects any data citations, data availability statements, or supplementary materials included in this article.
Supplementary Materials
Supplemental Figure 1. Baseline to week 12 percent changes in the plasma levels of (A) beta D glucan (BDG), (B) intestinal fatty acid binding protein (IFAB), and (C) lipopolysaccharide-binding protein (LBP). Graphs show median and interquartile range.


