

Abstract
Cell proliferation and differentiation require signalling pathways that enforce appropriate and timely gene expression. We find that Tor2, the catalytic subunit of the TORC1 complex in fission yeast, targets a conserved nuclear RNA elimination network, particularly the serine and proline-rich protein Pir1, to control gene expression through RNA decay and facultative heterochro-matin assembly. Phosphorylation by Tor2 protects Pir1 from degradation by the ubiquitin-proteasome system involving the polyubiquitin Ubi4 stress-response protein and the Cul4–Ddb1 E3 ligase. This pathway suppresses widespread and untimely gene expression and is critical for sustaining cell proliferation. Moreover, we find that the dynamic nature of Tor2-mediated control of RNA elimination machinery defines gene expression patterns that coordinate fundamental chromosomal events dur-ing gametogenesis, such as meiotic double-strand-break formation and chromosome segregation. These findings have impor-tant implications for understanding how the TOR signalling pathway reprogrammes gene expression patterns and contributes to diseases such as cancer.
Signal transduction cascades integrate cellular and environmental cues to modulate gene expression programmes that direct cell proliferation and differentiation1–5. Gene expression patterns are defined by locally acting transcription factors as well as epigenetic mechanisms that organize chromosomes into ‘open’ euchromatin and ‘closed’ heterochromatin domains6. Heterochromatin, defined by histone H3 lysine 9 methylation (H3K9me), silences target loci6,7. Dynamic control of facultative heterochromatin allows genome reprogramming in response to differentiation stimuli or changes in growth conditions. Post-transcriptional mechanisms provide another layer of gene regulation by governing the stability of the target RNAs8,9. Despite the importance of facultative heterochromatin and RNA processing activities in gene control and their emerging connections to human diseases, their regulation by signalling mechanisms remains unclear.
The fission yeast Schizosaccharomyces pombe contains well-studied signalling mechanisms and conserved RNA processing and heterochromatin-assembly pathways, providing an excellent system for the study of gene-control pathways10,11. Cells divide mitotically in nutrient-rich conditions but initiate meiosis, a unique type of cell division that yields haploid gametes, following nitrogen starvation12. Meiosis is linked to the expression of hundreds of gametogenic genes13, which are otherwise silenced by RNA processing and chromatin-modifying activities14–17. Gametogenic gene transcripts containing a determinant-of-selective-removal (DSR) element are bound by the YTH-domain protein Mmi1 and its partner Erh1, which recruit the conserved nuclear RNA elimination complex MTREC (Mtl1–Red1 core; PAXT in mammals) to silence target loci14,18–23. MTREC, together with the serine and proline-rich protein Iss10/Pir1, promotes RNA decay by the 3′→5′ exonuclease exosome19–21,24. MTREC–Pir1 also recruits the histone methyltransferase complex (ClrC) containing Clr4SUV39H to assemble heterochromatin islands at gametogenic genes and other loci15,16,25. Heterochromatin islands, akin to facultative heterochromatin in higher eukaryotes, are dynamically remodelled in response to developmental/environmental signals15–17. RNA processing factors also modify chromatin in other systems26,27. How signalling pathways modulate facultative heterochromatin to alter gene expression remains unclear.
We report that the TOR signalling pathway, a key regulator of eukaryotic cell growth4,5,28, targets the RNA elimination network to promote RNA decay and facultative heterochromatin assembly. Tor2, the catalytic subunit of TORC1 (refs. 29–32), stabilizes Pir1 by direct phosphorylation and suppression of the conserved polyubiquitin Ubi4 involved in protein degradation. Tor2-mediated control of Pir1 prevents aberrant gene expression, which supports mitotic cell proliferation under suboptimal conditions, and coordinates the expression of developmental genes during gametogenesis. Our findings connecting TORC1 to RNA elimination/facultative heterochromatin machinery have major implications for understanding how this signalling pathway contributes to various human disorders.
Results
Tor2 regulates MTREC-dependent heterochromatin islands.
Heterochromatin islands harbouring gametogenic genes are disassembled during nitrogen starvation (Fig. 1a)15 but are also affected by low glucose (Fig. 1a). We investigated signalling pathways that might modulate facultative heterochromatin following nutritional changes. TOR is a key sensor of nutritional conditions, as in higher eukaryotes. Of the two TOR homologues, Tor1 is non-essential but Tor2 is essential for growth29–32. Pka1, a cAMP-dependent kinase, also regulates diverse pathways in response to nutritional changes and stress10. The loss of either Tor1—implicated in silencing at sub-telomeric and mating-type loci33—or Pka1 did not affect H3K9me at the mei4 gametogenic gene (island 9). By contrast, H3K9me was markedly reduced in cells carrying a temperature-sensitive allele of tor2 (tor2-ts6; ref. 30; Fig. 1b). This is notable given that inactivation of Tor2 mimics nitrogen starvation29–32. Whereas MTREC-dependent islands harbouring gametogenic genes were affected in tor2-ts6 cells (Fig. 1a and Extended Data Fig. 1a), constitutive heterochromatin domains such as at centromeres and MTREC-independent islands (except for island 14) were unaffected (Extended Data Fig. 1b,c). Tor2 therefore connects environmental signals to facultative heterochromatin assembly, particularly at gametogenic genes.
Fig. 1 |. Tor2 stabilizes Pir1, which is required for facultative heterochromatin assembly and gametogenic gene silencing.

a, Chromatin immunoprecipitation (ChIP)-chip analysis of H3K9me2 distribution at MTREC-dependent islands in WT cells cultured under different conditions (top and middle) as well as in the indicated mutant strains (bottom). Schematics on the top illustrate the genomic map of the heterochromatin islands shown. Chromosome positions correspond to the Sanger Center Pombe database 2007 assembly. The average H3K9me2 enrichment relative to WT was determined for all MTREC-dependent islands (right). b, ChIP–qPCR analysis of H3K9me2 at the mei4 gene (n = 2 independent experiments). c, Western blot analysis of Pir1, Red1 and Mtl1. Ponceau S staining was used as a loading control. d, Detection of Pir1 by immunofluorescence analysis. e, ChIP-chip analysis of the Pir1 distribution at MTREC-dependent islands (left). Average fold enrichment of Pir1 at MTREC-dependent islands (right). f, Western blot analysis of Pir1 in WT and tor2-ts6 cells treated with the proteasome inhibitor BTZ. The cells were cultured at 33 °C in rich liquid medium for 2 h and then treated with BTZ for another 6 h. g, Western blot analysis of Pir1 in WT, tor2-ts6 and tor2-ts6 mts2-1 cells cultured at the indicated temperatures. h, Detection of Pir1 ubiquitination. The cells were cultured in rich medium at 33 °C for 8 h. Pir1–MYC was immunoprecipitated and subjected to western blot analysis using anti-ubiquitin and -MYC antibodies. IP, immunoprecipitation; IB, immunoblot; and Ub(n), polyubiquitination. i, RNA-seq expression profile for Pir1-bound genes. Schematics on the top illustrate ssm4 and mei4 gametogenic genes. RPM, reads per million mapped reads. j, Euler diagram representing the number of genes with increased expression in pir1Δ (log2[fold change] ≥ 1) compared with tor2-ts6 (log2[fold change] ≥ 0.5). The statistical significance of the overlap between the two groups is shown (the P value was calculated from the hypergeometric distribution with the total number of transcripts = 7,015). k, Most-enriched Gene Ontology (GO) biological process terms for 327 upregulated genes. The P values were calculated using a one-sided Fisher’s exact test. a,e,i, Data are representative of two independent experiments. c,d,f,h, Two independent experiments were performed with similar results. All cultures including tor2-ts6 cells were cultured in rich medium at 30 °C for 16 h, except where noted. Source data are provided.
Tor2 affects Pir1 protein stability.
Given that the MTREC target loci were affected in tor2-ts6 cells, we checked the expression and stability of MTREC components in tor2-ts6 cells. Gene transcription was comparable between wild-type (WT) and tor2-ts6 cells (Extended Data Fig. 1d). Moreover, the levels of Mtl1 protein were unaffected and Red1 was only slightly reduced (Fig. 1c). However, the Pir1 protein, which is required for H3K9me at gametogenic genes (Fig. 1a and Extended Data Fig. 1a)19, was dramatically decreased. The loss of Pir1 in tor2-ts6 (Fig. 1c) as well as in nitrogen-starved cells24 was confirmed by immunofluorescence (Fig. 1d). Importantly, Pir1 enrichment at gametogenic genes was reduced in tor2-ts6 cells (Fig. 1e). These results suggest that Tor2 stabilizes Pir1, which is involved in the assembly of heterochromatin islands.
Tor2 protects Pir1 from ubiquitin-mediated protein degradation.
Pir1 might be degraded via the ubiquitin-proteasome pathway. Inactivating the proteasome in tor2-ts6 cells by the introduction of a temperature-sensitive mts2-1 allele or exposure to the proteasome inhibitor bortezomib (BTZ) restored Pir1 to WT levels (Fig. 1f,g). Moreover, ubiquitination of Pir1 was detected in tor2-ts6 cells and increased in the tor2-ts6 mts2-1 mutant (Fig. 1h). Thus, Pir1 is targeted for degradation in tor2-ts6 cells via the ubiquitin-proteasome pathway.
We compared the expression profiles of tor2-ts6 and pir1Δ cells to probe the Pir1–Tor2 connection. Many loci were upregulated in both the tor2-ts6 and pir1Δ mutants, and both showed untimely expression of gametogenic genes during mitotic growth (Fig. 1i and Extended Data Fig. 1e). We identified 327 genes (Fig. 1j and Supplementary Table 1) that were also upregulated in cells lacking Red1 (Extended Data Fig. 1f), including genes involved in meiosis, cellular metabolism and nutrient response (Fig. 1k). These results suggest that Tor2-mediated stabilization of Pir1 prevents the aberrant expression of gametogenic genes and other loci.
Pir1 is a substrate of Tor2.
To investigate how Tor2 regulates Pir1 stability, we identified proteins that co-purified with green fluorescent protein (GFP)-tagged Pir1 (GFP–Pir1) through mass spectrometry. In addition to its known partners—Red1, Mtl1 and Mmi1 (refs. 19,21)—Tor2 was also detected (Extended Data Fig. 2a and Supplementary Table 2). Association of Tor2 with Pir1 was confirmed by co-immunoprecipitation (co-IP; Fig. 2a).
Fig. 2 |. Tor2 phosphorylates Pir1 to confer stability.
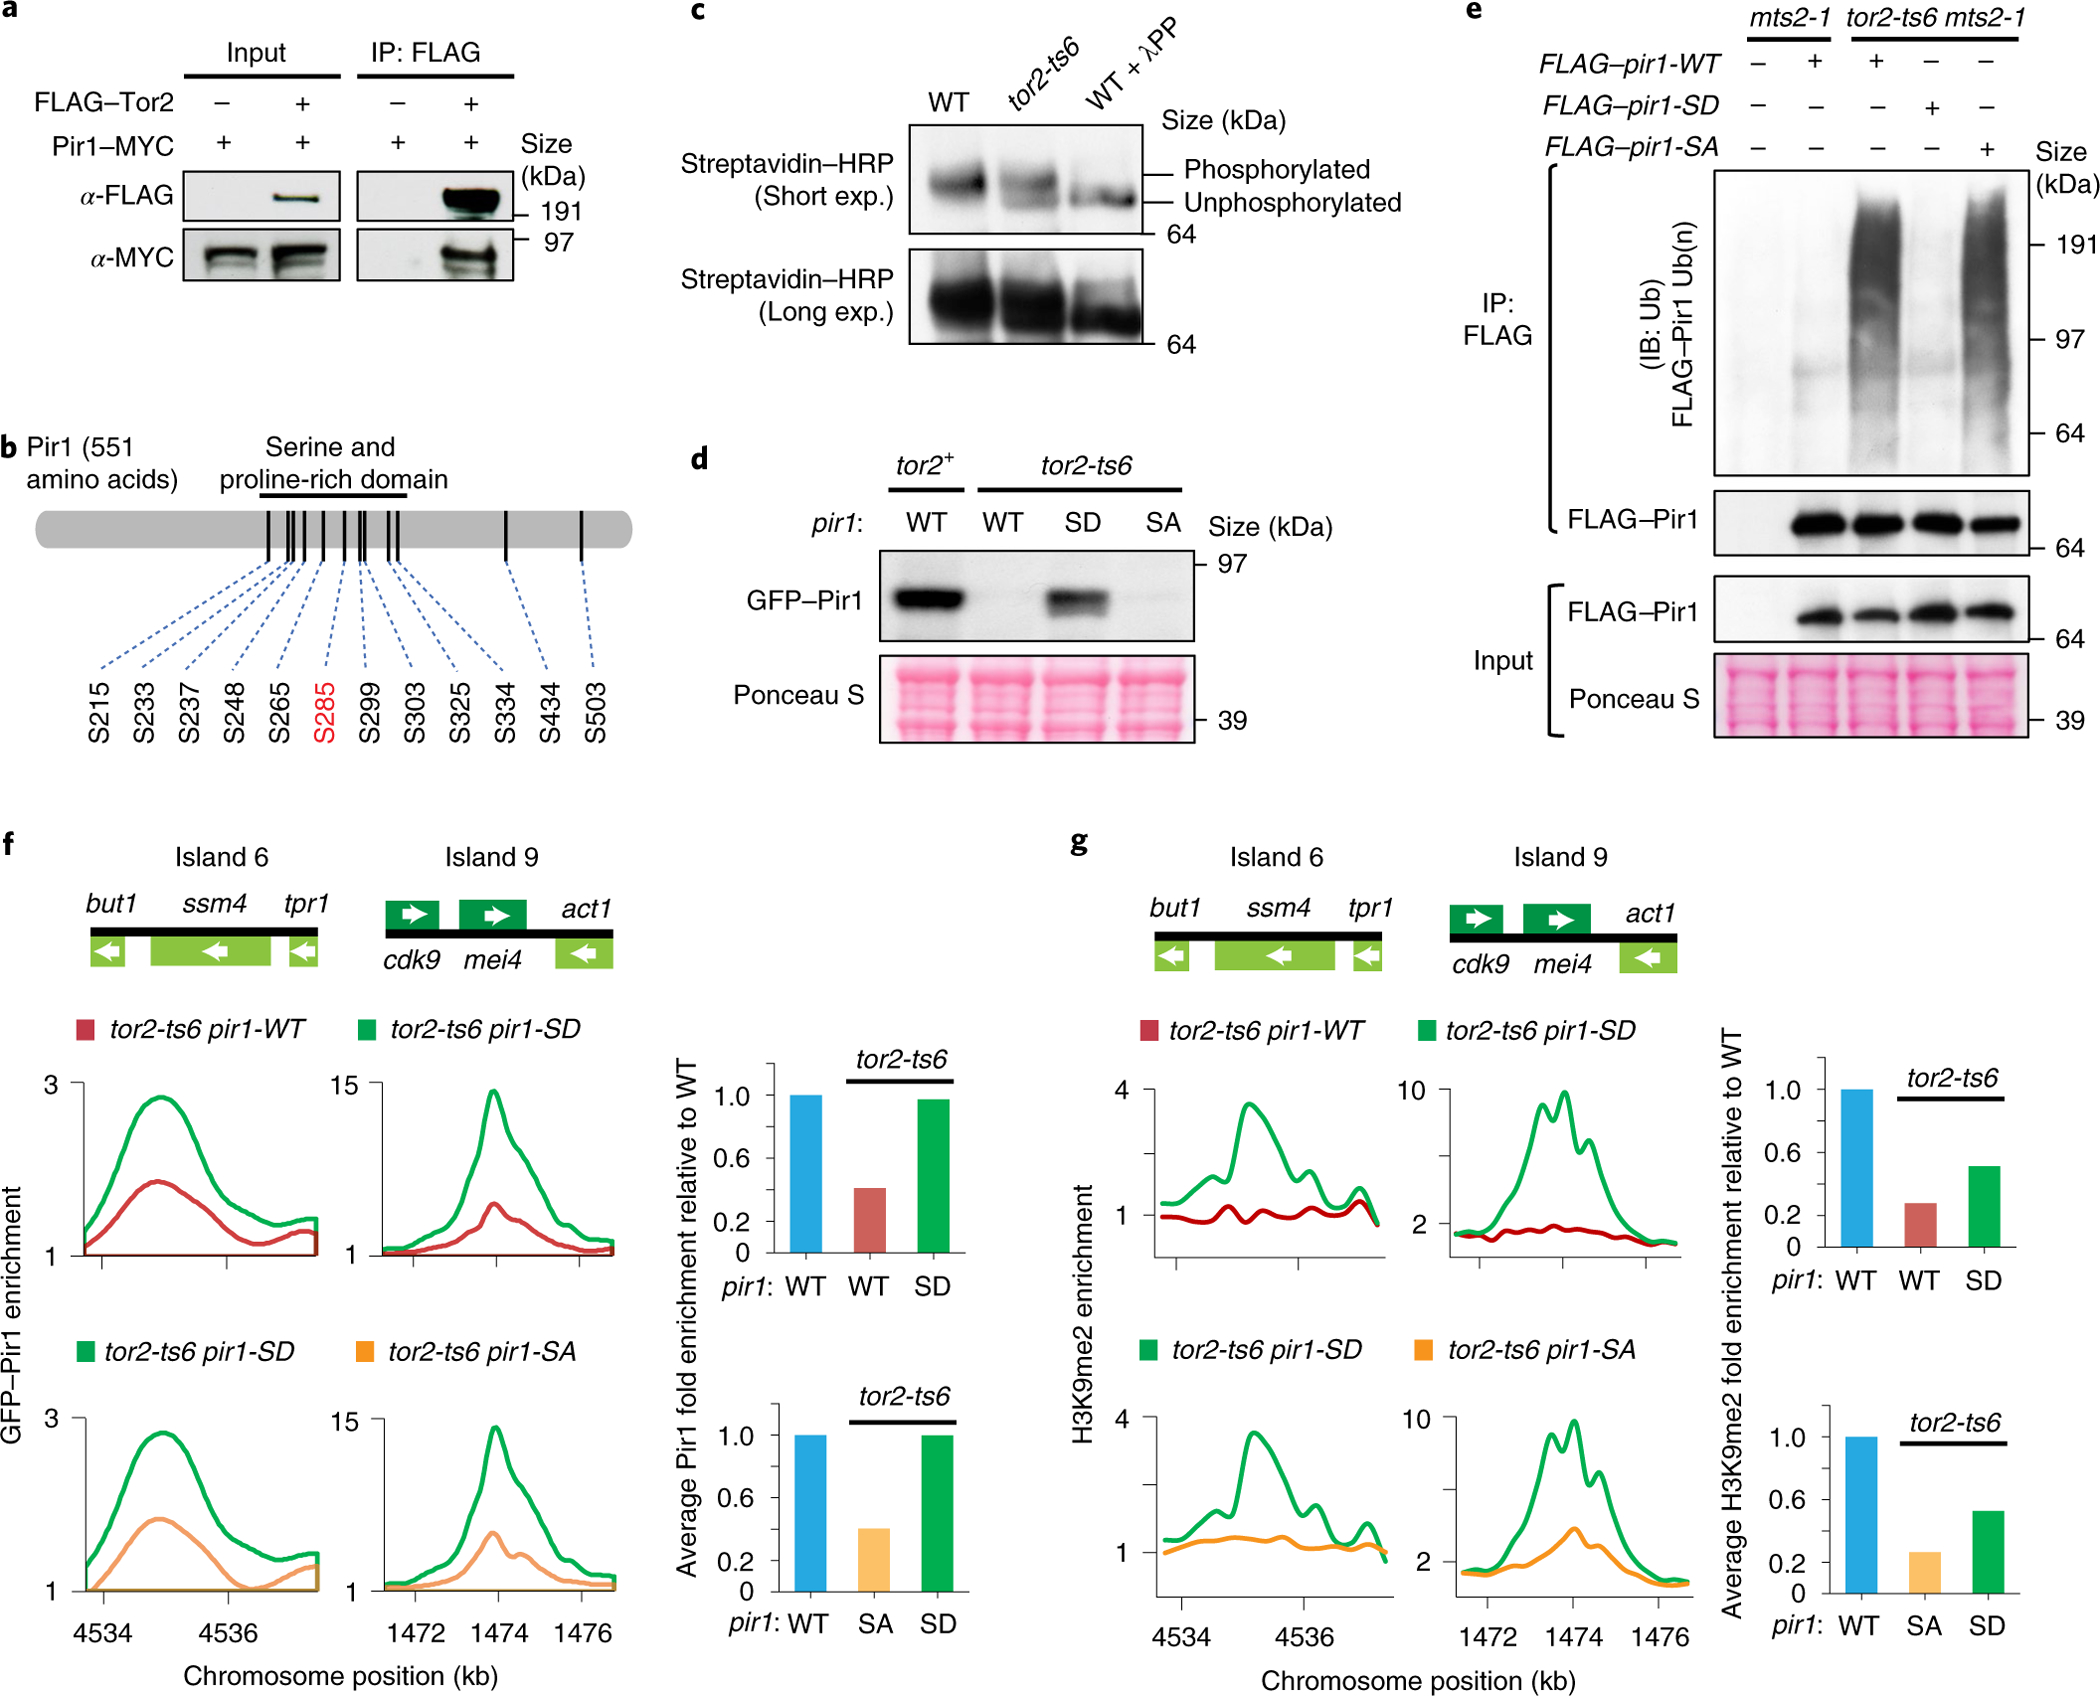
a, Tor2 and Pir1 co-IP analysis. b, Identified phosphorylated serine sites in the serine and proline-rich region of Pir1, with serine 285 highlighted in red. c, Western blot analysis of the in vivo phosphorylation state of Pir1 in WT and tor2-ts6 cells. Biotin-tagged Pir1 protein was expressed from an inducible promoter and enriched using streptavidin under denaturing conditions to ensure that equal quantities of the protein were loaded. Pir1 purified from WT cells was treated with λ-phosphatase (λPP) to confirm phosphorylation. Exp., exposure. d, Western blot analysis of Pir1. e, Analysis of WT and mutant Pir1 ubiquitination. The cells were cultured in rich medium at 33 °C for 8 h. FLAG–Pir1 was immunoprecipitated and subjected to western blot analysis using anti-ubiquitin and -FLAG antibodies. IP, immunoprecipitation; IB, immunoblot; and Ub(n), polyubiquitination. d,e, Ponceau S staining was used as a loading control (bottom). a,c–e, Two independent experiments were performed with similar results. f, ChIP-chip analysis of the distribution of WT and mutant Pir1 protein at MTREC-dependent islands in tor2-ts6 cells (left). Schematics on the top illustrate the genomic map of the heterochromatin islands shown. The average fold enrichment in Pir1 was determined for MTREC-dependent islands across the genome (right). g, ChIP-chip analysis of the H3K9me2 distribution (left). Schematics on the top illustrate the genomic map of the heterochromatin islands shown. The average fold enrichment in H3K9me2 was determined at MTREC-dependent islands across the genome (right). f,g, Data are representative of two independent experiments. SD, serine 285 replaced by aspartic acid; SA, serine 285 replaced by alanine. All cultures including tor2-ts6 cells were cultured in rich medium at 30 °C for 16 h, except where noted. Source data are provided.
The association of Tor2 with GFP–Pir1 suggested that Pir1 may be a direct substrate of TORC1. To identify potential phosphorylation sites, we purified Pir1 from WT and tor2-ts6 cells treated with BTZ and phosphatase inhibitors and enriched for phosphor-peptides. Mass spectrometry analysis revealed 12 phospho-serine residues largely clustered within the central, conserved serine and proline-rich domain (Fig. 2b and Extended Data Fig. 2b). Pir1 phosphorylation was greatly diminished in tor2-ts6 cells and disappeared following phosphatase treatment (Fig. 2c and Supplementary Table 3). The Tor2-containing TORC1 complex phosphorylated Pir1 in vitro and mutation of the 12 serine residues to alanine attenuated Pir1 phosphorylation (Extended Data Fig. 2a,c). Thus, Pir1 is phosphorylated by Tor2 in mitotic cells.
Phosphorylation by Tor2 promotes Pir1 stability and heterochromatin assembly.
We wondered whether Pir1 phosphorylation affects its stability. Replacement of the 12 phospho-serine residues with the phospho-mimic aspartic acid residue (Pir1–12SD) indeed conferred stability in tor2-ts6 cells (Extended Data Fig. 2d). Systematic analysis revealed that mutation of a single conserved serine, serine 285, to aspartic acid (Pir1-SD) was sufficient to stabilize Pir1 (Fig. 2d and Extended Data Fig. 2b), whereas mutation to alanine (Pir1-SA) failed to fully restore the Pir1 levels in tor2-ts6 cells, confirming the specific effect of the phospho-mimic residue (Fig. 2d). Consistently, ubiquitination of Pir1-SD in the tor2-ts6 mts2-1 mutant was reduced (Fig. 2e). Interestingly, the expression of Pir1-SD in tor2-ts6 cells restored the levels of Red1 (Extended Data Fig. 2e), suggesting that the reduction in Red1 in the tor2 mutant cells (Fig. 1c) is linked to the degradation of its interaction partner Pir1. Pir1-SD enrichment at gametogenic genes was restored in tor2-ts6 cells but the H3K9me levels were only partially rescued (Fig. 2f,g), indicating that Tor2 may target additional factor(s) to modulate facultative heterochromatin.
Pir1 degradation requires the polyubiquitin Ubi4 and the Cul4 E3 ligase.
Whereas the expression of Pir1-SD stabilized Pir1 in tor2-ts6 cells, prevention of the phosphorylation of serine 285 by expression of Pir1-SA did not confer instability in tor2+ cells (Extended Data Fig. 3a). Therefore, in addition to phosphorylating Pir1, Tor2 might perform other functions that impact the stability of Pir1. In this regard, we noted that the ubi4 gene, which encodes polyubiquitin implicated in sexual development34, was upregulated in tor2-ts6 cells (Fig. 3a). We investigated whether Ubi4 promotes Pir1 degradation in partnership with an E3 ligase. Deletion of ubi4 in tor2-ts6 cells indeed stabilized Pir1 (Fig. 3b). Moreover, loss of the ubiquitin ligase-associated Cullin-RING finger family protein Cul4, a component of ClrC35,36 that interacts with MTREC15, also stabilized Pir1 in both tor2-ts6 and nitrogen-starved cells (Fig. 3c and Extended Data Fig. 3b). Mutation of other E3 ligases had no major effect (Extended Data Fig. 3b). An association of Cul4 with Pir1 was detected by co-IP (Fig. 3d), supporting a direct role for this conserved E3 ligase.
Fig. 3 |. Ubi4 and Cul4–Ddb1 are required for Pir1 degradation.

a, Expression profile of the ubi4 locus in the indicated strains, determined by RNA-seq. Schematic on the top illustrates the ubi4 gene. RPM, reads per million mapped reads. b,c, Western blot analysis of Pir1. Ponceau S staining was used as a loading control. d,e, Pir1 and Cul4 (d) as well as Pir1 and Ddb1 (e) co-IP analysis. f, Analysis of Pir1 ubiquitination. The cells were cultured in rich medium at 33 °C for 8 h. Pir1–MYC was immunoprecipitated and subjected to western blot analysis using anti-ubiquitin and -MYC antibodies. g, Analysis of ade6-DSR expression. Schematic on the top illustrates the ade6-DSR reporter. Serial dilutions were spotted onto rich medium (YEA) or low adenine (YE) plates and then incubated at 30 °C for 2 days or 26 °C for 3 days. b–g, Two independent experiments were performed with similar results. h, Heatmap of the log2 fold changes in the expression of gametogenic genes in the homothallic strains. In addition to the known Mmi1 regulon genes, the expression of other genes containing DSR elements (bottom) was also affected. The expression of MTREC regulon genes in tor2-ts6 cells was normalized to the WT, whereas the expression in tor2-ts6 ubi4Δ, tor2-ts6 cul4Δ and tor2-ts6 ddb1Δ was normalized to that of tor2-ts6 cells. Homothallic cells were cultured in rich medium at 30 °C for 16 h. i–l, ChIP-chip analysis of the Pir1 (i,k) and H3K9me2 (j,l) distribution at MTREC-dependent islands (left). Schematics on the top illustrate the genomic map of the heterochromatin islands shown. The average fold enrichment for Pir1 or H3K9me2 at MTREC-dependent islands across the genome is shown (right). a,h–l, Data are representative of two independent experiments. All cultures including tor2-ts6 cells were cultured in rich medium at 30 °C for 16 h, except where noted. IP, immunoprecipitation; IB, immunoblot; and Ub(n), polyubiquitination. Source data are provided.
In addition to ClrC, Cul4 exists in an E3 ligase complex containing Ddb1 (refs. 37–39), which is closely related to the ClrC component Rik1. The loss of Rik1 did not affect Pir1 stability (Fig. 3c), suggesting that the Cul4–Ddb1 complex might be involved in Pir1 degradation. As with Cul4, Ddb1 interacted with Pir1 (Fig. 3e), and the loss of Ddb1 restored Pir1 stability in tor2-ts6 cells (Fig. 3c). Restoration of Pir1 in tor2-ts6 cells carrying ubi4Δ, cul4Δ or ddb1Δ was confirmed by immunofluorescence (Extended Data Fig. 3c). The addition of ubi4Δ, cul4Δ or ddb1Δ dramatically reduced Pir1 ubiquitination in tor2-ts6 mts2-1 cells (Fig. 3f). The residual Pir1 ubiquitination signal observed in cul4Δ and ddb1Δ cells in comparison to ubi4Δ cells suggests that Pir1 may be ubiquitinated by another ligase. However, Cul4–Ddb1 plays a major role in the mediation of the Ubi4-dependent degradation of Pir1.
Prevention of Pir1 degradation restores gene silencing in the tor2 mutant.
We next investigated whether the loss of Ddb1–Cul4 or Ubi4 could restore the silencing of DSR-containing gametogenic genes in tor2-ts6 cells. We created a reporter gene by inserting the DSR of the ssm4 gametogenic gene at the 3′ untranslated region of ade6 (ade6-DSR). On adenine-limiting medium, a white colony colour indicates the expression of ade6, whereas red indicates silencing. At a semi-permissive temperature, ade6-DSR was expressed in tor2-ts6 cells (Fig. 3g); however, the deletion of ubi4, ddb1 or cul4 restored ade6-DSR silencing (Fig. 3g and Extended Data Fig. 3d). The restoration of silencing required Pir1, as a loss of Ubi4 failed to silence ade6-DSR in pir1Δ cells (Fig. 3g).
The noncoding RNA meiRNA produced from the sme2 locus and its associated protein Mei2 sequester the RNA elimination factor Mmi1 during meiosis12,14. Given that Tor2 targets Mei2 to suppress sexual development40, and the sme2 and mei2 loci are among those upregulated in tor2-ts6 cells (Extended Data Fig. 3e), we tested whether Mei2–meiRNA might cause the silencing defects in tor2-ts6 cells. However, the deletion of sme2 or mei2 in tor2-ts6 cells failed to restore ade6-DSR silencing (Extended Data Fig. 3f). Thus, degradation of Pir1 in tor2-ts6 cells is the key factor in the upregulation of DSR-containing transcripts bound by Mmi1 and MTREC.
Remarkably, the loss of Ubi4, Cul4 or Ddb1 in tor2-ts6 cells restored the silencing of gametogenic genes genome-wide (Fig. 3h and Extended Data Fig. 3g). Apart from known Mmi1 targets, several other loci repressed by MTREC (MTREC regulon) were silenced in the double-mutant strains (Fig. 3h) and reactivated following the introduction of pir1Δ (Extended Data Fig. 3g). The loss of Ubi4 in tor2-ts6 cells restored Pir1 localization and the assembly of heterochromatin islands at gametogenic genes (Fig. 3i,j and Extended Data Fig. 4a,b). The loss of Cul4 also restored Pir1 localization in tor2-ts6 cells (Fig. 3k). However, as Cul4 is a component of ClrC required for H3K9me, the effect on heterochromatin islands could not be determined. Regardless, the loss of Ddb1 restored MTREC-dependent islands in tor2-ts6 (Fig. 3l and Extended Data Fig. 4a,b). We conclude that degradation of Pir1 by the ubiquitination-proteasome machinery is a major cause of gametogenic gene expression in tor2-ts6.
Pir1 stabilization by Tor2 sustains cell proliferation.
The TOR signalling pathway controls cell growth in eukaryotes4,5,28. Although TOR is frequently activated in cancer cells that proliferate under nutrient-scarce and stressful growth conditions4,5, the mechanism remains unclear. Intriguingly, cells expressing Pir1-SD, but not Pir1-WT or Pir1-SA, continued to divide on nutrient-limiting medium at a low temperature (Fig. 4a), suggesting that stabilized Pir1 supports cell proliferation under suboptimal growth conditions.
Fig. 4 |. Pir1 stabilization sustains cell proliferation under suboptimal conditions.

a, Serial dilutions of homothallic strains were spotted onto minimal medium (EMM) plates and incubated at 26 °C for 4 days (left) or 18 °C for 12 days (right). Data are representative of three independent experiments. b, Euler diagram representing the number of genes with increased expression in WT homothallic cells cultured in minimal medium at 18 °C (log2[fold change] ≥ 2) compared with tor2-ts6 homothallic cells (log2[fold change] ≥ 2). The statistical significance of the overlap between the two groups is shown (bottom; the P value was calculated from the hypergeometric distribution). c, Heatmap of the log2 fold changes in expression in homothallic cells cultured in minimal medium at 18 °C relative to WT homothallic cells cultured in rich medium at 30 °C. The transcripts were clustered based on their functions and transcript type; n, number of loci in each category; lncRNA, long noncoding RNA. d, Serial dilutions of cells cultured on rich (left) or minimal (right) medium and incubated at 29 °C for 4–5 days. e, Heatmap of the log2 fold changes in expression in cells cultured in rich or minimal medium relative to WT cells cultured in rich medium at 30 °C. f, Composite plot showing the median expression level, determined by RNA-seq, of gametogenic genes in WT and pir1Δ cells cultured in rich or minimal medium at 30 °C. TSS, transcription start site; TES, transcription end site. Distances marked (−0.2 kb and 0.4 kb) are relative to the TSS and TES, respectively. RPM, reads per million mapped reads. g,h, Expression of gametogenic genes (n = 40 genes listed in e). g, The indicated strains were cultured in rich medium at 30 °C. h, The WT cells in rich medium were cultured at 30 °C (left); all other cells were cultured in minimal medium at 18 °C. TPM, transcripts per million values. The top and bottom edges of the boxplots mark the third and first quantiles and the central line is drawn at the median. Whiskers are drawn at the median ± 1.58 × the interquartile range. b–h, Data are representative of two independent experiments. Source data are provided.
Pir1 is likely to be an important Tor2 effector for the control of cell growth. Wild-type cells cultured under nutrient-limiting low-temperature conditions shared a common set of upregulated loci with tor2-ts6 (Fig. 4b and Supplementary Table 4), suggesting that Tor2 activity is inhibited under suboptimal conditions to impede cell proliferation. The most prominent upregulated loci were developmentally controlled gametogenic genes, including the MTREC regulon, which are silenced during mitotic growth (Fig. 4c and Extended Data Fig. 5a). Noncoding RNAs, WTF (with tf) elements and genes involved in various cellular processes such as membrane transport were also included (Fig. 4c, Extended Data Fig. 5a and Supplementary Table 5). Expression of Pir1-SD, which is uncoupled from Tor2 regulation, but not Pir1-SA, suppressed the upregulation of these loci (Fig. 4c). These results indicate that Tor2-mediated stabilization of Pir1 thwarts genome reprogramming—particularly the upregulation of gametogenic genes—to sustain cell growth.
Loss of Pir1 impairs cell proliferation under nutrient-limiting conditions.
From our results, we predicted that pir1Δ cells would fail to proliferate under suboptimal conditions. We indeed observed that pir1Δ cells exhibited a growth defect on minimal medium but not rich medium (Fig. 4d and Extended Data Fig. 5b). This growth defect was due to non-proliferation rather than cell death (Extended Data Fig. 5c).
We performed expression profiling to probe the molecular basis of these growth differences. When pir1Δ cells were cultured in minimal medium, gametogenic genes and noncoding RNAs were upregulated in comparison to the WT (Fig. 4e, Extended Data Fig. 5d and Supplementary Table 6). Although many loci, including the MTREC regulon, were also upregulated in pir1Δ cells cultured in rich medium, their upregulation was considerably higher in minimal medium (Fig. 4e,f and Extended Data Fig. 5d). Thus, Pir1 dampens the expression of gametogenic genes to support mitotic growth under poor nutritional conditions (Extended Data Fig. 5e). Without Pir1, gene expression induced by nutrient-poor conditions rises above a critical threshold and inhibits cell proliferation.
Loss of Ubi4 sustains cell proliferation in tor2-ts6 cells.
The level of Pir1 linked to Tor2 activity should determine the ability to dampen gene expression and support cell proliferation. Similar to pir1Δ, tor2-ts6 cells showed a severe growth defect at a semi-permissive temperature (29 °C) on minimal medium but not on rich medium (Fig. 4d). The introduction of ubi4Δ into tor2-ts6 cells restored cell growth on minimal medium, which was prevented by the addition of pir1Δ (Fig. 4d). Thus, Ubi4 controls the degradation of Pir1 during nutritional stress, which is crucial for the shift to a non-proliferation state. However, considering that ubi4Δ could not fully restore the growth of tor2-ts6 cells at temperatures above 30 °C (Extended Data Fig. 5f), Tor2 probably performs additional functions, independently of controlling Pir1 stability, to support cell growth.
We next investigated how the loss of Ubi4 impacts the expression profile of tor2-ts6 cells. Gametogenic genes upregulated in pir1Δ cells in minimal medium were also upregulated in tor2-ts6 cells (Fig. 4g). The deletion of ubi4 in tor2-ts6 cells restored the silencing of gametogenic genes in a Pir1-dependent manner (Fig. 4g). Moreover, the same loci were suppressed in cells expressing Pir1-SD, but not Pir1-SA, under suboptimal growth conditions (Fig. 4h). Thus, Pir1 is an important downstream target of Tor2 that prevents gametogenic gene expression and sustains cell proliferation in suboptimal conditions.
Pir1 is depleted during early meiosis.
The gametogenic genes silenced by Pir1 during mitosis are expressed during sexual differentiation, suggesting that the levels of Pir1 might be altered during meiosis. We synchronized meiosis entry through the chemical inactivation of an ATP analogue-sensitive Pat1 kinase (pat1-as2) in G1-arrested cells41 (Extended Data Fig. 6a). The number of nuclei per cell and the expression profiles at different stages of meiosis were monitored (Extended Data Fig. 6b,c). Previously described gene expression clusters were evident during the early, middle and late stages of meiotic progression13 (Extended Data Fig. 6d). Notably, Pir1 was depleted during early meiosis (Fig. 5a) but gradually recovered by middle meiosis. The changes in Pir1 correlated with Tor2 activity, as determined by the phosphorylation of a Tor2 substrate, Rps6 (Fig. 5a). Thus, Pir1 is dynamically controlled by Tor2 during the meiotic developmental process to ensure Pir1 depletion specifically during early meiosis.
Fig. 5 |. Pir1 depletion disengages the RNA elimination machinery during meiosis.

a, Western blot analysis of Pir1 and Rps6 phosphorylation (P-) in synchronized meiotic cells. Rps6 phosphorylation was detected using the anti-phospho-Akt substrate (PAS) antibody. Veg, vegetative growth; –N, 4 h nitrogen starvation; the numbers (top) indicate the time (h) following meiosis induction. b, Fluorescence microscopy images of zygotes formed by homothallic cells expressing CFP–Mmi1, WT or mutant GFP–Pir1 and Red1–tdTomato. c, Fluorescence microscopy images of zygotes formed by homothallic cells expressing WT or mutant GFP–Pir1, MTREC subunit Mtl1, exosome subunit Rrp6 and/or Mmi1-associated protein Erh1 in the indicated strain backgrounds. The dashed lines in b and c outline individual meiotic cells. a–c, Two independent experiments were performed with similar results. d, Pir1 recruits MTREC and Rrp6 to Erh1–Mmi1 bound transcripts for RNA elimination. Following meiotic induction, the loss of Pir1 is linked to delocalization of both MTREC and Rrp6 (top). Stabilization of Pir1 in cells expressing phospho-mimic Pir1-SD is sufficient to reconnect Erh1–Mmi1 with MTREC and the exosome (bottom). e, ChIP-chip analyses of Pir1-WT and Pir1-SD distribution at the sme2 locus in homothallic tor2-ts6 cells cultured at 30 °C. Schematic on the top illustrates the sme2 locus. f, Effect of Pir1-SD expression on the accumulation of meiRNA. Diploid cells were cultured at 30 °C in YEA medium for 24 h and then transferred to EMM-N for nitrogen starvation. Cultures were collected at 0, 3, 6 and 9 h. The meiRNA was examined by northern blot analysis. Ribosomal RNA stained with ethidium bromide served as a loading control. Short (meiRNA-S) and long (meiRNA-L) forms of meiRNA expressed from the sme2 locus are indicated. e,f, Data are representative of two independent experiments. Source data are provided.
Depletion of Pir1 is crucial for proper meiotic progression.
We next tested whether prevention of Pir1 depletion impedes meiotic progression. We examined fluorescently labelled Pir1-WT and Pir1-SD protein as well as the associated factors in homothallic cells undergoing meiosis. Whereas Pir1-WT disappeared, Pir1-SD persisted during meiosis as multiple nuclear foci coinciding with Mmi1 and Erh1 foci (Fig. 5b,c). The MTREC subunits Red1 and Mtl1 as well as the exosome factor Rrp6 were recruited to Mmi1–Erh1 foci in Pir1-SD cells (Fig. 5b,c), suggesting that the stabilized Pir1 restores the MTREC and Rrp6 association with Mmi1 and Erh1 during meiosis (Fig. 5d).
Mmi1 and Erh1 are normally sequestered to form a single dot at the sme2 locus encoding meiRNA during meiosis14,22,42; however, multiple dots were observed in cells expressing Pir1-SD. Given that meiRNA contains multiple DSR elements14, stabilized Pir1 may impede its expression. Pir1-SD indeed localized to the sme2 locus in tor2-ts6 cells and prevented meiRNA accumulation during meiosis (Fig. 5e,f), probably disrupting sequestering and causing a redistribution of Mmi1 and Erh1 to target gene transcripts.
Consistently, Pir1-SD expression correlated with defects in meiotic progression. When meiosis was induced in homothallic cells cultured on sporulation medium for 48 or 72 h, the cells expressing Pir1-WT or Pir1-SA mated and entered meiosis to generate asci containing four spores (Fig. 6a). However, cells expressing Pir1-SD had a reduced sporulation frequency and higher ratio of mitotic cells (Fig. 6a). Thus, Pir1 destabilization is crucial to support proper meiotic progression.
Fig. 6 |. Depletion of Pir1 is crucial for DSB formation and proper meiotic progression.

a, Homothallic cells expressing GFP–Pir1 (WT or SD) were plated on minimal medium (EMM) for 48 (left) or 72 h (right). The percentage of different cell populations is shown. Data are representative of three independent experiments. b, RNA-seq analysis of rec25 (left), rec27 (middle) and mug20 (right) loci cells expressing Pir1-WT (top) or Pir1-SD (right). Schematics on the top illustrate the rec25, rec27 and mug20 loci. RPM, reads per million mapped reads. c, ChIP-chip analysis of meiotic DSBs (Rec12–DNA linkages) across chromosome 2 in cells expressing Pir1-WT (top) or Pir1-SD (bottom). Schematic on the top illustrates S. pombe chromosome 2. d, Heatmap of Rec12–DNA linkage enrichment plotted over a 16 kb window centred on the locations of each Rec12 peak (n = 284). Each row represents a 16 kb region and are sorted from highest to lowest overall Rec12 enrichment. e, ChIP-chip analysis of meiotic DSBs (Rec12–DNA linkages) across the indicated region in cells expressing Pir1-WT or Pir1-SD. Schematics on the top illustrate the genomic map of the representative DSB hotspots. The natural meiotic DSB hotspots mbs1 (top left) and mbs2 (top middle) are shown; ncRNA, noncoding RNA. b–e, Data are representative of two independent experiments. f, Recombination assay. Haploid strains harbouring the indicated ade6 alleles were crossed and, following meiosis, the haploid meiotic products were genotyped by random spore analysis to determine the frequencies of ade6+ recombinants (top). Cells expressing Pir1-WT or Pir1-SD were tested for their recombination proficiency using the hotspot (M26) alleles of ade6 (bottom). The frequency of this intragenic recombination was determined as ade+ per 1 × 10⁴ viable spores. ***P = 0.0004. The error bars indicate the s.d. from the mean (n = 3 independent experiments). Statistical significance was determined using a two-tailed Student’s t-test; ***P < 0.001. Source data are provided.
Stabilized Pir1 causes defects in meiotic DSB formation.
MTREC–Pir1 regulates many genes implicated in the first meiotic division (Fig. 3h, Extended Data Fig. 7a,b and Supplementary Table 7). Genes involved in the formation of meiotic double-strand breaks (DSBs; for example, rec25, rec27 and mug20), which are critical for recombination and proper chromosome segregation during meiosis-I43, are suppressed in cells expressing Pir1-SD (Fig. 6b). Moreover, DSBs are directed to loci expressing noncoding RNAs44, which might be targets of the RNA elimination machinery. We compared DSBs formed by the topoisomerase II-like protein Rec12 (Spo11 homologue) in cells expressing Pir1-WT or Pir1-SD. ChIP-chip profiling of Rec12 without crosslinking showed DSBs across the genome (Fig. 6c and Extended Data Fig. 7c), as described previously45. However, Rec12–DNA linkages were reduced in Pir1-SD cells, indicating impaired DSB formation (Fig. 6c–e and Extended Data Fig. 7c).
We next tested whether Pir1-SD affects meiotic recombination using the recombination hotspot (M26) in the ade6 gene46. Recombination between two different ade6 mutant alleles (ade6-M26 and ade6-M210) generated a selectable and functional ade6 allele (Fig. 6f). Compared with the WT, cells expressing Pir1-SD showed a marked decrease in recombination frequency (Fig. 6f).
Pir1 depletion is essential for proper chromosome dynamics during meiosis.
MTREC regulon genes control early meiotic events (Extended Data Fig. 7a and Supplementary Table 7). During meiosis, DNA replication is followed by two nuclear divisions. First, sisters remain associated and move together to the same pole (reductional segregation). Second, sisters segregate to opposite poles, as in mitotic cells (equational segregation). Meiotic recombination driven by DSBs facilitates chromosome segregation in meiosis-I47. Oscillatory movement, led by the telomere cluster, creates an elongated ‘horsetail’-shaped nucleus to facilitate the pairing of homologous chromosomes during the meiotic prophase48,49.
Pir1 suppresses genes involved in dynamic meiotic processes (Figs. 3h, 6b and Extended Data Fig. 3g and 7b). To examine whether Pir1 affects chromosome dynamics, we performed live-cell time-lapse imaging of fluorescently labelled proteins. As described earlier (Fig. 5a), Pir1-WT disappeared early and reappeared during the later meiotic stages, whereas Pir1-SD persisted (Fig. 7a). Pir1-SD cells showed impaired oscillation of chromosomes and a prolonged horsetail stage (approximately 160 min compared with approximately 120 min; Fig. 7a,b). Defective chromosome segregation and reduced spore viability were also noted (Fig. 7a and Supplementary Videos 1–3). Improper segregation of chromosomes to the poles during meiosis-I resulted in chromosomal material outside the main nuclei (Fig. 7a and Supplementary Video 2). In some cells, the nuclear mass was unequally distributed to the poles (Fig. 7a and Supplementary Video 3). Moreover, abnormal asci containing fewer than four, or no, spores were frequently generated (Fig. 7c).
Fig. 7 |. Artificial stabilization of Pir1 affects the chromosome dynamics during meiosis.

a, Pir1-SD expression leads to meiotic chromosome segregation defects. Time-lapse images are shown for meiosis progression in zygotes expressing GFP–Pir1 (WT or SD; left). The nuclei were labelled by Hht1–red fluorescent protein (RFP). The frequency of meiotic chromosome segregation defects was determined by live-cell imaging of zygotes expressing GFP–Pir1 (WT or SD; top right); ***P = 0.001. The percentage of asci containing four viable spores was determined by tetrad dissection of homothallic strains expressing GFP–Pir1 (WT or SD; bottom right); ***P = 0.0006. The error bars indicate the s.d. from the mean (n = 3 independent experiments); >100 zygotes or tetrads were scored. b, The duration of the horsetail movement was determined by live-cell imaging of zygotes expressing GFP–Pir1 (WT or SD). ***P = 2.6 × 10⁻⁹; the error bars indicate the s.d. from the mean; n, number of meiotic cells examined over three independent experiments. c, The percentage of asci containing different numbers of spores was determined from images of homothallic cells expressing GFP–Pir1 (WT or SD). d, Chromosome-segregation assay. A chromosome 1 homologue was labelled with cen1:: PSPOG_00147–tdTomato in zygotes expressing GFP–Pir1 (WT or SD). Three classes were defined based on the expression of the fluorophore tdTomato in four-spore asci (top). Class I, reductional meiotic segregation, ***P = 0.0009; Class II, equational meiotic segregation, **P = 0.0018; and Class III, one spore showing the fluorophore, suggesting chromosome loss (either complete or partial) during segregation, P = 0.0008 (bottom). The error bars indicate the s.d. from the mean (n = 3 independent experiments); >100 asci with four visible spores were scored. a,c,d, The dashed lines outline individual meiotic cells. a,b,d, Statistical significance was determined using a two-tailed Student’s t-test; **P < 0.01 and ***P ≤ 0.001. Source data are provided.
We then visualized segregation defects by integrating the red fluorophore gene (tdTomato), expressed from a spore-autonomous promoter, at centromere 1 (cen1–tdTomato) of only one of the two homologues50. Normal ordered meiosis yields two adjacent red spores, which are products of the same second meiotic division, at either end of the ascus. Chromosome mis-segregation yields an altered pattern of red spores. Reductional segregation was severely compromised and, correspondingly, equational segregation was observed in Pir1-SD cells (Fig. 7d). Moreover, a considerable fraction of asci showed cen1–tdTomato signal in only one spore (Fig. 7d). Thus, Pir1 depletion controls key chromosomal processes essential for the accurate and timely completion of meiotic cell division.
Pir1 dynamics coordinate meiotic gene expression patterns.
Our results suggest that the levels of Pir1 during meiosis are linked to the temporal control of gene expression. RNA-sequencing (RNA-seq) analysis of synchronized cells collected during the meiotic time course revealed that the early meiotic Pir1-depletion window coincided precisely with the upregulation of MTREC regulon genes, which were silenced at later meiotic stages (Fig. 8a and Extended Data Fig. 8a,b). Persistent MTREC regulon expression in pir1Δ and red1Δ cells (Fig. 8a and Extended Data Fig. 8a,b) indicated that MTREC–Pir1 is required for the restoration of target gene silencing.
Fig. 8 |. Tor2 control of the RNA elimination machinery coordinates developmental gene expression and facilitates proper chromosome segregation during gametogenesis.

a, Heatmap of the log2 fold changes in the expression of MTREC regulon transcripts in strains undergoing synchronized meiosis relative to vegetative (Veg) WT cells. Data are representative of two independent experiments. b, Segregation of cen1 decorated with lacO–GFP arrays (indicated by white arrowheads) in the spores of an ascus (top). Each spore receives one copy of chromosome 1 during normal meiotic segregation (Class I). Mis-segregation during one of the two second meiotic divisions results in a cen1–GFP dot outside the mature spores (Class II) or two cen1–GFP dots in one spore (Class III). Mis-segregation occurring in each of the second meiotic divisions yields two cen1–GFP dots in two spores (Class IV). The phenotypic class distribution (bottom left) and spore viability (bottom right) for each strain are plotted. Spore viability was determined by tetrad dissection (bottom right); ***PWT versus pir1Δ = 0.0006 and ***PWT versus red1Δ = 0.000016. The error bars indicate the s.d. from the mean (n = 3 independent experiments); >100 asci with four visible GFP dots were scored. Statistical significance was determined using a two-tailed Student’s t-test; ***P < 0.001. c, Model showing how Tor2 targets the RNA elimination machinery to sustain cell proliferation and control gametogenesis. In nutrient-replete conditions, the Tor2 complex (TORC1) phosphorylates the RNA processing factor Pir1 to confer stabilization, and MTREC–Pir1 silences gametogenic genes through RNA-transcript elimination and facultative heterochromatin assembly. Nitrogen starvation inactivates Tor2, which leads to Pir1 dephosphorylation and ubi4 upregulation. The Cul4–Ddb1 and possibly other ligases then mediate Pir1 ubiquitination and destabilization. Pir1 depletion causes disassociation of MTREC from Mmi1 and results in the expression of genes linked to reductional chromosome segregation, which occurs preferentially during the first meiotic division. Restoration of Pir1 during the second meiotic division recruits MTREC to restore silencing of the MTREC–Pir1 regulon, which is crucial for equational segregation of sister chromatids. Source data are provided.
Mis-expression of gametogenic genes in mitotic cells causes chromosome-segregation defects51. Notably, Pir1 recovery coincides with the switch from the first to the second meiotic division, following which chromosomes segregate equationally (Fig. 5a and Extended Data Fig. 6b). We investigated whether aberrant gene expression in pir1Δ and red1Δ, including genes involved in reductional segregation, interferes with meiotic divisions. We sporulated homothallic strains in which centromere 1 was marked with lacO/LacI–GFP (cen1–GFP). Normal meiosis yields tetrads with four spores, each bearing a single cen1–GFP dot (Fig. 8b, Class I). Both pir1Δ and red1Δ displayed frequent chromosome mis-segregation (Fig. 8b, Class II–IV). In addition to the cen1–GFP signal outside mature spores (Class II), tetrads containing two GFP dots were observed (Classes III and IV). Based on the cen1–GFP distribution patterns, mis-segregation occurred during the second meiotic division. Defective segregation correlated with frequent spore inviability (Fig. 8b). Together, these results suggest that temporal regulation of gene expression by MTREC–Pir1 restricts the expression of the MTREC regulon to a specific window to ensure proper meiotic chromosome segregation.
Discussion
Our analyses show that the TOR signalling cascade targets a conserved nuclear RNA elimination network to dynamically control gene expression by promoting RNA decay and facultative heterochromatin assembly (Fig. 8c). Phosphorylation by Tor2 stabilizes Pir1 in nutrient-rich conditions. On the other hand, Tor2 inactivation during nitrogen starvation leads to dephosphorylation of Pir1 and upregulation of a conserved stress-responsive polyubiquitin, Ubi4 (refs. 34,52), which ultimately trigger ubiquitination and degradation of Pir1 via a mechanism involving the Cul4–Ddb1 E3 ligase and the proteasome. By controlling Pir1, which connects MTREC to the Erh1–Mmi1 complex bound to RNA14,19,22,24, Tor2 probably selectively impacts MTREC engagement to specific transcripts without affecting other essential functions of the RNA elimination machinery.
We find that Tor2-mediated control of the RNA elimination machinery is critical for mitotic cell proliferation under suboptimal conditions. Pir1 stabilization by Tor2 mitigates the deleterious effects of widespread changes in gene expression, including upregulation of gametogenic genes—which occurs in poor growth conditions—to sustain mitotic growth. In addition to the promotion of RNA decay, MTREC–Pir1 recruits Clr4SUV39h to assemble heterochromatin and suppress untimely gene expression15,17,19. Given that abnormal expression of gametogenic genes, such as the MTREC regulon, is frequently linked to cancer53, it is possible that mTOR acts via RNA processing factors to suppress the oncogenic effects of aberrant gametogenic gene expression. The key serine residue phosphorylated by Tor2 in Pir1 resides in the serine and proline-rich domain that is conserved in the mammalian PAXT subunit ZFC3H1 (Extended Data Fig. 2b). Notably, higher ZFC3H1 expression correlates with poor patient prognosis, particularly in renal and prostate cancers, for which mTOR inhibitors are used therapeutically54. Moreover, knockdown of ZFC3H1 is sufficient to reduce prostate cancer-cell invasion and migration55.
Interestingly, Tor2-mediated control of the RNA elimination machinery orchestrates the temporal expression of developmental genes during gametogenesis (Fig. 8c). Depletion of Pir1 during the first meiotic division and its subsequent recovery ensures timely expression of meiotic genes, particularly the MTREC regulon, that coordinate fundamental chromosomal processes, including meiotic DSB formation, recombination and proper chromosome segregation. These findings raise two immediate questions. First, how does Pir1 degradation control the MTREC regulon during meiosis-I? We find that Pir1 depletion facilitates the accumulation of meiRNA, which is believed to sequester Mmi1 to de-repress gametogenic genes12,14. Moreover, Pir1 depletion disrupts the association of Erh1–Mmi1 with MTREC (this study)24, which disengages the RNA elimination machinery. Second, how is Tor2 reactivated during the shift to the second meiotic division? An interesting possibility is that autophagy generates a nitrogen source that reactivates Tor2 and stabilizes Pir1 as cells progress through meiosis. Autophagy mutants indeed show defects in meiosis progression and chromosome segregation56,57. Regardless, the dynamic control of the RNA elimination machinery is crucial for the meiotic divisions that yield haploid gametes.
TOR-mediated control of the RNA elimination machinery may clarify links between metabolism and reproductive potential. Defects in chromosome segregation during gametogenesis affect reproductive function in women, and metabolic disorders are linked to fertility issues58,59. Notably, RNA elimination factors are involved in proper meiotic progression during oogenesis and/or spermatogenesis in mammals60–62. Finally, our results may elucidate epigenetic reprogramming during development in mammals, such as erasure of epigenetic marks in primordial germ cells63. Future studies will address whether TOR acts via RNA elimination factors to reprogramme the epigenetic landscape during normal development and diseases such as cancer.
Online content
Any methods, additional references, Nature Research reporting summaries, source data, extended data, supplementary information, acknowledgements, peer review information; details of author contributions and competing interests; and statements of data and code availability are available at https://doi.org/10.1038/s41556-021-00631-y
Methods
Strains and media.
The S. pombe strains used in this study are listed in Supplementary Table 8. The tor2-ts6 temperature-sensitive mutant was provided by M. Yamamoto. The mts2-1 strain was provided by L.-L. Du. The pat1-as2 strain was provided by J. Gregan. The skp1ts-94 strain was provided by T. Toda. The strain used for the detection of Rec12–DNA linkages was provided by G. Smith. Deletion strains were constructed using a PCR-based gene-targeting strategy. The WT Pir1 and Pir1 phospho-mimic mutants were cloned into a pDUAL-based plasmid containing the amino-terminal GFP or FLAG–FLAG–His6 (FFH) tag and expressed under the pir1 promoter. Pir1-WT was cloned into a pDUAL-based plasmid containing the amino-terminal HBT (his6-Biotin-TEV) or GFP tag and expressed under the Pnmt1 promoter. The recombinant pDUAL plasmids were integrated at the leu1 locus. The plasmid pALo196 used for tagging the centromere (cen1:: PSPOG_00147-tdTomato) was provided by A. Lorenz. For the lacO/LacI–GFP system, the lacO repeats were integrated at the pericentromeric lys1 locus and LacI–GFP was integrated at his7.
Standard cell culture methods and media were used. The tor2-ts6 mutant was cultured at 26 °C overnight and then transferred to 30 °C for 16 h. The mts2-1 and tor2-ts6 mts2-1 strains were cultured at 26 °C overnight and then transferred to 30 or 33 °C for 8 h. For the +/− nitrogen conditions, EMM was prepared with or without 93.5 mM NH4Cl. Media with different glucose concentrations were prepared by the addition of 0.1, 0.5 or 2% glucose to the EMM medium. For the BTZ (Sigma-Aldrich) treatment, the cells were cultured at 33 °C in YEA liquid culture and then treated with 10, 30 or 100 μM BTZ for 6 h. Heterothallic cells were used for the experiments, unless indicated otherwise. For nitrogen starvation, the cells were cultured in EMM–N (EMM medium without nitrogen) at 30 °C for 8–12 h for the ChIP and western blot experiments. For glucose starvation, the cells were cultured in EMM with different concentrations of glucose at 30 °C for 12 h. To perform expression profiling and cell-growth analyses in suboptimal growth conditions, hetero- and homothallic cells were cultured in EMM minimal medium at 26 or 18 °C. To induce meiosis for cell imaging, homothallic cells were spotted onto EMM plates and incubated at 26 °C for 2–3 days.
ChIP.
ChIP and ChIP-chip experiments were performed as previously described19. Briefly, the cultures were cultured to the mid-log phase at 30 °C in the specified medium. For the H3K9me2 ChIP, the cells were fixed with 3% paraformaldehyde for 30 min at room temperature. For the Pir1 ChIP, the cells were fixed with 3% paraformaldehyde and subjected to additional crosslinking with 10 mM dimethyl adipimidate (Sigma-Aldrich) for 45 min at room temperature. The cells were lysed in 400 μl ChIP lysis buffer (50 mM HEPES–KOH pH 7.5, 140 mM NaCl, 1% Triton X-100, 0.1% sodium deoxycholate, 1 mM PMSF and Roche complete protease inhibitors cocktail) using a Precellys 24 homogenizer (Bertin). The genomic DNA was sonicated using a Bioruptor (Diagenode) for 14 cycles on the medium power setting (30 s ON; 30 s OFF) at 4 °C to enrich for 0.4–0.6 kb fragments. After removing the cellular debris by centrifugation at 1,500g for 10 min at 4 °C, the lysate supernatant was brought up to a final volume of 1 ml using ChIP lysis buffer and pre-cleared with 20 μl of a Protein A/G-plus agarose slurry (Santa Cruz) for 1 h at 4 °C. The pre-cleared lysates were centrifuged at 1,000g for 1 min and the lysate supernatant was transferred to a new tube for subsequent immunoprecipitation. A volume of 20 μl (2% of total) of the lysate was reserved as the whole-cell-extract input control. The remaining 980 μl of lysate was incubated overnight with the appropriate antibody (2–5 μg) at 4 °C with gentle agitation. Anti-H3K9me2 (Abcam), anti-GFP (Abcam) or anti-c-MYC (BioLegend) antibodies were used for immunoprecipitation. The immunopurified chromatin-bound Protein A/G-plus agarose slurry was incubated at 4 °C for 5 h and then washed twice with the following solutions: ChIP lysis buffer, wash buffer II (ChIP lysis buffer with 500 mM NaCl), wash buffer III (10 mM Tris–HCl pH 8, 250 mM LiCl, 0.5% IGEPAL, 0.5% sodium deoxycholate and 1 mM EDTA) and TE buffer. The immunoprecipitated chromatin was eluted twice by incubating in TE supplemented with 1% SDS for 30 min each at 65 °C. The pooled eluates, along with the reserved whole-cell extract, were reverse crosslinked at 65 °C for 16 h. The DNA was purified using a QIAquick PCR purification kit (Qiagen) after treatment with 4 μg RNase A and 40 μg proteinase K for 30 min each at 37 °C. The ChIP DNA and input DNA were analysed by performing quantitative PCR (qPCR) or by hybridization to a DNA microarray. Each experiment included two or more biological replicates per genotype of interest. Real-time ChIP–qPCR reactions were performed using the iTaq universal SYBR Green supermix (BioRad) with ChIP DNA or input DNA. The gene-specific oligonucleotides used for ChIP–qPCR are listed in Supplementary Table 9.
For the ChIP-chip analyses, the DNA was amplified using a two-step random-primed PCR for microarray analysis as described previously25. Aminoallyl-dUTP-labelled DNA was conjugated with Cy5 (ChIP DNA) or Cy3 (input DNA) for hybridization to a custom 4 × 44,000 oligonucleotide array spanning the whole genome at intervals of 300 base pairs (bp; Agilent). Hybridization, washes and array scans were performed according to Agilent’s recommended procedure. Data were extracted and processed using the Agilent feature extraction software. The Cy5/Cy3 ratio of LOWES-normalized signals was used to calculate the enrichment values, which were further processed by a three-probe sliding-window filter to reduce noise. The enrichment values were subjected to a sliding-window filter that replaced every enrichment value exceeding more than twice or falling below 50% of the average enrichment of its two neighbours by the average enrichment of the neighbouring positions. In addition, the enrichments were subjected to an averaging window of 500 bp. To calculate the average fold change in the ChIP signal, the mean ChIP signals were derived from RPM-normalized bedGraphs computed from the original alignments and then scaled to that of the wild type across the MTREC-dependent heterochromatin islands in the wild-type and mutant strains.
RT–qPCR.
Total RNA was isolated using the MasterPure yeast RNA purification kit (Lucigen). Total complementary DNA was synthesized from DNase-treated total RNA using the SuperScript-III reverse transcriptase (Invitrogen) and a mixture of random hexamers and oligo(dT). Real-time qPCR with reverse transcription (RT–qPCR) reactions were performed using the iTaq universal SYBR Green supermix (BioRad). Delta-delta Ct normalization used act1 as the reference gene. The gene-specific oligonucleotides used for the RT–qPCR are listed in Supplementary Table 9.
RNA-seq library preparation and analysis.
RNA-seq libraries were prepared, sequenced and analysed as previously described19. Briefly, total RNA was isolated using a MasterPure yeast RNA purification kit (Lucigen) and then ribosomal RNA was removed using a Ribo-Zero magnetic gold rRNA removal kit (yeast; Illumina). The library was constructed using a ScriptSeq v2 RNA-seq library preparation kit (Illumina) or Ultra II directional RNA library prep kit for Illumina (NEB). The final library was analysed using an Agilent 2100 BioAnalyzer and sequenced on the Illumina MiSeq or Illumina NextSeq 500 platforms. The reads generated from the RNA-seq libraries were quality trimmed using Trimmomatic64 and subsequently aligned to the S. pombe v2.29 reference genome65 using the STAR aligner66. PomBase v2.29 annotations in GFF format were used for feature assignment.
Graphs of the RNA-seq read density across features were made from strand-specific, variable-interval bedGraphs normalized to the RPM. The bedGraphs were generated by the STAR aligner during read alignment using a combination of the output options ‘–outWigType bedGraph’, ‘–outWigStrand Stranded’ and ‘–outWigNorm RPM’. Variable-interval bedGraphs were converted to bedGraphs with uniform intervals of ten bases (script available on request), which were suitable for direct comparison between features. For the analysis of temporal patterns of transcript expression during meiosis, the assignment of aligned reads to PomBase-annotated features was made during the alignment step (STAR option–quantMode GeneCounts). The resulting counts per feature were normalized to the reads per ten million mapped reads for transcript-wise comparison across time points. To construct heatmaps of the transcript abundance during meiotic progression, the normalized read counts per feature per time point were converted to the log2 ratio of the time-point counts to the corresponding vegetative-control counts. Heatmaps of meiotic progression were generated using Plotly (https://plotly-r.com).
Differential expression of transcripts between mutant strains was calculated from aligned reads using DEGseq67. The fold changes that were used were taken from the ‘log2.Fold_change..normalized’ column of the DEGseq output along with the associated P value. Heatmaps showing the log2 fold change in transcript levels between mutants were generated using the ComplexHeatmap68. Euler diagrams were created using eulerr (https://cran.r-project.org/package=eulerr). The GO Slim terms for S. pombe were mapped to genes using the Princeton Web-based GOTERMMAPPER69 and the significance of term enrichment was assessed using the one-tailed P value of Fisher’s exact test.
Classification of transcripts for heatmaps.
Transcripts were categorized as ‘meiotic’ if the GO biological process terms assigned to them by PomBase contained the words ‘meiotic’ or ‘meiosis’, or if the name, former name or synonym contained the designation ‘meu’ (meiotic expression upregulated) or ‘mug’ (meiotically upregulated gene). The MTREC regulon genes are provided in Supplementary Table 7. The WTF elements, noncoding and antisense transcripts were defined according to the categorizations made by PomBase.
For the pie-chart analyses, genes were manually partitioned into broad groups on the basis of significantly enriched (P ≤ 0.05; hypergeometric distribution) GO biological process terms. Manual partitioning of genes into groups was performed with the aid of the Orange gene-enrichment widget found in the Bioinformatics toolkit. Further fine partitioning on the basis of gene descriptions was performed with the aid of the text parsing and word enrichment widgets found in the Orange Text processing toolkit.
Composite plots.
Stranded bedGraphs, normalized to the RPM, were generated by the STAR aligner as described earlier. These variable-interval bedGraphs were converted to RPM-normalized bedGraphs with ten-base uniform intervals and subsequently smoothed by taking a rolling mean over five consecutive intervals. The smoothed bedGraphs were used to construct read-depth profiles for the features of interest by fitting a spline curve to the bedGraph data and then interpolating values for 100 uniform intervals spanning each variable-length feature. In addition, 20 intervals were interpolated for a fixed-length region of 200 bp, both upstream and downstream of each feature, to produce final profiles of 140 intervals. Composite traces were generated from individual profiles for a set of features by taking the median value of the set at each of the 140 intervals.
Protein purification and mass spectrometry.
Cells were harvested from 2-l cultures cultured in rich medium overnight to an optical density at 595 nm (OD595) of 1.5, washed and flash frozen in liquid nitrogen. Thawed cell pellets were ground with glass beads in a Pulverisette 6 system (Labsynergy) in solubilization buffer (20 mM HEPES–KOH pH 7.6, 20% glycerol, 500 mM NaCl, 2 mM MgCl2, 150 mM KCl, 0.1% IGEPAL, 1 mM dithiothreitol (DTT), 1 mM EDTA, Roche complete protease inhibitors cocktail and 1 mM PMSF). The lysate was cleared by centrifugation at 27,000g for 1 h and the supernatant was incubated with anti-FLAG M2 affinity gel (Sigma) or anti-GFP agarose beads (GFP-Trap Chromotek) for 2 h at 4 °C. The beads were washed extensively in BAC150 (20 mM HEPES–KOH pH 7.6, 20% glycerol, 2 mM MgCl2, 1 mM EDTA, 150 mM KCl, 0.1% IGEPAL, Roche complete protease inhibitors cocktail and 1 mM PMSF) and the precipitated proteins were eluted with 200 μl of 1 mg ml−1 3×FLAG peptide (Sigma) or 0.2 M glycine (for GFP immunoprecipitations). The proteins were then precipitated with 10% TCA and resuspended in sample buffer. The samples were separated in a 4–12% bis–Tris gel (Invitrogen). The protein bands were stained with Coomassie blue and subjected to in-gel tryptic digestion to extract peptides. Mass spectrometry was performed as described previously70. The protein search was performed against the UniProt S. pombe database from the European Bioinformatics Institute (https://www.uniprot.org/proteomes/UP000002485).
To identify the Pir1 phospho-sites, GFP–Pir1 was overproduced from the Pnmt1 promoter in both WT and tor2-ts6 cells in 100 ml PMG medium at 26 °C for 12 h and then transferred to 2 l PMG medium at 30 °C for 16 h. The cells were lysed in solubilization buffer containing 20 μM BTZ and 1% (vol/vol) phosphatase inhibitor cocktail set I and set II (Sigma-Aldrich). After protein purification, the beads were washed extensively in BAC150. The beads were washed twice with 25 mM ammonium bicarbonate pH 8.0 for on-bead trypsin digestion. Phosphopeptides were enriched using the Pierce magnetic titanium dioxide phosphopeptide enrichment kit (Thermo Fisher). The phosphopeptides were desalted using C18 columns (Thermo Fisher) and lyophilized. The dried peptides were reconstituted in 0.1% TFA and loaded onto an Acclaim PepMap 100 C18 LC column (Thermo Fisher) utilizing a Thermo Easy nLC 1000 LC system (Thermo Fisher) connected to a Q Exactive HF mass spectrometer. The peptides were eluted with a 5–28% gradient of acetonitrile with 0.1% formic acid over 92 min and 28–40% gradient of acetonitrile with 0.1% formic acid over 35 min with a flow rate of 300 nl min−1. The MS1 scans were performed at a resolution of 60,000 over a mass range of 380–1,560 m/z, with a maximum injection time of 120 ms and an AGC target of 1 × 10⁶. The MS2 scans were performed at a resolution of 15,000, with the normalized collision energy set to 27, a maximum injection time of 50 ms and an AGC target of 2 × 10⁵. The raw mass spectrometry data were searched against the S. pombe 972 proteome database using Sequest HT, MS Amanda and ptmRS algorithms in Proteome Discoverer 2.2 (Thermo Fisher). The precursor ion mass tolerance was set to 10 ppm and the fragment ion mass was 0.02 Da. Dynamic modifications were set for methionine oxidation and phosphorylation on serine, threonine and tyrosine. Only fully tryptic peptides with up to two mis-cleavages and a false-detection rate of 1% using the percolator validator algorithms were accepted.
Immunoprecipitation and western blot analyses.
The immunoprecipitation experiments were performed as previously described19. Anti-FLAG M2 affinity gel (Sigma-Aldrich), anti-GFP agarose beads (GFP-Trap, Chromotek) or anti-c-MYC agarose affinity gel (Sigma-Aldrich) were used for immunoprecipitation. The sample preparation for the western blotting was performed using an alkaline-protein30 or TCA18 extraction method. Anti-c-MYC (1:1,500 dilution; BioLegend), anti-GFP (1:1,500; Roche), anti-FLAG M2 (1:1,500; Sigma-Aldrich), anti-ubiquitin (1:1,500; Cell Signaling Technology), anti-thiophosphate-ester (1:1,500, Abcam), anti-Xpress (1:1,500; Thermo Fisher), anti-phospho-Akt substrate (1:1,500; Cell Signaling Technology), anti-RPS6 (1:1,500; Cell Signaling Technology) antibodies and streptavidin-peroxidase (1:5,000; Sigma-Aldrich) were used for probing.
Pir1 phosphorylation.
For in vitro Pir1 phosphorylation, the recombinant His6–Xpress–Pir1 proteins were expressed in E. coli BL21-CodonPlus (DE3, Agilent) and purified using Ni-NTA agarose beads (QIAGEN) according to QIAGEN’s recommended procedure. The TORC1 complex was immunoprecipitated from S. pombe cells expressing FLAG–Tor2 using Pierce anti-DYKDDDDK magnetic agarose (Thermo Fisher). The purified WT and 12SA (S215A, S233A, S237A, S248A, S265A, S285A, S299A, S303A, S325A, S334A, S434A and S503A) recombinant His6–Xpress–Pir1 proteins were mixed with equal volumes of FLAG–Tor2–magnetic agarose in 60 μl kinase buffer (30 mM HEPES pH 7.2, 50 mM KAc, 10 mM MgCl2, 1 mM DTT and Roche complete protease inhibitor cocktail) containing 500 μM ATP-γS (Abcam). ATP-γS was used as the phosphate donor to generate the thiophosphorylated Pir1 by the TORC1 complex. The reaction mixtures were incubated in 1.5-ml tubes on a Thermomixer (Eppendorf) at 1,200 r.p.m. for 30 min at 30 °C. The tubes were placed on the DynaMag-2 magnet (Invitrogen) to stop the reaction and the supernatant was removed to another tube. The beads were resuspended in SDS loading buffer for western blot analysis of FLAG–Tor2. The supernatants were further supplemented with 2.5 mM p-nitrobenzyl mesylate (Abcam), which reacts with thiophosphorylated substrates to form a thiophosphate-ester. The alkylating reactions proceeded at 25 °C for 1 h. The reactions were separated in a 4–12% bis–Tris gel (Invitrogen), followed by western blotting using anti-thiophosphate-ester (1:1,500; Abcam) and anti-Xpress (1:1,500; Thermo Fisher) antibodies to detect phosphorylated Pir1 and total Pir1, respectively.
For in vivo Pir1 phosphorylation, biotin-tagged Pir1 was expressed under the Pnmt1 promoter in both WT and tor2-ts6 cells in 5 ml PMG medium at 26 °C for 12 h and then transferred to 50 ml PMG medium at 30 °C for 16 h. The cells (50 OD595 units) were lysed with 500 μl of 1.85 M NaOH and 7.4% β-mercaptoethanol on ice for 5 min. After the addition of 500 μl of 55% TCA, the total proteins were precipitated for 10 min on ice. After centrifugation, the pellet was washed twice with ice-cold acetone and resuspended in 1 ml denaturing buffer (6 M guanidine–HCl, 50 mM sodium phosphate, 10 mM Tris–HCl pH 8.0 and 0.05% Tween-20). All subsequent steps were carried out at room temperature. The pH was adjusted to 8.0 by adding 10–15 μl of 1 M Tris base. The suspension was incubated for 1 h for protein solubilization. After centrifugation, the supernatant was transferred to a new tube and incubated with 20 μl Pierce high-capacity streptavidin agarose (Thermo Fisher) for 2 h. The beads were then washed three times with 1 ml wash buffer (8 M urea, 100 mM sodium phosphate, 10 mM Tris–HCl pH 6.8 and 0.05% Tween-20). The beads from the WT sample were divided into two tubes. One was washed twice with 1×NEBuffer for protein metallophosphatases (PMP) and then resuspended in 40 μl 1×PMP with 1 mM MnCl2 and 2 μl λ-phosphatase (NEB). The reaction mixture was incubated at 30 °C for 30 min. Biotin–Pir1 was eluted using 30 μl elution buffer (8 M urea, 200 mM Tris–HCl pH 6.8, 1 mM EDTA, 5% SDS, 1 mM biotin (Sigma-Aldrich) and 1.5% DTT) at 95 °C for 5 min. The eluates were separated in a 4–12% bis–Tris gel (Invitrogen) and then analysed by western blotting using streptavidin-peroxidase (1:5,000; Sigma-Aldrich). The phosphorylated form of Pir1 is the upper band in the gel.
Ubiquitination assay.
For the in vivo Pir1 ubiquitination experiments, cells were cultured in rich medium at 33 °C for 8 h and harvested from 50-ml cultures at an OD595 of 0.8, washed and flash frozen in liquid nitrogen. Thawed cell pellets were ground with glass beads in a Precellys 24 homogenizer (Bertin) in 150 μl lysis buffer (2 mM KH2PO4, 8 mM Na2HPO4, 500 mM NaCl, 2.6 mM KCl, 0.05% IGEPAL, 10% glycerol, 1 mM DTT, Roche complete protease inhibitor cocktail and 1 mM PMSF) with 1% SDS. The samples were denatured at 100 °C for 10 min and the cell lysate was diluted by adding 450 μl lysis buffer. After removing the cellular debris by centrifugation at 14,000g for 10 min at 4 °C, the pre-cleared lysate was incubated with Pierce anti-DYKDDDDK magnetic agarose (Thermo Fisher) or Pierce anti-c-MYC magnetic beads (Thermo Fisher) at 4 °C for 2 h. The beads were washed extensively in lysis buffer with 0.1% SDS and eluted with HU loading buffer (8 M urea, 200 mM Tris–HCl pH 6.8, 1 mM EDTA, 5% SDS, 0.1% (wt/vol) bromophenol blue and 1.5% (wt/vol) DTT). The samples were separated on a 4–12% bis–Tris gel (Invitrogen), followed by western blotting using anti-ubiquitin antibody to detect ubiquitinated Pir1.
Immunofluorescence.
The immunofluorescence experiments were performed as previously described19. Paraformaldehyde-fixed cells were incubated with the anti-c-MYC (BioLegend) antibody at 1:1,000. The cells were subsequently incubated with secondary antibody, Alexa Fluor 488-conjugated goat anti-mouse antibody (Molecular Probes). The cells were spread and air dried on a glass slide and the nuclei were stained with DAPI in ProLong Gold antifade mountant (Molecular Probes). Fluorescence signals were imaged using a DeltaVision Elite fluorescence microscope (Applied Precision, GE Healthcare) with a ×100/1.4-NA objective. Optical z sections (0.2-μm step size; five sections) were merged into one image using the maximum intensity projection method of the softWoRx software. Fiji (ImageJ, https://imagej.net/Using_Fiji) was used to process the images.
Fluorescence live-cell microscopy.
For meiotic-cell imaging, homothallic cells were first cultured to the mid-log phase in YEA liquid and then spotted onto EMM plates and incubated at 26 °C for 2–3 days to induce meiosis before imaging. For cen1–tdTomato reductional segregation, strains tagged with cen1–tdTomato were crossed with the untagged strains on an SPA plate at 26 °C for 2 days before imaging. The cells were scraped and resuspended in 50 μl fresh EMM medium. The resuspended cells (4 μl) were mounted on a 2% agarose pad formed on a glass slide. The fluorescence signals were imaged using a DeltaVision Elite fluorescence microscope (Applied Precision, GE Healthcare) with a ×60/1.42-NA objective. Optical z sections (0.3-μm step size; five sections) were merged into one image using the maximum intensity projection method of the softWoRx software. Fiji (ImageJ, https://imagej.net/Using_Fiji) was used to process the images.
For methylene-blue staining, cells cultured on EMM plates were scraped and washed twice with 1 ml PBS at room temperature. The cell pellets were resuspended in 100 μl PBS, mixed with 100 μl of 0.0002% methylene blue in PBS and incubated in the dark at room temperature for 5 min. The cells were then centrifuged, washed twice in 1 ml PBS and kept in the dark before imaging. Snapshots of the methylene blue-stained cells were acquired at the setting for Cy5 (excitation at 632 nm and emission at 679 nm) and overlaid on bright-field images for scoring.
For time-lapse imaging, homothallic cells were cultured to the mid-log phase in YEA liquid, spotted onto SPA plates and incubated at 26 °C for 4 h to induce meiosis. The cells were scraped and resuspended in EMM medium and immobilized on the bottom of soybean lectin-coated 35-mm glass-bottom culture dishes (MatTek). Imaging was done as specified above. The optical z sections (0.4-μm step size; eight sections) acquired for each field were obtained at 10-min intervals over 8–10 h.
Synchronized meiosis.
The synchronized meiosis experiments were performed as previously described41. Briefly, h-/h- pat1-as2/pat1-as2 ade6-210/ade6-216 diploid cells expressing the mat-Pc gene were cultured in YE + 4S-Ade medium at 25 °C to an OD595 of 0.55, harvested and transferred to EMM–N at 25 °C for 4 h to arrest the cells in the G1 phase. The cultures were centrifuged and resuspended in EMM medium at 25 °C. Meiosis was induced by adding 25 μM 1NM-PP1 (Sigma-Aldrich). Samples of the cell culture were collected every 60 min for the meiosis time course. The cells were fixed in 70% (vol/vol) ethanol and stained with DAPI for counting.
Northern blot analysis.
Diploid cells were cultured at 30 °C in YEA medium for 24 h and then transferred to EMM–N medium at 30 °C for nitrogen starvation. Cultures were collected at 0, 3, 6 and 9 h. Total RNA was isolated by incubating cells in phenol heated to 65 °C for 10 min, followed by three additional extractions using phenol–chloroform. The RNA was precipitated by sodium acetate and ethanol. Northern blots were performed as described previously19. The RNA (5 μg) was resolved on a 1% formaldehyde–agarose denaturing gel, capillary transferred using NorthernMAX transfer buffer (Thermo Fisher) onto positively charged BrightStar-Plus nylon membrane (Ambion) and crosslinked using a UV Stratalinker 2400 (Stratagene). A T7 in vitro transcription kit (Promega) was used to generate α-P32-UTP (PerkinElmer)-labelled RNA probes (sme2, 27–329) that were hybridized to the membrane overnight at 65 °C in ULTRAhyb buffer (Ambion). The membrane was exposed and scanned using a Typhoon FLA 9500 phosphor imager (GE Healthcare).
Preparation of meiotic chromatin and Rec12–DNA linkage analysis.
Cells were cultured and induced for meiosis as described45, with some modifications. Briefly, pat1-114 rec12-201-6×His-2×FLAG rad50S haploid cells were first cultured to an OD595 of 0.4 in EMM liquid at 26 °C and then nitrogen starved with EMM–N medium at 26 °C for 6 h to arrest the cells in the G1 phase. The starved cultures were centrifuged and resuspended in EMM medium in 34 °C to induce synchronized meiosis for 4.5 h. Chromatin preparation and ChIP of FLAG-tagged Rec12 covalently linked to DNA was carried out as described for DSB analysis45. Briefly, the cells were lysed in 400 μl ChIP lysis buffer without crosslinking. The chromatin and cell debris were pelleted by centrifugation at 16,000g for 1 min at 4 °C and then washed twice with ChIP lysis buffer. After chromatin sonication, the Rec12–DNA linkages were immunoprecipitated with anti-FLAG M2 affinity gel (Sigma-Aldrich). Genome-wide analysis of meiotic DSBs was performed by Rec12 ChIP-chip as described in the previous section.
Rec12 ChIP localization across the S. pombe genome was determined from the coverage data output in Affymetrix sequence graph file (sgr) format. The positions of the peak maxima were determined by inflection-point sign change and peaks detected in either the Pir1-SD mutant or WT strain were combined for further analysis. Peak maxima exceeding a threshold of two were extended by 8 kb from the maximum in both directions. The resulting peak-density traces were smoothed, after which they were sorted by mean signal within the middle 20% for plotting in heatmap format.
Recombination assays.
The recombination assay was performed as described46, with some modifications. Briefly, two parental strains containing ade6-M26 and ade6-M210, respectively, were crossed on SPA plates at 25 °C. After 2–3 days, the cells were collected and treated overnight with β-glucuronidase (Sigma-Aldrich) at 25 °C. Spores were plated on ten YE plates (approximately 1,000 per plate) and then incubated for 4–5 days at 30 °C. The frequency of intragenic recombination was calculated as the number of white colonies (Ade+ on YE) per 1 × 10⁴ viable spores, pooling the numbers from the ten plates.
Multiple sequence alignments.
Multiple sequence alignments were constructed using MACAW, the Multiple Alignment Construction and Analysis Workbench.
Statistics and reproducibility.
The quantification and statistical tests that were used are described in the figure legends or in the Methods section. No data were excluded from our studies. The P values for group overlap of differentially expressed genes from RNA-seq data were calculated from cumulative hypergeometric distribution functions. GraphPad Prism 8 (GraphPad Software Inc.) was used to plot all of the graphs and calculate statistical significance using a two-tailed Student’s t-test. All experiments were independently repeated at least two times with similar results obtained.
Reporting Summary.
Further information on research design is available in the Nature Research Reporting Summary linked to this article.
Extended Data
Extended Data Fig. 1 |. Tor2 promotes MTReC-dependent facultative heterochromatin assembly and gametogenic gene silencing.

a and b, ChIP-chip analyses of H3K9me2 at MTREC-dependent (a) and MTREC-independent (b) heterochromatin islands. c, ChIP-chip analysis of H3K9me2 distribution at cen1. d, RNA-seq analyses of pir1, red1, and mtl1 expression in the indicated strains at 30 °C. e, RNA-seq expression profiles of gametogenic gene transcripts at 30 °C. f, Composite plot showing the median expression level of a common set of 327 upregulated genes in WT and red1Δ cells grown in rich media at 30 °C. For ChIP-chip and RNA-seq, data representative of two independent experiments are presented.
Extended Data Fig. 2 |. Phosphorylation by Tor2/TORC1 stabilizes Pir1.

a, Immunopurified fractions from cells expressing untagged or GFP-tagged Pir1 (left) and FLAG-tagged Tor2 (right) were subjected to mass spectrometry. The total PSM and coverage for the identified proteins is shown. b, Multiple sequence alignment of S. pombe proteins Pir1 and Red1 against human ZFC3H1 was performed using Macaw sequence alignment workbench. Pir1 aligns with ZFC3H1 in their shared serine/proline rich region. Thick rectangles indicate segments of best alignment and dotted lines indicate gaps. Alignments for two conserved regions are shown in detail. The serines that are phosphorylated in Pir1 are labelled with orange triangles. S285 is in a conserved motif which is underlined in red. Mass spectrometry results are from a single experiment. c, Phosphorylation of Xpress-tagged recombinant WT Pir1 and mutant Pir1 with 12 serines (S215, S233, S237, S248, S265, S285, S299, S303, S325, S334, S434, S503) substituted with alanine by the FLAG–Tor2 complex was detected using anti-thiophosphate-ester antibody. d, Western blot analysis of GFP–Pir1 in the indicated strains at 30 °C. 12 SD, 12 serines replaced by aspartic acid. e, Western blot analysis of Red1 in the indicated strains at 30 °C. SD, serine285 replaced by aspartic acid. For c-e, two independent experiments were performed with similar results. Source data are provided.
Extended Data Fig. 3 |. Pir1 degradation by ubi4 and Cul4–Ddb1 impacts gene silencing.

a, Western blot analysis of GFP–Pir1 in tor2+ cells carrying pir1-WT, pir1-SD or pir1-SA allele. Cells were cultured in rich medium at 30 °C; SD, serine285 replaced by aspartic acid; SA, serine285 replaced by alanine. b, Western blot analysis of Pir1 in strains grown at 30 °C with or without nitrogen (+N/−N). c, IF of Pir1 in the indicated strains at 30 °C. d, Serial dilutions of the indicated strains were spotted onto rich medium (YEA) and low adenine (YE) plates, and then incubated at 30 °C for 3 days. The spd1Δ was introduced to suppress the growth defect of cul4Δ and ddb1Δ mutants. e, RNA-seq expression profiles of sme2 and mei2 transcripts in the indicated strains at 30 °C. f, Serial dilutions of the indicated strains were spotted and incubated as described in d. g, RNA-seq analysis of MTREC regulon gene expression in the indicated homothallic strains at 30 °C. For a-g, data representative of two independent experiments are shown. Source data are provided.
Extended Data Fig. 4 |. Defects in the assembly of MTReC-dependent heterochromatin islands observed in tor2-ts6 can be suppressed by ubi4Δ or ddb1Δ.

a, ChIP-chip analysis of H3K9me2 distribution at MTREC-dependent islands in the indicated strains. b, ChIP-chip analysis of H3K9me2 at MTREC-dependent heterochromatin islands in WT, tor2-ts6, tor2-ts6 ubi4Δ, and tor2-ts6 ddb1Δ cells at 30 °C. Heterochromatin island numbers correspond to those described previously15. The number of plus signs (+) indicates the relative level of detected H3K9me2. The minus sign (−) denotes a lack of detectable H3K9me2. Genomic coordinates correspond to the S. pombe genome assembly v2.29. Data representative of two independent ChIP-chip experiments are shown.
Extended Data Fig. 5 |. Pir1 prevents untimely gene expression in suboptimal conditions.
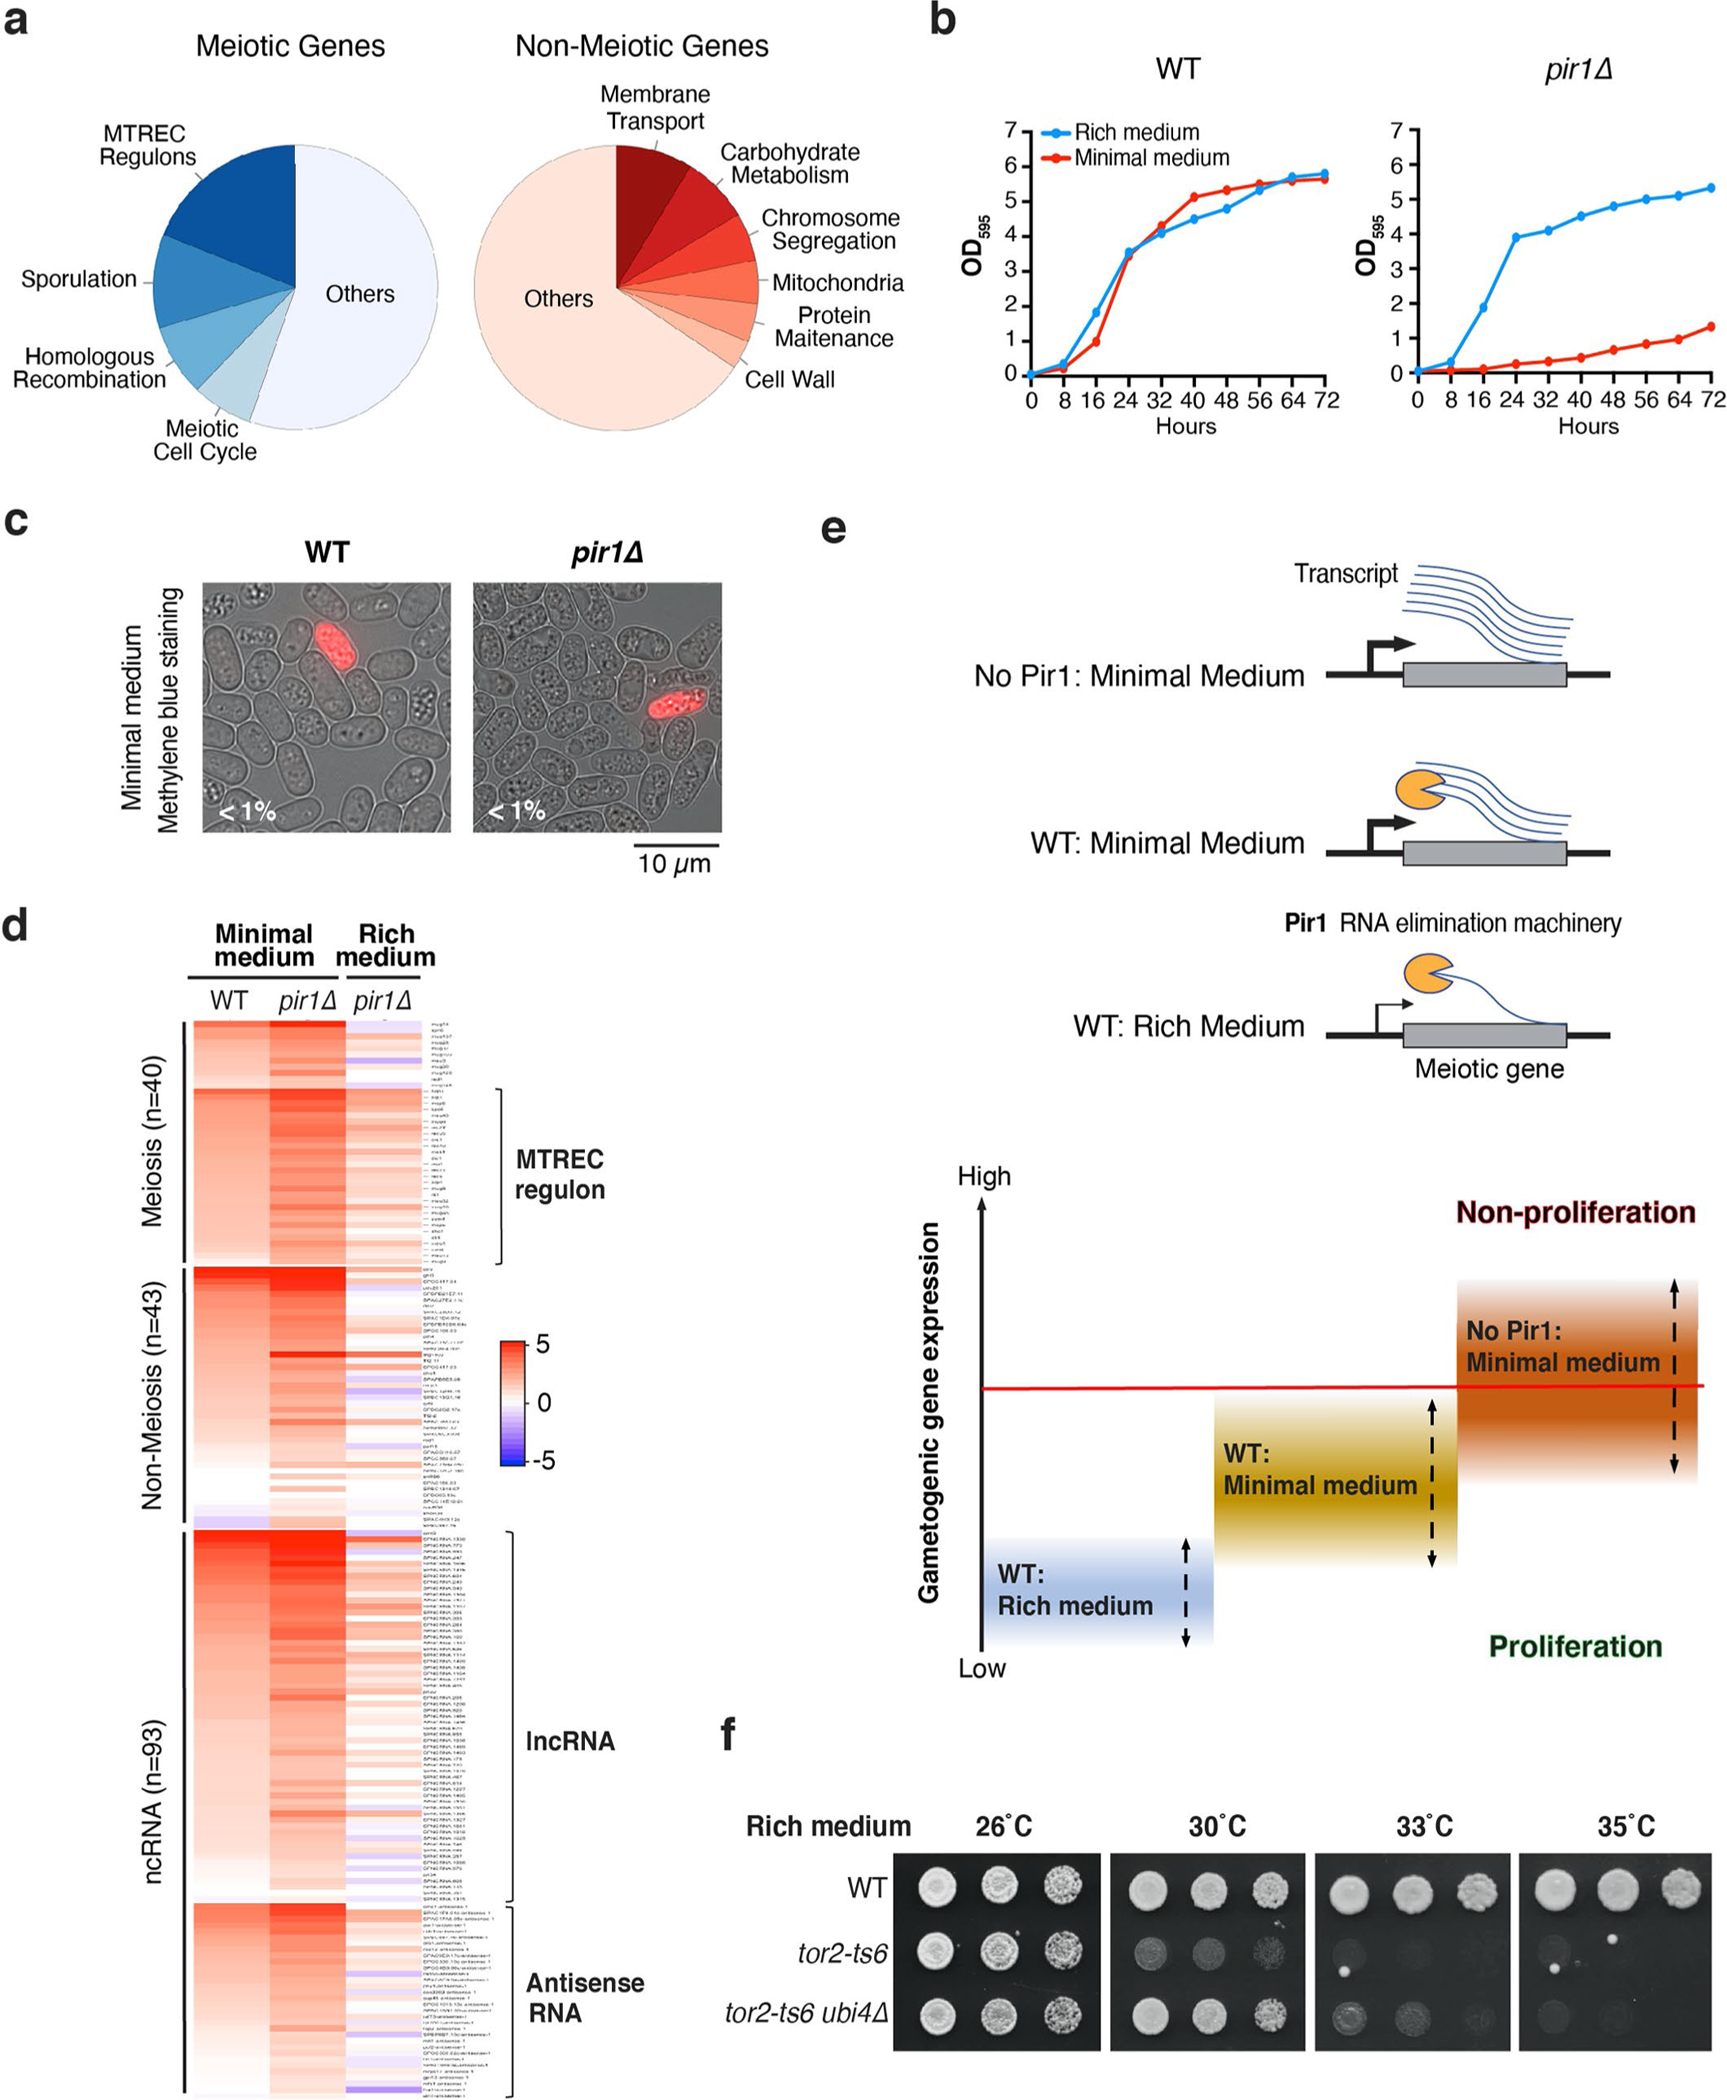
a, Genes within the ‘meiotic coding’ and ‘non-meiotic coding’ groups in Fig. 4c were categorized separately based on GO biological process. b, Growth curves of WT and pir1Δ cells cultured in rich or minimal medium at 26 °C. Optical density (OD) at 595 nm wavelength is plotted. Data representative of two independent experiments are shown. c, Percent cell death was determined by methylene blue staining of cells grown on minimal medium at 26 °C. Two independent experiments were performed with similar results. d, Heatmap of log2 fold changes in expression in WT and pir1Δ cells grown in minimal or rich medium relative to WT cells grown in rich medium at 30 °C. Transcripts were clustered based on their function. ‘n’ indicates number of loci in each category. Data representative of two independent experiments are presented. e, Schematic depicting how fluctuations in gametogenic gene expression, which occur upon changes in growth conditions, are controlled by MTREC–Pir1. f, Serial dilutions of the indicated strains were spotted onto rich medium and incubated at the indicated temperature for 3–4 days. Two independent experiments were performed with similar results. Source data are provided.
Extended Data Fig. 6 |. Synchronized meiosis system.

a, Flowchart of pat1-as2 induced synchronized meiosis. b, Progression of meiosis was monitored by fluorescence microscopy to determine the number of nuclei per cell in samples collected at the indicated time points after the addition of 1-NM-PP1. Two independent experiments were performed with similar results. c, RT–qPCR analysis of meiotic gene expression. Samples were collected at the indicated time points. Two independent experiments were performed with similar results. d, Heatmap of log2 fold changes in expression relative to vegetative cells for synchronized meiotic cells, as determined by RNA-seq analyses. Clusters are grouped by expression pattern and only transcripts with peak log2 fold changes that were ≥1.5 were assigned to a group. Data representative of two independent experiments are shown. Source data are provided.
Extended Data Fig. 7 |. Temporal control of gene expression by Pir1 and MTReC during meiotic progression.

a, The MTREC regulon genes grouped according to their function in meiosis. The expression peak was determined from RNA-seq analysis of the synchronized meiosis system. See also Supplementary Table 7. b, RNA-seq analysis of MTREC regulon gene expression in the indicated strains. Data representative of two independent experiments are shown. c, ChIP-chip analysis of meiotic DSBs (Rec12–DNA linkages) across chromosome 1 and 3 in cells expressing WT Pir1 or Pir1-SD protein. Data representative of two independent ChIP-chip experiments are shown.
Extended Data Fig. 8 |. Tor2 targets RNA elimination machinery to sustain cell proliferation and gametogenesis.

a, Line plots showing the mean log2 fold change in expression of MTREC regulon transcripts in WT, pir1Δ, and red1Δ mutants. b, Heatmap of log2 fold changes in expression of additional MTREC regulon genes relative to WT vegetative cells in WT, pir1Δ, and red1Δ. Data representative of two independent experiments are shown. Source data are provided.
Supplementary Material
Acknowledgements
We thank M. Yamamoto, J. Gregan, L. -L. Du, T. Toda, G. Smith, A. Lorenz and the National BioResource Project (NBRP) Japan for strains and plasmids. We also thank V. Chalamcharla for constructing a strain containing the ade6-DSR allele; H. D. Folco and T. Vo for providing strains and for valuable technical help; S. Holla, G. Thillainadesan, A. Dipiazza and H. Xiao for their helpful suggestions; J. Barrowman for editing the manuscript and the members of the Laboratory of Biochemistry and Molecular Biology, in particular the Grewal laboratory, for discussions. This study used the Helix Systems and Biowulf Linux cluster at the National Institutes of Health. This work was supported by the Intramural Research Program of the National Institutes of Health, National Cancer Institute.
Footnotes
Competing interests
The authors declare no competing interests.
Code availability
All codes used in this study are publicly available.
Additional information
Extended data is available for this paper at https://doi.org/10.1038/s41556-021-00631-y.
Supplementary information The online version contains supplementary material available at https://doi.org/10.1038/s41556-021-00631-y.
Data availability
ChIP-chip and RNA-seq datasets are available for the data presented in Figs. 1a,e,i–k, 2f,g, 3a,h–l, 4b,c,e–h, 6b–e, 8a and Extended Data Figs. 1a–e, 3e,g, 4a,b, 5a,d, 6d, 7b,c, 8a,b. These data have been deposited in the Gene Expression Omnibus under the accession number GSE142488. For mass spectrometry, the UniProt S. pombe database (https://www.uniprot.org/proteomes/UP000002485) was used for the protein search. Source data are provided with this paper. All other data supporting the findings of this study are available from the corresponding author on reasonable request.
References
- 1.Perrimon N, Pitsouli C & Shilo BZ Signaling mechanisms controlling cell fate and embryonic patterning. Cold Spring Harb. Perspect. Biol 4, a005975 (2012). [DOI] [PMC free article] [PubMed] [Google Scholar]
- 2.Cardenas ME, Cutler NS, Lorenz MC, Di Como CJ & Heitman J The TOR signaling cascade regulates gene expression in response to nutrients. Genes Dev. 13, 3271–3279 (1999). [DOI] [PMC free article] [PubMed] [Google Scholar]
- 3.Lopez-Maury L, Marguerat S & Bahler J Tuning gene expression to changing environments: from rapid responses to evolutionary adaptation. Nat. Rev. Genet 9, 583–593 (2008). [DOI] [PubMed] [Google Scholar]
- 4.Saxton RA & Sabatini DM mTOR signaling in growth, metabolism, and disease. Cell 169, 361–371 (2017). [DOI] [PubMed] [Google Scholar]
- 5.Wullschleger S, Loewith R & Hall MN TOR signaling in growth and metabolism. Cell 124, 471–484 (2006). [DOI] [PubMed] [Google Scholar]
- 6.Nicetto D & Zaret KS Role of H3K9me3 heterochromatin in cell identity establishment and maintenance. Curr. Opin. Genet. Dev 55, 1–10 (2019). [DOI] [PMC free article] [PubMed] [Google Scholar]
- 7.Jenuwein T & Allis CD Translating the histone code. Science 293, 1074–1080 (2001). [DOI] [PubMed] [Google Scholar]
- 8.Kilchert C, Wittmann S & Vasiljeva L The regulation and functions of the nuclear RNA exosome complex. Nat. Rev. Mol. Cell Biol 17, 227–239 (2016). [DOI] [PubMed] [Google Scholar]
- 9.Schmid M & Jensen TH Controlling nuclear RNA levels. Nat. Rev. Genet 19, 518–529 (2018). [DOI] [PubMed] [Google Scholar]
- 10.Otsubo Y & Yamamoto M Signaling pathways for fission yeast sexual differentiation at a glance. J. Cell Sci 125, 2789–2793 (2012). [DOI] [PubMed] [Google Scholar]
- 11.Reyes-Turcu FE & Grewal SI Different means, same end-heterochromatin formation by RNAi and RNAi-independent RNA processing factors in fission yeast. Curr. Opin. Genet. Dev 22, 156–163 (2012). [DOI] [PMC free article] [PubMed] [Google Scholar]
- 12.Yamamoto M The selective elimination of messenger RNA underlies the mitosis–meiosis switch in fission yeast. Proc. Jpn. Acad. B 86, 788–797 (2010). [DOI] [PMC free article] [PubMed] [Google Scholar]
- 13.Mata J, Lyne R, Burns G & Bahler J The transcriptional program of meiosis and sporulation in fission yeast. Nat. Genet 32, 143–147 (2002). [DOI] [PubMed] [Google Scholar]
- 14.Harigaya Y et al. Selective elimination of messenger RNA prevents an incidence of untimely meiosis. Nature 442, 45–50 (2006). [DOI] [PubMed] [Google Scholar]
- 15.Zofall M et al. RNA elimination machinery targeting meiotic mRNAs promotes facultative heterochromatin formation. Science 335, 96–100 (2012). [DOI] [PMC free article] [PubMed] [Google Scholar]
- 16.Tashiro S, Asano T, Kanoh J & Ishikawa F Transcription-induced chromatin association of RNA surveillance factors mediates facultative heterochromatin formation in fission yeast. Genes Cells 18, 327–339 (2013). [DOI] [PubMed] [Google Scholar]
- 17.Gallagher PS et al. Iron homeostasis regulates facultative heterochromatin assembly in adaptive genome control. Nat. Struct. Mol. Biol 25, 372–383 (2018). [DOI] [PMC free article] [PubMed] [Google Scholar]
- 18.Sugiyama T & Sugioka-Sugiyama R Red1 promotes the elimination of meiosis-specific mRNAs in vegetatively growing fission yeast. EMBO J. 30, 1027–1039 (2011). [DOI] [PMC free article] [PubMed] [Google Scholar]
- 19.Lee NN et al. Mtr4-like protein coordinates nuclear RNA processing for heterochromatin assembly and for telomere maintenance. Cell 155, 1061–1074 (2013). [DOI] [PMC free article] [PubMed] [Google Scholar]
- 20.Egan ED, Braun CR, Gygi SP & Moazed D Post-transcriptional regulation of meiotic genes by a nuclear RNA silencing complex. RNA 20, 867–881 (2014). [DOI] [PMC free article] [PubMed] [Google Scholar]
- 21.Zhou Y et al. The fission yeast MTREC complex targets CUTs and unspliced pre-mRNAs to the nuclear exosome. Nat. Commun 6, 7050 (2015). [DOI] [PMC free article] [PubMed] [Google Scholar]
- 22.Sugiyama T et al. Enhancer of rudimentary cooperates with conserved RNA-processing factors to promote meiotic mRNA decay and facultative heterochromatin assembly. Mol. Cell 61, 747–759 (2016). [DOI] [PMC free article] [PubMed] [Google Scholar]
- 23.Li J et al. Systematic analysis reveals the prevalence and principles of bypassable gene essentiality. Nat. Commun 10, 1002 (2019). [DOI] [PMC free article] [PubMed] [Google Scholar]
- 24.Yamashita A, Takayama T, Iwata R & Yamamoto M A novel factor Iss10 regulates Mmi1-mediated selective elimination of meiotic transcripts. Nucleic Acids Res. 41, 9680–9687 (2013). [DOI] [PMC free article] [PubMed] [Google Scholar]
- 25.Cam HP et al. Comprehensive analysis of heterochromatin- and RNAi-mediated epigenetic control of the fission yeast genome. Nat. Genet 37, 809–819 (2005). [DOI] [PubMed] [Google Scholar]
- 26.Mattout A et al. LSM2–8 and XRN-2 contribute to the silencing of H3K27me3-marked genes through targeted RNA decay. Nat. Cell Biol 22, 579–590 (2020). [DOI] [PMC free article] [PubMed] [Google Scholar]
- 27.Whittaker C & Dean C The FLC locus: a platform for discoveries in epigenetics and adaptation. Annu. Rev. Cell Dev. Biol 33, 555–575 (2017). [DOI] [PubMed] [Google Scholar]
- 28.Heitman J, Movva NR & Hall MN Targets for cell cycle arrest by the immunosuppressant rapamycin in yeast. Science 253, 905–909 (1991). [DOI] [PubMed] [Google Scholar]
- 29.Alvarez B & Moreno S Fission yeast Tor2 promotes cell growth and represses cell differentiation. J. Cell Sci 119, 4475–4485 (2006). [DOI] [PubMed] [Google Scholar]
- 30.Matsuo T, Otsubo Y, Urano J, Tamanoi F & Yamamoto M Loss of the TOR kinase Tor2 mimics nitrogen starvation and activates the sexual development pathway in fission yeast. Mol. Cell. Biol 27, 3154–3164 (2007). [DOI] [PMC free article] [PubMed] [Google Scholar]
- 31.Uritani M et al. Fission yeast Tor2 links nitrogen signals to cell proliferation and acts downstream of the Rheb GTPase. Genes Cells 11, 1367–1379 (2006). [DOI] [PubMed] [Google Scholar]
- 32.Weisman R, Roitburg I, Schonbrun M, Harari R & Kupiec M Opposite effects of Tor1 and Tor2 on nitrogen starvation responses in fission yeast. Genetics 175, 1153–1162 (2007). [DOI] [PMC free article] [PubMed] [Google Scholar]
- 33.Cohen A et al. TOR complex 2 in fission yeast is required for chromatin-mediated gene silencing and assembly of heterochromatic domains at subtelomeres. J. Biol. Chem 293, 8138–8150 (2018). [DOI] [PMC free article] [PubMed] [Google Scholar]
- 34.Okazaki K, Okayama H & Niwa O The polyubiquitin gene is essential for meiosis in fission yeast. Exp. Cell. Res 254, 143–152 (2000). [DOI] [PubMed] [Google Scholar]
- 35.Horn PJ, Bastie JN & Peterson CL A Rik1-associated, cullin-dependent E3 ubiquitin ligase is essential for heterochromatin formation. Genes Dev. 19, 1705–1714 (2005). [DOI] [PMC free article] [PubMed] [Google Scholar]
- 36.Jia S, Kobayashi R & Grewal SI Ubiquitin ligase component Cul4 associates with Clr4 histone methyltransferase to assemble heterochromatin. Nat. Cell Biol 7, 1007–1013 (2005). [DOI] [PubMed] [Google Scholar]
- 37.Braun S et al. The Cul4–Ddb1Cdt2 ubiquitin ligase inhibits invasion of a boundary-associated antisilencing factor into heterochromatin. Cell 144, 41–54 (2011). [DOI] [PMC free article] [PubMed] [Google Scholar]
- 38.Lee J & Zhou P DCAFs, the missing link of the CUL4–DDB1 ubiquitin ligase. Mol. Cell 26, 775–780 (2007). [DOI] [PubMed] [Google Scholar]
- 39.Liu C et al. Transactivation of Schizosaccharomyces pombe cdt2+ stimulates a Pcu4–Ddb1–CSN ubiquitin ligase. EMBO J. 24, 3940–3951 (2005). [DOI] [PMC free article] [PubMed] [Google Scholar]
- 40.Otsubo Y, Yamashita A, Ohno H & Yamamoto MS pombe TORC1 activates the ubiquitin-proteasomal degradation of the meiotic regulator Mei2 in cooperation with Pat1 kinase. J. Cell Sci 127, 2639–2646 (2014). [DOI] [PubMed] [Google Scholar]
- 41.Cipak L, Polakova S, Hyppa RW, Smith GR & Gregan J Synchronized fission yeast meiosis using an ATP analog-sensitive Pat1 protein kinase. Nat. Protoc 9, 223–231 (2014). [DOI] [PMC free article] [PubMed] [Google Scholar]
- 42.Ding DQ et al. Meiosis-specific noncoding RNA mediates robust pairing of homologous chromosomes in meiosis. Science 336, 732–736 (2012). [DOI] [PubMed] [Google Scholar]
- 43.Fowler KR, Gutierrez-Velasco S, Martin-Castellanos C & Smith GR Protein determinants of meiotic DNA break hot spots. Mol. Cell 49, 983–996 (2013). [DOI] [PMC free article] [PubMed] [Google Scholar]
- 44.Wahls WP, Siegel ER & Davidson MK Meiotic recombination hotspots of fission yeast are directed to loci that express non-coding RNA. PLoS ONE 3, e2887 (2008). [DOI] [PMC free article] [PubMed] [Google Scholar]
- 45.Cromie GA et al. A discrete class of intergenic DNA dictates meiotic DNA break hotspots in fission yeast. PLoS Genet. 3, e141 (2007). [DOI] [PMC free article] [PubMed] [Google Scholar]
- 46.Ponticelli AS, Sena EP & Smith GR Genetic and physical analysis of the M26 recombination hotspot of Schizosaccharomyces pombe. Genetics 119, 491–497 (1988). [DOI] [PMC free article] [PubMed] [Google Scholar]
- 47.Marston AL & Amon A Meiosis: cell-cycle controls shuffle and deal. Nat. Rev. Mol. Cell Biol 5, 983–997 (2004). [DOI] [PubMed] [Google Scholar]
- 48.Chikashige Y et al. Telomere-led premeiotic chromosome movement in fission yeast. Science 264, 270–273 (1994). [DOI] [PubMed] [Google Scholar]
- 49.Ding DQ, Yamamoto A, Haraguchi T & Hiraoka Y Dynamics of homologous chromosome pairing during meiotic prophase in fission yeast. Dev. Cell 6, 329–341 (2004). [DOI] [PubMed] [Google Scholar]
- 50.Li D, Roca M, Yuecel R & Lorenz A Immediate visualization of recombination events and chromosome segregation defects in fission yeast meiosis. Chromosoma 128, 385–396 (2019). [DOI] [PMC free article] [PubMed] [Google Scholar]
- 51.Folco HD et al. Untimely expression of gametogenic genes in vegetative cells causes uniparental disomy. Nature 543, 126–130 (2017). [DOI] [PMC free article] [PubMed] [Google Scholar]
- 52.Ozkaynak E, Finley D, Solomon MJ & Varshavsky A The yeast ubiquitin genes: a family of natural gene fusions. EMBO J. 6, 1429–1439 (1987). [DOI] [PMC free article] [PubMed] [Google Scholar]
- 53.McFarlane RJ & Wakeman JA Meiosis-like functions in oncogenesis: a new view of cancer. Cancer Res 77, 5712–5716 (2017). [DOI] [PubMed] [Google Scholar]
- 54.Pal SK & Quinn DI Differentiating mTOR inhibitors in renal cell carcinoma. Cancer Treat. Rev 39, 709–719 (2013). [DOI] [PMC free article] [PubMed] [Google Scholar]
- 55.Chen S et al. ZFC3H1 provides a reference to evaluate the prognosis and treat prostate adenocarcinoma: a study based on TCGA data. Preprint at 10.21203/rs.3.rs-23147/v1 (2020). [DOI]
- 56.Kohda TA et al. Fission yeast autophagy induced by nitrogen starvation generates a nitrogen source that drives adaptation processes. Genes Cells 12, 155–170 (2007). [DOI] [PubMed] [Google Scholar]
- 57.Matsuhara H & Yamamoto A Autophagy is required for efficient meiosis progression and proper meiotic chromosome segregation in fission yeast. Genes Cells 21, 65–87 (2016). [DOI] [PubMed] [Google Scholar]
- 58.Herbert M, Kalleas D, Cooney D, Lamb M & Lister L Meiosis and maternal aging: insights from aneuploid oocytes and trisomy births. Cold Spring Harb. Perspect. Biol 7, a017970 (2015). [DOI] [PMC free article] [PubMed] [Google Scholar]
- 59.Jesus TT, Oliveira PF, Sousa M, Cheng CY & Alves MG Mammalian target of rapamycin (mTOR): a central regulator of male fertility? Crit. Rev. Biochem. Mol. Biol 52, 235–253 (2017). [DOI] [PMC free article] [PubMed] [Google Scholar]
- 60.Jain D et al. ketu Mutant mice uncover an essential meiotic function for the ancient RNA helicase YTHDC2. elife 7, e30919 (2018). [DOI] [PMC free article] [PubMed] [Google Scholar]
- 61.Soh YQS et al. Meioc maintains an extended meiotic prophase I in mice. PLoS Genet. 13, e1006704 (2017). [DOI] [PMC free article] [PubMed] [Google Scholar]
- 62.Wojtas MN et al. Regulation of m6A transcripts by the 3′→5′ RNA helicase YTHDC2 is essential for a successful meiotic program in the mammalian germline. Mol. Cell 68, 374–387 (2017). [DOI] [PubMed] [Google Scholar]
- 63.Saitou M & Miyauchi H Gametogenesis from pluripotent stem cells. Cell Stem Cell 18, 721–735 (2016). [DOI] [PubMed] [Google Scholar]
- 64.Bolger AM, Lohse M & Usadel B Trimmomatic: a flexible trimmer for Illumina sequence data. Bioinformatics 30, 2114–2120 (2014). [DOI] [PMC free article] [PubMed] [Google Scholar]
- 65.Wood V et al. The genome sequence of Schizosaccharomyces pombe. Nature 415, 871–880 (2002). [DOI] [PubMed] [Google Scholar]
- 66.Dobin A et al. STAR: ultrafast universal RNA-seq aligner. Bioinformatics 29, 15–21 (2013). [DOI] [PMC free article] [PubMed] [Google Scholar]
- 67.Wang L, Feng Z, Wang X, Wang X & Zhang X DEGseq: an R package for identifying differentially expressed genes from RNA-seq data. Bioinformatics 26, 136–138 (2010). [DOI] [PubMed] [Google Scholar]
- 68.Gu Z, Eils R & Schlesner M Complex heatmaps reveal patterns and correlations in multidimensional genomic data. Bioinformatics 32, 2847–2849 (2016). [DOI] [PubMed] [Google Scholar]
- 69.Boyle EI et al. GO::TermFinder–open source software for accessing Gene Ontology information and finding significantly enriched Gene Ontology terms associated with a list of genes. Bioinformatics 20, 3710–3715 (2004). [DOI] [PMC free article] [PubMed] [Google Scholar]
- 70.Holla S et al. Positioning heterochromatin at the nuclear periphery suppresses histone turnover to promote epigenetic inheritance. Cell 180, 150–164 (2020). [DOI] [PMC free article] [PubMed] [Google Scholar]
Associated Data
This section collects any data citations, data availability statements, or supplementary materials included in this article.
Supplementary Materials
Data Availability Statement
ChIP-chip and RNA-seq datasets are available for the data presented in Figs. 1a,e,i–k, 2f,g, 3a,h–l, 4b,c,e–h, 6b–e, 8a and Extended Data Figs. 1a–e, 3e,g, 4a,b, 5a,d, 6d, 7b,c, 8a,b. These data have been deposited in the Gene Expression Omnibus under the accession number GSE142488. For mass spectrometry, the UniProt S. pombe database (https://www.uniprot.org/proteomes/UP000002485) was used for the protein search. Source data are provided with this paper. All other data supporting the findings of this study are available from the corresponding author on reasonable request.