

Abstract
Among human cytosolic sulfotransferases, SULT2B1b is highly specific for oxysterols — oxidized cholesterol derivatives, including nuclear-receptor ligands that are causally linked to cancer, atherosclerosis, and skin and neurodegenerative diseases. Sulfonation of signaling oxysterols redirects their receptor-binding functions, and controlling these functions is expected to prove valuable in disease prevention and treatment. SULT2B1b is distinct among the human SULT2 isoforms by virtue of its atypically long N-terminus, which extends 18-residues beyond the next longest N-terminus in the family. Here, in-silico studies are used to predict that the N-terminal extension forms an allosteric pocket and to identify potential allosteres. One such allostere, quercetin, is used to confirm the existence of the pocket and to demonstrate that allostere binding inhibits turnover. The structure of the pocket is obtained by positioning quercetin on the enzyme, using spin-label-triangulation NMR, followed by NMR-distance constrained molecular dynamics docking. The model is confirmed using a combination of site-directed mutagenesis and initial-rate studies. Stopped-flow ligand-binding studies demonstrate that inhibition is achieved by stabilizing the closed form of the enzyme active-site cap, which encapsulates the nucleotide, slowing its release. Finally, endogenous oxysterol metabolites are shown bind the site in a highly selective fashion — one of two immediate biosynthetic precursors of cholesterol (7-dehydrocholesterol) is an inhibitor, the other (24-dehydrocholesterol) is not. These findings provide insight into the allosteric dialogue in which SULT2B1b participates in in vivo, and establishes a template against which to develop isoform-specific inhibitors to control SULT2B1b biology.
Keywords: sulfotransferase, allosteric, inhibitor, mechanism, SULT2B1b, NMR, spin label, structure, molecular dynamics, GROMACS, quercetin, cholesterol metabolism, 7-dehydrocholesterol, 24-dehydrocholesterol
Introduction
Thirteen cytosolic sulfotransferase isoforms (SULTs) are encoded in the human genome. The substrate specificities of the isoforms are broad, somewhat overlapping, and collectively the SULT family forms a robust catalytic network that screens and sulfonates the scaffolds of hundreds, perhaps thousands of small-molecule metabolites including scores of signaling small molecules — steroids (1, 2), oxysterols (3, 4), and neurotransmitters (5, 6). Sulfonation typically recodes an acceptor’s biological function — signaling molecules no longer bind their receptors (7–9), cellular transport (10) and clearance (11) accelerate dramatically, toxins are neutralized (12)… . Given the pathways and processes in which sulfonation plays an important homeostatic role, it is not surprising that sulfonation imbalances are causally linked to numerous diseases, including cancer (13–16), skin (17) and heart (4, 18) disease.
SULT isoforms operate primarily in distinct metabolic domains. Recent work reveals that most, perhaps all, SULT1 isoforms harbor a unique allosteric binding site through which they communicate with metabolites within their domains. Experimental and in silico screening of these sites have provided insight into the metabolic dialogues in which SULTs participate (19–22) and structures of the sites establish isoform-specific targets against which allosteres can be developed to control particular areas of sulfuryl-transfer biology — this strategy has been used to enhance acetaminophen efficacy in humans (11).
SULT2B1b preferentially sulfonates 3β-hydroxysteroids and exhibits particularly high affinity for cholesterol, the precursor of virtually all steroids (23). Cholesterol-sulfate is increased 500-fold in human prostate-cancer tumors relative to healthy surrounding tissue. SULT2B1b expression in tumors correlates with patient mortality in prostate (13), stomach (14), colon (24), and breast cancers (25). Hydroxylated derivatives of cholesterol (oxysterols) are efficiently sulfonated by 2B1b and are potent signaling molecules. 24S-hydroxycholesterol (24S-HCho) is a brain-specific liver-X-receptor (LXRβ) agonist that is transformed into a yet higher affinity antagonist when sulfonated at the 3-hydroxyl (3). LXRβ regulation by these compounds largely determines cholesterol efflux from the brain (26). LXRβ plays a major role in Alzheimer’s disease (27, 28) and its activation increases amyloid-beta plaque clearance and improves memory in mice (29, 30).
SULT2B1b is distinct among human SULT2 isoforms in that its N-terminus is considerably longer than that of either SULT2A1 or SULT2B1a (23 and 18 residues, respectively) (31). While the 2B1b N-terminus is a cholesterol-binding determinant (31), its structure is not available. Here, we show the N-terminus is a structural component of an allosteric pocket. The pocket structure is obtained from NMR-distance measurements and molecular-dynamics docking, and allostere binding is shown to inhibit turnover by directly contacting and stabilizing the closed conformation of the enzyme active-site cap, which slows nucleotide release. Finally, the site is shown to bind only one of two immediate cholesterol precursors (each of which derives from separate cholesterol biosynthetic pathway) suggesting coordinated cholesterol synthesis and sulfonation.
Materials and Methods
Materials
7-dehydrocholesterol (7-DH), 24-dehydrocholesterol (24-DH), dithiothreitol (DTT), ethylene-diamine-tetraacetic acid (EDTA), L-glutathione (reduced), 1-hydroxypyrene (1-HP), imidazole, isopropyl-thio-β-D-galacto-pyranoside (IPTG), lysozyme, 3-maleimido-PROXYL, N-cyclohexylmaleimide, pepstatin A, potassium phosphate, 2,2,2-trichloroethanol (TCE), and quercetin were the highest grades available from Sigma. Ampicillin, dimethyl sulfoxide (DMSO), KOH, LB media, MgCl2, tris(hydroxymethyl)aminomethane (Tris) base, and phenylmethylsulfonyl fluoride (PMSF) were purchased from Fisher Scientific. Glutathione- and nickel-chelating resins and Superdex 200 Increase, 10/300 GL columns were obtained from GE Healthcare. D2O was purchased from Cambridge Isotope Laboratories. Competent E. coli (BL21(DE3)) was purchased from Novagen. SULT2B1a and SULT2B1b clones were obtained from IDT. The SULT2A1 clone and SULT2B1b pKK233 (32) vector were obtained from Dr. C. N. Falany. Synthesis and purification of PAPS and PAP is previously described (33, 34) and anion-exchange HPLC analysis suggested they are ~99% pure.
Computer and Software.
Molecular dynamics simulations were performed on a Parallel Quantum Solutions QS32-2670C-XS8 computer. PQS Molecular Builder was purchased from Parallel Quantum Solutions. The source code for GROningen MAchine for Chemical Simulation (GROMACS) 4.5 was downloaded from http://www.GROMACS.org under the GROMACS General Public License (GPL). Antechamber was acquired as part of AmberTools under the GNU General Public License (GPL). A Genetically Optimized Ligand Docking (GOLD) license was obtained from the Cambridge Crystallographic Data Center.
Methods
Molecular Dynamics Modeling.
MD simulations were performed as described previously (20–22, 35, 36). Briefly, SWISS-MODEL was used to construct a ligand-free model of SULT2B1b from the SULT2B1b•PAP•DHEA (PDB 1Q22 (37)) structure. GROMACS was used to protonate (pH 7.4) and energy minimized using the model. PAPS and cholesterol GROMAS57 energy-parameter files were created using Automated Topology Builder (ATB) (38, 39). PAPS and cholesterol were positioned in the active site using GOLD. The first 17 residues of the N-terminal tail were modeled using Dynamic Loop Modeling in MODELLER 9.18 (40, 41). The system was equilibrated (298 °K, NaCl (50 mM), pH 7.4) in 100 psec increments using GROMACS. Once equilibrated, the simulation was allowed to evolve for 10 nsec.
In-Silico Screening of the Human Metabolome Data Base (HMDB).
The SULT2B1b homology model described above was used to screen the 18,600 plasma-detected metabolites archived in HMDB 4.0 (downloaded June 2018, (42)) for potential allosteric inhibitors. Docking was performed using GOLD parameterized to use flexible sidechains and restrict metabolite diffusion to within a 20 Å sphere centered on the alpha carbon of Y16, which is near the center of the predicted binding site. Ligands were docked with the Lamarckian evolution-based algorithm using a cutoff of 2,500 simulated generations. Each compound was docked three times, and the lowest energy orientation was scored. The top 50 compounds were further examined in dynamic docking studies using GROMACS (43–45). GROMAS57A energy-parameter files were created for each of the 50 compounds using ATB, and the compounds were positioned in the binding site based on the GOLD screening results. The model was then protonated (pH 7.4) and the system was equilibrated using GROMACS in a GROMAS57A energy field (45). Six of the top ten hits were catechins, like quercetin, the top hit.
The SULT Constructs.
Expression Plasmids.
All SULT expression plasmids were constructed from E. coli codon-optimized human coding regions inserted into the PreScission Protease cleavage site of a pGEX-6p expression vector containing an N-terminal-(His/GST/MBP)-tag (7, 11, 34, 46). UniProt accession codes for all SULT isoforms are listed in Accession Codes. The phosphomimetic S347D mutation needed to stabilize SULT2B1b (47) is present in all SULT2B1b constructs. pGEX-6P (48) attaches a PreScission Protease cleavable GST to the N-terminus of the inserted coding region. To enhance purity and solubility of tagged constructs, pGEX-6p was modified to include an 8-His tag at the GST N-terminus, and a maltose-binding-protein (MBP) tag at the GST C-terminus (46). The PreScission Protease cleavage site of pGEX-6p was not altered by the His- and MBP-tag insertions. SULT coding regions were inserted into the triple-tag pGEX-6p vector by Gibson Assembly (49) using the primers listed in Table S1. PreScission Protease cleavage removes the triple tag from the protein and leaves two amino acids at the SULT N-terminus (i.e., N-GP). The sequence of each coding region is confirmed by DNA sequencing, and the sequences of all expression vectors used in this study are available upon request.
Constructs used in NMR Studies.
To avoid complications in the spin-labelling studies, DTNB-reactive cysteines in the SULT2B1b S347D scaffold were removed by conversion to Ser. DTNB-reactive cysteines were identified using a combination of mutagenesis and DTNB reactivity. Each of the four Cys in the SULT2B1b S347D scaffold was mutagenized to Ser and the resulting four single-mutation constructs were purified and tested for DTNB reactivity under the following conditions: SULT2B1b S347D (50 μM), 1.0 mM DTNB, PO4 (50 mM), pH 7.5, 25 (± 3) °C. Reactive cysteines were detected via the disulfide-bond dependent change in DTNB absorbance (Δε412 = 14.2 mM−1 cm−1 (50)). Three of the four cysteines (i.e., C81, C225, and C276) proved to be reactive and were converted to serine to create the non-reactive construct (i.e., SULT2B1b, S347D, C81S, C225S, C276S) into which spin-label attachment sites were inserted. The three spin-label attachment sites used in triangulating the allostere were installed in the non-reactive background by using PCR mutagenesis to convert residues G21, F171 and P247 to cysteine (one attachment site per construct).
Constructs used to Corroborate Structure.
PCR-based site-directed mutagenesis was used to create the following three constructs, which were used to confirm the structural model: (1) SULT2B1b, S347D, W13A; (2) SULT2B1b, S347D, W98A; (3) SULT2B1b, S347D, Y257A.
SULT Purification.
E. coli (BL21(DE3)) harboring SULT expressions plasmids were grown at 37 °C in LB medium containing ampicillin (50 μg/ml). At OD600 ~ 0.6, the culture was temperature shifted to 17 °C in an ice/water bath. After the culture reached 17 °C, expression was induced with IPTG (0.3 mM), and the incubation was continued at 17 °C for ~16 hr (i.e., overnight). Cells were pelleted and resuspended in lysis buffer (PMSF (290 μM), pepstatin A (1.5 μM), lysozyme (0.10 mg/ml), EDTA (2.0 mM), KCl (400 mM), K2PO4 (50 mM), pH 7.5). The suspension was sonicated and then centrifuged (10,000 g, 1.0 hr, 4 °C). MgCl2 (5.0 mM) was added to chelate EDTA before passing the solution through a Chelating Sepharose Fast Flow column charged with Ni2+. The column was washed (imidazole (10 mM), KCl (400 mM), and KPO4 (50 mM), pH 7.5) and the enzyme was eluted (imidazole (250 mM), KCl (400 mM), and KPO4 (50 mM), pH 7.5) directly onto a Glutathione Sepharose column. The GST column was washed (DTT (2.0 mM), KCl (400 mM), and KPO4 (50 mM), pH 7.5) and protein was eluted (reduced glutathione (10 mM), DTT (2.0 mM), KCl (400 mM), and Tris (100 mM), pH 8.0). The fusion protein was dialyzed (KCl (400 mM), KPO4 (50 mM), pH 7.5) and digested overnight at 4°C using PreScission Protease, which leaves an N-GP dipeptide at the N-terminus of the construct. The HIS/GST/MBP N-terminal tag and PreScission Protease were removed by passing the clipped-protein solution through a GST column equilibrate using dialysis buffer. The resulting SULTs were ≥ 95% pure, as judged by SDS-PAGE using 2,2,2-Trichloroethanol (TCE) treated gels, and its concentration was determined by UV absorbance (Ɛ280 SULT2B1b = 70.4 mM−1 cm−1). The purified protein was concentrated, flash frozen and stored at −80 °C.
Non-Tagged SULT2B1b Purification.
Non-tagged SULT2B1b was expressed in BL21(DE3) E. coli cells using the SULT2B1b pKK233-2 vector (32). Cell growth, induction, and cell extract preparation were performed as described in the previous paragraph. Extract was loaded into a DEAE Sepharose column equilibrated in Buffer A (50 mM KPO4, pH 7.4). The column was then washed (10 column volumes, Buffer A) and SULT2B1b was eluted using a six-column-volume, linear KCl gradient (0 – 250 mM) in Buffer A. Factions were assayed for SULT2B1b activity via the 1-HP sulfonation assay (λex = 325 nm, λem = 370 nm) (20, 21)). Fractions with activity were analyzed for purity via SDS-PAGE, and the highest purity fraction containing substantial activity was further purified by passage through tandem Superdex 200 Increase, 10/300 GL columns equilibrated and run with Buffer A. Protein elution was monitored at 280 nm and activity was identified using the 1-HP sulfonation assay (20, 21)). The purity of the final preparation was judged to be 80 – 85% based on visual inspection of Coomassie stained SDS-PAGE gels.
Initial-Rate Studies
Quercetin Inhibition.
Quercetin, 7-DH and 24-DH inhibition parameters were obtained from classical initial-rate studies (11, 20, 22, 51). Reactions were initiated by addition of PAPS (30 μM, 91 × Km) to a solution containing SULT (10 nM, dimer), 1-HP (100 μM, 26 or 91 × Km for 2B1b S34D and 2A1, respectively), inhibitor (0.20 – 20 × Ki), KCl (50 mM), and KPO4 (50 mM), pH 7.5, 25 ± 2°C. Reactions were initiated by addition of PAPS (30 μM, 91 × Km). Reaction progress was monitored via the fluorescence change associated with 1-HP sulfoantion (λex = 325 nm, λem = 370 nm (20, 21)). Less than 5% of 1-HP was converted to product during the measurements. Rates were determined in triplicate, averaged, and Ki and kcat inh (turnover at saturating inhibitor and substrate) were obtained by least-squares fitting the averaged data using the following partial-inhibition equation: V/Vmax = (Ki + α·[I])/(Ki + [I])), where α is the fraction turnover at saturating-vs-zero inhibitor (36, 52).
Structural-Validation Mutants (W13A, W98A, and Y257A).
Substrate Km and kcat values were determined by varying the concentration of one substrate from 0.2 to 5.0 × Km in equal increments in double-reciprocal space while holding the complementary substrate at a fixed, saturating concentration — PAPS (30 μM, 91 × Km) or 1-HP (100 μM, 27 × Km). Measurements were performed in triplicate, averaged and initial-rate constants were obtained by (1/v)4-weighted least-squares fitting of the averaged data in double-reciprocal format using the SEQUENO algorithm (51).
Spin-Labeling Protocol.
Single cys-insert SULT2B1b constructs were incubated for ~16 hrs in the following: 3-maleimido-PROXYL (spin label) or N-cyclohexylmaleimide (diamagnetic control) at 5 times the enzyme-subunit concentration, KCl (50 mM), KPO4 (50 mM), pH 7.4 at 4 ± 2 °C (20–22, 36). Reactions were considered complete once < 3% of the enzyme was DTNB reactive. The reaction mixture was then dialyzed vs KCl (50 mM), KPO4 (50 mM), pD 7.4, 4 ± 2 °C in D2O (> 98%) and the catalytic integrity of the labeled enzyme was tested by determining the 1-HP initial-rate parameters (Km 1-HP and kcat) using the protocol outline above (see, Methods, Structural-Validation Mutants).
Quercetin-Proton Paramagnetic Relaxation Measurements.
Quercetin 1H-NMR 1D-spectra (0–14 ppm) were collected using a Bruker 600 MHz spectrometer equipped with a TCI H/F-cryogenic probe at 298 °K. Spectra were acquired using a 0.96 s acquisition time, a 1.5 s delay between scans, and a presaturating water pulse. Each spectrum was the average of 512 scans. Solution conditions: spin- or diamagnetic-control labeled SULT2B1b (0, 5.0, 10, 20 or 50 μM), quercetin (100 μM, ≥ 13 × Km of free quercetin), PAP (300 μM, ≥ 710 × Km of free PAP), KCl (50 mM), KPO4 (50 mM), pD 7.4, D2O (> 98%), 25 ± 1 °C. Peak-widths were obtained using NMRdraw (53) configured to use a Lorentzian distribution. Experiments were performed in triplicate, the averaged linewidths were plotted as a function of the fraction of quercetin bound, and the resulting datasets were least-squares fit to a straight line. The linewidths of enzyme-bound quercetin were obtained by extrapolation. To obtain the paramagnetic contribution to the line broadening, broadening from the diamagnetically labelled enzyme was subtracted from that of the paramagnetic species. Proton/spin-label distances were calculated from the Solomon-Bloembergen equation (54) using the paramagnetic line broadening measurements.
NMR-Distance Constrained Molecular Dynamics Modeling.
MD simulations were performed as described previously (20–22, 36). Briefly, a ligand-free model of SULT2B1b S247D in which extraneous reactive cysteines were removed and spin-label-attachment cysteines were installed at the triangulation positions (i.e., SULT2B1b S21C, C81S, D171C, C225S, S247C, C276S, S347D) was modified to attach an in-silico spin-label analogue (i.e., the nitroxyl-moiety is replaced by a hydroxyl) at all three triangulation positions, 21, 171, and 247. GROMAS57 energy topology files (39) for PAPS, cholesterol, quercetin, and the spin-label analogue were generated using ATB (38, 39). PAPS and cholesterol were initially positioned in the model using GOLD based on the SULT2B1b•PAP•DHEA crystal structure (PDB 1Q22 (37)) and the system was then equilibrated in GROMACS. Once equilibrated, quercetin was randomly positioned in a simulated box of water (65 × 65 × 65 Å) containing the tagged model and docked with GROMACS using NMR distance measurements to constrain the ligand’s motion (20–22, 36). Constraints are embedded in the simulations by defining an ellipsoid whose center is the point of intersection of the three NMR-distance vectors that position the proton and whose principal axes lengths are given by the SEs (± 1 σ) of the measurements. If any part of a proton’s van der Waals surface lies outside its ellipsoid, a restoring force (50 kj mol−1 Å−1) drives the proton toward the ellipsoid center using distance_restraints in GROMACS (44, 45, 55); the restoring force inside the ellipsoid is zero. The simulation was repeated 10 times with the result that the α-carbon RMSD of any two structures in the set was < 3.0 Å.
Equilibrium Binding.
Ligand binding to SULT2B1b was monitored via binding-induced changes in SULT2B1b intrinsic fluorescence (λex= 290 nm, λem= 335 nm). Quercetin titration conditions: SULT2B1b (100 nM, active sites), quercetin (0.05 – 50 μM, 0.10 – 40 × Kd), PAP (0 or 30 μM, 91 × Kd), KCl (50 mM), KPO4 (50 mM), pH 7.5, 25 ± 2 °C. PAPS titration conditions: SULT2B1b (10 nM, active sites), PAPS (0.005 – 0.60 μM, 0.15 – 20 × Kd), quercetin (0 or 150 μM, 28 × Kd), KCl (50 mM), KPO4 (50 mM), pH 7.5, 25 ± 2 °C. Titrations were performed in triplicate and the averaged data were least-squares fit using a model that assumes a single binding site per monomer.
Stopped-Flow Ligand-Binding Studies.
Binding of PAPS to SULT2B1b was monitored via ligand-induced changes in SULT2B1b S347D intrinsic fluorescence using an Applied Photophysics SX20 stopped-flow spectrofluorometer. Fluorescence was excited at 290 nm and detected at ≥ 330 nm using a cutoff filter. SULT2B1b S347D (5.0 nM, dimer), quercetin (0 or 150 μM, 28 × Kd), KCl (50 mM), KPO4 (50 mM), pH 7.5, 25 ± 2 °C was rapidly mixed (1:1, v:v) with a solution that was identical except that it was without enzyme and contained PAPS. All reactions were pseudo first order with respect to [PAPS]. kobs values were obtained by least-squares fitting the average of five progress curves to a single-exponential equation. kon and koff were obtained by linear least-squares fitting of the kobs-vs-[PAPS] plots (11, 22, 33).
Results and Discussion
The N-terminus.
The Allostere-Binding Site Hypothesis.
As an aid in developing hypotheses regarding the biomolecular functions of the 2B1b N-terminus, an all-atom molecular dynamics model of the 2B1b•PAPS•Cho complex was constructed using GROMACS (see, Methods). The model, seen in Fig 1, shows the N-terminus (light blue) wrapping around much of the subunit perimeter, and lying between and atop the enzyme active-site cap and a small predominantly helical element - the Base. All three elements contact one another and their interactions help stabilize the extended conformation of the N-terminus. The modelling prediction that Ile 20 (seen in teal) directly contacts the hydrophobic tail of Cho is consistent with prior studies that suggested this contact (37) and demonstrated that Ile 20 is largely responsible for the high Cho selectivity of 2B1b among SULT2 isoforms (31).
Figure 1. A Molecular Dynamics Model of SULT2B1b•PAPS•Cho.
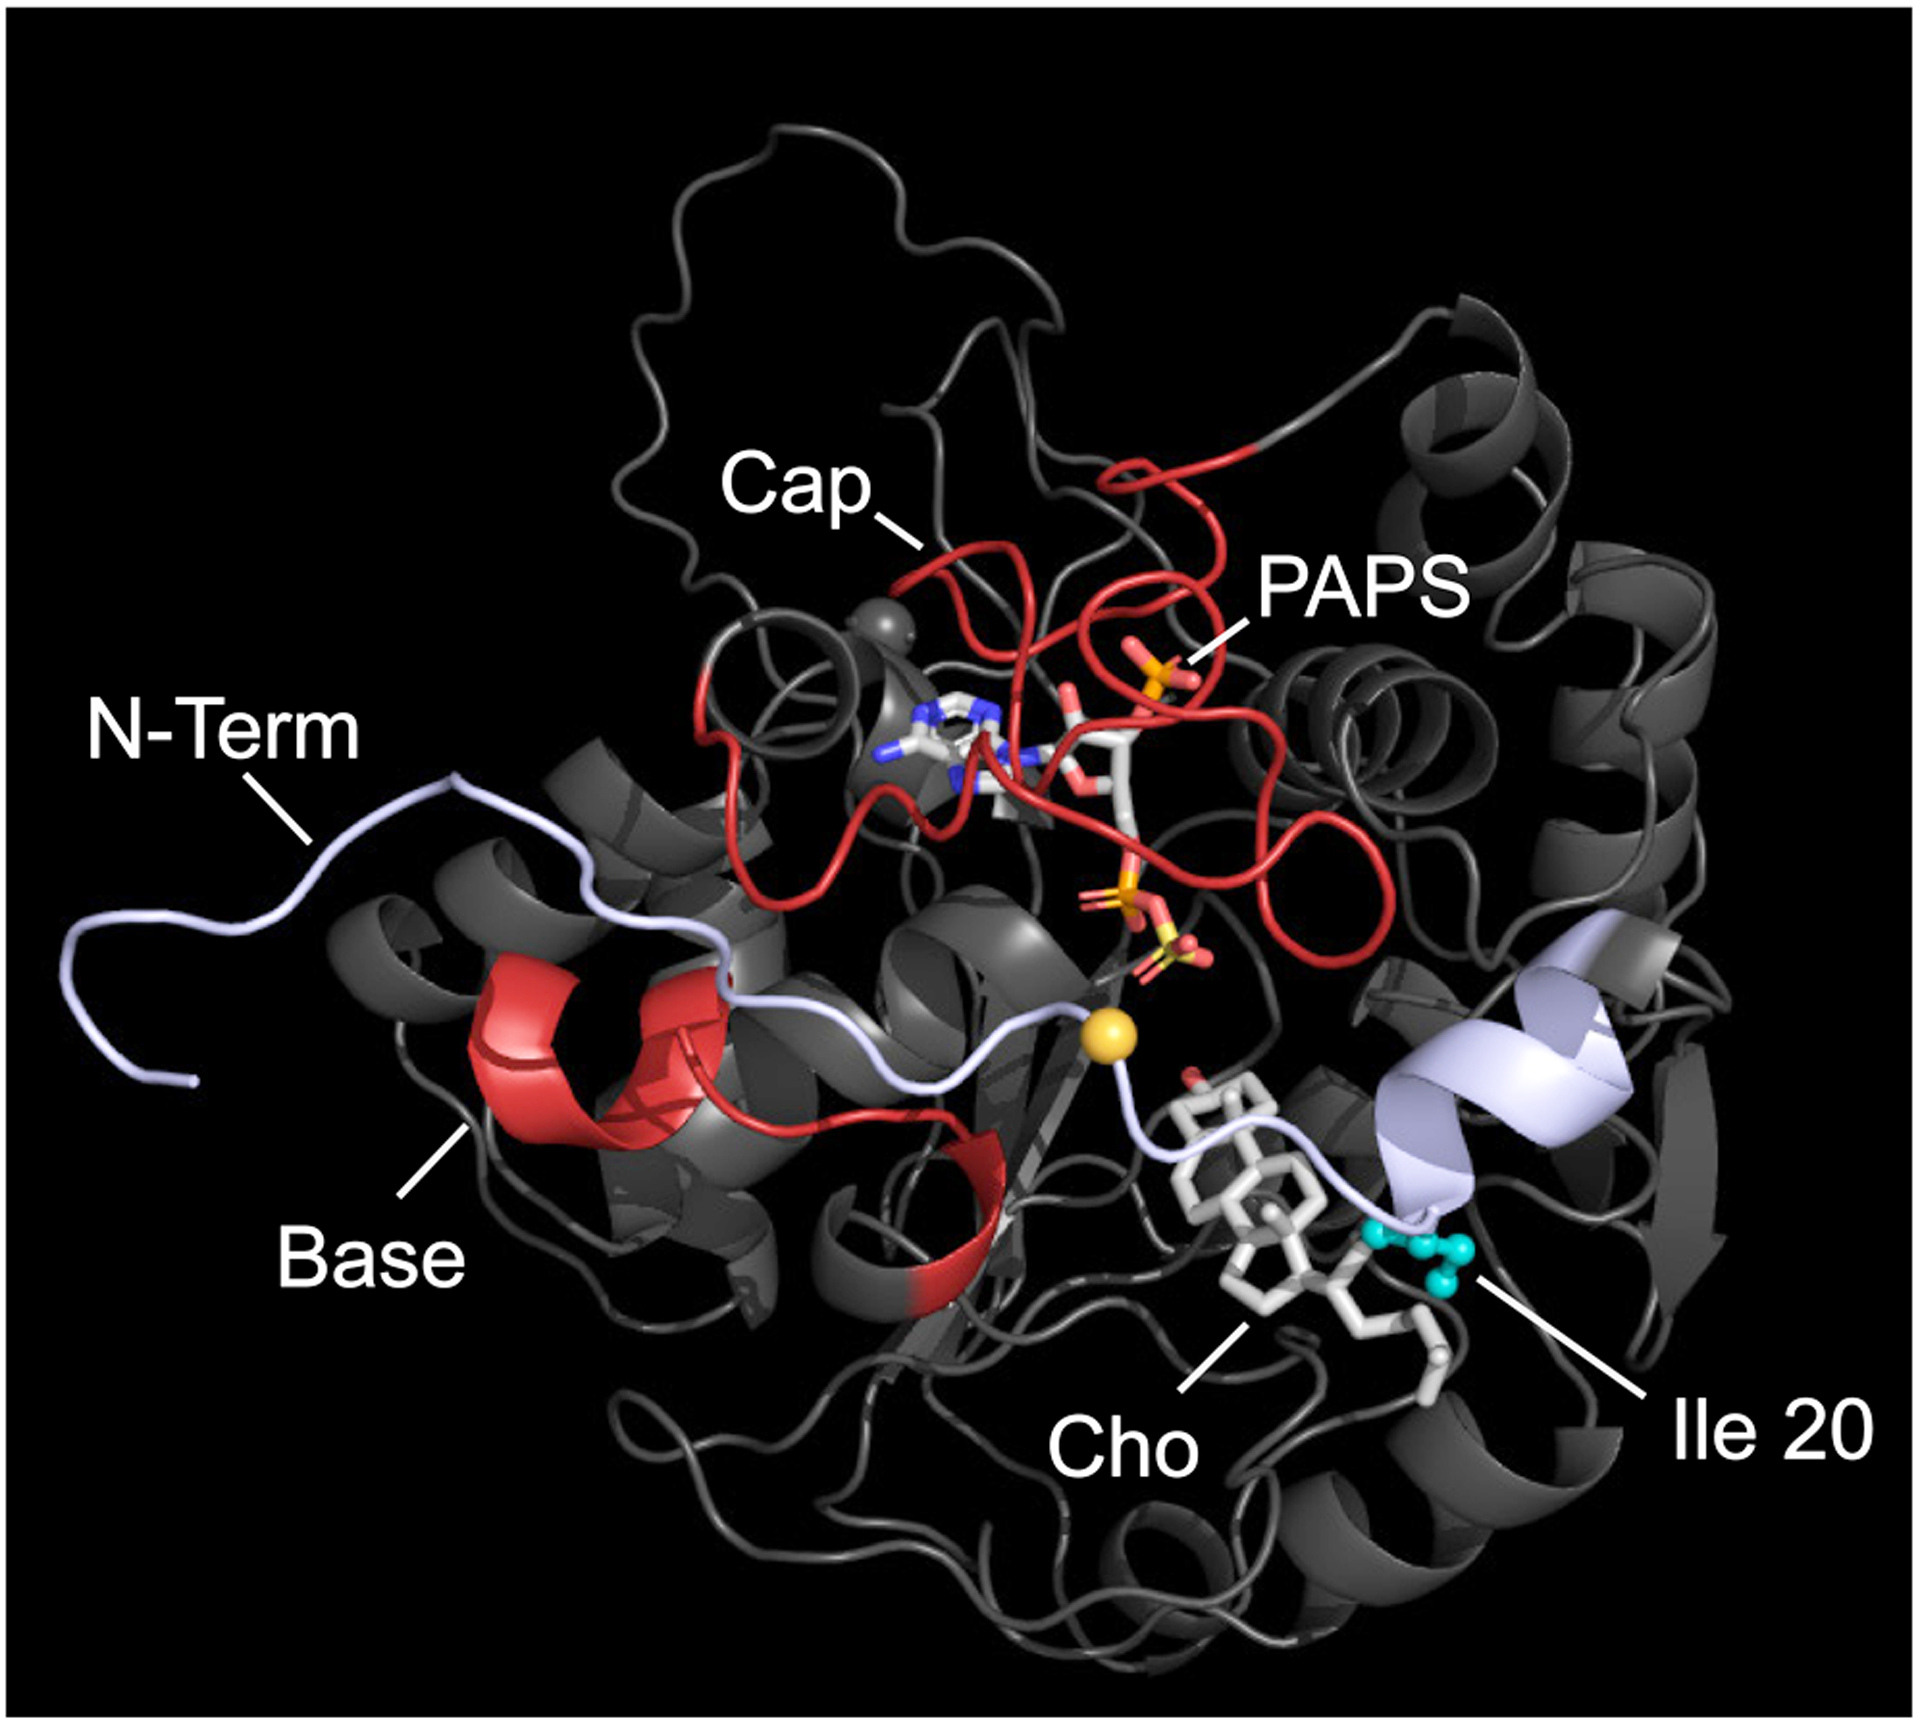
The model was derived from an X-ray structure of the SULT2B1b•PAP•DHEA complex in which the N-terminus was truncated. The pocket is formed by the interactions of N-terminus, Base, and Cap is reminiscent of allostere-binding sites seen in other SULTs. The Tyr 16 α-carbon (orange sphere) sits near the center of the putative binding pocket and was used in docking studies as the center of an in-silico 20 Å diameter sphere that encompassed the pocket and limited ligand diffusion to the pocket’s vicinity. The model accurately predicts a previously validated interaction between Ile 20 (teal), located in the N-terminus, and cholesterol (Cho). The coordinate file for the model is available at ModelArchive (modelarchive.org) accession number ma-9p9jj.
Prior studies with human SULT1 isoforms (1A1 (21, 22), 1A3 (20, 36), and 1E1 (35)) reveal that these isoforms harbor an allosteric binding site through which they communicate with compounds within their metabolic domain. These sites have proven effective targets for the development of isoform-specific proto-drugs (19) aimed at controlling isoform-related diseases. In each case, the binding pocket consists of protein structural elements brought together by planar aspects of the allostere that directly contact and stabilize the closed conformation of the cap, which inhibits turnover by slowing nucleotide release. The position and enriched aromatic character of the SULT2B1b N-terminus suggested that it might form a portion of an allostere-binding pocket.
To explore the possibility that the N-terminus forms a subsection of an allostere-binding pocket, the putative pocket was screened in-silico against the 18,600 human-plasma metabolites archived in the Human Metabolome Database (42, 56, 57). The screen, performed using GOLD (58), used a rigid protein backbone, flexible side chains, and constrained metabolites to diffuse within a 20 Å diameter sphere that encompassed the binding site — the sphere was centered on the Tyr 16 α-carbon (Fig 1, small orange sphere). The ten ligands predicted to have the highest-affinity are given in Table S2. The highest affinity hit was quercetin — a commercially available dietary flavonoid found in fruits and vegetables. Subsequent, all-atom docking using GROMACS predicted that quercetin binds tightly (Kd ~ 300 nM) at a pocket located outside of the active site (i.e., an allosteric pocket). What remained was to experimentally test the prediction and ascertain whether binding influences enzyme turnover.
Testing the Hypothesis.
The in-silico screening and modelling predictions were tested in an initial-rate study using quercetin as the titrant. Reactions were performed at saturating substrates (PAPS and 1-HP, 91 and 25 × Km, respectively) and quercetin was varied from 0.050 – 10 μM. Turnover was measured via the fluorescence changes associated with 1-HP sulfonation (λex = 325 nm, λex = 370 nm) (59). The line seen passing through the data is the behavior predicted by a least-squares fit to a partial non-competitive inhibition model (i.e., V/Vmax = (Ki + α·[I])/(Ki + [I])) where α is the fraction of enzyme turnover at saturating inhibitor (36, 52)). The results (see, Fig 2A) confirm that quercetin is an inhibitor, and the measured Ki quercetin (320 ± 20 nM) is quite close to its predicted affinity (300 nM). Further, the data and fit confirm that 2B1b turnover is reduced to a non-zero value (i.e., α = 0.08 ± 0.01) at saturating inhibitor; thus, quercetin is a partial inhibitor that slows turnover ~13-fold at saturation.
Figure 2. Selective Inhibition of SULT2s by Quercetin.
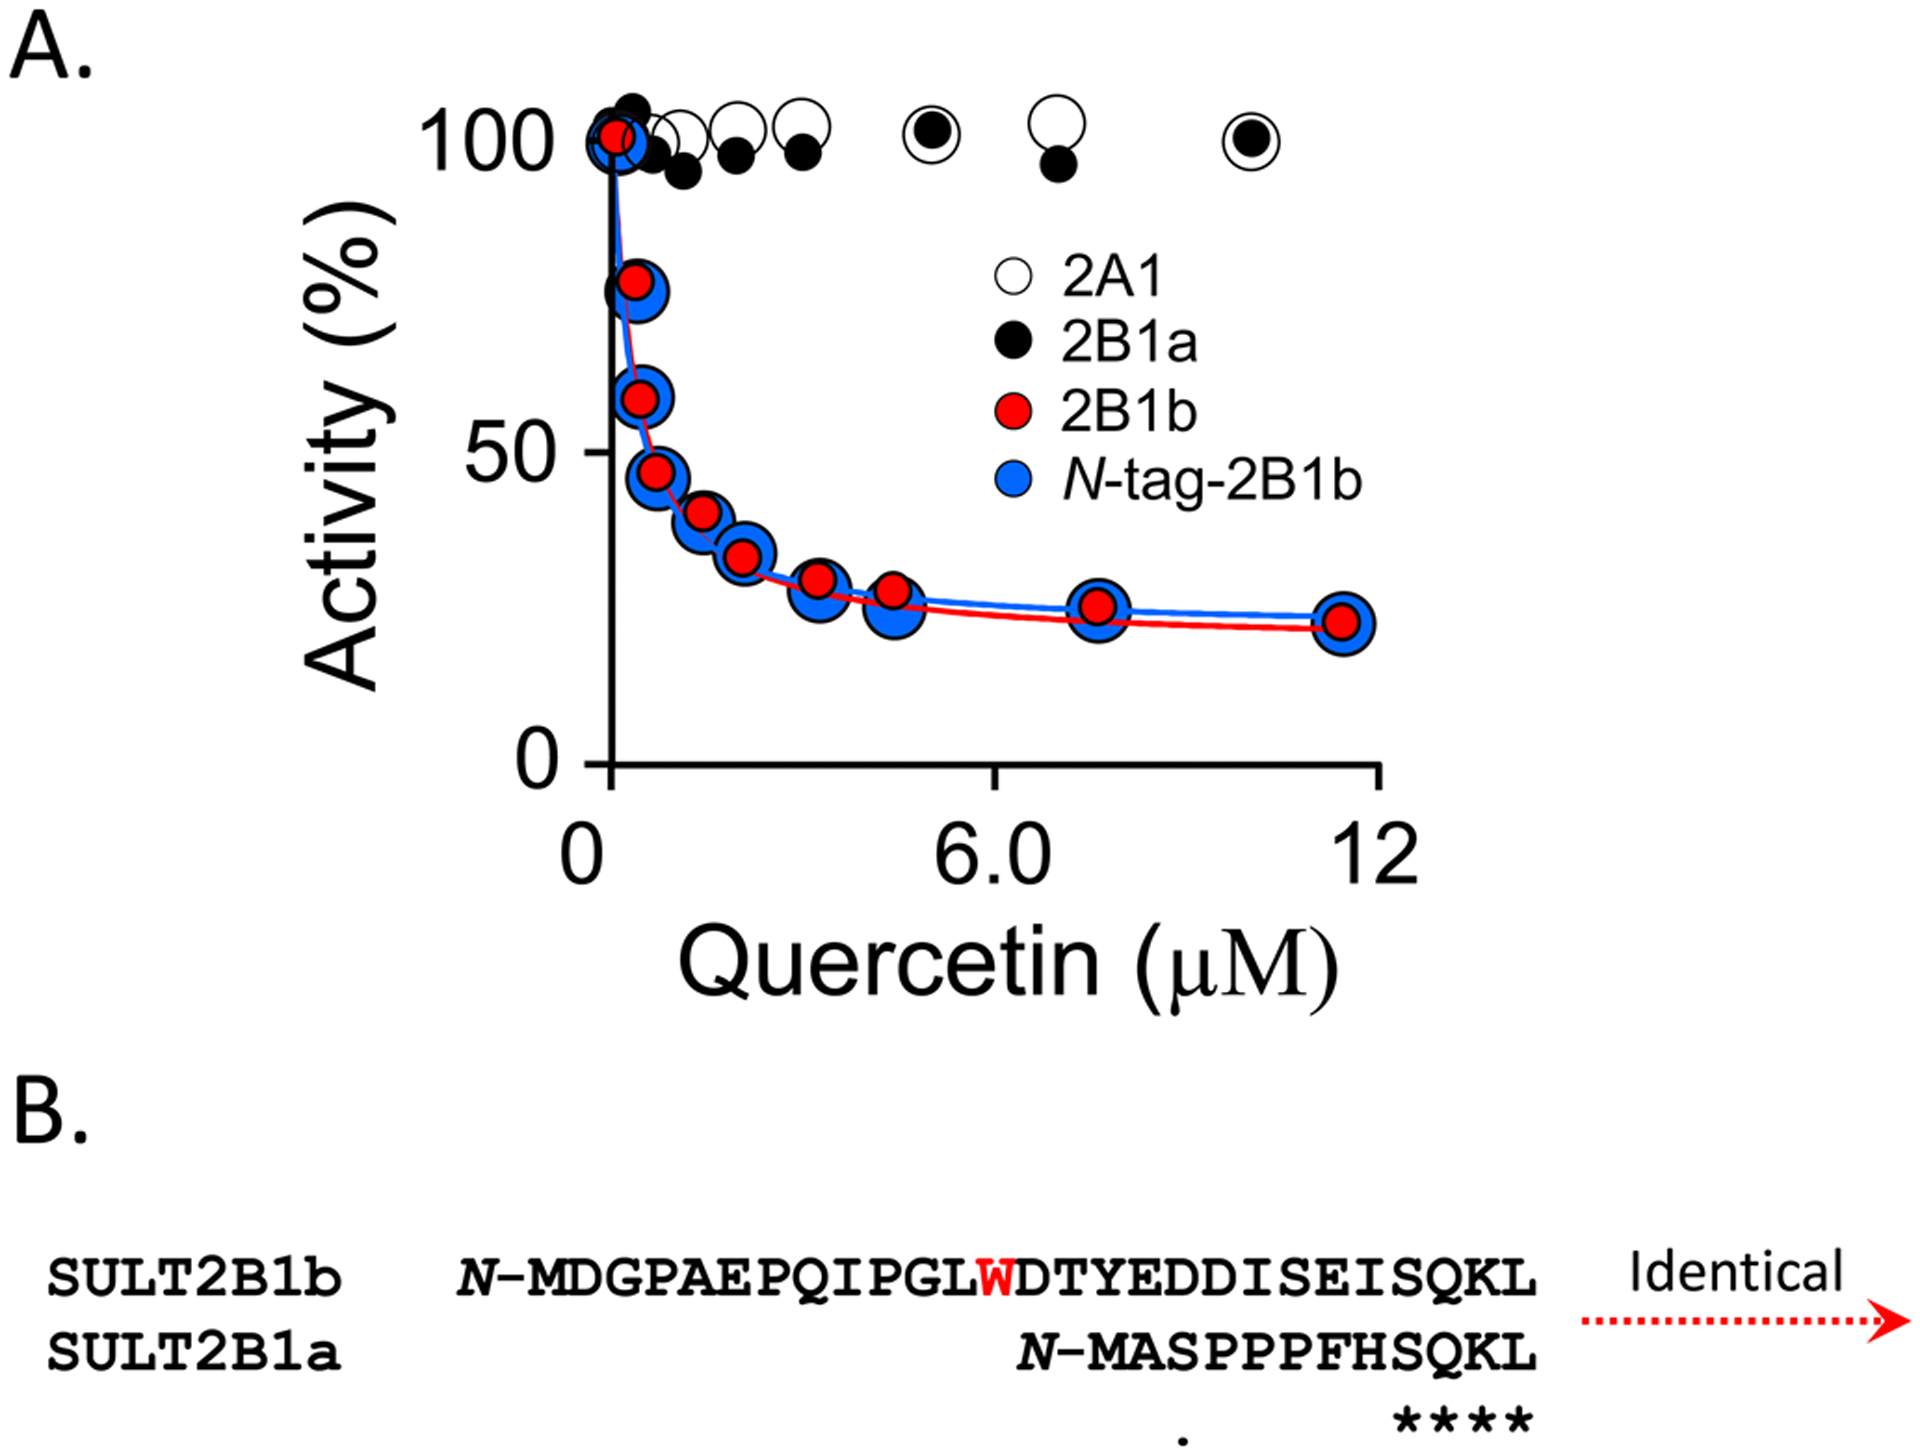
Panel A. Initial-Rate Inhibition Studies. The initial rate of 1-HP sulfation is plotted vs quercetin concentration. Activity is reported as the percent turnover relative to the uninhibited enzyme. Sulfation was monitored via the sulfation dependent change in 1-HP fluorescence (λex = 325 nm, λex = 370 nm). Reaction conditions: enzyme (30 nM, active sites), PAPS (30 μM, 91 × Km), 1-HP 60 μM, 16, 21, and 33 × Km for 2B1b, 2B1a, and 2A1, respectively), MgCl2 (5.0 mM), KPO4 (50 mM), pH 7.5, 25 ± 2 °C. Less than 5% of the concentration-limiting substrate was consumed at the reaction endpoint was converted during the rate measurements. Each point is the average of three independent determinations. The lines passing through the data are the least-squares fits of the averaged data to a noncompetitive partial-inhibition model v/Vmax = (Ki + α•([I]/Ki))/(Ki +[I]) were Ki is the inhibitor affinity constant and α is the fraction turnover at saturation. No inhibition was detected with SULT2A1 or SULT2B1a, up to 100 μM quercetin. Panel B. The N-Termini of SULT2B1b and 2B1a. N-termini of both isoforms are compared. The SULT2B1b terminus is 15 residues longer than that of 2B21b and contains the tryptophan predicted to directly contact quercetin.
During purification, SULT2B1b is cleaved from an N-terminal affinity-tag using PreScission protease, which leaves two amino acids (N-GP) at the N-terminus of the enzyme (see, Methods). Molecular dynamics predicts these two residues are well removed from the catechin binding site, and that the N-terminus structures and catechin-binding affinities of the native and tagged enzymes are virtually indistinguishable. Given that the majority of the experiments in this work were performed using the tagged enzyme, it was important to confirm experimentally that the additional resides do not alter the functions of the allosteric site. To do so, the native enzyme was purified (see, Methods) and its quercetin-inhibition profile was compared to that of the tagged enzyme. The results (see, Fig 2A) establish that within error the two species respond identically to quercetin (fit parameters: Ki WT = 320 ± 20 nM, Ki Tagged = 360 ± 20 nM; α WT = 0.08 ± 0.01, α Tagged = 0.08 ± 0.01).
To assess quercetin sensitivity across the SULT2 family, and to examine the contribution of the SULT2B1b N-terminus to catechin binding, the effect of quercetin on the initial-rate turnover of the two remaining members of the human SULT2 family (SULT2B1a and SULT2A) were tested. Except for their N-termini, the SULT2B1a and 2B1b sequences are identical. As seen in Fig 2B, the 2B1b N-terminus extension is 15 residues longer than that of 2B1a, and contains W13 — the Trp predicted to contact quercetin. Quercetin does not detectably inhibit SULT2B1a at concentrations as high as 10 μM (see, Fig 2); hence, the extension is essential to achieving enhanced quercetin affinity. The SULT2A1 N-terminus is shorter than that of either SULT2B1a or 2B1b, and, like 2B1a, 2A1 it is not inhibited by quercetin (see, Fig 2). Clearly, the only quercetin-sensitive isoform in the human SULT2 family is SULT2B1b — the isoform with high selectivity (kcat/Km) for sterols and that is involved in cholesterol homeostasis.
The Structure
The Strategy.
The distance between an enzyme-bound ligand proton and a covalently-attached, unpaired spin-label electron can be calculated from the line-broadening effects of the electron on the ligand’s solution-phase 1H-NMR spectrum (54, 60). Distance measurements made from three spatially well-separated spin-labels allow the position of each proton to be triangulated and thus the ligand to be oriented and positioned on the protein scaffold. A refined structural model of the enzyme•ligand complex can subsequently be obtained using NMR distance-constrained molecular dynamics docking, and the model can be validated via site-directed mutagenesis. Notably, the spin-label-triangulation technique allows solution structures of ligand-bound binding sites to be determined regardless of protein mass and without the need for high-resolution multidimensional NMR or isotopically enriched protein.
Spin-label Insertion-Site Selection.
Insertion sites were selected from backbone regions predicted to be stable (Cα RMSF ≤ 1.0 Å) by MD analysis of the fully equilibrated E•PAPS•Cho scaffold. Candidate sites were required to be well isolated from catalytic machinery, solvent exposed and spatially distributed to optimize triangulation of the ligand protons — i.e., an approximately triangular spin-label array in which the presumed binding site is centered ~ 20 ± 7Å from each spin label. Finally, all insertions satisfied the criteria that the RMSF of the modeled spin-label nitroxyl-oxygen be ~ 6.0 Å, indicative of unfettered motion.
Labelling the Constructs.
Spin- or diamagnetic-control labels were regiospecifically attached to the SULT2B1b S347D scaffold at Cys residues installed via PCR. To prevent unintended labelling, reactive Cys residues were first removed from the scaffold. To identify the reactive residues, each of the four Cys residues in the scaffold was separately converted to Ser and the resulting mutants were tested for DTNB reactivity. Three residues were reactive (C81, C225 and C278) and were converted to Ser in a single construct (SULT2B1b S347D, C81S, C225S, C278S) that proved to be non-reactive, stable, and to have initial-rate parameters within error of its precursor — SULT2B1b S347D (Table 1). Three Cys were then knocked into the non-reactive background (each a separate construct) at the positions chosen to triangulate the protons of quercetin bound at the inhibitor-binding pocket (S21C, D171C, and S247C). The knock-in mutants were spin-labelled (see, Methods) and the initial-rate parameters (kcat, Km and Ki) of each construct was determined (see, Methods, Initial-Rate studies) to assess whether their catalytic integrity had been compromised by the mutations and/or attached labels. The results, seen in Table 1, reveal that the labeled-mutant parameters are nearly identical to those of SULT2B1b S347D. The positioning of the spin-labels in the SULT2B1b scaffold can be seen in Fig 3. The large semi-transparent spheres center on spin-label, nitroxyl-moiety oxygen atoms, and their radii (25 Å) correspond to the approximate maximum detectible inter-spin distances. As is evident, the entire surface of the presumed inhibitor-binding pocked is “coated” with a paramagnetic field of sufficient strength to detect broadening of ligand 1H-NMR peaks and allow inter-spin distances to be determined.
Table 1.
Initial-Rate Parameters for WT and Spin-Labeled SULT2B1b Mutants
| Enzyme1 | kcat (s−1)2 | Km 1-HP (μM)2 | Ki Quc (μM)3 |
|---|---|---|---|
| WT | 3.4 (0.2)4 | 3.8 (0.3) | 0.32 (0.2) |
| NR5 | 3.3 (0.2) | 3.5 (0.2) | 0.30 (0.2) |
| 216 | 3.6 (0.3) | 4.2 (0.3) | 0.33 (0.1) |
| 171 | 3.0 (0.2) | 4.1 (0.2) | 0.35 (0.2) |
| 247 | 3.5 (0.3) | 3.6 (0.3) | 0.32 (0.2) |
All constructs contain the phosphomimetic mutation (S347D).
kcat and Km were determined at saturating PAPS (300 μM, 910 × Km).
Ki Quc was determined at saturating PAPS (300 μM, 910 × Km) and 1-HP (100 μM, 26 × Km).
Values in parentheses indicate one standard deviation.
NR, non DTNB-reactive scaffold (SULT2B1b C81S, C225S, C278S, S347).
Number indicates residue at which Cys is knocked in and the spin label is attached.
Figure 3. The Spin-Labeled SULT2B1b Constructs.
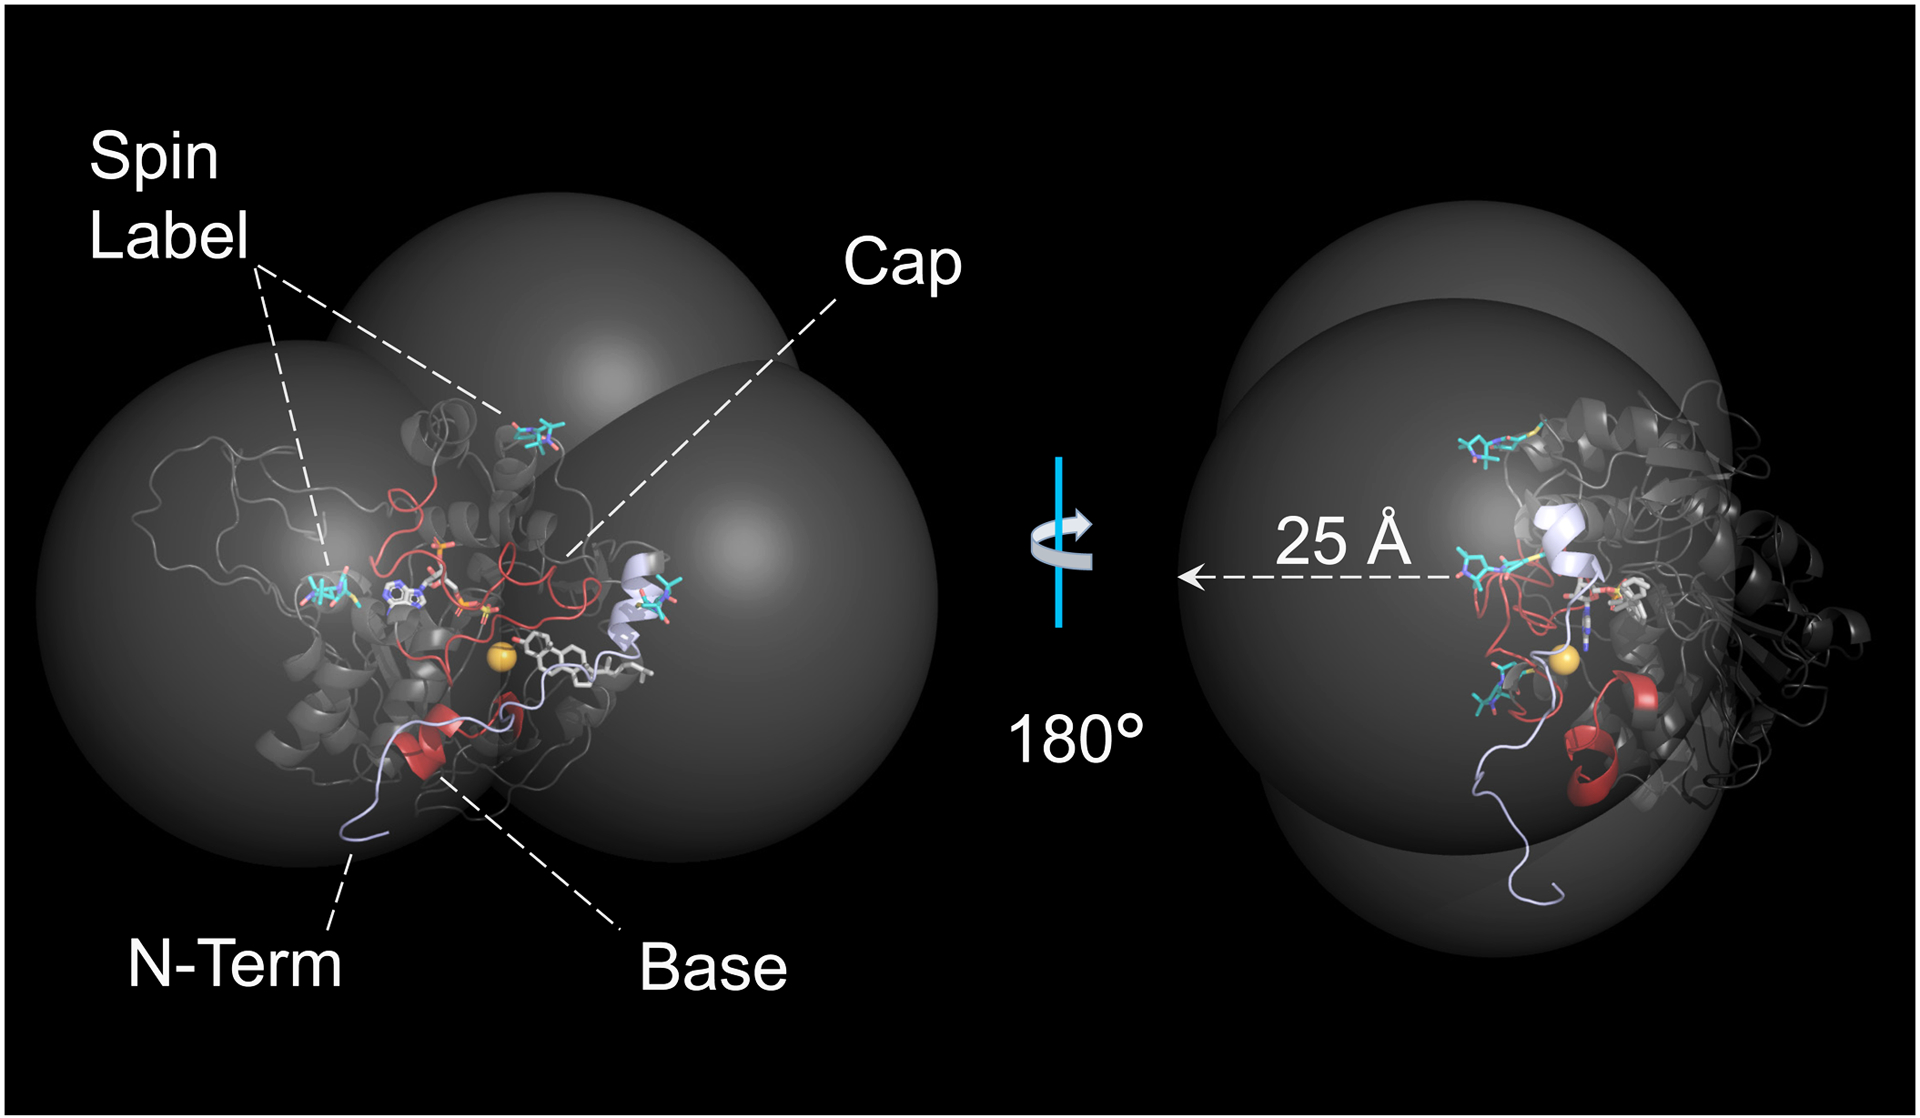
One subunit of the SULT2B1b dimer is shown. The α-carbon backbone is rendered in gray and the elements that form the putative binding site (the N-terminus, Cap and Base) are labeled and highlighted in blue and red. The small orange sphere marks the center of the binding site. The semitransparent white spheres center on the spin-label nitroxyl-oxygen atoms and their radii are set to 25 Å — the approximate maximum distance over which ligand/spin-label interactions can be detected. The spin-labels (teal) are positioned to “coat” the binding pocket in a paramagnetic field of sufficient strength to detect its effects on the solution NMR spectrum of allosteres without compromising the catalytic integrity of the enzyme.
Inter-Spin Distance Measurements.
Quercetin was positioned on the enzyme by triangulating each of its six protons using NMR-determined distances from the three spin-labels described above. A representative distance-determination study is presented in Fig 4. The structure and 1H-NMR solution spectrum of quercetin are given in Panel A. Panel B presents the effects of a spin-label attached at residue 247 on the H6-proton linewidth as a function of percent quercetin bound. Panel C presents a plot of the H6-proton linewidth as a function of the fraction quercetin bound (i.e., a LW-vs-FB plot) for each spin label and a diamagnetic control in which the residue-247 spin-label PROXYL moiety is replaced by a cyclohexyl group (20, 21, 35, 36, 61). LW-vs-FB plots for the remaining four protons can be seen in Fig S1. Each LW-vs-FB datapoint represents the average of three independent measurements whose errors fall within the dot diameters. Straight lines passing through the data represent the behavior predicted by least-squares fitting of the averaged data. The proton/spin-label distances are compiled along with their errors in Table 2. Further experimental details are described in Methods.
Figure 4. The 1H-NMR Measurements.
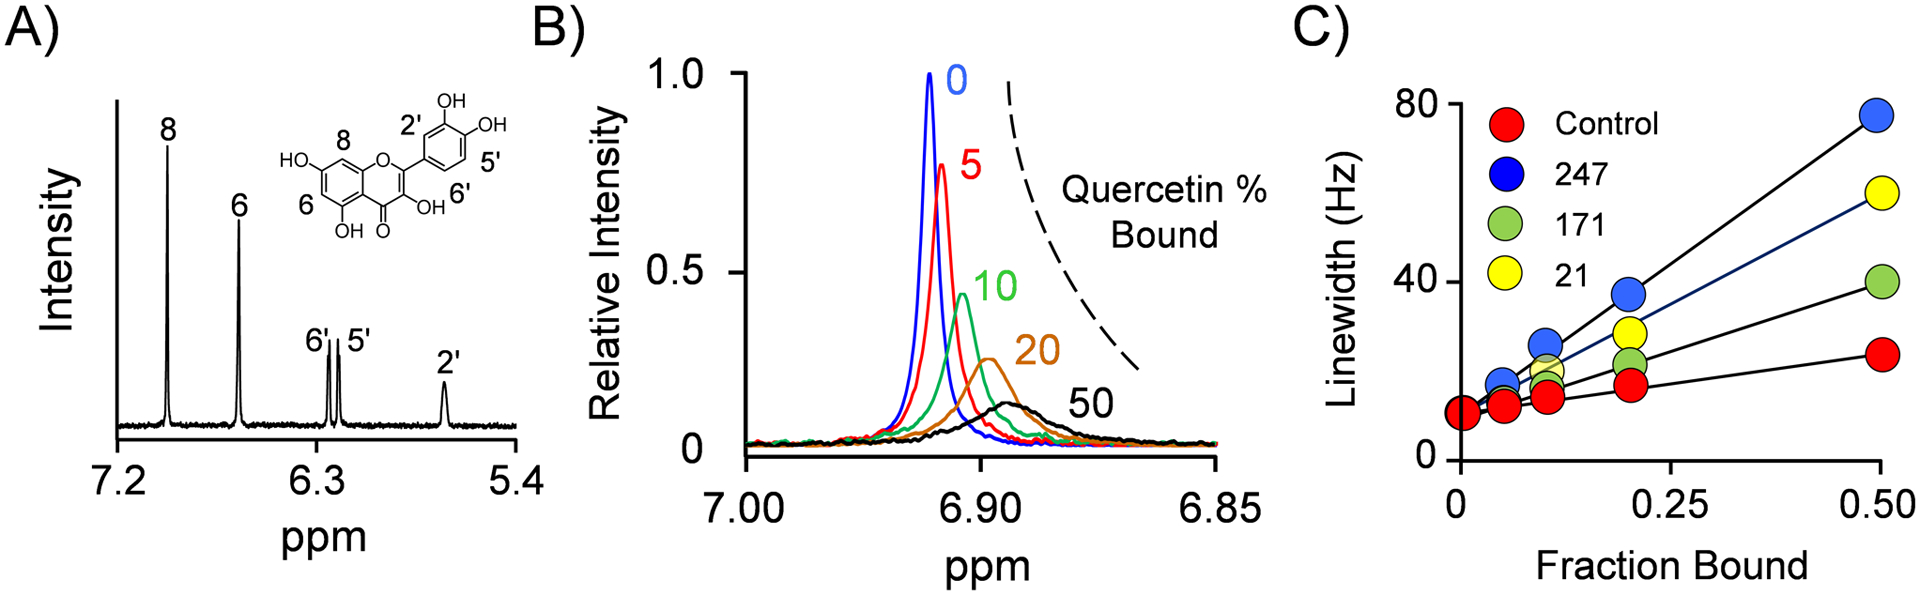
Panel A. The 600-MHz 1H-NMR Spectrum of Quercetin. A 1D-proton spectrum of solution-phase quercetin was collected using a Bruker 600 MHz spectrometer equipped with a TCI H/F-cryogenic probe at 298 °K. Conditions: quercetin (100 μM), KPO4 (50 mM), pD 7.4, D2O (> 98%), T = 25 ± 1 °C. Quercetin proton assignments were obtained from the Human Metabolome Database and are indicated on the quercetin structure. Panel B. Spin-Label Effects on Quercetin’s H6-Proton Peak. The H6-proton peak is presented as a function of the percent quercetin bound to SULT2B1b S347D spin-labeled at position 247. Conditions: quercetin (100 μM, ≥ 13 × Ki quercetin), spin-label-247 SULT2B1b S347D (0 [blue], 5.0 [red], 10 [green], 20 [orange], and 50 [black] μM, active sites), PAP (300 μM, ≥ 710 × Km PAP), KPO4 (50 mM), pD 7.5, T = 25 ± 1 °C. Panel C. Line-Width vs Fraction-Quercetin-Bound. The effects of paramagnetic and diamagnetic labels on the H6-proton linewidth are plotted vs the fraction of enzyme-bound quercetin. Experimental conditions for each labeled protein (control, 21, 171, and 247) study were identical to those given in Panel B. The diamagnetic-control label is attached at position 247. Each point is the average of three independent determinations and the measurement errors fall within the dot diameters. Lines passing through data are linear least-squares fits of the averaged data. Spin-label/proton distances were calculated using the Solomon-Bloembergen equation (see, Methods) and are reported in Table 2.
Table 2.
Proton/Spin-Label Distances (Å)
| Proton | Spin-Label Attachment Residue | ||
|---|---|---|---|
| 21 | 171 | 247 | |
| H8 | 16 (14–18) | 28 (26–30) | 16 (14–20) |
| H6 | 18 (16–20) | 26 (24–28) | 13 (11–16) |
| H5′ | 24 (21–28) | 24 (22–26) | 12 (10–15) |
| H6′ | 22 (20–24) | 25 (19–23) | 17 (14–20) |
| H2′ | 20 (18–22) | 28 (20–24) | 17 (13–20) |
Values in parentheses indicate 95% confidence interval.
Refining the Model.
The NMR-determined distances were used as constraints in GROMACS molecular dynamics studies to obtain a refined structural model of the quercetin-bound binding site. To do so, quercetin was positioned randomly in an in-silico, thermally equilibrated (25 °C), 65 × 65 × 65 Å cube containing water, NaCl (50 mM) and a SULT2B1b•PAPS•Cho model in which all three spin labels were attached (see, Methods). Distance constraints were embedded in the simulations by defining an ellipsoid whose center is the point of intersection of the three NMR distance vectors that position the proton and whose principal axes lengths are given by the SEs (± 1 σ) of the measurements. If any part of a proton’s van der Walls surface lies outside its ellipsoid, a restoring force (50 kj mol−1 Å−1) that drives the proton toward the ellipsoid center is applied using distance_restraints in GROMACS (28, 38); the restoring force inside the ellipsoid is zero. As is appropriate for positioning based on NMR spin–spin interaction measurements (17, 37, 39), distance_restraints was parameterized to use (1/r)6-weighted, time-averaged distance restrains. The motions of the six quercetin protons were constrained simultaneously. Simulations were performed 10 times and in each case the equilibrated structures were identical and did not change over a 10 ns simulation once the constraints were removed.
The Refined Model.
The MD-refined structure can be seen in Fig 5 — at-a-distance and close-up views are given in Panels A and B, respectively. As is evident (Panel A), embedding the NMR distance constraints in the MD algorithm “delivers” quercetin into the pocket predicted initially by the screening studies. The close-up (Panel B) reveals molecular details of the model. In particular, the quercetin rings are sandwiched by thee aromatic residues, each from in a separate structural element — the base (W98, teal), the N-term (W13, blue) and the cap (Y257, red). Quercetin appears to function as a molecular “key” that “locks” together the three elements and in-so-doing stabilizes the closed confirmation of the cap, slowing nucleotide release and thus turnover. To ascertain how quercetin binding might stabilize the structure, the quercetin induced change in free energy at each atom of the protein was calculated using g_energy (GROMACS). The color coded results of the calculations have been “painted” onto the protein in Panel C. Notably, the only significantly stabilized regions of the protein are the N-terminus and Cap.
Figure 5. The Refined Model of the Quercetin-Bound SULT2B1b Structure.
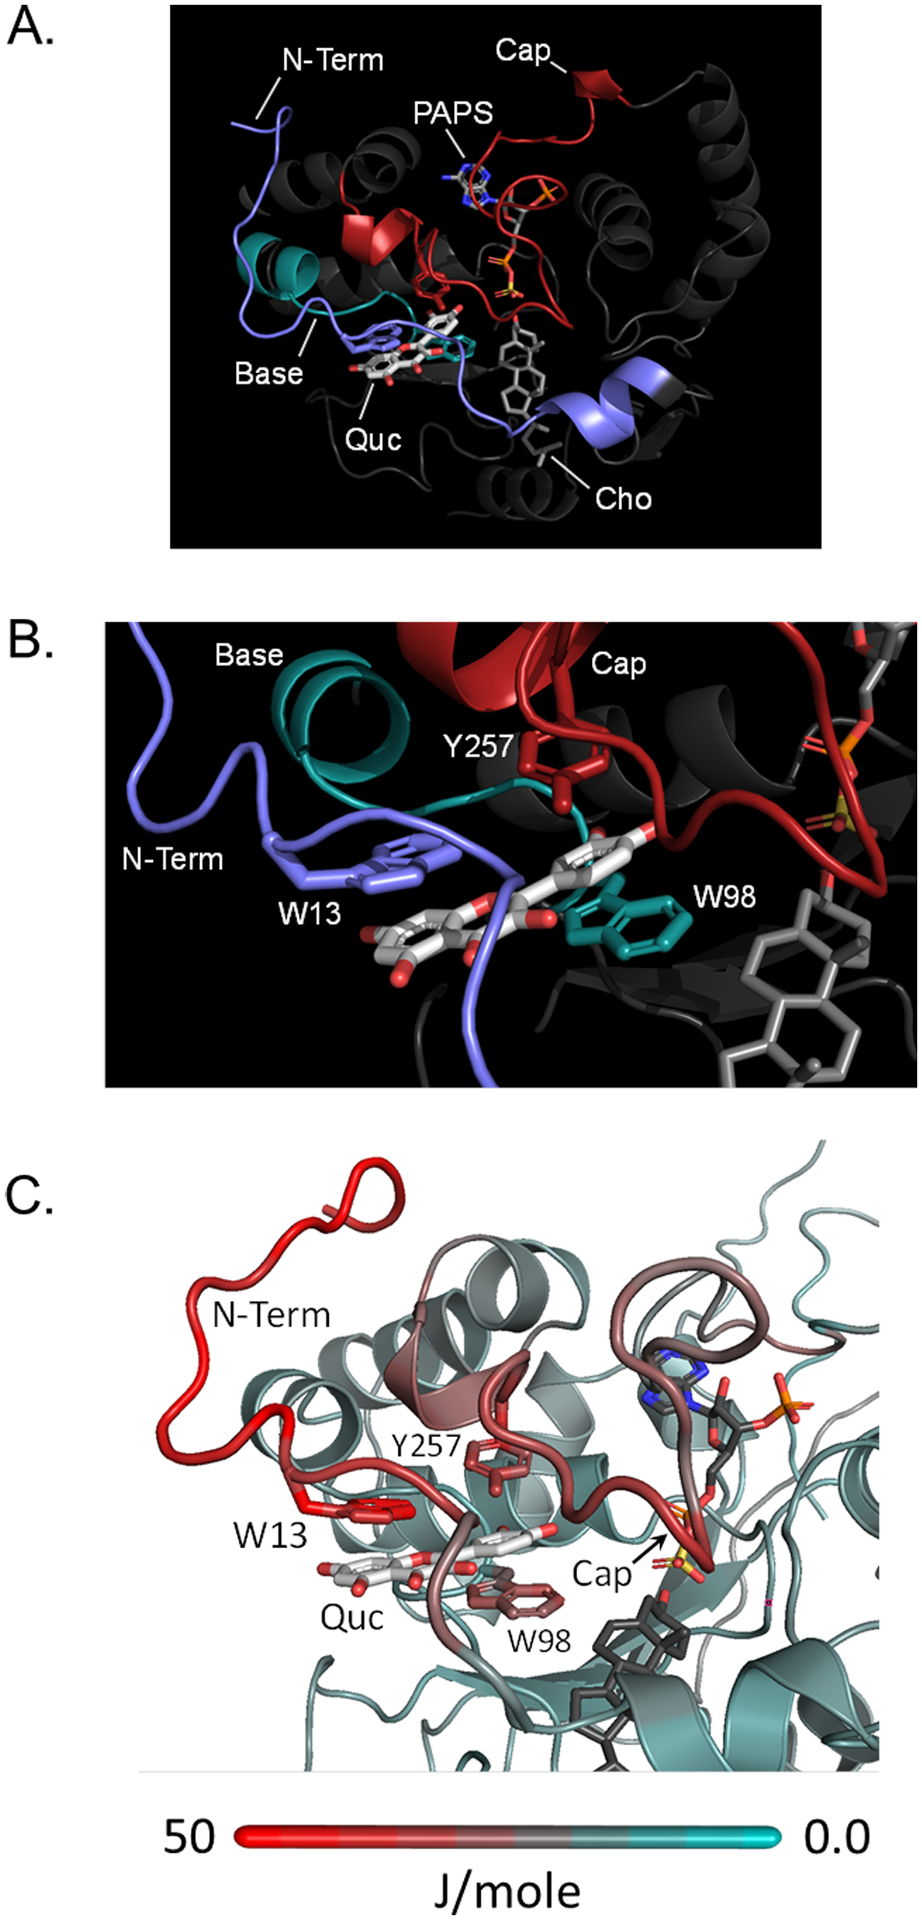
Panel A. The Binding Site. The quercetin binding site is composed of three structural elements — the N-terminus (blue), Cap (red) and Base (teal). Quercetin (Quc), cholesterol (Cho), and PAPS are labelled. Planer residues found in each of the elements are in direct contact with quercetin. Panel B. Quercetin Direct-Contact Interactions. The planar rings of quercetin are seen sandwiched by a π-stacking network composed of aromatic residues from each of the elements. The coordinate file for the model is available at ModelArchive (modelarchive.org) accession number ma-r4m3k. Panel C. Quercetin Induced Redistribution of Chemical Potential. The protein is color coded according to the g_energy (GROMACS) predicted changes in Helmholtz free energy that occur when quercetin binds. Red indicates stabilization; teal indicates no change — the scale correlates color and energy changes. The N-terminus and Cap were the only regions to undergo significant stabilization.
Validating the Model.
To confirm the refined MD-model, each residue predicted to be in direct contact with quercetin (W13, W98 and Y257) was mutagenized to Ala and the initial-rate parameters of the mutants were compared to those of wild-type. Consistent with the model, the study reveals (see, Table 3) that the mutations substantially decrease the affinity of quercetin (i.e., Ki Quc increases 5- to 32-fold). The initial-rate inhibition studies are presented in Fig S2. In support of the importance of the N-terminus in forming the allosteric-binding pocket, the largest effect on quercetin affinity is associated with W13, the N-terminus direct-contact residue. Further, the mutations do not detectibly influence kcat or the steady-state affinity of either substrate; hence, their influence is local to the quercetin binding pocket and isolated from the catalytic “machinery.” In summary, the results are fully consistent with the predictions of the refined model.
Table 3.
Initial-Rate Parameters — WT and Direct-Contact Mutants
| Enzyme1 | Ki Quc (μM)2 | (−) Quercetin | ||
|---|---|---|---|---|
| kcat (s−1)3 | Km paps (μM)4 | Km 1-HP (μM)3 | ||
| WT | 0.32 (0.2)5 | 3.4 (0.2) | 350 (20) | 3.8 (0.3) |
| W13A | 7.5 (0.5) | 3.2 (0.3) | 360 (30) | 4.2 (0.3) |
| W98A | 5.3 (0.4) | 3.5 (0.2) | 310 (20) | 3.6 (0.2) |
| Y257A | 1.6 (0.2) | 3.6 (0.4) | 370 (30) | 4.0 (0.3) |
Enymes all harbor the phosphomimetic S347D mutation.
Determined at saturating PAPS (300 μM, 910 × Km) and 1-HP (100 μM, 26 × Km).
Determined at saturating PAPS (300 μM, 910 × Km).
Determined at saturating 1-HP (100 μM, 26 × Km).
Values in parentheses indicate one standard deviation unit.
Initial-rate protocols are described in Materials and Methods.
The Inhibition Mechanism.
The SULT cap mechanism stipulates that the cap is drawn shut by interactions with the nucleotide as it binds, and that the nucleotide can neither enter nor escape the active site when the cap is closed (22, 61). If quercetin stabilizes the cap-closed conformation when nucleotide is bound, it will “trap” the nucleotide and increase its affinity to the extent that it stabilizes the closed form. By conservation-of-energy, nucleotide binding will enhance quercetin’s affinity to the same extent. These relationships are supported quantitatively by quercetin/PAPS-interaction binding studies (see, Fig 6 and Table 4) which reveal that PAPS affinity is increased 12-fold at saturating quercetin, and saturation with PAPS increases quercetin affinity 15-fold.
Figure 6. Quercetin/PAP Binding Interactions.
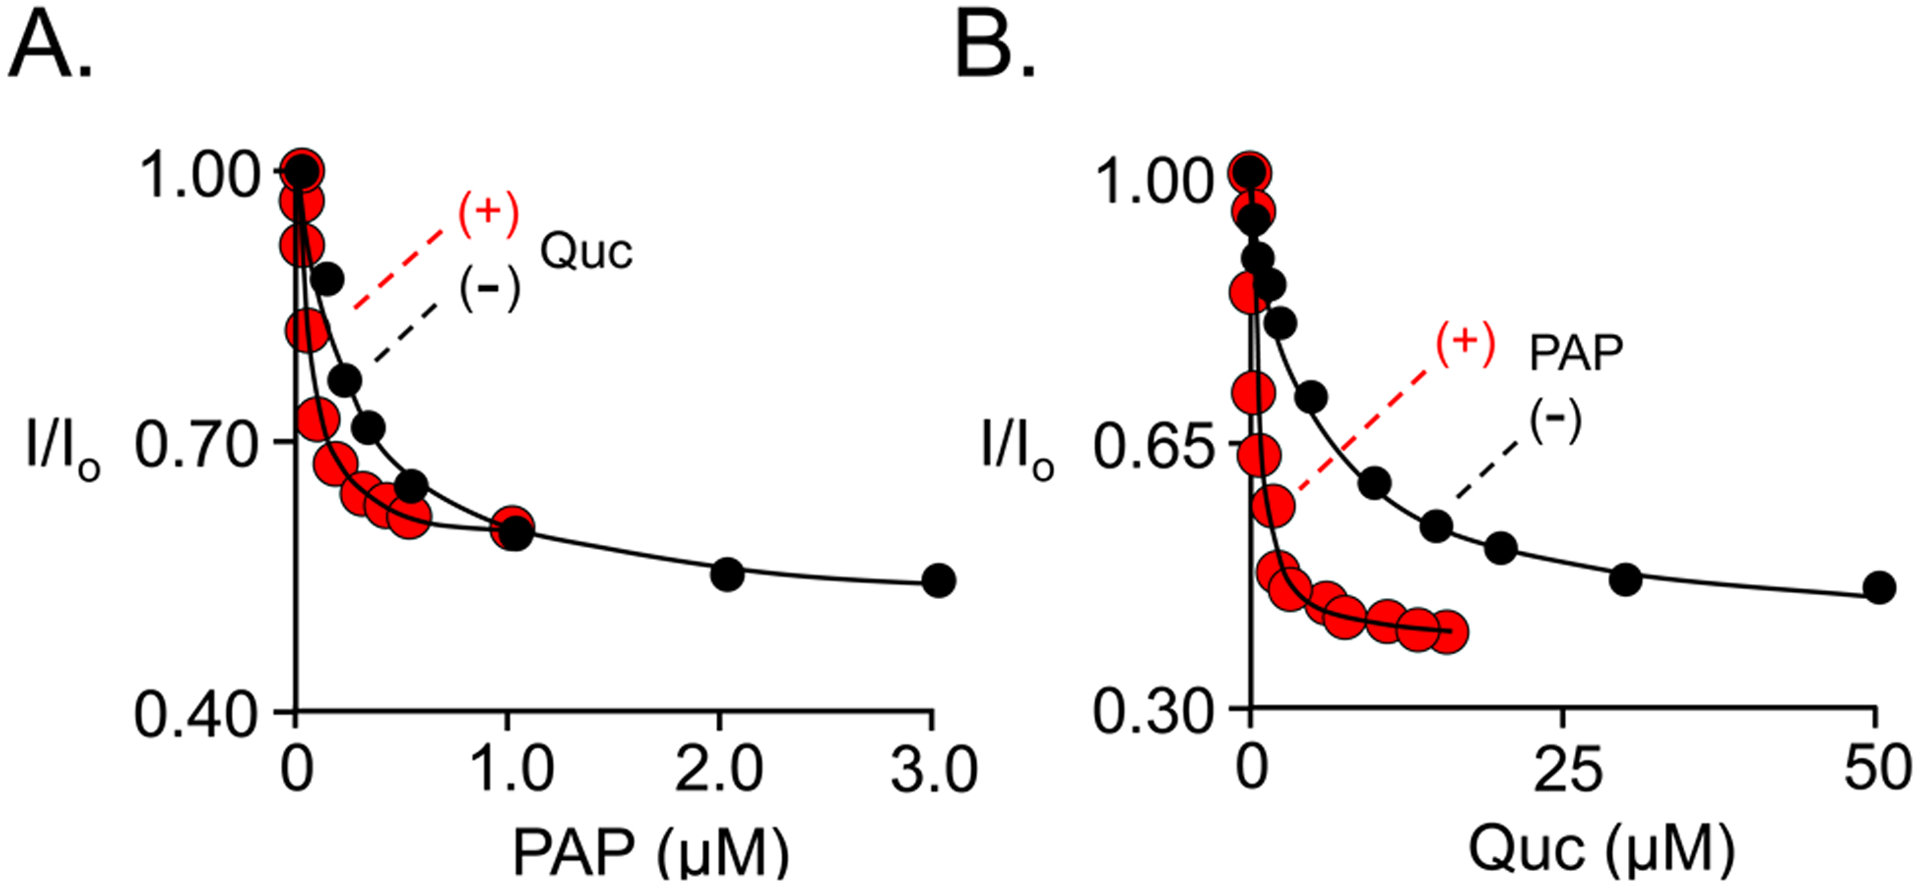
Binding was monitored via ligand-induced changes in SULT2B1b S347D intrinsic fluorescence (λex = 290 nm, λem = 345 nm). Fluorescence intensity is given relative to the intensity in the absence of titrant (i.e., I/I0) and is plotted vs titrant concentration. Panel A. PAP binding to E and E•Quc. Conditions: SULT2B1b S347D (10 nM, active sites), PAP (5.0 nM – 20 μM), quercetin (0 [black] or 150 μM [red] μM, 28 × Kd), KPO4 (50 mM), pH 7.5, 25 ± 2 °C. Panel B. Quercetin binding to E• and E•PAP. Conditions: SULT2B1b S347D (50 nM, active sites), quercetin (0.10 – 50 μM), PAP (0 [black] or 30 [red] μM, 91 × Kd), KPO4 (50 mM), pH 7.5, 25 ± 2 °C. Titrations were performed in triplicate and measurement errors fall within the data points. Lines through the data represent least-squares fits of the averaged data using a binding model that assumes one binding site per subunit. The resulting dissociation constants and errors are reported in Table 4.
Table 4.
Quercetin/PAP Binding Interactions
| Ligand | ||
|---|---|---|
| Enzyme Form | Quc | PAP |
| Kd (μM) | ||
| E• | 5.3 (0.4)1 | 0.38 (0.03) |
| E•PAP | 0.35 (0.011) | NA |
| E•Quc | NA | 0.031 (0.03) |
Values in parentheses equal one standard deviation.
To further explore the inhibition mechanism, the effects of quercetin on the rate constants governing PAPS binding and release were determined in stopped-flow fluorescence studies. If quercetin stabilizes the closed cap in the absence of bound nucleotide, the mechanism predicts the rate at which nucleotide binds will decrease in equal proportion to the decrease in the concentration of the open form of the enzyme (i.e., the form to which nucleotide binds). Alternatively, if quercetin stabilizes the cap-closed configuration only when nucleotide is bound, it will slow the escape of the nucleotide and have no effect on its on-rate. A representative progress curve for PAPS binding to unliganded SULT2B1b can be seen in Fig 7A (experimental protocols are described in the legend and Materials and Methods). The reactions are pseudo-first order in PAPS concentration, and the red line passing through the data is the least-squares best-fit of the averaged data to a single-exponential decay. Similar curves were obtained at five different PAPS concentrations in the presence and absence of saturating quercetin (15 × Kd), and the resulting kobs values were plotted vs [PAPS] (see, Panels B and C, respectively). PAPS kon and koff values were obtained by least-squares fitting of the kobs vs [PAPS] plots (19, 22, 33), and are listed in Table 5. The kobs values reveal that when bound to the unliganded enzyme, quercetin does not induce sufficient cap closure to detectibly slow the addition of PAPS (i.e., kon (+/−) saturating quercetin is identical within error). The effects of quercetin appear to be entirely on koff PAPS, which decreases 14-fold at saturating quercetin. These results agree quantitatively with the binding studies.
Figure 7. Stopped-Flow PAPS-Binding Studies.
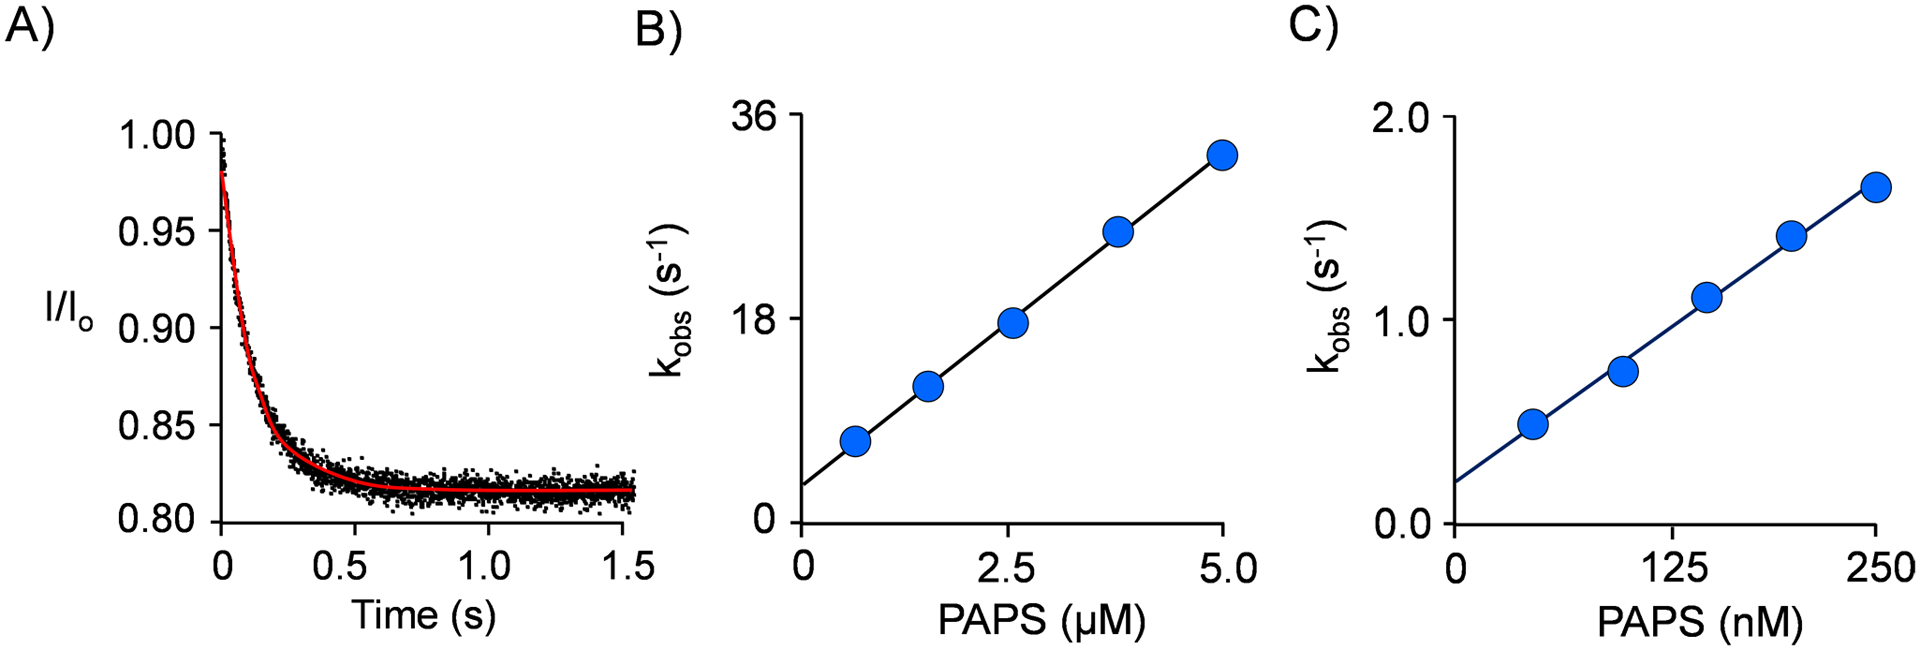
Panel A. Representative Progress Curve. SULT2B1b S347D was mixed against PAPS (2.0 μM). Panel B. kobs vs [PAPS]. Panel C. kobs vs [PAPS] at Saturating Quercetin. PAPS binding to SULT2B1b S437D was monitored via ligand-induced changes in SULT2B1b intrinsic fluorescence using an Applied Photophysics SX20 stopped-flow spectrofluorometer (λex = 290 nm, λem ≥ 330 nm (cutoff filter)). Reactions were initiated by rapidly mixing (1:1 v/v) a solution containing SULT2B1b S347D (10 nM, active sites), quercetin (0 or 170 μM), KCl (50 mM), KPO4 (50 mM), pH 7.5, 25 ± 2°C, with a solution that was identical except that it lacked enzyme and contained PAPS. All reactions were pseudo first order in PAPS. kobs values were obtained by fitting the average of five progress curves to a single exponential and were determined in triplicate. Errors in the kobs vs concentration plots fall within the data points, and the lines through the data are linear least-squares fits to the averaged values. kon and koff, obtained from slopes and y-intercepts of kobs vs concentration plots, can be found in Table 5.
Table 5.
Rate Constants Governing Nucleotide Binding to SULT2B1b
| Nucleotide | (−) Quc | (+) Quc | ||
|---|---|---|---|---|
| kon (μM−1s−1) | koff (s−1) | kon (μM−1s−1) | koff (s−1) | |
| PAPS | 8.0 (0.3)1 | 3.0 (0.2) | 8.2 (0.5) | 0.22 (0.02) |
| 2Kd PAPS | 0.38 (0.02) | 0.027 (0.003) | ||
Values in parentheses indicate standard error.
Kd = koff/kon.
SULT nucleotide-binding domains are highly conserved and they bind PAP and PAPS with nearly identical affinities, and on- and off-rate constants (11, 19, 62). This equivalency is corroborated in the case of SULT2B1b by the fact that the affinity of PAP (0.38 ± 0.03 mM, measured by equilibrium binding) is within error of the affinity of PAPS (0.38 ± 0.02 mM, measured by pre-steady state binding). Given the similar behavior of PAP and PAPS, it is notable that the rate constant for release of PAPS in the absence of quercetin (3.0 ± 0.2 sec−1) is within error equal to kcat (3.4 ± 0.2 sec−1), suggesting that, as with other SULT isoforms, the rate-limiting step in the catalytic cycle is nucleotide release (33). Moreover, the rate constant for PAPS release at saturating quercetin (0.22 ± 0.2 sec−1) is within error equal to the turnover at saturating quercetin (0.20 ± 0.02 sec−1).
SULT1 vs SULT2 Allosteric Sites.
Notwithstanding allelic variation, the human genome is capable of expressing 14 SULT isoforms from four SULT families — nine belong to the SULT1 family, three are SULT2 family members, and the SULT4 and SULT6 family each contains one isoform. The SULT1 isoforms differentiate further on the basis of sequence similarity into four subfamilies — SULT1A, B, C and E (63). To date, three SULT1 isoforms (1A1, 1A3 and 1E1) are known to be allosterically inhibited by catechins, and the catechin binding-site structures of these isoforms have been determined (20, 22, 35). The structures are highly conserved and inhibition is accomplished, as with SULT2B1b, through stabilization of the closed form of the active-site cap (19, 20, 35, 61). The high degree of sequence and structural conservation in the SULT1 family suggests other family members harbor a similar allosteric pocket. In contrast, among the SULT2 isoforms (2A1, 2B1a and 2B1b) only 2B1b has evolved the capacity for catechin regulation, which, as described above, is conferred by its lengthened N-terminus. Despite that fact that the SULT2 binding site resembles the SULT1 site in many ways, it does not appear to bind catechins in the absence of the N-terminal extension. It is as if sensitivity to such allosteres exists in the SULT2 family exclusively to regulate the metabolism in which SULT2B1b participates; presumably, cholesterol homeostasis.
The structure of a representative SULT1 catechin-binding site (i.e., SULT1A1) is compared to that of SULT2B1b in Fig 8 A–D. At-a-distance and close-up views of the SULT1A1 (Panels A and B) and SULT2B1b (Panels C and D) binding sites are presented. The major quercetin-binding elements of the SULT1A1 (the cap, base and lower lip) are labeled and color coded, as are the residues in these elements that are in direct contact with quercetin. A similar scheme is used to present the SULT2B1b binding site. The structure of the SULT1A1 binding site was solved (22) using a different catechin (epigallolcatechin gallate, EGCG), which was replaced by quercetin using all-atom molecular dynamics docking (see, Methods).
Figure 8. The SULT1A1 and SULT2B1b Quercetin-Binding Sites.
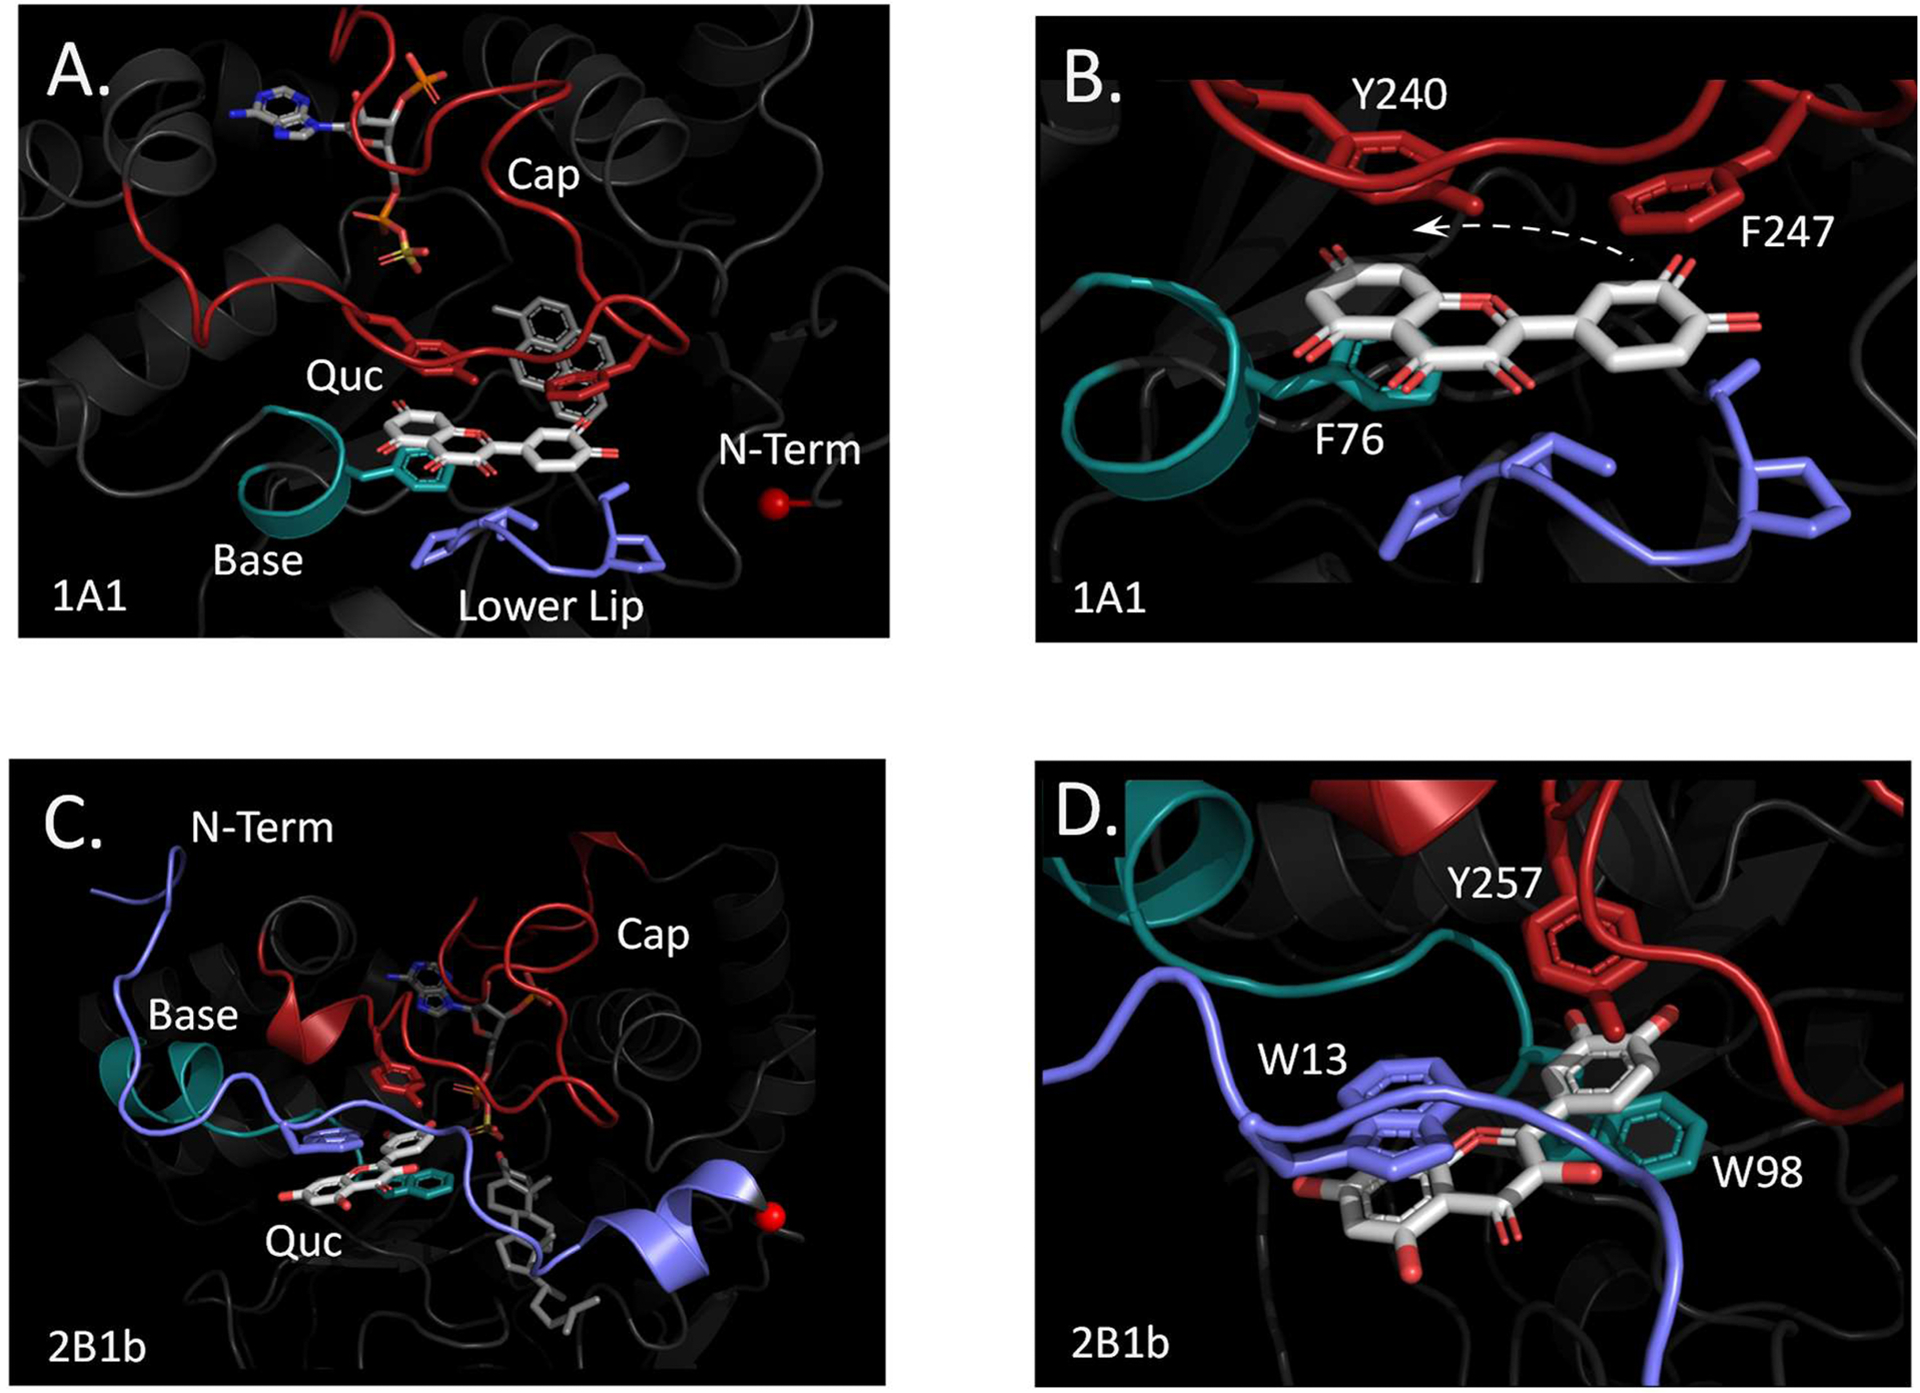
Panels A and B. The SULT1A1 Binding Site. At-a-distance (Panel A) and close-up (Panel B) views of the SULT1A1 quercetin-binding site. The Base, Cap and Lower Lip of the binding site are color coded, as are the residues in these elements that directly contact quercetin. The N-terminal methionine α-carbon of SULT1A1 is presented as a small red sphere. The hyphenated arrow seen in Panel B indicates the reorientation undergone by quercetin in going from the SULT1A1 to 2A1 binding sites. Panels C and D. The SULT2B1b Binding Site. At-a-distance (Panel C) and close-up (Panel D) views of the SULT1A1 quercetin-binding site. Color coding is as described for Panels A and B. The small red sphere highlights the α-carbon of K26, which is the approximate endpoint of the SULT1A1 N-terminus.
In the SULT1A1 structure, quercetin intercalates between the cap and the base and lower-lip. Quercetin’s fused rings are sandwiched between two phenolic R-groups, one in the cap (Y240) and one in the base (F76), and its dihydroxyphenyl ring lies between a phenylalanine (F247) in the cap and a six-residue, proline-rich molecular “platform” — the lower lip (20, 22). The small red sphere in Panel A highlights the SULT1A1 N-terminal methionine, and, as is evident, the N-terminus does not directly participate in binding quercetin. The N-terminus of SULT2B1b, shown in blue in Panel C, wraps around the outer edge of the cap and establishes a π-stacking interaction between W13 and the fused quercetin rings. In SULT2Bb, it is quercetin’s single ring, rather than its fused rings, that is sandwich between phenolic R-groups in the cap and base (W98 and Y257); consequently, the biphenyl ring rotates inward toward PAPS, as suggested by the dashed arrow in Panel B. Perhaps most notable is the absence of the lower lip in the 2B1b structure. Aligning the sequences of SULT1A1 and the three members of the SULT2 family (see, Fig S3) reveals that five of the six lower-lip residues are deleted in each SULT2 family member; moreover, F247, which acts in concert with the lower lip to sandwich the biphenyl ring in SULT1A1, is not conserved in the SULT2 isoforms. The loss of this clamp-like feature causes the affinity of SULT2 family members, with the exception of 2B1b, for quercetin to plummet to below detectable levels. While quercetin affinity is somewhat regained by “replacing” the clamp with a single N-terminal π-stacking interaction, the affinity is ~ 68-fold less for SULT2B1b than SULT1A1 (64).
Endogenous Metabolite Allosteres.
Having discovered the SULT2B1b allosteric pocket and determined its structure, it was of interest to use the structure to identify endogenous metabolite allosteres, and, in so doing, to begin to reveal the metabolic network in which SULT2B1b operates in vivo. Cholesterol has two immediate biosynthetic precursors — 7-dehydrocholesterol (7-DH) and 24-dehydrocholesterol (24-DH) (65, 66), neither of which is a SULT2B1b substrate (67). The precursors are produced by two parallel, interconnected pathways (68). The levels of 7-DH and 27-DH are highly tissue and cell-type dependent (68). In silico screening (described above) predicted that 7-DH would bind the SULT2B1b allosteric site at a seemingly physiologically relevant concentration, and that 24-DH would not. The predictions were tested in an initial-rate inhibition study in which SULT2B1b turnover was monitored as a function of precursor concentration. The results, seen in Fig 9, confirm the predictions — 7-DH is indeed a partial allosteric inhibitor (Ki 7-DH = 110 ± 7 nM; α = 0.11 ± 0.02) and 24-DH does not inhibit at concentrations as high as 10 μM. The physiological relevance of 7-DH inhibition is supported by the fact that it’s Ki (0.11 μM) is comparable to 7-DH levels found in plasma from healthy individuals (~ 0.14 μM) (69, 70).
Figure 9. Cholesterol Precursor Inhibition of SULT2B1b.
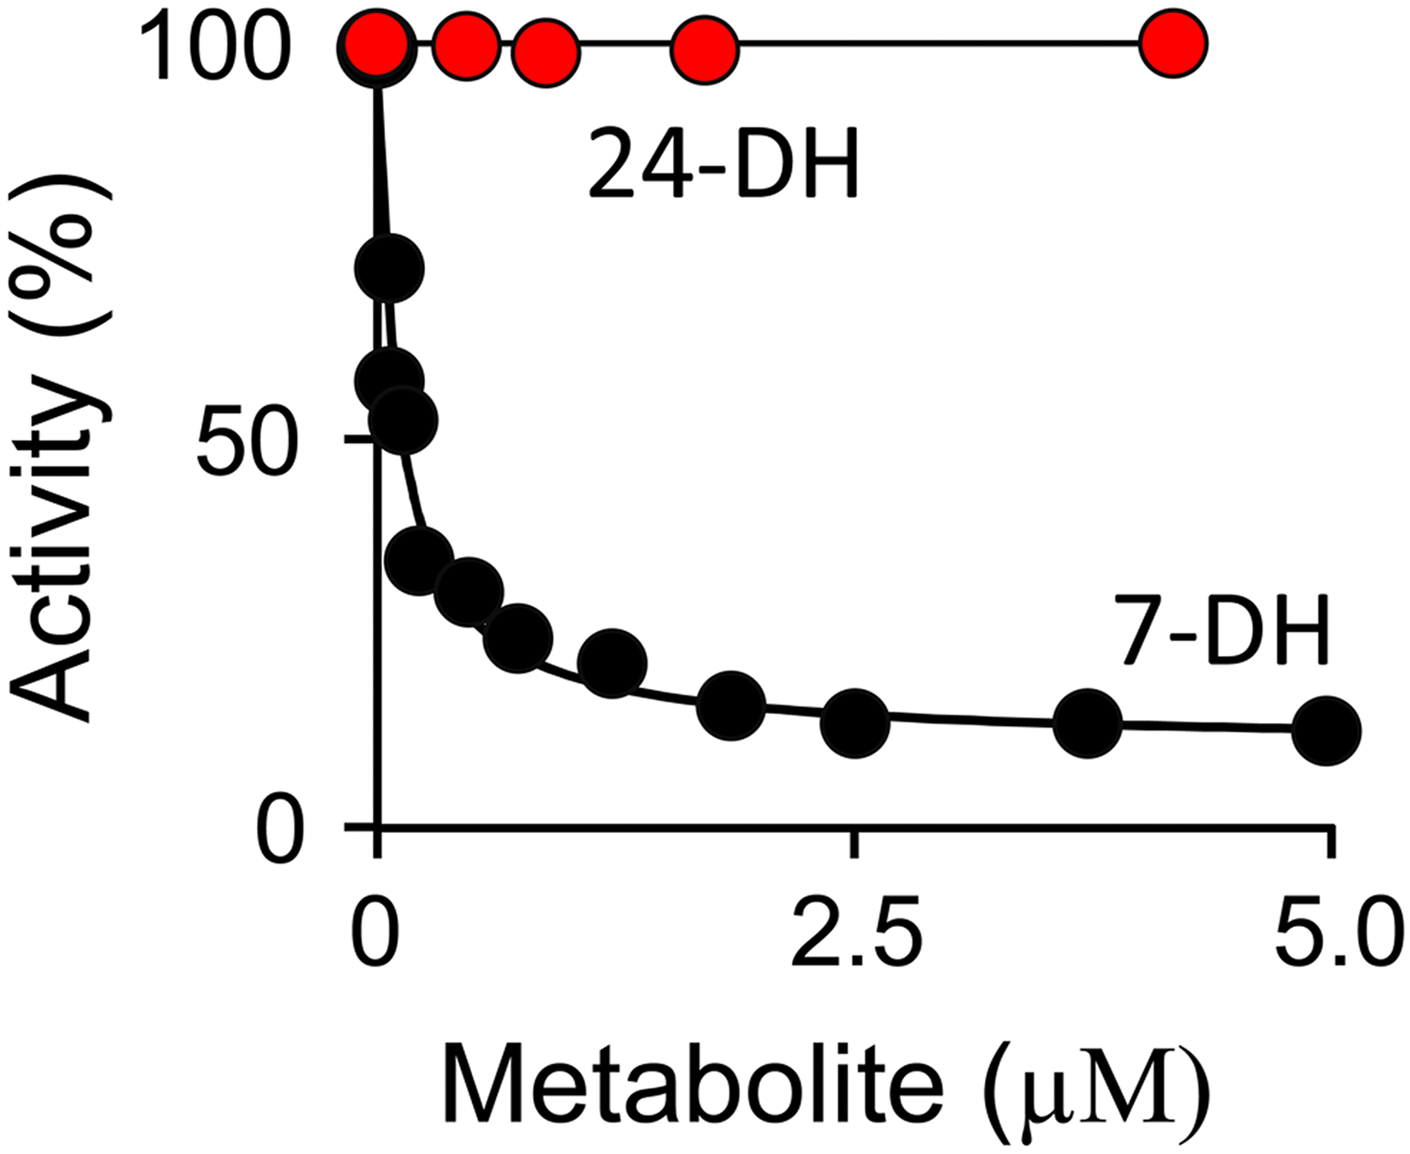
Initial rate turnover of SULT2B1b is plotted versus 7-deyhdrocholesterol (7-DH, black dots) or 24-deyhdrocholesterol (24-DH, red dots) concentration. Reactions were monitored via the sulfonation dependent change in 1-HP fluorescence (λex = 325 nm, λex = 370 nm). Activity is reported as percent turnover relative to the uninhibited enzyme. Reaction conditions: SULT2B1b (15 nM, active site), PAPS (30 μM, 91 × Km), 1-HP (100 μM, 26 × Km), MgCl2 (5.0 mM), KPO4 (50 mM), pH 7.5, 25 ± 2 °C. Less than 5% of the concentration-limiting substrate consumed at the reaction endpoint was converted during the rate measurements. Each point is the average of three independent determinations. The line passing through the 7-DH data is the behavior predicted by a least-squares fit of the averaged data to a noncompetitive partial-inhibition model (Ki is 110 ± 7 nM, α = 0.11 ± 0.02).
It is intriguing that the immediate cholesterol precursor from one major cholesterol-biosynthetic branch (7-DH) switches off sterol sulfonation, while the precursor from the other major branch (24-DH) does not effect sulfonation. It is as if the molecular decisions that determine flux through cholesterol biosynthetic pathways also determine how the products of the pathway will be functionalized, in this case, by sulfonation — a modification known to profoundly influence the biological functions of sterols. Also though-provoking is the fact that the arguably subtle structural change caused by inserting a double bond at C7 transforms cholesterol from a substrate that binds the active site but not the allosteric pocket, into an allostere with converse binding properties; similarly, double-bond insertion at C24 precludes binding at either site.
Conclusions
Molecular dynamics studies and in-silico screening suggested that the 25-residue N-terminus of SULT2B1b form an essential aspect of an allosteric binding site — the first such site to be identified in a SULT2 family member. The existence of the site was confirmed using quercetin, a nutraceutical allostere identified during screening. Quercetin binds tightly (320 ± 20 nM) and is shown to be a partial allosteric inhibitor. A structural model of the quercetin-bound site was constructed using NMR-distance constrained molecular dynamics docking and revealed that the planar rings of quercetin extensively π-stack with aromatic residues in the N-terminus, cap and base of the binding site. The quercetin/cap-interactions suggested quercetin might inhibit turnover by stabilizing the closed form of the active-site cap, which is expected to encapsulate the nucleotide and slow its release — this mechanism was confirmed in stopped-flow studies. Finally, modelling studies that used the allosteric site as bait to identify endogenous metabolite allosteres predicted that 7-DH, one of two immediate precursors of cholesterol, would bind and inhibit SULT2B1b turnover at a physiologically relevant concentration, and the other, 24-DH, would not — these predictions were experimentally born out. 7-DH and 24-DH derive from separate metabolic pathways, suggesting that sterol biosynthesis and functionalization (i.e., sulfonation) are coordinated.
Supplementary Material
Acknowledgments
Supported by the National Institutes of Health Grant GM127144*
Abbreviations
- Cho
cholesterol
- DTNB
5,5′-dithiobis(2-nitrobenzoic acid)
- DTT
dithiothreitol
- EDTA
ethylenediaminetetraacetic acid
- 1-HP
1-hydroxypyrene
- IPTG
isopropyl-thio-β-D-galactopyranoside
- PAP
3′- phosphoadenosine 5′-phosphate
- PAPS
3′-phosphoadenosine 5′-phosphosulfate
- PMSF
phenylmethylsulfonyl fluoride
- SULT
sulfotransferase
- TCE
2,2,2-trichloroethanol
- Quc
quercetin
Footnotes
Supporting Information Available:
Supporting information includes three figures and two tables. The figures: 1) Line-Width versus [quercetin] plots for all quercetin protons; 2) initial-rate studies of SULT2B1b mutants; and 3) an amino-acid sequence alignment of SULT1A1, SULT2A1, SULT2B1a, and SULT2B1b. The tables: 1) subcloning primers used to construct SULT expression plasmids; and 2) the top 10 highest-affinity SULT2B1b inhibitors obtained from in-silico screening of the Human Metabolome Database.
Bibliography
- 1.Mesiano S, and Jaffe RB (1997) Developmental and functional biology of the primate fetal adrenal cortex., Endocr Rev 18, 378–403. [DOI] [PubMed] [Google Scholar]
- 2.Li L, and Falany CN (2007) Elevated hepatic SULT1E1 activity in mouse models of cystic fibrosis alters the regulation of estrogen responsive proteins, J Cyst Fibros 6, 23–30. [DOI] [PubMed] [Google Scholar]
- 3.Cook IT, Duniac-Dmuchowski Z, Kocarek TA, Runge-Morris M, and Falany CN (2009) 24-Hydroxycholesterol Sulfation by Human Cytosolic Sulfotransferases: Formation of Monosulfates and Disulfates, Molecular Modeling, Sulfatase Sensitivity and Inhibition of LXR Activation, Drug Metab Dispos 37, 2069–2078. [DOI] [PMC free article] [PubMed] [Google Scholar]
- 4.Bai Q, Xu L, Kakiyama G, Runge-Morris MA, Hylemon PB, Yin L, Pandak WM, and Ren S (2011) Sulfation of 25-hydroxycholesterol by SULT2B1b decreases cellular lipids via the LXR/SREBP-1c signaling pathway in human aortic endothelial cells., Atherosclerosis 214, 350–356. [DOI] [PMC free article] [PubMed] [Google Scholar]
- 5.Sidharthan NP, Minchin RF, and Butcher NJ (2013) Cytosolic sulfotransferase 1A3 is induced by dopamine and protects neuronal cells from dopamine toxicity: role of D1 receptor-N-methyl-D-aspartate receptor coupling, J Biol Chem 288, 34364–34374. [DOI] [PMC free article] [PubMed] [Google Scholar]
- 6.Kuchel O, Hausser C, Buu NT, and Tenneson S (1985) CSF sulfoconjugated catecholamines in man: their relationship with plasma catecholamines, J Neural Transm 62, 91–97. [DOI] [PubMed] [Google Scholar]
- 7.Cook I, Wang T, Wang W, Kopp F, Wu P, and Leyh TS (2016) Controlling Sulfuryl-Transfer Biology, Cell Chem Biol 23, 579–586. [DOI] [PMC free article] [PubMed] [Google Scholar]
- 8.Chen F, Knecht K, Birzin E, Fisher J, Wilkinson H, Mojena M, Moreno CT, Schmidt A, Harada S, Freedman LP, and Reszka AA (2005) Direct agonist/antagonist functions of dehydroepiandrosterone, Endocrinology 146, 4568–4576. [DOI] [PubMed] [Google Scholar]
- 9.Brzozowski AM, Pike AC, Dauter Z, Hubbard RE, Bonn T, Engström O, Ohman L, Greene GL, Gustafsson JA, and Carlquist M (1997) Molecular basis of agonism and antagonism in the oestrogen receptor., Nature 389, 753–758. [DOI] [PubMed] [Google Scholar]
- 10.Han YH, Busler D, Hong Y, Tian Y, Chen C, and Rodrigues AD (2010) Transporter studies with the 3-O-sulfate conjugate of 17alpha-ethinylestradiol: assessment of human kidney drug transporters., Drug Metab Dispos 38, 1064–1071. [DOI] [PubMed] [Google Scholar]
- 11.Cook I, Wang T, and Leyh TS (2019) Isoform-specific therapeutic control of sulfonation in humans, Biochem Pharmacol 159, 25–31. [DOI] [PMC free article] [PubMed] [Google Scholar]
- 12.Glatt H, Boeing H, Engelke CE, Ma L, Kuhlow A, Pabel U, Pomplun D, Teubner W, and Meinl W (2001) Human cytosolic sulphotransferases: genetics, characteristics, toxicological aspects., Mutat Res 482, 27–40. [DOI] [PubMed] [Google Scholar]
- 13.Vickman RE, Crist SA, Kerian K, Eberlin L, Cooks RG, Burcham GN, Buhman KK, Hu CD, Mesecar AD, Cheng L, and Ratliff TL (2016) Cholesterol Sulfonation Enzyme, SULT2B1b, Modulates AR and Cell Growth Properties in Prostate Cancer, Mol Cancer Res 14, 776–786. [DOI] [PMC free article] [PubMed] [Google Scholar]
- 14.Chen W, Zhou H, Ye L, and Zhan B (2016) Overexpression of SULT2B1b Promotes Angiogenesis in Human Gastric Cancer, Cell Physiol Biochem 38, 1040–1054. [DOI] [PubMed] [Google Scholar]
- 15.Dumas NA, He D, Frost AR, and Falany CN (2008) Sulfotransferase 2B1b in human breast: differences in subcellular localization in African American and Caucasian women., J Steroid Biochem Mol Biol 111, 171–177. [DOI] [PMC free article] [PubMed] [Google Scholar]
- 16.He D, Meloche CA, Dumas NA, Frost AR, and Falany CN (2004) Different subcellular localization of sulphotransferase 2B1b in human placenta and prostate., Biochem J 379, 533–540. [DOI] [PMC free article] [PubMed] [Google Scholar]
- 17.Heinz L, Kim GJ, Marrakchi S, Christiansen J, Turki H, Rauschendorf MA, Lathrop M, Hausser I, Zimmer AD, and Fischer J (2017) Mutations in SULT2B1 Cause Autosomal-Recessive Congenital Ichthyosis in Humans, Am J Hum Genet 100, 926–939. [DOI] [PMC free article] [PubMed] [Google Scholar]
- 18.Bai Q, Zhang X, Xu L, Kakiyama G, Heuman D, Sanyal A, Pandak WM, Yin L, Xie W, and Ren S (2012) Oxysterol sulfation by cytosolic sulfotransferase suppresses liver X receptor/sterol regulatory element binding protein-1c signaling pathway and reduces serum and hepatic lipids in mouse models of nonalcoholic fatty liver disease, Metabolism 61, 836–845. [DOI] [PMC free article] [PubMed] [Google Scholar]
- 19.Cook I, Cacace M, Wang T, Darrah K, Deiters A, and Leyh TS (2021) Small-molecule control of neurotransmitter sulfonation, J Biol Chem 296, 100094. [DOI] [PMC free article] [PubMed] [Google Scholar]
- 20.Cook I, Wang T, and Leyh TS (2017) Tetrahydrobiopterin regulates monoamine neurotransmitter sulfonation, Proc Natl Acad Sci U S A 114, E5317–E5324. [DOI] [PMC free article] [PubMed] [Google Scholar]
- 21.Wang T, Cook I, and Leyh TS (2017) The NSAID allosteric site of human cytosolic sulfotransferases, J Biol Chem 292, 20305–20312. [DOI] [PMC free article] [PubMed] [Google Scholar]
- 22.Cook I, Wang T, Girvin M, and Leyh TS (2016) The structure of the catechin-binding site of human sulfotransferase 1A1, Proc Natl Acad Sci U S A 113, 14312–14317. [DOI] [PMC free article] [PubMed] [Google Scholar]
- 23.Zeelen FJ (1994) Steroid total synthesis, Nat Prod Rep 11, 607–612. [DOI] [PubMed] [Google Scholar]
- 24.Hu L, Yang GZ, Zhang Y, Feng D, Zhai YX, Gong H, Qi CY, Fu H, Ye MM, Cai QP, and Gao CF (2015) Overexpression of SULT2B1b is an independent prognostic indicator and promotes cell growth and invasion in colorectal carcinoma, Lab Invest 95, 1005–1018. [DOI] [PMC free article] [PubMed] [Google Scholar]
- 25.Falany CN, He D, Dumas N, Frost AR, and Falany JL (2006) Human cytosolic sulfotransferase 2B1: isoform expression, tissue specificity and subcellular localization, J Steroid Biochem Mol Biol 102, 214–221. [DOI] [PMC free article] [PubMed] [Google Scholar]
- 26.Björkhem I, Lütjohann D, Breuer O, Sakinis A, and Wennmalm A (1997) Importance of a novel oxidative mechanism for elimination of brain cholesterol. Turnover of cholesterol and 24(S)-hydroxycholesterol in rat brain as measured with 18O2 techniques in vivo and in vitro., J Biol Chem 272, 30178–30184. [DOI] [PubMed] [Google Scholar]
- 27.Sodhi RK, and Singh N (2014) Liver X receptor agonist T0901317 reduces neuropathological changes and improves memory in mouse models of experimental dementia, Eur J Pharmacol 732, 50–59. [DOI] [PubMed] [Google Scholar]
- 28.Rebeck GW (2004) Cholesterol efflux as a critical component of Alzheimer’s disease pathogenesis, J Mol Neurosci 23, 219–224. [DOI] [PubMed] [Google Scholar]
- 29.Riddell DR, Zhou H, Comery TA, Kouranova E, Lo CF, Warwick HK, Ring RH, Kirksey Y, Aschmies S, Xu J, Kubek K, Hirst WD, Gonzales C, Chen Y, Murphy E, Leonard S, Vasylyev D, Oganesian A, Martone RL, Pangalos MN, Reinhart PH, and Jacobsen JS (2007) The LXR agonist TO901317 selectively lowers hippocampal Abeta42 and improves memory in the Tg2576 mouse model of Alzheimer’s disease, Mol Cell Neurosci 34, 621–628. [DOI] [PubMed] [Google Scholar]
- 30.Koldamova RP, Lefterov IM, Staufenbiel M, Wolfe D, Huang S, Glorioso JC, Walter M, Roth MG, and Lazo JS (2005) The liver X receptor ligand T0901317 decreases amyloid beta production in vitro and in a mouse model of Alzheimer’s disease, J Biol Chem 280, 4079–4088. [DOI] [PubMed] [Google Scholar]
- 31.Fuda H, Lee YC, Shimizu C, Javitt NB, and Strott CA (2002) Mutational analysis of human hydroxysteroid sulfotransferase SULT2B1 isoforms reveals that exon 1B of the SULT2B1 gene produces cholesterol sulfotransferase, whereas exon 1A yields pregnenolone sulfotransferase, J Biol Chem 277, 36161–36166. [DOI] [PubMed] [Google Scholar]
- 32.Meloche CA, and Falany CN (2001) Expression and characterization of the human 3 beta-hydroxysteroid sulfotransferases (SULT2B1a and SULT2B1b). J Steroid Biochem Mol Biol 77, 261–269. [DOI] [PubMed] [Google Scholar]
- 33.Wang T, Cook I, Falany CN, and Leyh TS (2014) Paradigms of sulfotransferase catalysis: the mechanism of SULT2A1, J Biol Chem 289, 26474–26480. [DOI] [PMC free article] [PubMed] [Google Scholar]
- 34.Sun M, and Leyh TS (2010) The human estrogen sulfotransferase: a half-site reactive enzyme, Biochemistry 49, 4779–4785. [DOI] [PMC free article] [PubMed] [Google Scholar]
- 35.Wang T, Cook I, and Leyh TS (2021) The molecular basis of OH-PCB estrogen receptor activation, J Biol Chem 296, 100353. [DOI] [PMC free article] [PubMed] [Google Scholar]
- 36.Darrah K, Wang T, Cook I, Cacace M, Deiters A, and Leyh TS (2019) Allosteres to regulate neurotransmitter sulfonation, J Biol Chem 294, 2293–2301. [DOI] [PMC free article] [PubMed] [Google Scholar]
- 37.Lee KA, Fuda H, Lee YC, Negishi M, Strott CA, and Pedersen LC (2003) Crystal structure of human cholesterol sulfotransferase (SULT2B1b) in the presence of pregnenolone and 3’-phosphoadenosine 5’-phosphate. Rationale for specificity differences between prototypical SULT2A1 and the SULT2BG1 isoforms, J Biol Chem 278, 44593–44599. [DOI] [PubMed] [Google Scholar]
- 38.Koziara KB, Stroet M, Malde AK, and Mark AE (2014) Testing and validation of the Automated Topology Builder (ATB) version 2.0: prediction of hydration free enthalpies, J Comput Aided Mol Des 28, 221–233. [DOI] [PubMed] [Google Scholar]
- 39.Malde AK, Zuo L, Breeze M, Stroet M, Poger D, Nair PC, Oostenbrink C, and Mark AE (2011) An Automated Force Field Topology Builder (ATB) and Repository: Version 1.0, J Chem Theory Comput 7, 4026–4037. [DOI] [PubMed] [Google Scholar]
- 40.Webb B, and Sali A (2016) Comparative Protein Structure Modeling Using MODELLER, Curr Protoc Bioinformatics 54, 5.6.1–5.6.37. [DOI] [PMC free article] [PubMed] [Google Scholar]
- 41.Eswar N, Webb B, Marti-Renom MA, Madhusudhan MS, Eramian D, Shen MY, Pieper U, and Sali A (2006) Comparative protein structure modeling using Modeller., Curr Protoc Bioinformatics Chapter 5, Unit 5.6. [DOI] [PMC free article] [PubMed] [Google Scholar]
- 42.Wishart DS, Feunang YD, Marcu A, Guo AC, Liang K, Vázquez-Fresno R, Sajed T, Johnson D, Li C, Karu N, Sayeeda Z, Lo E, Assempour N, Berjanskii M, Singhal S, Arndt D, Liang Y, Badran H, Grant J, Serra-Cayuela A, Liu Y, Mandal R, Neveu V, Pon A, Knox C, Wilson M, Manach C, and Scalbert A (2018) HMDB 4.0: the human metabolome database for 2018, Nucleic Acids Res 46, D608–D617. [DOI] [PMC free article] [PubMed] [Google Scholar]
- 43.Cook I, Wang T, Falany CN, and Leyh TS (2013) High accuracy in silico sulfotransferase models, J Biol Chem 288, 34494–34501. [DOI] [PMC free article] [PubMed] [Google Scholar]
- 44.Van Der Spoel D, Lindahl E, Hess B, Groenhof G, Mark AE, and Berendsen HJ (2005) GROMACS: fast, flexible, and free, J Comput Chem 26, 1701–1718. [DOI] [PubMed] [Google Scholar]
- 45.Pronk Sander, Szilárd Páll Roland Schulz, Larsson Per, Bjelkmar Pär, Apostolov Rossen, Shirts Michael R., Smith Jeremy C., Kasson Peter M., van der Spoel David, Hess Berk, and Lindahl E GROMACS 4.5: a high-throughput and highly parallel open source molecular simulation toolkit, Bioinformatics 29, 845–54. [DOI] [PMC free article] [PubMed] [Google Scholar]
- 46.Wang T, and Leyh TS (2012) Three-stage assembly of the cysteine synthase complex from Escherichia coli., J Biol Chem 287, 4360–4367. [DOI] [PMC free article] [PubMed] [Google Scholar]
- 47.Salman ED, Faye-Petersen O, and Falany CN (2011) Hydroxysteroid sulfotransferase 2B1b expression and localization in normal human brain, Horm Mol Biol Clin Investig 8, 445–454. [DOI] [PMC free article] [PubMed] [Google Scholar]
- 48.Furuta R, Yamagishi J, Kotani H, Sakamoto F, Fukui T, Matsui Y, Sohmura Y, Yamada M, Yoshimura T, Larsen CG, and et al. (1989) Production and characterization of recombinant human neutrophil chemotactic factor, J Biochem 106, 436–441. [DOI] [PubMed] [Google Scholar]
- 49.Gibson DG (2009) Enzymatic assembly of DNA molecules up to several hundred kilobases, Nat. Methods 6, 343–345. [DOI] [PubMed] [Google Scholar]
- 50.Man M, and Bryant RG (1974) Reactions of thiosulfate and sulfite ions with DTNB: interference in sulfhydryl group analysis, Anal Biochem 57, 429–431. [DOI] [PubMed] [Google Scholar]
- 51.Cleland WW (1979) Statistical analysis of enzyme kinetic data, Methods Enzymol 63, 103–138. [DOI] [PubMed] [Google Scholar]
- 52.Grant GA (2018) The many faces of partial inhibition: Revealing imposters with graphical analysis, Arch Biochem Biophys 653, 10–23. [DOI] [PubMed] [Google Scholar]
- 53.Delaglio F, Grzesiek S, Vuister GW, Zhu G, Pfeifer J, and Bax A (1995) NMRPipe: a multidimensional spectral processing system based on UNIX pipes, J Biomol NMR 6, 277–293. [DOI] [PubMed] [Google Scholar]
- 54.Solomon I (1955) Relaxation Processes in a System of Two Spins, Phys Rev. 99, 559–566. [Google Scholar]
- 55.Berendsen HJC, Vanderspoel D, and Vandrunen R (1995) Gromacs - a Message-Passing Parallel Molecular-Dynamics Implementation, Comput Phys Commun 91, 43–56. [Google Scholar]
- 56.Wishart DS, Jewison T, Guo AC, Wilson M, Knox C, Liu Y, Djoumbou Y, Mandal R, Aziat F, Dong E, Bouatra S, Sinelnikov I, Arndt D, Xia J, Liu P, Yallou F, Bjorndahl T, Perez-Pineiro R, Eisner R, Allen F, Neveu V, Greiner R, and Scalbert A (2013) HMDB 3.0--The Human Metabolome Database in 2013, Nucleic Acids Res 41, D801–807. [DOI] [PMC free article] [PubMed] [Google Scholar]
- 57.Wishart DS, Tzur D, Knox C, Eisner R, Guo AC, Young N, Cheng D, Jewell K, Arndt D, Sawhney S, Fung C, Nikolai L, Lewis M, Coutouly MA, Forsythe I, Tang P, Shrivastava S, Jeroncic K, Stothard P, Amegbey G, Block D, Hau DD, Wagner J, Miniaci J, Clements M, Gebremedhin M, Guo N, Zhang Y, Duggan GE, Macinnis GD, Weljie AM, Dowlatabadi R, Bamforth F, Clive D, Greiner R, Li L, Marrie T, Sykes BD, Vogel HJ, and Querengesser L (2007) HMDB: the Human Metabolome Database, Nucleic Acids Res 35, D521–526. [DOI] [PMC free article] [PubMed] [Google Scholar]
- 58.Verdonk ML, Cole JC, Hartshorn MJ, Murray CW, and Taylor RD (2003) Improved protein-ligand docking using GOLD, Proteins 52, 609–623. [DOI] [PubMed] [Google Scholar]
- 59.Ma B, Shou M, and Schrag ML (2003) Solvent effect on cDNA-expressed human sulfotransferase (SULT) activities in vitro, Drug Metab Dispos 31, 1300–1305. [DOI] [PubMed] [Google Scholar]
- 60.Battiste JL, and Wagner G (2000) Utilization of site-directed spin labeling and high-resolution heteronuclear nuclear magnetic resonance for global fold determination of large proteins with limited nuclear overhauser effect data, Biochemistry 39, 5355–5365. [DOI] [PubMed] [Google Scholar]
- 61.Wang T, Cook I, and Leyh TS (2016) Isozyme Specific Allosteric Regulation of Human Sulfotransferase 1A1, Biochemistry 55, 4036–4046. [DOI] [PMC free article] [PubMed] [Google Scholar]
- 62.Wang T, Cook I, and Leyh TS (2014) 3’-Phosphoadenosine 5’-phosphosulfate allosterically regulates sulfotransferase turnover, Biochemistry 53, 6893–6900. [DOI] [PMC free article] [PubMed] [Google Scholar]
- 63.Blanchard RL, Freimuth RR, Buck J, Weinshilboum RM, and Coughtrie MW (2004) A proposed nomenclature system for the cytosolic sulfotransferase (SULT) superfamily, Pharmacogenetics 14, 199–211. [DOI] [PubMed] [Google Scholar]
- 64.Meloche CA, and Falany CN (2001) Expression and characterization of the human 3 beta-hydroxysteroid sulfotransferases (SULT2B1a and SULT2B1b), J Steroid Biochem Mol Biol 77, 261–269. [DOI] [PubMed] [Google Scholar]
- 65.Prabhu AV, Luu W, Sharpe LJ, and Brown AJ (2016) Cholesterol-mediated Degradation of 7-Dehydrocholesterol Reductase Switches the Balance from Cholesterol to Vitamin D Synthesis, J Biol Chem 291, 8363–8373. [DOI] [PMC free article] [PubMed] [Google Scholar]
- 66.Rodríguez-Acebes S, de la Cueva P, Fernández-Hernando C, Ferruelo AJ, Lasunción MA, Rawson RB, Martínez-Botas J, and Gómez-Coronado D (2009) Desmosterol can replace cholesterol in sustaining cell proliferation and regulating the SREBP pathway in a sterol-Delta24-reductase-deficient cell line, Biochem J 420, 305–315. [DOI] [PMC free article] [PubMed] [Google Scholar]
- 67.Salman ED, He D, Runge-Morris M, Kocarek TA, and Falany CN (2011) Site-directed mutagenesis of human cytosolic sulfotransferase (SULT) 2B1b to phosphomimetic Ser348Asp results in an isoform with increased catalytic activity, J Steroid Biochem Mol Biol 127, 315–323. [DOI] [PMC free article] [PubMed] [Google Scholar]
- 68.Greathouse ST, Adkinson JM, Garza R, Gilstrap J, Miller NF, Eid SM, and Murphy RX (2015) Impact of Injury Mechanisms on Patterns and Management of Facial Fractures, J Craniofac Surg 26, 1529–1533. [DOI] [PubMed] [Google Scholar]
- 69.Axelson M, Angelin B, Hillebrant CG, Reihnér E, and Einarsson C (1998) The level of 7-dehydrocholesterol in plasma reflects the activity of 3-hydroxy-3-methylglutaryl coenzyme A reductase in the human liver, Biochim Biophys Acta 1394, 153–157. [DOI] [PubMed] [Google Scholar]
- 70.Axelson M (1991) Occurrence of isomeric dehydrocholesterols in human plasma, J Lipid Res 32, 1441–1448. [PubMed] [Google Scholar]
Associated Data
This section collects any data citations, data availability statements, or supplementary materials included in this article.