

Abstract
Amine-functionalized polymers (AFPs) are able to react with carbon dioxide (CO2) and are therefore useful in CO2 capture and sensing. To develop AFP-based CO2 sensors, it is critical to examine their electrical responses to CO2 over long periods of time, so that the device can be used consistently for measuring CO2 concentration. To this end, we synthesized poly(N-[3-(dimethylamino)propyl] methacrylamide) (pDMAPMAm) by free radical polymerization and tested its ability to behave as a CO2-responsive polymer in a transducer. The electrical response of this polymer to CO2 upon long exposure times was measured in both the aqueous and solid phases. Direct current resistance measurement tests on pDMAPMAm films printed along with the silver electrodes in the presence of CO2 at various concentrations reveal a two-region electrical response. Upon continuous exposure to different CO2 flow rates (at a constant pressure of 0.2 MPa), the resistance first decreased over time, reaching a minimum, followed by a gradual increase with further exposure to CO2. A similar trend is observed when CO2 is introduced to an aqueous solution of pDMAPMAm. The in situ monitoring of pH suggests that the change in resistance of pDMAPMAm can be attributed to the protonation of tertiary amine groups in the presence of CO2. This two-region response of pDMAPMAm is based on a proton-hopping mechanism and a change in the number of free amines when pDMAPMAm is exposed to various levels of CO2.
Introduction
Carbon dioxide (CO2) detectors are used in a variety of applications1 and are being explored with novel materials to suit a range of contexts including medical,2 air quality monitoring,3 marine and environmental,4 fire detection,5 and smart food packaging.6,7 Conventionally, CO2 is detected via fluorescence,8 gas chromatography,9 and infrared spectrometry.10 Although these detection methods are highly selective and sensitive, the instrumentation used is typically bulky, requires a large power supply during operation, and is relatively expensive,11 limiting their more widespread use in everyday applications, for example, in situ food monitoring.12 Thus, there is a demand for miniaturized, easy-to-implement, low-power, and inexpensive CO2 sensors.
To date, colorimetric13 and potentiometric7,14 techniques are among the most promising methods for CO2 detection. Although colorimetric CO2 indicators are simple, require low power, and are convenient to use, they are qualitative or, at best, semi-quantitative, and the color change observed is subjective.15 Potentiometric CO2 sensors are low-cost, have high selectivity, and can continuously monitor the concentration of the CO2 gas; however, they often operate at high temperatures (above 400 °C) and require connection to an external power source (e.g., a battery), hindering their potential for use in untethered applications.7
An alternative to the above methods is to employ a battery-less CO2-responsive polymer-based sensor. This type of sensor works based on the change in electrical properties (conductivity and dielectric permittivity) of a CO2-responsive polymer upon absorption and desorption of CO2 molecules by the polymer.16 The CO2 desorption can be initiated by purging with an inert gas such as nitrogen or by mild heating.17,18
Amidines,19,20 guanidines,21,22 and amines23,24 are commonly used as CO2-responsive functional groups in CO2-responsive polymers.25 Tertiary amines have many advantages over other CO2-responsive functional groups. For example, the synthesis of CO2-switchable polymers possessing tertiary amine groups is relatively simpler than those possessing amidine and guanidine groups.25 The CO2-responsivity of the polymers is due to the transition from an unprotonated to a protonated state when exposed to CO2 (and vice versa when CO2 is removed).25 The nature of this transition depends on the pKaH of the functional groups, where pKaH is the basicity of the polymer, essentially equivalent to the pKa of the protonated compound.26 Although a higher pKaH produces a higher degree of protonation (DOP), CO2 desorption occurs with more difficulty.25 For example, amidine is a weak base (pKaH = 5.4) with a low DOP,19 while guanidine is a super base (pKaH = 13.5) that is difficult to deprotonate.21 However, tertiary amine groups are moderate bases (pKaH = 6–7), resulting in good switchability (easy to protonate and have good reversibility) compared to amidine and guanidine groups.26 Of the many amine-functionalized polymers (AFPs), polyethyleneimine (PEI),27,28 poly(N,N-dimethylaminoethyl methacrylate) (pDMAEMA),29−31 and poly(N,N-diethylaminoethyl methacrylate) (pDEAEMA)30,32 have been explored for CO2 detection. For example, Han et al. recently reported a PEI-functionalized carbon nanotube thin-film sensor capable of CO2 detection at room temperature, which works based on the acid-base interaction between CO2 molecules and amine groups of PEI.27 In another example, microgels consisting of pDMAEMA/SiO2 and a shell of polyetheramine were used for adsorption and determination of CO2 at 25 °C under different pressures.29 Similarly, a random copolymer of DEAEMA and acrylamide acrylonitrile repeat units was used for sensing CO2 in aqueous solutions.33 It should be noted that certain AFPs, for example, pDMAEMA and pDEAEMA, can experience a low extent of protonation and the formation of products such as methacrylic acid as a consequence of monomer hydrolysis during polymerization due to their low pKaH values compared to amidines, all of which affect CO2-switchability.34 pDMAPMAm is a CO2-responsive polymer containing tertiary amine groups in the side chain which is readily prepared from the commercially available and inexpensive monomer, N-[3-(dimethylamino)propyl]-methacrylamide (DMAPMAm). DMAPMAm is hydrolytically stable as it possesses amide linkages rather than amidine or ester groups.34 Additionally, unlike primary and secondary amines, the tertiary amine group on DMAPMAm can only react with CO2 in the presence of water. It has been shown that in the presence of water, pDMAPMAm exhibits CO2 absorption properties and a higher pKaH value (8.8) compared to other available amine-based polymers such as pDMAEMA (pKaH = 7–7.5) and pDEAEMA (pKaH = 6.9–7.5). The higher pKaH value of pDMAPMAm suggests a relatively greater extent of protonation of pDMAPMAm when CO2 interacts with the side groups.34−36
For many applications, such as in food packaging, it is critical to know how the sensitivity of a sensor changes when it is exposed to CO2 concentration for an extended time. However, to the best of our knowledge, the effect of long-term exposure to CO2 on the electrical response of AFPs has been scarcely studied. Most work reporting CO2 detection by AFP-based sensors focuses on the short-term (5–20 min) impact of CO2 on the resistance of the polymer, suggesting that the conductivity of the sensing polymer increases in the presence of CO2.37 Doan et al., in contrast, reported an increase in the Direct current (DC) resistance of PEI films as the CO2 concentration increased from 400 to 104 ppm.38 Thus, there is a need to resolve this tension.
We hypothesized that continuous CO2 absorption affects the extent of protonation and, consequently, the electrical properties of the polymer over time. Herein, we aim to understand the mechanism and the effect of long-term exposure of pDMAPMAm to CO2 on a polymer’s electrical response. To this end, pDMAPMAm was synthesized by free radical polymerization, and CO2 sensors were then prepared via printing for DC resistance measurements. First, we characterized the polymer using size exclusion chromatography (SEC), Fourier-transform infrared spectroscopy (FTIR), proton nuclear magnetic resonance (1H NMR), and scanning electron microscopy (SEM). Then, the effect of CO2 exposure on the pH and resistance of pDMAPMAm solutions with various polymer concentrations was explored. Additionally, we studied the sensitivity of pDMAPMAm in the solid state toward different concentrations of CO2 via CO2-dependent DC resistance measurements. A quartz crystal microbalance (QCM) was used to demonstrate the CO2 absorption and desorption of pDMAPMAm in the solid state. Finally, the behavior of pDMAPMAm in the presence of CO2 was understood by comparing the results for the polymer in solution versus solid state.
Experimental Section
Materials
N-[3-(dimethyl amino) propyl] methacrylamide (DMAPMAm; 99%, Mw = 170.25 g mol–1), 2,2′-azobis(2-methylpropionitrile) (AIBN; 0.2 M in toluene, Mw = 164.21 g mol–1), ethanol (≥99.5%, Mw = 46.07 g mol–1), N,N-dimethylacetamide (DMAc; ≥ 99.9%, Mw = 87.12 g mol–1), chloroform-d1 (CDCl3, ≥99.8%, Mw = 120.38 g mol–1) l-(+)-lactic acid (80%, Mw = 90.08 g mol–1), and hydrochloric acid solution (HCl; 32 wt % in H2O, Mw = 36.46 g mol–1) were purchased from Sigma-Aldrich (Australia) and used as received. The silver ink and the universal transparent polyethylene terephthalate (PET) sheets were purchased from LEED-INK (China) and Amazon (Australia), respectively.
pDMAPMAm Polymerization
DMAPMAm (10 mL, 5.5 × 10⁻² mol), AIBN (1.4 mL, 5.5 × 10⁻⁴ mol), and ethanol (5 mL, 8.56 × 10⁻² mol) were added to a glass sealed vial (30 mL) and then incubated at 60 °C for 10 h to complete the free radical polymerization. The polymerization process was carried out under sealed conditions to avoid oxygen contamination. After polymerization, the synthesized polymer was transferred to glass Petri dishes and the remaining ethanol evaporated at room temperature before being stored for further usage. Of note, the same batch of the synthesized polymer was used for all the measurements.
Sensor Fabrication
The fabrication of sensors was carried out in two steps commencing with the three-dimensional (3D) printing of electrodes and polymer ink. A configuration of two silver electrodes (1 mm apart) was first printed on the PET substrates using a 3D-Bioplotter (EnvisionTEC, Germany) and these were then stored at 60 °C for 12 h to be cured for further usage. A 20 wt % solution of pDMAPMAm in ethanol was then 3D-printed along with the dried conductive silver electrodes and was kept at room temperature overnight to dry for the solid-state measurements. After drying, the real thickness of the polymer was measured to be 120 μm using a caliper. During printing, the polymer ink was extruded through an 840 μm nozzle at 15 °C, while silver ink was extruded through a 250 μm nozzle at 27 °C. Parameters such as the pressure and speed of printing were optimized at 0.2 bar and 13 mm s–1 for polymer ink and 3.2 bar and 10 mm s–1 for silver ink. To explore the homogeneity and uniformity of the printed polymer ink, SEM was performed on a JEOL JSM-IT500 system at magnifications of 500, 50, and 20 μm.
Polymer Characterization
SEC measurements were performed using a UFLC Shimadzu Prominence SEC system with two PhenogelTM columns (5 μm, 104, and 105 Å) running in dimethylacetamide using BHT/LiBr at 0.05 wt % as the eluent at a flow rate of 1 mL min–1 at 50 °C. The samples were prepared by dissolving pDMAPMAm polymer in the solvent (5–10 mg mL–1) and passing the resulting mixture through a 0.45 μm nylon filter before injection. FTIR was performed on a Thermo Scientific Nicolet 6700 spectrometer fitted with an ATR accessory (diamond crystal) at an angle of incidence of 90°. The data were collected at a resolution of 4 cm–1 over the range of 950–4000 cm–1 from the average of 32 scans. 1H NMR spectroscopy was performed on a Bruker 800 MHz spectrometer using CDCl3 as the solvent and 5 mm NMR tubes at room temperature.
Liquid-State Measurements
pDMAPMAm solutions of four different concentrations (0.1, 1, 5, and 10 wt %) in deionized water were prepared to study the resistance and pH change of the fabricated polymer in the presence of CO2 in the liquid phase. A container of the solution with an inlet for purging CO2 (using a glass dispersion tube), a pH meter, and a multimeter (KEITHLY 2450, Textronix, USA) for continuously recording the resistance were used. In the resistance measurement tests, a two-electrode configuration was used in which the electrodes were 1 mm apart. The protonation (%) was calculated based on the following equation
| 1 |
To obtain a better understanding of the pH-based response mechanism of polymer to CO2, different volumes of diluted lactic acid in deionized water (10 vol %) were slowly added to 1 wt % solution of pDMAPMAm in different sets of experiments. Then, the resistance and pH were measured after 2 h. Lactic acid has a high boiling point and was used in this study to protonate the polymer to different protonation levels. Comparing the electrical resistance of polymer solutions protonated by lactic acid with those exposed to CO2 could elucidate the role of protonation in the electrical response of the polymer during exposure to CO2.
Solid-State Measurements
To measure the resistance change of pDMAPMAm in response to CO2 in the solid state, we designed an in-house experimental setup, as shown in Figure S1. The setup consisted of a chamber (a 1 L food container), inlet and outlet ports for purging gas into the chamber, and a RH (relative humidity)-temperature data logger. The fabricated polymer-based sensors were placed inside the chamber containing water and kept in the incubator to humidify the samples (RH ≥ 95%, 37 °C, 2 h) as a pre-treatment step. Two mass flow controllers (FMA-2600A Upstream Valve, OMEGA, USA) were installed to control the CO2 gas flow rate and adjust the humidity of air in the chamber. Before the introduction of CO2 into the chamber, the air was purged for 2 h to maintain the humidity levels and stabilize the polymer’s resistance. Then, CO2 gas in different concentrations was purged into the test chamber for 2 h. The resistance of pDMAPMAm was continuously measured using a multimeter (KEITHLY 2450, Textronix, USA). The normalized change in electrical resistance (ΔR/R0) was continuously calculated using the equation: ΔR = R – R0, where R0 is the initial resistance immediately before the introduction of CO2 and R is the resistance of the sensors. Atomic force microscopy (AFM) and Kelvin probe force microscopy (KPFM) using a Pt–Ir coated tip were carried out on a Bruker Dimension ICON SPM to explore the surface morphology, roughness, and potential of the pDMAPMAm film before and after exposure to CO2. To study the CO2 absorption and desorption on pDMAPMAm in the solid state, a QCM200 (Stanford Research System, USA) was used to demonstrate the mass change at the surface of QCM electrodes. A thin film of pDMAPMAm 20 wt.% solution in ethanol was deposited on the crystals using drop-casting and, after drying, was exposed to the target gases (P = 2 bar). The mass flow rates of N2 and CO2 were optimized at 5 mL min–1 and the gas flow was passed through a water container to be humidified.
To better understand the impact of protonation level on CO2 detection, a separate experiment was carried out in which 1 M HCl (aq) was added to the pDMAPMAm ink. Then, the pre-treated polymer ink was cast on the interdigitated silver electrodes and dried. Afterward, the sensors were humidified (RH ≥ 95%, 37 °C, 2 h), and later the resistance was measured in the presence of CO2 using the aforementioned setup.
Results
Polymer Characterization
The molecular structure and reaction for the synthesis of pDMAPMAm is shown in Figure 1a. Several characterization methods were carried out that confirm the polymerization took place after 10 h at 60 °C in the presence of the initiator (AIBN). The graph showing the Mw distribution from SEC in Figure 1b demonstrates a unimodal peak for molecular weight (Mw) distribution of pDMAPMAm as follows: Mw = 185 kDa, Mn = 69 kDa, and PDI (Mw/Mn) = 2.7. The synthesized polymer was also characterized using FTIR, and its IR spectrum is shown in Figure 1c. The IR bands are attributed to −CH3 at 1373 cm–1, C–H at 1460 cm–1, N–H (amide II) at 1525 cm–1, C=O (amide I) at 1629 cm–1, −N(CH3)2 at 2777 cm–1, −N(CH3)2 at 2823 cm–1, C–H at 2864 cm–1, C–H at 2943 cm–1, and N–H at 3330 cm–1.39,40 The composition of the pDMAPMAm was analyzed using 1H NMR spectroscopy. As shown in Figure 1d, the characteristic peaks of pDMAPMAm were detected at 0.99–1.10 (a), 1.66 (d), 1.95 (b), 2.27 (f), 2.40 (e), and 3.20 ppm (c).40
Figure 1.

pDMAPMAm characterization. (a) Synthesis of pDMAPMAm via free radical polymerization. (b) Mw distribution from SEC, (c) FTIR, and (d) 1H NMR (800 MHz, CDCl3, 25 °C): δ 0.99–1.10 ppm (d, 3H), 1.66 ppm (s, 2H), 1.95 ppm (s, 2H), 2.27 (s, 6H), 2.40 ppm (s, 2H), and 3.20 ppm (s, 2H).
pDMAPMAm–CO2 Interaction in the Aqueous Phase
In the presence of water, CO2 protonates the amine groups in AFPs, whereby each protonated amine group becomes associated with an HCO3– (bicarbonate) or a CO32– (carbonate) counter ion.25,41 The kinetics of AFP–CO2 interaction such as pDMAPMAm have been extensively discussed by Jessop group. Alshamrani et al. describe how uncharged basic groups on the CO2-responsive species are converted from a neutral state to a protonated cationic state.26 Since the level of protonation in a polymeric matrix directly impacts its resistance,42 AFPs can potentially be used in the chemiresistive detection of CO2. In the case of pDMAPMAm, for instance, continuous exposure to CO2 in the presence of water gradually protonates the tertiary amine side groups of the polymer chains (Figure 2a). While the schematic in Figure 2a illustrates both HCO3– and CO32–, the dominant species is HCO3–. Since the pH is ≪10 after CO2 addition, the formation of carbonate is insignificant. However, if the amount of water is small relative to the amount of amine and the partial pressure is substantially lower than 0.1 MPa, the pH may be ≫10 and the dominant anion might be carbonate.26 To correlate the level of protonation of pDMAPMAm with its electrical resistance, the pH and DC resistance of aqueous solutions of pDMAPMAm at various concentrations (0, 0.1, 1, and 5 wt %) were monitored. These solutions were purged with CO2 at a constant rate of 45 mL min–1 and a pressure of 0.2 MPa over 60 min. The amount of CO2 dissolved in aqueous media follows Henry’s law, reaching equilibrium under constant temperature and pressure. The introduction of CO2 to the solutions of pDMAPMAm reduced the overall solution pH regardless of the concentration of the polymer in the solutions (Figure 2b). However, for the 5 wt % polymer solution, this reduction happened slowly due to the higher concentration of amine sites.
Figure 2.

pDMAPMAm–CO2 interaction. (a) Partially protonated state of pDMAPMAm illustrating both neutral and protonated amine sites. (b) pH versus time for different aqueous solutions of pDMAPMAm when exposed to CO2.
In this setup, the system midpoint is defined as the pH at which the number of moles of protonated and unprotonated switchable sites (i.e., tertiary amines) in the system is equal.43 With this definition, the solution pH in the absence of protonation (before the introduction of CO2) commences at a value above the system midpoint, decreasing in the presence of CO2 as polymer chains are gradually protonated, eventually falling below the midpoint. In contrast, the aqueous-phase midpoint is defined as the pH at which the number of moles of protonated and unprotonated switchable sites in the aqueous phase is equal. For switchable polymers that are completely dissolved in an aqueous solution, the system midpoint and the aqueous-phase midpoint are identical to each other and equal to the pKaH of the polymer.43 In the case of dissolved pDMAPMAm, the system midpoint is therefore 8.8.36 But the system midpoint of solid or incompletely dissolved pDMAPMAm is unknown and most likely depends on the water content.44
The conversion of neutral side groups to charged states is representative of the “range of operation” through which the tertiary amine groups in the side chains of the polymers interact with CO2 via the protonation process. Therefore, to have a wide range of operation, the starting pH of the system should be considerably higher than the system midpoint before CO2 exposure, with the pH going well below the system midpoint after the exposure to CO2.43 In other words, to have the maximum change in properties caused by an effective switching, the CO2-switchable polymer should ideally have a very low and very high DOP before and after exposure to CO2, respectively. While the system midpoint is determined by the nature of side groups (i.e., the pKaH), the starting pH is dictated by the concentration. As expected, the calculation of DOP (eq 1) for pDMAPMAm aqueous solutions with different polymer concentrations (Figure S2) shows that higher pDMAPMAm concentrations lead to lower DOPs prior to CO2 exposure, for example, 0.08% DOP in 5 wt % pDMAPMAm solution versus 21% DOP in 0.1 wt % pDMAPMAm solution.
The correlation between the DOP of pDMAPMAm and CO2 exposure was also reflected in the DC resistance of the pDMAPMAm solutions. Figure 3a presents an example of simultaneous measurements of DC resistance and pH for a 0.1 wt % solution, while CO2 was bubbled at a rate of 45 mL min–1 for 60 min (data for different concentrations of pDMAPMAm ranging between 0 and 5 wt % are shown in Figure S5b). In this example, the initial resistance was 0.8 MΩ, and the initial pH was 9.3. Once CO2 was introduced, the resistance sharply decreased for 4 min, reaching a minimum of 0.67 MΩ. The subsequent continuing protonation of pDMAPMAm led to an increase in the resistance from 0.67 to 1.06 MΩ. As expected, the pH of the solution decreased in the presence of CO2 over time. It should be highlighted that it was not experimentally feasible to record individual pH data points between 9.30 and 6.21 due to its sudden drop. Interestingly, the pH crossed over the system midpoint at around the same time as the DC resistance reached its minimum. The correlation between the DC resistance and DOP (calculated from eq 1) in Figures 3b and S3 further illustrates that the resistance approaches a minimum at around 50% protonation of the tertiary amine side groups of pDMAPMAm.
Figure 3.

Electrical response of pDMAPMAm solutions upon continuous exposure to CO2. (a) Resistance and pH of 0.1 wt % pDMAPMAm solution over time. (b) Correlation between resistance and DOP (calculated from eq 1) of 0.1 wt % pDMAPMAm solution.
The observed reduction in resistance immediately after the introduction of CO2 could have kinetic or thermodynamic origins. Given that CO2 was bubbled directly into the pDMAPMAm solution, the latter reason for the initial drop in resistance is more plausible. To better elucidate the nature of the correlation between pDMAPMAm’s electrical response and protonation, lactic acid was used instead of CO2 to protonate pDMAPMAm in a batch system. Lactic acid is a high boiling point acid that can similarly protonate pDMAPMAm. Yet, unlike bubbling the polymer solution with CO2, where the level of protonation rapidly increases with time, the slow addition of controlled quantities of lactic acid to the polymer solution allows for the elimination of the kinetic contribution. If the observed electrical resistance response of the polymer to CO2 (Figure 3b) was due to the protonation of the polymer chains, a similar trend must be seen when protonation is performed in batch experiments with another protonating reagent (i.e., lactic acid). Figure 4 shows the change in resistance and pH of pDMAPMAm solution (1 wt % in deionized water) versus the molar ratio of lactic acid per amine group (the resistance vs protonation is shown in Figure S4). Each data point in Figure 4 was obtained from a separate test where the exact volume of 10 vol % lactic acid solution was directly added to the pDMAPMAm (1 wt %) and the mixture was stirred for 2 h before resistance was measured. As can be seen in Figure 4, the resistance of the solution decreased from 0.5 to 0.25 MΩ by adding 175 μL of lactic acid (lactic acid/amine = 0.4 mol mol–1), with a further gradual increase as more lactic acid was added, reaching 0.4 MΩ at 350 μL of lactic acid (lactic acid/amine = 0.8 mol mol–1). In addition, the pH of the solution gradually decreased from 10.1 to 4.63 by the slow addition of lactic acid to reach the lactic acid/amine level of 0.8 mol mol–1, which confirmed the protonation of the pDMAPMAm in the presence of lactic acid. This behavior is perfectly aligned with the results obtained for the polymer solution bubbled with CO2 gas (Figure 3), suggesting that: (i) protonation defines the response of pDMAPMAm to CO2, and (ii) the impact of protonation on electrical resistance is not trivial.
Figure 4.

Resistance and pH of 1 wt % pDMAPMAm solution protonated with lactic acid 10 vol % vs the molar ratio of lactic acid to amine groups.
Considering the final resistance of pDMAPMAm solutions at 100% DOP, the normalized resistance change (ΔR/R0) can be calculated as a function of pDMAPMAm in the presence of CO2 (Figure 5). Here, the final DC resistance of solution after exposure to 45 mL min–1 CO2 for 60 min was used to calculate ΔR/R0, where R0 is the initial resistance of the solution. By increasing the pDMAPMAm concentration from 0 to 5 wt %, the total number of CO2-responsive moieties in the solution increased, demonstrating an increase in ΔR/R0 from 0.73 to 4.78. The raw data for the DOP and resistance of 0, 0.1, 1, and 5 wt % (pDMAPMAm: water) solutions over time can be seen in Figure S5.
Figure 5.

Change in normalized resistance as a function of polymer concentration in pDMAPMAm aqueous solutions.
Solid-State Sensing Mechanism Model
Given that the resistance of the pDMAPMAm solution changes with DOP, we were interested in investigating the behavior of pDMAPMAm in the solid state for the chemiresistive detection of CO2. For this purpose, pDMAPMAm ink (pDMAPMAm: ethanol 20 wt %) was printed between two silver electrodes. The SEM images were taken from the top and cross-sectional views to assess the uniformity and homogeneity of the 3D-printed pDMAPMAm films. As shown in Figure 6, the polymer (pDMAPMAm) is uniformly distributed on the substrate. Interestingly, the polymer surface is smoother than the printed silver electrodes. In addition, Figure 6c,d shows that the contact between the polymer and the silver electrodes was optimal for electrical measurements.
Figure 6.

SEM images of pDMAPMAm at different magnifications of 500, 50, and 20 μm from (a,b) top and (c,d) cross-sectional views.
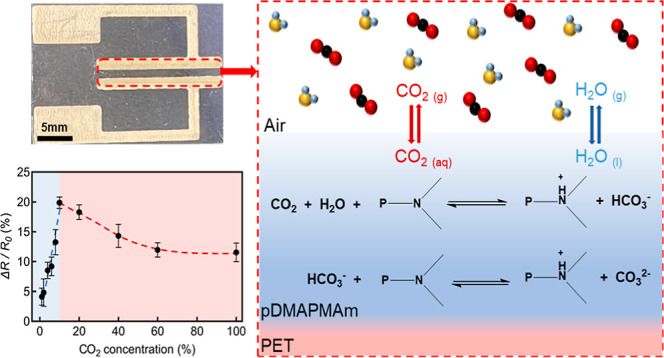
A sketch of the sensing mechanism for such a configuration is shown in Figure 7. When gaseous CO2 (CO2 (g)) is introduced to the surroundings of the CO2-responsive polymer, it dissolves in the water present in the polymer matrix to form solvated carbon dioxide, denoted as CO2 (aq). The interaction between the pDMAPMAm chains and solvated CO2 is based on acid-base chemistry. CO2 (g) first dissolves in water to form CO2 (aq), which then reacts with water to form carbonic acid, H2CO3 (aq). The carbonic acid then reacts with the tertiary amine groups of solvated pDMAPMAm generating one bicarbonate (HCO3–(aq)) ion per tertiary amine along the polymer chain
Figure 7.

Schematic of sensing mechanism. pDMAPMAm (P) was 3D-printed between two silver electrodes on a PET substrate. The CO2 and the humidity from air induce the protonation of the polymer, resulting in a change in electrical resistance between the two electrodes.
The resultant protonation of the polymer influences the electrical conductivity of the pDMAPMAm.
CO2 Responsivity of the Fabricated Polymer (Solid State)
The impact of humidity on the resistance of pDMAPMAm is shown in Figure 8. While a dry pDMAPMAm film was highly resistive (1280 MΩ), the resistance decreased significantly to 12 MΩ at RH = 65% before plateauing for values of RH > 70%. Therefore, all the experiments in the solid state were conducted at RH ≥ 95% to eliminate the impact of humidity on measurements.
Figure 8.

Relationship between the resistance of pDMAPMAm films and RH in the solid state.
The surface morphology and roughness of the pDMAPMAm film in the absence and presence of CO2 were determined by AFM measurements, as shown in Figure 9. The pDMAPMAm film has a smoother surface with an average roughness of 22.7 nm before CO2 exposure (Figure 9a,b) while after treatment with CO2, the average surface roughness increased to 50.8 nm (Figure 9c,d). The reason for this observation is the CO2-responsivity of pDMAPMAm where the tertiary amine sites of pDMAPMAm react with CO2 in the presence of water, leading to protonation of tertiary amine ligands. The positively charged amine groups repel each other and also facilitate the localized swelling of pDMAPMAm, resulting in a rougher surface.45
Figure 9.

AFM topography images and roughness profiles (along the yellow lines) of the pDMAPMAm film before (a,b) and after (c,d) exposure to CO2.
To explore the surface charge and the surface electrical properties of the pDMAPMAm film in response to CO2, surface potential distribution was obtained by KPFM. As shown in Figure 10, the contact potential difference (CPD) between the tip and the surface of the polymer was −600 and 640 mV before and after exposure to CO2, respectively. Therefore, the surface potential has increased by +1.24 V as a result of CO2 exposure. This increase is attributed to the accumulation of surface positive charges due to the protonation of pDMAPMAm’s tertiary amine sites.24,46
Figure 10.

KPFM images (left) and the surface potential distribution (right) of the pDMAPMAm film before and after exposure to CO2.
The electrical response of pDMAPMAm to extended exposure to CO2 in the solid state was studied. For this purpose, the 3D-printed system (a thin film of pDMAPMAm along with the conductive silver electrodes) was exposed to different concentrations of CO2 (Figure 11). Figure 11a shows an example of the electrical resistance of pDMAPMAm in the presence of 10 vol % CO2 (data for CO2 concentrations ranging between 1 and 100 vol % are shown in Figure S6a). Interestingly, continuous exposure of pDMAPMAm solid-state films to CO2 gas produced resistance responses similar to those of pDMAPMAm solutions (Figure 3), though much more slowly. Regardless of the concentration of CO2, the resistance of the pDMAPMAm films gradually decreased until a minimum was reached, beyond which resistance increased with time and eventually plateaued at ∼ 1.25 MΩ. As observed, pDMAPMAm behaves similar to other reported CO2-responsive polymers such as pDEAEMA47 and pDMAEMA48 in short-term exposure to CO2. This behavior, however, will change over a longer exposure time demonstrating the importance of this factor on the response of AFPs. The normalized resistance change of pDMAPMAm films (ΔR/R0) in response to various concentrations of CO2 (ranging from 1 to100 vol %) is shown in Figure 8b. ΔR is defined as Rf – R0, where Rf and R0 are the final resistance (long term) and initial value, respectively. Interestingly, two distinct behaviors were observed for low and high concentrations of CO2. For the concentrations below 10 vol % CO2 (region 1, R1), the normalized signal increased continuously to approach a peak of 20 vol %. However, at concentrations above 10 vol % CO2 (region 2, R2), there was a slight drop in normalized resistance. Figure S6b illustrates the correlation between the response time of the pDMAPMAm and the concentration of CO2.
Figure 11.

Electrical response of pDMAPMAm in the solid state upon continuous exposure to CO2 for an extended time. (a) Resistance change of the fabricated sensor on exposure to a concentration of 10 vol % CO2 versus time. The initial decrease in resistance of the pDMAPMAm films over time is denoted here as the “short-term” response of the sensor, while the overall response of the pDMAPMAm films over the whole course of experiments until the final plateau is reached is denoted as “long-term”. (b) Correlation between normalized resistance changes and the concentration of CO2. Region 1 (R1) and region 2 (R2) are defined for CO2 concentrations below and above 10 vol %, respectively. Experiments were repeated three times and standard deviations were estimated at each CO2 concentration.
Although it is known that tertiary amines deprotonate when exposed to N2 at ambient temperature,49 the reversibility of polymers occasionally necessitates higher temperatures.18,34,48 Darabi et al., for example, reported CO2-switchable latexes employing DMAPMAm, which could be redispersed by bubbling CO2 at room temperature, whereas the reverse reaction (the desorption of CO2 and the deprotonation of tertiary amine sites) needed a higher temperature (65 °C) in addition to the N2 bubbling.34 We explored the absorption and desorption of CO2 by pDMAPMAm in the solid state via the QCM.50 In this case, the deposited thin film of pDMAPMAm on the quartz sensor was placed in the QCM cell, and the target gases were passed through the system in three cycles at room temperature as follows: N2 with a flow of 5 mL min–1 for 45 min, CO2 with a flow of 5 mL min–1 for 1 h, and N2 with a flow of 5 mL min–1 for 45 min. As demonstrated in Figure 12a, the frequency values decreased considerably from −1.76 Hz to −51.74 Hz over time in the presence of CO2, confirming the mass increase of the specimen due to the CO2 absorption. Consequently, this CO2 absorption affects the extent of protonation and the electrical properties of the polymer (Figures 9, 10b, and S5). The mass increase resulting from CO2 absorption appears to be irreversible at room temperature as switching the gas back to N2 did not result in a significant increase in frequency values (Δf = 10 Hz). In the same direction, a reversibility test was carried out using our in-house experimental setup (Figure S1). The fabricated polymer-based sensor was placed inside the test chamber, and the target gases were passed through the system in three cycles at room temperature as follows: N2 with a flow of 10 mL min–1 for 1 h, CO2 with a flow of 10 mL min–1 for 1 h, and N2 with a flow of 10 mL min–1 for 1 h. The resistance change of pDMAPMAm is shown in Figure 12b. According to the reversibility result, the observed response of pDMAPMAm to CO2 is similar to those observed in Figures 11 and S6. However, no significant change in resistance was observed by switching the gas back to N2, showing the irreversibility of the CO2 absorption at room temperature confirming the result of QCM.
Figure 12.

Absorption of CO2 on pDMAPMAm. (a) Frequency change using QCM and (b) resistance change of pDMAPMAm on exposure to N2 and CO2.
Discussion
The electrical response of pDMAPMAm to extended exposure to CO2, both in aqueous solutions and solid state, is intriguing. The DC resistance first decreases until a minimum is reached, and then, with further exposure to CO2, the resistance increases, eventually flattening off at a maximum. The rate by which this process takes place depends strongly on the state of the polymer (Figures 3a and 11a). In the liquid phase, where the polymer chains are highly mobile and rapid phase transfer enhances the interaction between CO2 and amine side groups, the point of minimum resistance appears after 4 min. In contrast, for the solid-state samples, the minimum resistance occurs after 30 min. This trend is irrespective of CO2 concentration (the solid-state experiments) and pDMAPMAm concentration (aqueous solutions). This observation may have an important practical implication for the design of CO2 sensors based on AFPs. In a short-term experimental window, the resistance appears to decrease with CO2, while over extended periods, the resistance of the same system increases with further exposure to CO2. Furthermore, the relationship between the final resistance and CO2 concentration is curious. While at all CO2 concentrations that were evaluated (1–100 vol %), the resistance of pDMAPMAm films exceeded their initial resistance after 2 h of exposure, the amplitude by which this increase occurred followed different trends depending on the concentration of CO2 (Figure 11b). The peak (maximum) that appeared in the normalized resistance change of pDMAPMAm films as a function of CO2 concentration (Figure 11b) suggests that there may be two competing mechanisms at work. The downward to the upward shift in going from short term to long term in response to CO2 can be described by proton hopping, the dominant conductivity mechanism in polymers. For example, Lanssegues et al.51 and Iwase et al.52 reported that PEI can behave as a solid proton conductor even under anhydrous conditions due to proton hopping. The conductivity of AFPs (e.g., PEI) is highly dependent on the level of protonation and the pKaH of the protonated species present in the matrix. Sakurai et al. used branched PEI as a model AFP with all three forms of amine side groups (i.e., primary, secondary, and tertiary).53 They found a complex trend in the conductivity of PEI when phosphoric acid was used for protonation: by increasing the level of protonation, the conductivity first increases, then decreases, and again increases, revealing three distinct “zones” (Figure 13a). The initial increase in conductivity (Figure 13a, zone 1) is related to a gradual increase in the ratio of protonated to unprotonated amines. In this zone, the level of protonation is still very low, with the limited protonated amines still providing suitable sites for proton exchange with their neighboring unprotonated amines. Thus, as the number of protonated sites increases with DOP, so does the conductivity. By further increasing the level of protonation, however, at some point the number of protonated amines considerably exceeds that of unprotonated amines, limiting the possibility of proton hopping. After this stage, conductivity decreases with protonation until all remaining unprotonated amine groups are protonated (Figure 13a, zone 2). Yet again, conductivity is increased by the addition of more protonating species (phosphoric acid in Sakurai’s work) because of proton transfer between unprotonated and protonated solvated acid molecules (Figure 13a, zone 3). In the present study, this process takes place between [H2CO3 (aq) + CO2(aq)] molecules (pKaH = 6.4) and HCO3– anions (pKaH = 10.2). Of note, HCO3– is the dominant anionic species in the pH range from ∼6 to ∼10 (Figure 13b), providing suitable sites for proton exchange with H2CO3 and CO2. Further addition of CO2 to the system results in the saturation of [H2CO3(aq) + CO2(aq)] (the proton source), leading to an increase in conductivity (or continuous decrease in resistance). The practical translation of these two competing processes led to the appearance of the peak in resistance as a function of CO2 concentration.
Figure 13.

(a) Schematic representation of conductivity as a function of protonating acid concentration. The graph was reproduced from data presented in ref (53). (b) schematic representation of concentrations of CO2, H2CO3, HCO3–, and CO32– over pH 0 to 14. Note that solvated CO2 is in equilibrium with H2CO3.
The impact of protonation on the response of pDMAPMAm to CO2 exposure was further investigated by first pre-treating pDMAPMAm ink with dilute HCl. The ink was then cast between silver electrodes and, after drying, the film was placed in a humidified chamber (RH ≥ 95%), and CO2 gas was introduced. Unlike the usual response of pDMAPMAm films to CO2 gas over time in which resistance first decreased and then increased (Figure 11a), the DC resistance of partially protonated films simply continued to rise (no downward “trough” was observed) (Figures 14 and S7). This behavior resembles the second part of the untreated pDMAPMAm film’s response to CO2, suggesting that the initial reduction in resistance originates from the initial protonation of the pDMAPMAm chains at the early stages of protonation.
Figure 14.

Resistance of a pDMAPMAm film pre-treated with HCl. CO2 was introduced (RH ≥ 95%) at time = 0.
Conclusions
In this study, pDMAPMAm decorated with tertiary amine side groups and a pKaH higher than most reported CO2-switchable polymers is synthesized by free radical polymerization to explore its electrical response to CO2 in both aqueous and solid phases. The high pKaH value of the polymer guarantees that pDMAPMAm is protonated in the presence of CO2 over a wide pH range. It is found that the DC resistance of pDMAPMAm in both the aqueous and solid phases is impacted by the level of humidity, CO2 concentration in the surrounding environment, and duration of exposure to CO2. In the liquid phase, the key factor is the concentration of pDMAPMAm. Unlike most CO2-responsive sensors whose resistance decreases over time, in this study, the DC resistance of pDMAPMAm demonstrates an interesting and unique behavior in both the aqueous and solid phases. The resistance of pDMAPMAm decreased during the early stages of exposure to CO2 and then increased over time in both phases; however, this behavior change occurs much more slowly in the solid state compared to the aqueous phase. The change in resistance versus CO2 concentration is first positive and then negative, suggesting the presence of two competing mechanisms: an increase in resistance due to over-protonation of amine groups on the polymer and a reduction in resistance due to the saturation of the system with H2CO3. This study, for the first time, provides a better understanding of the electrical response of pDMAPMAm as a model CO2-responsive polymer to extended exposure to CO2. Our results show that the electrical behavior of pDMAPMAm is a function of the DOP. At a low DOP (<50%), where the amine side groups are largely unprotonated, the resistance decreases as the number of protonated amines increases. Yet, when the protonated amine side groups dominate in the system, proton hopping between protonated and unprotonated amine groups is disrupted, leading to a gradual increase in resistance. The time-dependent response of this polymer may not be a concern for the applications such as CO2 capture; however, tuning the structure of this polymer to have a polymeric system with a robust electrical response is critical to enabling reliable CO2 sensing over a wide range of concentrations.
Acknowledgments
The authors acknowledge the financial support provided by the Australian Research Council (ARC Linkage Project LP180100309) and the Centre for Advanced Food Engineering (CAFE) at the University of Sydney. The authors thank Karen Hakobyan and Ronil J. Rath for their assistance in, respectively, SEC and QCM analysis. F.O. acknowledges the financial support by the School of Chemical and Biomolecular Engineering at the University of Sydney for his F.H. Loxton Postdoctoral Research Fellowship.
Glossary
Abbreviations
- 1H NMR
proton nuclear magnetic resonance
- AFM
atomic force microscopy
- AFPs
amine-functionalized polymers
- AIBN
2,2′-azobis(2-methylpropionitrile)
- CPD
contact potential difference
- DC
direct current
- DMAc
N,N-dimethylacetamide
- DOP
degree of protonation
- FTIR
Fourier-transform infrared spectroscopy
- HCl
hydrochloric acid
- KPFM
Kelvin probe force microscopy
- Mw
molecular weight
- pDEAEMA
poly(N,N-diethylaminoethyl methacrylate)
- pDMAEMA
poly(N,N-dimethylaminoethyl methacrylate)
- pDMAPMAm
poly(N-[3-(dimethylamino)propyl] methacrylamide)
- PEI
polyethyleneimine
- PET
polyethylene terephthalate
- QCM
quartz crystal microbalance
- RH
relative humidity
- SEC
size exclusion chromatography
- SEM
scanning electron microscopy
Supporting Information Available
The Supporting Information is available free of charge at https://pubs.acs.org/doi/10.1021/acsomega.2c00914.
Experimental setup, protonation of polymer solution in the presence of CO2, resistance of polymer solution as a function of pH and protonation, and electrical response of polymer films to CO2 (PDF)
The authors declare no competing financial interest.
Supplementary Material
References
- a Molina A.; Escobar-Barrios V.; Oliva J. A review on hybrid and flexible CO2 gas sensors. Synth. Met. 2020, 270, 116602. 10.1016/j.synthmet.2020.116602. [DOI] [Google Scholar]; b Dervieux E.; Théron M.; Uhring W. Carbon Dioxide Sensing—Biomedical Applications to Human Subjects. Sensors 2021, 22, 188. 10.3390/s22010188. [DOI] [PMC free article] [PubMed] [Google Scholar]; c Zhou X.; Lee S.; Xu Z.; Yoon J. Recent progress on the development of chemosensors for gases. Chem. Rev. 2015, 115, 7944–8000. 10.1021/cr500567r. [DOI] [PubMed] [Google Scholar]; d Neethirajan S.; Jayas D. S.; Sadistap S. Carbon Dioxide (CO2) Sensors for the Agri-food Industry-A Review. Food Bioprocess Technol. 2009, 2, 115–121. 10.1007/s11947-008-0154-y. [DOI] [Google Scholar]
- a Singh O. P.; Howe T. A.; Malarvili M. Real-time human respiration carbon dioxide measurement device for cardiorespiratory assessment. J. Breath Res. 2018, 12, 026003. 10.1088/1752-7163/aa8dbd. [DOI] [PubMed] [Google Scholar]; b Nasiri N.; Clarke C. Nanostructured chemiresistive gas sensors for medical applications. Sensors 2019, 19, 462. 10.3390/s19030462. [DOI] [PMC free article] [PubMed] [Google Scholar]
- a Jiang C.; Masood M. K.; Soh Y. C.; Li H. Indoor occupancy estimation from carbon dioxide concentration. Energy Build. 2016, 131, 132–141. 10.1016/j.enbuild.2016.09.002. [DOI] [Google Scholar]; b Wang H.; Vagin S. I.; Rieger B.; Meldrum A. An Ultrasensitive Fluorescent Paper-Based CO2 Sensor. ACS Appl. Mater. Interfaces 2020, 12, 20507–20513. 10.1021/acsami.0c03405. [DOI] [PubMed] [Google Scholar]
- a Neurauter G.; Klimant I.; Wolfbeis O. S. Fiber-optic microsensor for high resolution pCO 2 sensing in marine environment. Fresenius. J. Anal. Chem. 2000, 366, 481–487. 10.1007/s002160050097. [DOI] [PubMed] [Google Scholar]; b Fritzsche E.; Gruber P.; Schutting S.; Fischer J. P.; Strobl M.; Müller J. D.; Borisov S. M.; Klimant I. Highly sensitive poisoning-resistant optical carbon dioxide sensors for environmental monitoring. Anal. Methods 2017, 9, 55–65. 10.1039/c6ay02949c. [DOI] [Google Scholar]
- Chen S.-J.; Hovde D. C.; Peterson K. A.; Marshall A. W. Fire detection using smoke and gas sensors. Fire Saf. J. 2007, 42, 507–515. 10.1016/j.firesaf.2007.01.006. [DOI] [Google Scholar]
- Soltani Firouz M.; Mohi-Alden K.; Omid M. A critical review on intelligent and active packaging in the food industry: Research and development. Food Res. Int. 2021, 141, 110113. 10.1016/j.foodres.2021.110113. [DOI] [PubMed] [Google Scholar]
- Puligundla P.; Jung J.; Ko S. Carbon dioxide sensors for intelligent food packaging applications. Food Control 2012, 25, 328–333. 10.1016/j.foodcont.2011.10.043. [DOI] [Google Scholar]
- a Yu L.; Li Y.; Yu H.; Zhang K.; Wang X.; Chen X.; Yue J.; Huo T.; Ge H.; Alamry K. A.; Marwani H. M.; Wang S. A fluorescence probe for highly selective and sensitive detection of gaseous ozone based on excited-state intramolecular proton transfer mechanism. Sens. Actuators, B 2018, 266, 717–723. 10.1016/j.snb.2018.03.175. [DOI] [Google Scholar]; b Yan Y.; Zhang K.; Yu H.; Zhu H.; Sun M.; Hayat T.; Alsaedi A.; Wang S. Sensitive detection of sulfide based on the self-assembly of fluorescent silver nanoclusters on the surface of silica nanospheres. Talanta 2017, 174, 387–393. 10.1016/j.talanta.2017.06.027. [DOI] [PubMed] [Google Scholar]; c Sun M.; Yu H.; Zhang K.; Wang S.; Hayat T.; Alsaedi A.; Huang D. Palladacycle based fluorescence turn-on probe for sensitive detection of carbon monoxide. ACS Sens. 2018, 3, 285–289. 10.1021/acssensors.7b00835. [DOI] [PubMed] [Google Scholar]
- Bulbul A.; Kim H. A bubble-based microfluidic gas sensor for gas chromatographs. Lab Chip 2015, 15, 94–104. 10.1039/c4lc00892h. [DOI] [PubMed] [Google Scholar]
- Dinh T.-V.; Choi I.-Y.; Son Y.-S.; Kim J.-C. A review on non-dispersive infrared gas sensors: Improvement of sensor detection limit and interference correction. Sens. Actuators, B 2016, 231, 529–538. 10.1016/j.snb.2016.03.040. [DOI] [Google Scholar]
- Borchert N. B.; Kerry J. P.; Papkovsky D. B. A CO2 sensor based on Pt-porphyrin dye and FRET scheme for food packaging applications. Sens. Actuators, B 2013, 176, 157–165. 10.1016/j.snb.2012.09.043. [DOI] [Google Scholar]
- Zhai X.; Li Z.; Shi J.; Huang X.; Sun Z.; Zhang D.; Zou X.; Sun Y.; Zhang J.; Holmes M.; Gong Y.; Povey M.; Wang S. A colorimetric hydrogen sulfide sensor based on gellan gum-silver nanoparticles bionanocomposite for monitoring of meat spoilage in intelligent packaging. Food Chem. 2019, 290, 135–143. 10.1016/j.foodchem.2019.03.138. [DOI] [PubMed] [Google Scholar]
- a Zhang Y.; Lim L.-T. Colorimetric array indicator for NH3 and CO2 detection. Sens. Actuators, B 2018, 255, 3216–3226. 10.1016/j.snb.2017.09.148. [DOI] [Google Scholar]; b Rukchon C.; Nopwinyuwong A.; Trevanich S.; Jinkarn T.; Suppakul P. Development of a food spoilage indicator for monitoring freshness of skinless chicken breast. Talanta 2014, 130, 547–554. 10.1016/j.talanta.2014.07.048. [DOI] [PubMed] [Google Scholar]; c Nopwinyuwong A.; Trevanich S.; Suppakul P. Development of a novel colorimetric indicator label for monitoring freshness of intermediate-moisture dessert spoilage. Talanta 2010, 81, 1126–1132. 10.1016/j.talanta.2010.02.008. [DOI] [PubMed] [Google Scholar]; d Perez de Vargas-Sansalvador I. M.; Erenas M. M.; Diamond D.; Quilty B.; Capitan-Vallvey L. F. Water based-ionic liquid carbon dioxide sensor for applications in the food industry. Sens. Actuators, B 2017, 253, 302–309. 10.1016/j.snb.2017.06.047. [DOI] [Google Scholar]
- Hong H. S.; Kim J. W.; Jung S. J.; Park C. O. Thick Film Planar CO2 Sensors Based on Na β-Alumina Solid Electrolyte. J. Electroceram. 2005, 15, 151–157. 10.1007/s10832-005-2192-4. [DOI] [Google Scholar]
- Dincer C.; Bruch R.; Costa-Rama E.; Fernández-Abedul M. T.; Merkoçi A.; Manz A.; Urban G. A.; Güder F. Disposable sensors in diagnostics, food, and environmental monitoring. Adv. Mater. 2019, 31, 1806739. 10.1002/adma.201806739. [DOI] [PubMed] [Google Scholar]
- Zerger A.; Viscarra Rossel R. A.; Swain D. L.; Wark T.; Handcock R. N.; Doerr V. A. J.; Bishop-Hurley G. J.; Doerr E. D.; Gibbons P. G.; Lobsey C. Environmental sensor networks for vegetation, animal and soil sciences. Int. J. Appl. Earth Obs. Geoinf. 2010, 12, 303–316. 10.1016/j.jag.2010.05.001. [DOI] [Google Scholar]
- a Zhang Q.; Yu G.; Wang W.-J.; Li B.-G.; Zhu S. Preparation of CO2/N2-Triggered Reversibly Coagulatable and Redispersible Polyacrylate Latexes by Emulsion Polymerization Using a Polymeric Surfactant. Macromol. Rapid Commun. 2012, 33, 916–921. 10.1002/marc.201200033. [DOI] [PubMed] [Google Scholar]; b Lin S.; Theato P. CO2 -Responsive Polymers. Macromol. Rapid Commun. 2013, 34, 1118–1133. 10.1002/marc.201300288. [DOI] [PubMed] [Google Scholar]
- Pinaud J.; Kowal E.; Cunningham M.; Jessop P. 2-(Diethyl)aminoethyl Methacrylate as a CO2-Switchable Comonomer for the Preparation of Readily Coagulated and Redispersed Polymer Latexes. ACS Macro Lett. 2012, 1, 1103–1107. 10.1021/mz3003215. [DOI] [PubMed] [Google Scholar]
- Yan Q.; Zhou R.; Fu C.; Zhang H.; Yin Y.; Yuan J. CO2-Responsive Polymeric Vesicles that Breathe. Angew. Chem., Int. Ed. 2011, 50, 4923–4927. 10.1002/anie.201100708. [DOI] [PubMed] [Google Scholar]
- Guo Z.; Feng Y.; Wang Y.; Wang J.; Wu Y.; Zhang Y. A novel smart polymer responsive to CO2. Chem. Commun. 2011, 47, 9348–9350. 10.1039/c1cc12388b. [DOI] [PubMed] [Google Scholar]
- Quek J. Y.; Davis T. P.; Lowe A. B. Amidine functionality as a stimulus-responsive building block. Chem. Soc. Rev. 2013, 42, 7326–7334. 10.1039/c3cs60065c. [DOI] [PubMed] [Google Scholar]
- Quek J. Y.; Roth P. J.; Evans R. A.; Davis T. P.; Lowe A. B. Reversible addition-fragmentation chain transfer synthesis of amidine-based, CO2-responsive homo and AB diblock (Co)polymers comprised of histamine and their gas-triggered self-assembly in water. J. Polym. Sci., Part A: Polym. Chem. 2013, 51, 394–404. 10.1002/pola.26397. [DOI] [Google Scholar]
- Liu H.; Zhao Y.; Dreiss C. A.; Feng Y. CO2-switchable multi-compartment micelles with segregated corona. Soft Matter 2014, 10, 6387–6391. 10.1039/c4sm01207k. [DOI] [PubMed] [Google Scholar]
- Yan Q.; Zhao Y. CO2-Stimulated Diversiform Deformations of Polymer Assemblies. J. Am. Chem. Soc. 2013, 135, 16300–16303. 10.1021/ja408655n. [DOI] [PubMed] [Google Scholar]
- Liu H.; Lin S.; Feng Y.; Theato P. CO2-responsive polymer materials. Polym. Chem. 2017, 8, 12–23. 10.1039/C6PY01101B. [DOI] [Google Scholar]
- Alshamrani A. K.; Vanderveen J. R.; Jessop P. G. A guide to the selection of switchable functional groups for CO2-switchable compounds. Phys. Chem. Chem. Phys. 2016, 18, 19276–19288. 10.1039/c6cp03302d. [DOI] [PubMed] [Google Scholar]
- Han M.; Jung S.; Lee Y.; Jung D.; Kong S. H. PEI-Functionalized Carbon Nanotube Thin Film Sensor for CO2 Gas Detection at Room Temperature. Micromachines 2021, 12, 1053. 10.3390/mi12091053. [DOI] [PMC free article] [PubMed] [Google Scholar]
- Kainz J.; Werz P. D. L.; Troll C.; Rieger B. Temperature and CO2 responsive polyethylenimine for highly efficient carbon dioxide release. RSC Adv. 2015, 5, 9556–9560. 10.1039/c4ra13710h. [DOI] [Google Scholar]
- Yao D.; Li T.; Zheng Y.; Zhang Z. Fabrication of a functional microgel-based hybrid nanofluid and its application in CO2 gas adsorption. React. Funct. Polym. 2019, 136, 131–137. 10.1016/j.reactfunctpolym.2018.12.025. [DOI] [Google Scholar]
- Han D.; Tong X.; Boissière O.; Zhao Y. General Strategy for Making CO2-Switchable Polymers. ACS Macro Lett. 2012, 1, 57–61. 10.1021/mz2000175. [DOI] [PubMed] [Google Scholar]
- Li X.-Y.; Xie R.; Luo F.; Jia Z.-H.; Shi K.; Ju X.-J.; Wang W.; Liu Z.; Chu L.-Y. CO2-responsive poly(N,N-dimethylaminoethyl methacrylate) hydrogels with fast responsive rate. J. Taiwan Inst. Chem. Eng. 2019, 94, 135–142. 10.1016/j.jtice.2018.03.006. [DOI] [Google Scholar]
- Wang Y.; Huo M.; Zeng M.; Liu L.; Ye Q.-Q.; Chen X.; Li D.; Peng L.; Yuan J.-Y. CO2-responsive Polymeric Fluorescent Sensor with Ultrafast Response. Chin. J. Polym. Sci. 2018, 36, 1321–1327. 10.1007/s10118-018-2167-y. [DOI] [Google Scholar]
- Guo S.; Zhang H.; Lu X.; Xiao H.; Zhao Y. Sensing carbon dioxide through a solution transparency change in gas-responsive polymers. J. Mater. Chem. C 2019, 7, 4049–4056. 10.1039/c8tc05346d. [DOI] [Google Scholar]
- Darabi A.; Glasing J.; Jessop P. G.; Cunningham M. F. Preparation of CO2-switchable latexes usingN-[3-(dimethylamino)propyl]-methacrylamide (DMAPMAm). J. Polym. Sci., Part A: Polym. Chem. 2017, 55, 1059–1066. 10.1002/pola.28466. [DOI] [Google Scholar]
- Fowler C. I.; Jessop P. G.; Cunningham M. F. Aryl amidine and tertiary amine switchable surfactants and their application in the emulsion polymerization of methyl methacrylate. Macromolecules 2012, 45, 2955–2962. 10.1021/ma2027484. [DOI] [Google Scholar]
- van de Wetering P.; Moret E. E.; Schuurmans-Nieuwenbroek N. M. E.; van Steenbergen M. J.; Hennink W. E. Structure–Activity Relationships of Water-Soluble Cationic Methacrylate/Methacrylamide Polymers for Nonviral Gene Delivery. Bioconjug. Chem. 1999, 10, 589–597. 10.1021/bc980148w. [DOI] [PubMed] [Google Scholar]
- a Jing X.; Lu H.; Wang B.; Huang Z. CO2-switchable polymeric vesicle-network structure transition induced by a hairpin-line molecular configuration conversion. J. Appl. Polym. Sci. 2017, 134, 44417. 10.1002/app.44417. [DOI] [Google Scholar]; b Liu H.; Yin H.; Feng Y. A CO2-switchable amidine monomer: synthesis and characterization. Des. Monomers Polym. 2017, 20, 363–367. 10.1080/15685551.2016.1270027. [DOI] [PMC free article] [PubMed] [Google Scholar]; c Jing X.-W.; Huang Z.-Y.; Lu H.-S.; Wang B.-G. CO2-sensitive amphiphilic triblock copolymer self-assembly morphology transition and accelerating drug release from polymeric vesicle. Chin. J. Polym. Sci. 2018, 36, 18–24. 10.1007/s10118-018-2008-z. [DOI] [Google Scholar]; d Wang L.; Zhao J.; Lu H.; Huang Z.; Wang B. Selective separation of aliphatic tertiary amines and aromatic amines by using CO2. Sep. Purif. Technol. 2020, 239, 116526. 10.1016/j.seppur.2020.116526. [DOI] [Google Scholar]
- Doan T. C. D.; Baggerman J.; Ramaneti R.; Tong H. D.; Marcelis A. T. M.; van Rijn C. J. M. Carbon dioxide detection with polyethylenimine blended with polyelectrolytes. Sens. Actuators, B 2014, 201, 452–459. 10.1016/j.snb.2014.05.023. [DOI] [Google Scholar]
- a Mishra R. K.; Ray A. R. Synthesis and characterization of poly{N-[3-(dimethylamino) propyl] methacrylamide-co-itaconic acid} hydrogels for drug delivery. J. Appl. Polym. Sci. 2011, 119, 3199–3206. 10.1002/app.32833. [DOI] [Google Scholar]; b Esselin N.; Portolan F.; Domloge N.; Clark R. B.; Musa O. M.; Pilard J.-F. Offline Monitoring of Hydroxyethyl Methacrylate and 3-Dimethylaminopropyl Methacrylamide Copolymerization: Correlation Between FTIR and GC Quantifications. Spectrosc. Lett. 2015, 48, 53–58. 10.1080/00387010.2013.856320. [DOI] [Google Scholar]
- Schmitz S.; Ritter H. Access to Poly{N -[3-(dimethylamino)propyl](meth)acrylamide} via Microwave-Assisted Synthesis and Control of LCST-Behavior in Water. Macromol. Rapid Commun. 2007, 28, 2080–2083. 10.1002/marc.200700378. [DOI] [Google Scholar]
- Cunningham M. F.; Jessop P. G. An introduction to the principles and fundamentals of CO2-switchable polymers and polymer colloids. Eur. Polym. J. 2016, 76, 208–215. 10.1016/j.eurpolymj.2016.01.036. [DOI] [Google Scholar]
- Darabi A.; Jessop P. G.; Cunningham M. F. CO2-responsive polymeric materials: synthesis, self-assembly, and functional applications. Chem. Soc. Rev. 2016, 45, 4391–4436. 10.1039/c5cs00873e. [DOI] [PubMed] [Google Scholar]
- Cunningham M. F.; Jessop P. G. Carbon dioxide-switchable polymers: where are the future opportunities?. Macromolecules 2019, 52, 6801–6816. 10.1021/acs.macromol.9b00914. [DOI] [Google Scholar]
- Jansen-van Vuuren R. D.; Drechsler Vilela G.; Ramezani M.; Gilbert P. H.; Watson D.; Mullins N.; Lucas A. K.; Giacomin A. J.; Cunningham M. F.; Jessop P. G. CO2-responsive superabsorbent hydrogels capable of> 90% dewatering when immersed in water. ACS Appl. Polym. Mater. 2021, 3, 2153–2165. 10.1021/acsapm.1c00136. [DOI] [Google Scholar]
- Che H.; Huo M.; Peng L.; Fang T.; Liu N.; Feng L.; Wei Y.; Yuan J. CO2-Responsive Nanofibrous Membranes with Switchable Oil/Water Wettability. Angew. Chem., Int. Ed. 2015, 127, 9062–9066. 10.1002/ange.201501034. [DOI] [PubMed] [Google Scholar]
- Garcia-Valdez O.; Brescacin T.; Arredondo J.; Bouchard J.; Jessop P. G.; Champagne P.; Cunningham M. F. Grafting CO2-responsive polymers from cellulose nanocrystals via nitroxide-mediated polymerisation. Polym. Chem. 2017, 8, 4124–4131. 10.1039/c7py00631d. [DOI] [Google Scholar]
- Liu H.; Guo Z.; He S.; Yin H.; Fei C.; Feng Y. CO2-driven vesicle to micelle regulation of amphiphilic copolymer: random versus block strategy. Polym. Chem. 2014, 5, 4756–4763. 10.1039/c4py00258j. [DOI] [Google Scholar]
- Yin H.; Bulteau A.-L.; Feng Y.; Billon L. CO2-Induced Tunable and Reversible Surface Wettability of Honeycomb Structured Porous Films for Cell Adhesion. Adv. Mater. Interfaces 2016, 3, 1500623. 10.1002/admi.201500623. [DOI] [Google Scholar]
- a Wang W.; Liu H.; Mu M.; Yin H.; Feng Y. CO2-induced reversible morphology transition from giant worms to polymersomes assembled from a block-random segmented copolymer. Polym. Chem. 2015, 6, 2900–2908. 10.1039/c5py00053j. [DOI] [Google Scholar]; b Zhang Y.; Feng Y.; Wang Y.; Li X. CO2-Switchable Viscoelastic Fluids Based on a Pseudogemini Surfactant. Langmuir 2013, 29, 4187–4192. 10.1021/la400051a. [DOI] [PubMed] [Google Scholar]
- a Tsionsky V.; Gileadi E. Use of the quartz crystal microbalance for the study of adsorption from the gas phase. Langmuir 1994, 10, 2830–2835. 10.1021/la00020a053. [DOI] [Google Scholar]; b Xie J.; Zhang L.; Xing H.; Bai P.; Liu B.; Wang C.; Lei K.; Wang H.; Peng S.; Yang S. Gas sensing of ordered and disordered structure SiO2 and their adsorption behavior based on Quartz Crystal Microbalance. Sens. Actuators, B 2020, 305, 127479. 10.1016/j.snb.2019.127479. [DOI] [Google Scholar]; c Berouaken M.; Yaddadene C.; Chebout K.; Ayat M.; Menari H.; Belaid S.; Gabouze N.. CO2 Gas Sensors Based on Hydrophilic Vanadium Oxide Thin Film Coated QCM. CO2 Gas Sensors Based on Hydrophilic Vanadium Oxide Thin Film Coated QCM. In ICREEC 2019; Springer, 2020, pp 633–638. 10.1007/978-981-15-5444-5_79 [DOI] [Google Scholar]
- Daniel M. F.; Desbat B.; Cruege F.; Trinquet O.; Lassegues J. C. Solid state protonic conductors: Poly(ethylene imine) sulfates and phosphates. Solid State Ionics 1988, 28-30, 637–641. 10.1016/s0167-2738(88)80116-4. [DOI] [Google Scholar]
- Tanaka R.; Yamamoto H.; Kawamura S.; Iwase T. Electrochim. Acta 1995, 40, 2421–2424. 10.1016/0013-4686(95)00207-u. [DOI] [Google Scholar]
- Tanaka R.; Yamamoto H.; Shono A.; Kubo K.; Sakurai M. Proton conducting behavior in non-crosslinked and crosslinked polyethylenimine with excess phosphoric acid. Electrochim. Acta 2000, 45, 1385–1389. 10.1016/s0013-4686(99)00347-3. [DOI] [Google Scholar]
Associated Data
This section collects any data citations, data availability statements, or supplementary materials included in this article.