

Abstract

Oxygen vacancy (VO) is a kind of primary point defect that extensively exists in semiconductor metal oxides (SMOs). Owing to some of its inherent qualities, an artificial manipulation of VO content in one material has evolved into a hot research field, which is deemed to be capable of modulating band structures and surface characteristics of SMOs. Specific to the gas-sensing area, VO engineering of sensing materials has become an effective means in enhancing sensor response and inducing light-enhanced sensing. In this work, a high-efficiency microwave hydrothermal treatment was utilized to prepare a VO-rich ZnO sample without additional reagents. The X-ray photoelectron spectroscopy test revealed a significant increase in VO proportion, which was from 9.21% in commercial ZnO to 36.27% in synthesized VO-rich ZnO possessing three-dimensional and air-permeable microstructures. The subsequent UV–vis–NIR absorption and photoluminescence spectroscopy indicated an extension absorption in the visible region and band gap reduction of VO-rich ZnO. It turned out that the VO-rich ZnO-based sensor exhibited a considerable response of 63% toward 1 ppm HCHO at room temperature (RT, 25 °C) under visible light irradiation. Particularly, the response/recovery time was only 32/20 s for 1 ppm HCHO and further shortened to 10/5 s for 10 ppm HCHO, which was an excellent performance and comparable to most sensors working at high temperatures. The results in this work strongly suggested the availability of VO engineering and also provided a meaningful candidate for researchers to develop high-performance RT sensors detecting volatile organic compounds.
1. Introduction
At the present time, room-temperature (RT) gas sensing is occupying an important position. Researchers have exploited varieties of fresh theories, techniques, and materials to accelerate the progress in this field. However, to the best of our knowledge, RT sensing concentrates more upon several target gases with intrinsically high activity, especially NO2,1−4 NH3,5−7 H2S,8−10 and so forth.
Comparatively speaking, even now, high-temperature sensing on almost all volatile organic compounds (VOCs) is still mainstream and ingrained. For example, Zhang et al.11 prepared hollow ZnO nanocages derived from ZIF-8, which exhibited a high response of 139.41 toward 100 ppm ethanol at 325 °C. Besides, it possessed an ultrashort response time (2.8 s) and low detection limit (25 ppb). Chang et al.12 synthesized 2D WO3 nanosheets by annealing inorganic fullerene-like WS2 nanoparticles at different temperatures. The optimal WO3 nanosheets, annealed at 500 °C, showed a response of 2.23 toward 0.17 ppm acetone at 300 °C, the response and recovery time being 6 and 10 s, respectively. Li et al.13 transformed bead-like WO3 fibers to hierarchical WO3/ZnWO4 1D composites with the introduction of ZIF-8 into the precursor solution. The resulting WO3/ZnWO4-5% composites displayed a response of 44.5 toward 5 ppm HCHO at 220 °C. Meanwhile, the composites exhibited a short response/recovery time (12/14 s) and excellent stability. As we can see, high temperature endows VOC sensing with excellent performance and undeniably plays an important role in this process.
In contrast, although having made some progress, performance indicators regarding RT sensing on VOCs are far from satisfactory. For example, Kuchi et al.14 developed a novel RT ethanol sensor based on PbS/SnS2 nanocomposites via a simple method. Although the optimal PbS/SnS2 (1:1)-based sensor showed good selectivity toward ethanol, the corresponding response was rather low, being 45.64–100.3% toward 60–1600 ppm ethanol. In particular, the sensor response and response/recovery time of PbS/SnS2 (1:1) toward 800 ppm ethanol were ∼90% and 128/69 s, respectively. Vishwakarma et al.15 applied CdS-doped TiO2 nanocomposites to RT acetone detection. However, an optimized 2 wt % CdS doping only made the composite show a response of 71% toward 5000 ppm acetone, the response/recovery time being 55/115 s. David et al.16 demonstrated a RT Ag/Bi2O3 nanocomposite-based toluene gas sensor which had a detection range of 10–100 ppm. To be specific, its response toward 50 ppm toluene was 89.21%, and the corresponding response/recovery time was ∼60/∼320 s. It serves to show that relevant research on RT sensing toward VOCs is in a fledging period and woefully inadequate, which is exactly the driving force for us to carry out targeted research.
Without the booster action of high temperature on activating reactions, light irradiation, particularly, ultraviolet (UV) and visible light, is the most effective alternative means known to exert a comparable character in inducing carrier separation and deepening the reaction level. For one semiconductor, it can be light-activated only if photon energy exceeds the band gap barrier, resulting in the generation of electron–hole pairs.17−19 For UV irradiation with short wavelengths (10–400 nm), high photon energy makes it capable of activating any semiconductors. In contrast, from the view of theoretical calculation, visible light (400–780 nm) can only activate finite semiconductors whose band gaps do not exceed 3.1 eV (400 nm).20 Despite the seeming superiority for UV irradiation, irreversible damage brought by high-energy UV photons on device durability and human health has long been questioned. In addition, UV irradiation accounts for less than 5% of all solar spectra,21 which is far less than visible light (>50%).
In the photoexcitation field, semiconductors can roughly be classified into two categories. SnO2 (∼3.6 eV),22 ZnO (∼3.37 eV),23,24 and TiO2 (∼3.2 eV)21,22 are usually identified as wide band gap semiconductors. Given that the ultimate activation band gap for visible light is, as abovementioned, 3.1 eV, wide band gap oxides listed above can only be activated through UV irradiation but show no photoresponse to visible light. Correspondingly, In2O3 (∼2.8 eV),25 WO3 (∼2.8 eV),26 CdS (∼2.4 eV),21,27 SnS2 (∼2.3 eV),28 α-Fe2O3 (∼2.1 eV),29,30 Co3O4 (∼2.1 eV),31,32 In2S3 (2∼3 eV),21,33 CdSe (∼1.7 eV),34−36 InP (∼1.35 eV),37,38 CuO (∼1.2 eV),39 MoS2 (∼1.2 eV),40 and PbS (∼0.41 eV)21,27,41 are generally regarded as narrow band gap semiconductors. Distinctly, narrow band gap oxides/sulfides can easily be activated by partial- or full-wave band of visible light. However, although narrow band gaps give rise to a better absorbance to visible light, the inevitably easier recombination of photogenerated electron/hole pairs results in low sensitivity and poor selectivity when such semiconductors are applied as gas-sensitive materials.42 In contrast, wide band gap semiconductors, including their composites, are more suitable to serve as candidates for photoexcitation-aided gas sensors. To make the most of solar energy, especially harmless visible spectra, researchers are inclined to moderately modify wide band gap semiconductors to extend their photoresponse range into the visible light region. In this process, metals,43−45 narrow band gap semiconductors,21,27,28,38,46−52 carbon-based materials,53−55 or others56,57 are extensively utilized, which act as the so-called “sensitizers”.21,27,35,37,38,45,50−53,56,57
VO has been widely recognized and practically utilized to modulate the electronic and surface properties of metal oxides,58−70 which effectively improves gas-sensing performances of chemiresistor-type sensors. There exist three basic consensuses for the roles played by VO in material behaviors. First, VO, possessing abundant localized electrons, generally acts as an electron donor59,60,62,65−67,69,70 and manipulates the carrier density (bulk resistance) of semiconductor materials,59,60,62 especially for n-type metal oxides. As interfacial defects, the electron-rich nature of oxygen vacancies will facilitate the adsorption of O2 molecules and increase the content of chemisorbed oxygen species.58−60,63−67 In addition, VO is also considered to serve as active sites for target gas adsorption.58−60,62,64−68,70 Second, VO can regulate band structures of semiconductor oxides and usually narrow their band gaps.58−63,67,69,70 Furthermore, band gaps can be continually diminished with increasing VO contents in oxides.62 A narrower band gap means lower energy is required for electron transition. Therefore, VO has also been applied to extend the photoexcitation range of wide band gap semiconductors to the visible spectrum.58−60,62,69,70 Compared to the abovementioned “sensitizers”, engineering (self-doping) of VO is deemed as the most straightforward and ideal way of expanding the excitation range of semiconductors without introducing impurities or changing their intrinsic structures.59,60,62,70 Third, VO can trap photoinduced electrons and prompt the separation of photogenerated electron/hole pairs.58,60,69,70 Through greatly extending the lifetime of activated carriers, VO favors the charge-transfer efficiency in bulk materials.58,60,67,69,70 Besides, the concomitance of isolated energy levels with VO promotes light absorption.60,62 In conclusion, VO engineering is highly conducive to generating outstanding visible light-catalyzed gas-sensing performance.
Inspired by the abovementioned discussion, in this work, taking ZnO with an intrinsic wide band gap as the basis material, microwave heating treatment was adopted to enrich its VO content. First, the band gap decrease and light absorption range expansion of the as-prepared ZnO sample were verified when taking commercial ZnO as a reference. Furthermore, with the aid of visible light irradiation, high-performance HCHO sensing at RT was achieved by VO-rich ZnO. The critical role of VO in this process was consolidated when making comparison with the sensing performance of commercial ZnO toward HCHO with or without visible light irradiation. Other light-activated RT HCHO sensing performance of VO-rich ZnO was then presented and discussed in detail.
2. Experimental Section
2.1. Materials
All experimental materials such as zinc hydroxide (Zn(OH)2), zinc acetate dihydrate (Zn(CH3COO)2·2H2O), sodium hydroxide (NaOH), and ethanol were of analytical grade or above and used as received without further purification. Commercial ZnO in this work referred to ZnO nanopowders purchased from Shanghai Aladdin Biochemical Technology Co., Ltd.
2.2. Synthesis of VO-Rich ZnO Nanorod Clusters
First, ZnO nanoseeds were obtained by adding NaOH ethanol solution into Zn(CH3COO)2·2H2O ethanol solution, which was vigorously stirred for 1 h at RT. Then, 2.0 g of ε-Zn(OH)2 and 0.3 g of the synthesized ZnO nanoseeds were added separately into 40 mL of deionized water. The obtained suspension was aged and kept under microwave heating at 80 °C for 5 min for the growth of Vo-rich ZnO nanorod clusters. The obtained samples were washed and dried at 60 °C overnight for subsequent tests.
2.3. Characterizations
The powder X-ray diffraction (XRD) characterization for phase identification was performed on a Rigaku D/max-2550 X-ray diffractometer with high-intensity Cu Kα (λ = 0.154 nm) radiation in the range of 5–90°. The field emission scanning electron microscopy (FESEM) characterization for morphological and microstructural evaluation was obtained on a ZEISS Gemini300 microscope operating at 15 kV. The transmission electron microscopy (TEM) and high-resolution TEM (HRTEM) characterizations for interfacial and crystallographic analysis were examined on a JEOL (JEM-2100F) microscope with an accelerating voltage of 200 kV. The X-ray photoelectron spectroscopy (XPS) characterization for chemical state recognition was conducted on an EscaLab Xi + photoelectron spectrometer. UV–vis–NIR diffuse reflectance spectra for band gap estimation were acquired on a PerkinElmer Lambda 950 UV–vis–NIR spectrophotometer. Photoluminescence (PL) spectra for defect level speculation were tested on a Hitachi F-7000 luminescence spectrometer using a Xe lamp with an excitation wavelength of 325 nm. The specific surface area of the sample was calculated through the Brunauer–Emmett–Teller (BET) equation based on the nitrogen adsorption isotherm, which was measured on a Micromeritics Gemini VII apparatus (surface area and porosity system) with prior degassing of the product under vacuum at 120 °C overnight.
2.4. Fabrication and Measurement of Gas Sensors
2.4.1. Sensor Fabrication and Its Structure Parameters
The batch of sensor devices adopted in this work was planar gas sensors integrated with interdigital electrodes, routinely applied in RT detection and manufactured via micro–nano machining technology. The device substrate (6*4*0.5 mm) was monocrystalline silicon wafer covered with a growing SiO2 dielectric layer (300 nm thick). On the substrate surface, interdigital electrodes (finger width 20 μm, finger gap 20 μm, finger length 1.5 mm, and finger pairs 25) were patterned by the photolithography technique, and chromium/gold (Cr/Au, 10 nm/100 nm-thick) electrodes were then deposited by RF sputtering and a lift-off process.
After the completion of planar sensor fabrication, the device surface was set about to be coated with the as-prepared sensing materials. A suspension of the sample was first prepared through a dispersion and ultrasound treatment of ZnO powders in absolute ethanol. The suspension was then spin-coated onto interdigital electrodes and dried at 80 °C overnight to obtain integrated sensors.
2.4.2. Measurement of Gas Sensors
Gas-sensing properties of ZnO samples were evaluated through a self-built gas-sensing test system under laboratory conditions (20% RH, RT).
-
a.
For the gas supply section, the construction of the dynamic test system was simulated, where a flowing target gas filled the whole gas piping. Gas sources, for example, HCHO, and the carrier gas, drying air, were stored in individual cylinders. Under the premise of ensuring a total flow constant (200 mL/min), diluted target gases with particular concentrations were obtained through accurately adjusting the flow rate ratio of two components via gas flowmeters.
-
b.
For the signal acquisition section, the planar device coated with sensitive materials was integrated with the sensor base installed in the test platform. The sensor reacted with target gases in an enclosed space sealed by a quartz cover. Synchronously, the sensor signal was recorded and transmitted back to the data collector terminal through a desktop multimeter (Keithley 2700). The panoramic and enlarged photographs of the signal acquisition section are provided in Figure S1.
-
c.
For the optical irradiation section, a xenon lamp with an ultraviolet cutoff filter was applied as the visible light source (λ > 420 nm, distance to sensor: 20 cm, and light intensity: 1.2 mW cm–2). The illumination power could be manually adjusted using an optical attenuator and measured by means of a digital optical power meter (THORLABS, PM16-120).
For the case of n-type sensing materials (e.g., ZnO) and reducing target gases (e.g., HCHO), the sensor response was defined as S (%) = (Ig – Ia)/Ia*100% (Ia and Ig were the dynamically stabilized currents of ZnO sensors in air and in HCHO (reaching equilibrium), respectively) in this work. In addition, the time when current change reached 90% during response and recovery processes was defined as the response time (τres) and recovery time (τrec), respectively.
3. Results and Discussion
3.1. Structural and Morphological Characteristics
The XRD test was conducted in the first place to confirm the substance composition and crystallinity of the as-prepared sample. As displayed in Figure 1, the recorded diffraction peaks of VO-rich ZnO could be well-assigned to the hexagonal phase of zinc oxide with lattice constants of a = 3.25 Å and c = 5.21 Å (standard JCPDS card no. 36-1451). Furthermore, all XRD diffraction peaks of VO-rich ZnO were sharp and strong, revealing its high crystallization degree. In addition, none of the diffraction peaks derived from other impurities could be detected, which indicated the high purity of the product.
Figure 1.

XRD patterns of the synthesized VO-rich ZnO.
The microscopic structure and morphology of one material can influence and even determine its performance in most cases. Therefore, having a good grasp of microstructures of the as-prepared ZnO product is of great significance to foresee and analyze the gas-sensing properties. As shown in Figure 2a,b, scanning electron microscopy (SEM) characterization made clear that the obtained VO-rich ZnO was composed of 3D clusters with inhomogenous shapes and sizes. Diameters of the observed agglomerations ranged from less than 5 μm to greater than 10 μm. In high-resolution Figures 2c,d and S2, individual clusters were cumulated by a mass of short ZnO nanorods with lengths of about 1 μm and diameters of about 35 nm. As we could see, ZnO nanorods arranged loosely side by side or intertwined each other in confusion, leaving much interspace inside the agglomerations. In Figure 2e, the VO-rich ZnO cluster in TEM view showed a similar appearance to that in SEM. What mattered more was that the typical ZnO cluster in Figure 2e took on a permeable structure, which was regarded as an important feature in accelerating gas diffusion and reaction. As shown in Figure S3, the 3D structure and air permeability of ZnO clusters were maintained after the sample was coated on the sensor substrate. At last, the HRTEM test presented lattice fringes on the edge of a single ZnO nanorod. A fringe spacing of 0.248 nm identified in Figure 2f coincided well with the parameter of the (101) lattice plane of hexagonal ZnO, which also corresponded to the strongest XRD peak in Figure 1.
Figure 2.

(a,b) Low-magnification SEM images of VO-rich ZnO. (c,d) SEM images of VO-rich ZnO with increasing magnifications. (e) TEM image of an isolated VO-rich ZnO nanorod cluster. (f) HRTEM image of the VO-rich ZnO crystal.
XPS analysis is one of the most effective methods to estimate the chemical states of the existing elements in one material. In Figure 3a, full-scan XPS spectra substantiated a series of constitutive orbit peaks of O and Zn elements situated at different binding energies, in addition to the fiducial C 1s peak at 284.8 eV. Markedly, sequential auger electron spectra (AES) of the Zn element with binding energies ranging from 400 to 700 eV were recorded. In high-resolution Figure 3b, two dominant peaks located at binding energies of 1021.18 and 1044.24 eV could be indexed to Zn 2p3/2 and 2p1/2,1 respectively. Conventionally, the core level spectrum of O 1s could be fitted into three Gaussian function segments, that is, OL, VO, and OC, using peak fit and deconvolution.21 Treated spectra in Figure 3c,d unambiguously displayed cases of oxygen species in commercial and VO-rich ZnO.
Figure 3.

(a) Wide scan spectra and (b) high-resolution Zn 2p spectrum of VO-rich ZnO. Deconvoluted O 1s core level spectra of (c) commercial ZnO and (d) VO-rich ZnO.
As is well known, oxygen species such as VO and OC are recognized as beneficial ingredients for enhancing gas-sensing performance of one material.25 For intuition, some calculated data are listed in Table 1. As we could see, proportions for three oxygen species in commercial ZnO differed greatly from those in VO-rich ZnO. Concretely speaking, the relative percentage of OL dropped sharply from 84.57% in commercial ZnO to 52.36% in VO-rich ZnO. Correspondingly, the total ratio of beneficial VO and OC components in VO-rich ZnO grew a lot. Particularly, the percentage of VO in VO-rich ZnO reached up to 36.27%, 3.94 times as high as that in commercial ZnO. The ultrahigh VO percentage was the conspicuous sign and name origin of VO-rich ZnO in this work and deemed to be strongly associated with the sensing mechanism concerning its follow-up visible light-activated HCHO gas-sensing performance.
Table 1. Fitting Results of O 1s XPS Spectra of Commercial ZnO and VO-Rich ZnOa.
| mater. | oxy. | B. E. (eV) | perc. (%) |
|---|---|---|---|
| commercial ZnO | OL (Zn–O) | 530.07 | 84.57 |
| VO (vacancy) | 531.32 | 9.21 | |
| OC (chemisorbed) | 532.11 | 6.22 | |
| VO-rich ZnO | OL (Zn–O) | 530.14 | 52.36 |
| VO (vacancy) | 531.86 | 36.27 | |
| OC (chemisorbed) | 533.39 | 11.37 |
Mater.: materials; oxy.: oxygen species; B. E.: binding energy; and perc.: relative percentage.
In consideration of the tridimensional and air-permeable microstructure exhibited in Figure 2c,e, the specific surface area of VO-rich ZnO deserved high expectation, the BET data of which are shown in Figure 4. The N2 adsorption–desorption isotherm curve represented a typical hysteresis loop from 0.8 to 1.0 (P/P0). According to the IUPAC classification, the isotherm in Figure 4 roughly belonged to the type III form and exhibited a type H3 hysteresis loop, which indicated that there did not exist an inherent and inerratic pore structure within VO-rich ZnO. Correspondingly, the so-called holes reflected by the loop type derived from the slit structure were formed by numerous interlaced nanorods in the clusters, consistent with the SEM and TEM observations hereinabove. The BET surface area of VO-rich ZnO was measured to be 69.722 m2/g, which was a high value and exactly conformed to our estimation. Besides, the high specific surface area of one material was advantageous to its gas-sensing performance.
Figure 4.

Nitrogen adsorption–desorption isotherm of VO-rich ZnO.
UV–vis absorption spectroscopy is a direct way to grasp the spectral absorption range of one material. As mentioned in the Introduction, theoretically, intrinsic ZnO cannot be excited by visible light. As exhibited in Figure 5a, the initial absorption edge of commercial ZnO (green curve) was located at 352 nm (UV region). After a sharp decline period, the terminational absorption edge of commercial ZnO was 426 nm (visible region). Visibly, the spectral absorption range of commercial ZnO included the visible region (400–426 nm), slightly different from pure theoretical analysis. However, the falling range of commercial ZnO spectra between 400 and 426 nm was noticed to be very weak and could be ignored compared to the overall decline from 352 to 426 nm. In a word, the absorption range of commercial ZnO concentrated in the UV region. Also, the manifested weak visible absorption of commercial ZnO implied its lower band gap due to the existing defects, compared to intrinsic ZnO. Differently, the absorption spectra of VO-rich ZnO possessed a much broader range, from 352 to 609 nm, than that of commercial ZnO. What was more, the absorption percentage within the visible region of VO-rich ZnO was improved a lot. Therefore, the spectral utilization range was successfully extended to the visible region through introducing rich VO to ZnO, indicating the availability of VO engineering in band structure modulation.
Figure 5.

(a) UV–vis–NIR absorption and (b) PL spectroscopy of commercial and VO-rich ZnO.
PL spectroscopy is an effective means to evaluate the band gap and defect level of semiconductor materials through analyzing the wavelength and intensity of emitting light. Conventionally, PL spectra could be divided into the UV region (<400 nm) and visible region (400–700 nm). The intrinsic UV emission originated from excitonic recombination of near-band edge (NBE) electrons (at conduction band bottom) and holes (at valence band top).71,72 In Figure 5b, commercial ZnO (green curve) displayed a sharp and narrow UV emission peak centered at 380 nm, through which we could calculate its band gap to be 3.26 eV,20,73 very approaching the 3.37 eV of intrinsic ZnO. Correspondingly, the NBE emission peak of VO-rich ZnO (red curve) became weaker and broader, also showing a red shift to a larger wavelength of 393 nm, which corresponded to a band gap of 3.16 eV. The estimation on band gaps of commercial and VO-rich ZnO here was consistent with the abovementioned UV–vis results. The larger decrease in band gap for VO-rich ZnO could be ascribed to the massive introduction of defect states.
The visible emission region, including but not limited to the peak position, area, and/or intensity, is intensively directed to the defect level in one material. Clearly, a broad band centered at 549 nm (green light) could be detected in PL spectra of VO-rich ZnO. As reported, green emission, attached to deep level emissions (DLE), was generated by the recombination of singly ionized oxygen vacancies (VO+) and photogenerated holes74,75 or derived from structural defects such as zinc and oxygen vacancies, interstitial zinc and oxygen, and so forth.73,76,77 Noteworthily, the peak area of green emission (549 nm) in VO-rich ZnO outdistanced that of UV emission (393 nm), fully indicating the high percentage of defects in it. In contrast, no visible region emissions could be recognized in commercial ZnO, proving that the defect level of commercial ZnO was very low.
3.2. Gas-Sensing Properties
The selectivity of VO-rich ZnO was first evaluated. As shown in Figure 6, under visible light irradiation, VO-rich ZnO exhibited responses toward some typical gases at RT. Distinctly, VO-rich ZnO showed the highest response to HCHO and the second-highest response to ethanol under the abovementioned conditions. The response resolution ratio (RHCHO/RH2S) of VO-rich ZnO could reach 18.5. In addition, the response ratio of HCHO to ethanol was still 2.7. From the abovementioned results, VO-rich ZnO was verified to show a tendentious response toward HCHO compared to interferential gases. As reported,78,79 photoinduced Zn+ in ZnO could activate C–H bonds through oriented adsorption and charge transfer, for example, in photocatalytic oxidation of methane.78 In view of the high activity of HCHO, VO-rich ZnO was inclined to react with C–H bonds in HCHO under visible light irradiation, which might explain its high selectivity to some extent.
Figure 6.
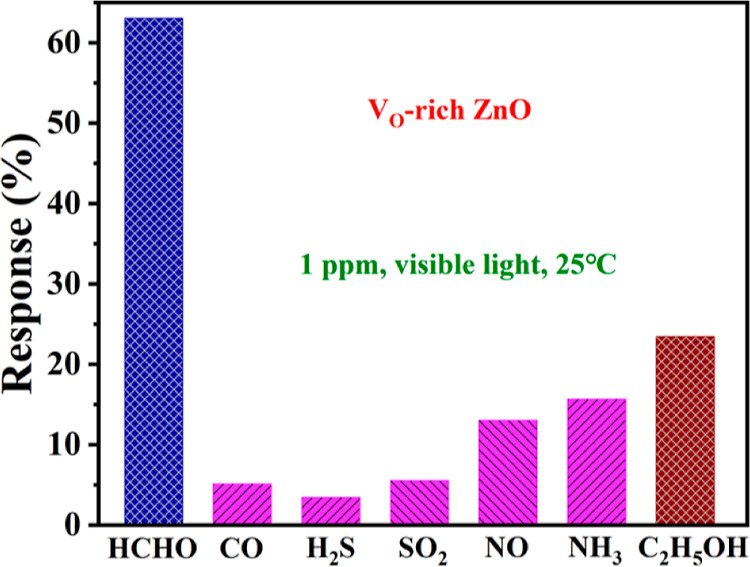
Responses of the sensor based on VO-rich ZnO toward 1 ppm HCHO, CO, H2S, SO2, NO, NH3, and C2H5OH under visible light irradiation at RT.
Sensing properties toward HCHO of sensors based on commercial and VO-rich ZnO at RT in the dark or under visible light irradiation were compared in detail. As shown in Figure 7a, there was no recognizable response toward HCHO for commercial ZnO at RT in the dark, which conformed to general requirements for high detection temperature in VOC sensing. Consistent with the results in Figure 5a, visible light irradiation could activate commercial ZnO in this work, although a response of just 2.3% toward 1 ppm HCHO at RT shown in Figure 7b was far from satisfactory. As we could see, commercial oxides, for example, ZnO, without any modification were unsuitable for detecting VOCs at RT as in most cases.
Figure 7.

Single-cycle response–recovery transient curves of the sensor based on (a,b) commercial ZnO and (c,d) VO-rich ZnO to 1 ppm HCHO at RT in the dark and under visible light irradiation.
In contrast, in Figure 7c, although still not high, a response of 5.75% toward 1 ppm HCHO for VO-rich ZnO in the dark was actually a huge step forward compared to the case of commercial ZnO in Figure 7a, which also proved the crucial role of rich VO in RT HCHO sensing. However, without both thermal and optical excitation, the response/recovery time of VO-rich ZnO when detecting HCHO was relatively long. Furthermore, as shown in Figure 7d, visible light irradiation fully activated the sensing potential of VO-rich ZnO. At RT, the response of VO-rich ZnO toward 1 ppm HCHO came up to 63% under visible light irradiation, 10.96 times as high as that in the dark. What was more, the response and recovery time of VO-rich ZnO toward 1 ppm HCHO was drastically shortened to 32 and 20 s, respectively, at RT. Frankly speaking, such a response and recovery speed at RT was comparable to many sensors of the same kind working at high temperature. Obviously, when comparing results in Figure 7b,d, the concurrence of rich VO and visible light irradiation generated an irrefutable effect on RT HCHO sensing parameters, confirming the feasibility of VO enrichment in promoting visible light-activated gas-sensing performance.
The response–concentration property of the VO-rich ZnO sensor was further examined under visible light irradiation at 25 °C. Figure 8a shows the obtained raw current data, proving the n-type nature of VO-rich ZnO. Displaying an analogical form with those in Figure 8a, curves in Figure 8b provided variation tendencies of sensor response, response/recovery time. Consistent with the vast majority of cases, responses of VO-rich ZnO grew gradually under HCHO with progressively elevated concentrations. In particular, response of VO-rich ZnO toward 0.5 ppm HCHO remained 32%, indicating its great potential in low-concentration HCHO sensing. Moreover, response and recovery speeds of VO-rich ZnO became increasingly faster toward HCHO from 0.5 to 10 ppm. For example, the response time of the VO-rich ZnO sensor toward 5 and 10 ppm HCHO under visible light irradiation at 25 °C was 14 and 10 s, respectively. Correspondingly, the recovery time in the abovementioned cases was, respectively, 12 and 5 s. In comparison with results in Figure 7d, both the response and recovery times were greatly shortened in higher concentration of HCHO, manifesting faster reaction/desorption rates with more target gas molecules in the surrounding environment.
Figure 8.

Dynamic response–recovery curves of (a) current and (b) response for the sensor based on VO-rich ZnO to 0.5–10 ppm HCHO at RT under visible light irradiation.
Generally speaking, moisture will generate a toxic effect on gas-sensitive reactions and suppress sensor response. When the operating temperature of a sensor is low, below the water boiling point (100 °C), for example, liquid water around the device will adhere to the surface of the sensitive material, covering local active sites and hindering considerable target gases from contact and reaction. When the device temperature is above 100 °C, gaseous water in the adjacent space will compete against target gases and squeeze the ratio of effective response. Conceivably, at RT, increasing moisture in the environment will exert a negative influence on the response of the VO-rich ZnO sensor toward HCHO. As depicted in Figure 9, responses of VO-rich ZnO toward HCHO showed a rapid downward trend when relative humidity of the testing environment was artificially elevated from 20 to 100%. Especially, the response of the sensor toward 1 ppm HCHO under 100% RH (visible light irradiation, RT) was only 26.5%, decaying by 58% compared to the initial value (63% under 20% RH). It served to show the consistent harmfulness of moisture to sensor response and helplessness of visible light irradiation in this process.
Figure 9.

Response–humidity relationship of the sensor based on VO-rich ZnO at RT under visible light irradiation.
At last, records of the successive and long-term response characteristics of VO-rich ZnO toward 1 ppm HCHO at RT under visible light irradiation are shown in Figure 10a,b. As shown in Figure 10a, response–recovery curves in four consecutive cycles maintained an absolute consistency, exhibiting the good repeatability of the sensor. More importantly, although the sampling responses lasting for 30 days in Figure 10b maintained a dynamic volatility, the ultimate response on the 30th day was almost equal to the initial value, proving the fine long-term stability of the sensor. In short, the abovementioned conclusions reflected the objectivity and reliability of the VO-rich ZnO sensor in data acquisition and possible practical application.
Figure 10.

(a) Repeatedly cyclic response–recovery curves and (b) long-term stability tests of the sensor based on VO-rich ZnO to 1 ppm HCHO at RT under visible light irradiation.
In addition, an all-around comparison between the sensing performance of the VO-rich ZnO sensor fabricated in this work and other recent reports about HCHO gas sensors13,22,39,70,80−86 is summarized in Table 2. The performance indexes showed by the VO-rich ZnO sensor were considered to be pre-eminent on the whole.
Table 2. Comparison of HCHO Sensing Performance in This Work and Those in Other Literature Studiesa.
| mater. | temp. (°C) | L. S. (nm) | conc. (ppm) | res. | τres./τrecov. (s) | Y. | ref. |
|---|---|---|---|---|---|---|---|
| WO3/ZnWO4 | 220 | 5 | 44.5b | 12/14 | 2019 | (13) | |
| Cu–Sn3O4 | 160 | 100 | 53b | 5/120 | 2020 | (80) | |
| Y–SnO2 | 180 | 25 | 9b | 8/10 | 2019 | (81) | |
| CuO | 30 | 80 | 32c | 301/705 | 2020 | (39) | |
| g-C3N4/ZnO | RT | 50 | 24.4b | 30/70 | 2020 | (82) | |
| Pt/MoO3 | RT | 200 | 39.3%d | 21.4/16.6 | 2019 | (83) | |
| PEDOT/PSS/MWCNTs-N2 | RT | 10 | 30.5%d | 45/7 | 2019 | (84) | |
| TiO2/SnO2 | RT | UV (365) | 10 | 20b | 20/56 | 2020 | (22) |
| ZnOx/ANS/rGO | RT | vis. (405) | 1 | 38%d | 47/39 | 2021 | (70) |
| HoFeO3 | RT | red (660) | 100 | 75%e | 719/248 | 2020 | (85) |
| MoS2/rGO | RT | vis. (>420) | 10 | 64%e | 17/98 | 2020 | (86) |
| VO-rich ZnO | RT | vis. (>420) | 1 | 63%f | 32/20 | this work | |
| 10 | 208%f | 10/5 |
Mater.: materials; temp.: operating temperature; L. S.: light source; conc.: gas concentration; res.: response; D. L.: detection limit; τres./τrecov.: response/recovery time; Y.: publication year; ref.: references; and vis.: visible light.
Ra/Rg.
Rg/Ra.
(Ra −Rg)/Ra*100%.
(Rg – Ra)/Ra*100%.
(Ig – Ia)/Ia*100%.
3.3. Gas-Sensing Mechanism
For SMO-type gas sensors, from the current point of view, the adsorption and subsequent reactions of target molecules on/with sensing materials give rise to the change in carrier concentration, which constitutes the source of device response. In essence, under the same working temperature and gas concentration, the adsorption and ultimate reaction quantity, respectively, dependent on the microstructure and OC content of sensing materials determines the response amplitude.
In this work, as shown in Figure 2a,b, a 3D microstructure of VO-rich ZnO was obtained after microwave treatment. In addition, the high specific surface area of VO-rich ZnO due to its 3D microstructure had been proved in the BET test in Figure 4. Therefore, under the same test conditions, the quantity of gas adsorption on VO-rich ZnO was considered to be far more than that on commercial ZnO powders, which should be one motivator, but not the decisive factor, of the emerged HCHO response in Figure 7c.
As shown in Table 1, OC content increased from 6.22% in commercial ZnO to 11.37% in VO-rich ZnO, which was partially derived from the contribution of rich VO. As described in the Introduction, VO can act as electron donors and active sites, which conduces to both gas (including oxygen) adsorption and redox reactions. It followed that the abundance of VO and resulting OC content increase promoted together the adsorption and reaction quantity, which constituted the main cause of the RT sensing of VO-rich ZnO toward HCHO in the dark.
Furthermore, a comparison between data in Figure 7a,b verified the consistent effectiveness of photoactivation in RT sensing. However, the response of commercial ZnO toward HCHO in Figure 7b was rather weak, even inferior to that of VO-rich ZnO in the dark, due to its deficient visible light absorptivity proven in Figure 5a. As it turned out, the single photoexcitation in Figure 7b or VO enrichment in Figure 7c was separately beneficial to the improvement of response/recovery properties or sensor response. As mentioned in the Introduction as well, VO promotes light absorption and traps photoinduced electrons, which serves as a proof of the synergistic effect of VO and light irradiation. Apparently, the performance in Figure 7d was not a simple superposition of those in Figure 7b,c, which substantiated the synergetic enhancement of VO and visible light irradiation to sensor response. In addition, VO extends the lifetime of light-activated carriers and favors the charge-transfer efficiency, which well explains the faster response/recovery speeds of the VO-rich ZnO sensor under visible light irradiation in Figure 7d compared to those in Figure 7b.
4. Conclusions
In conclusion, 3D VO-rich ZnO was successfully prepared through microwave heating. Through a series of characterizations, VO-rich ZnO consisting of nanorod clusters was proved to possess a gas-permeability structure and high BET surface area. What is more, the VO content in VO-rich ZnO was found to increase by a wide margin compared to that in commercial ZnO. It was just the rich VO in VO-rich ZnO that led to its superior RT HCHO sensing properties under visible light irradiation. At last, the mechanism of gas sensitivity enhancement was proposed based on the available data in this work. The role of VO in light-activated gas-sensing performance was consolidated in this work, which is of certain reference significance to related research.
Acknowledgments
This work was supported by the National Natural Science Foundation of China (61903159, 51802123, 62101225); Natural Science Foundation of Jiangsu Province (BK20190617, BK20180630); Natural Science Foundation of Yunnan Province (no. 202101AT070216) and the Fundamental Research Funds for the Central Universities (JUSRP11925).
Supporting Information Available
The Supporting Information is available free of charge at https://pubs.acs.org/doi/10.1021/acsomega.2c02613.
Photographs of the signal acquisition section; HRTEM image of a part of one single ZnO nanorod; and SEM image of ZnO nanorods coated on the sensor substrate (PDF)
The authors declare no competing financial interest.
Supplementary Material
References
- Liu Y.; Zhang J.; Li G.; Liu J.; Liang Q.; Wang H.; Zhu Y.; Gao J.; Lu H. In2O3-ZnO nanotubes for the sensitive and selective detection of ppb-level NO2 under UV irradiation at room temperature. Sens. Actuators, B 2022, 355, 131322. 10.1016/j.snb.2021.131322. [DOI] [Google Scholar]
- Yuan Z.; Zhao Q.; Xie C.; Liang J.; Duan X.; Duan Z.; Li S.; Jiang Y.; Tai H. Gold-loaded tellurium nanobelts gas sensor for ppt-level NO2 detection at room temperature. Sens. Actuators, B 2022, 355, 131300. 10.1016/j.snb.2021.131300. [DOI] [Google Scholar]
- Xu K.; Ha N.; Hu Y.; Ma Q.; Chen W.; Wen X.; Ou R.; Trinh V.; McConville C. F.; Zhang B. Y.; Ren G.; Ou J. Z. A room temperature all-optical sensor based on two-dimensional SnS2 for highly sensitive and reversible NO2 sensing. J. Hazard. Mater. 2022, 426, 127813. 10.1016/j.jhazmat.2021.127813. [DOI] [PubMed] [Google Scholar]
- Liang J.; Wu W.; Lou Q.; Wang K.; Xuan C. Room temperature NO2 sensing performance of Ag nanoparticles modified VO2 nanorods. J. Alloys Compd. 2021, 890, 161837. 10.1016/j.jallcom.2021.161837. [DOI] [Google Scholar]
- Sheikh A. D.; Vhanalakar V. K.; Katware A. S.; Pawar K. K.; Kulkarni S. K. Ultrasensitive organic-inorganic nanotube thin films of halogenated perovskites as room temperature ammonia sensors. J. Alloys Compd. 2022, 894, 162388. 10.1016/j.jallcom.2021.162388. [DOI] [Google Scholar]
- Wu Z.; Liang L.; Zhu S.; Guo Y.; Yao Y.; Yang Y.; Gu S.; Zhou Z. High Sensitivity of Ammonia Sensor through 2D Black Phosphorus/Polyaniline Nanocomposite. Nanomaterials 2021, 11, 3026. 10.3390/nano11113026. [DOI] [PMC free article] [PubMed] [Google Scholar]
- Kanaparthi S.; Singh S. G. MoS2 chemiresistive sensor array on paper patterned with toner lithography for simultaneous detection of NH3 and H2S gases. ACS Sustainable Chem. Eng. 2021, 9, 14735–14743. 10.1021/acssuschemeng.1c04166. [DOI] [Google Scholar]
- Zhang C.; Wu K.; Liao H.; Debliquy M. Room temperature WO3-Bi2WO6 sensors based on hierarchical microflowers for ppb-level H2S detection. Chem. Eng. J. 2022, 430, 132813. 10.1016/j.cej.2021.132813. [DOI] [Google Scholar]
- Tang J.; Wang H.; Wang X.; Xie C.; Zeng D. Prussian blue-derived hollow cubic α-Fe2O3 for highly sensitive room temperature detection of H2S. Sens. Actuators, B 2022, 351, 130954. 10.1016/j.snb.2021.130954. [DOI] [Google Scholar]
- Zhang W.; Wang X.; Fan Z.; Li J.; Liu G.; Lv X.; Li B.; Zhou J.; Xie E.; Zhang Z. Switching effect of p-CuO nanotube/n-In2S3 nanosheet heterostructures for high-performance room-temperature H2S sensing. ACS Appl. Mater. Interfaces 2021, 13, 52938–52949. 10.1021/acsami.1c15564. [DOI] [PubMed] [Google Scholar]
- Zhang X.; Lan W.; Xu J.; Luo Y.; Pan J.; Liao C.; Yang L.; Tan W.; Huang X. ZIF-8 derived hierarchical hollow ZnO nanocages with quantum dots for sensitive ethanol gas detection. Sens. Actuators, B 2019, 289, 144–152. 10.1016/j.snb.2019.03.090. [DOI] [Google Scholar]
- Chang X.; Xu S.; Liu S.; Wang N.; Sun S.; Zhu X.; Li J.; Ola O.; Zhu Y. Highly sensitive acetone sensor based on WO3 nanosheets derived from WS2 nanoparticles with inorganic fullerene-like structures. Sens. Actuators, B 2021, 343, 130135. 10.1016/j.snb.2021.130135. [DOI] [Google Scholar]
- Li H.; Chu S.; Ma Q.; Wang J.; Che Q.; Wang G.; Yang P. Hierarchical WO3/ZnWO4 1D fibrous heterostructures with tunable in-situ growth of WO3 nanoparticles on surface for efficient low concentration HCHO detection. Sens. Actuators, B 2019, 286, 564–574. 10.1016/j.snb.2019.02.028. [DOI] [Google Scholar]
- Salimi kuchi P.; Roshan H.; Sheikhi M. H. A novel room temperature ethanol sensor based on PbS:SnS2 nanocomposite with enhanced ethanol sensing properties. J. Alloys Compd. 2020, 816, 152666. 10.1016/j.jallcom.2019.152666. [DOI] [Google Scholar]
- Vishwakarma A. K.; Sharma A. K.; Yadav N. K.; Yadava L. Development of CdS-doped TiO2 nanocomposite as acetone gas sensor. Vacuum 2021, 191, 110363. 10.1016/j.vacuum.2021.110363. [DOI] [Google Scholar]
- Subin David S. P.; Veeralakshmi S.; Sandhya J.; Nehru S.; Kalaiselvam S. Room temperature operatable high sensitive toluene gas sensor using chemiresistive Ag/Bi2O3 nanocomposite. Sens. Actuators, B 2020, 320, 128410. 10.1016/j.snb.2020.128410. [DOI] [Google Scholar]
- Wongchoosuk C.; Subannajui K.; Wang C.; Yang Y.; Güder F.; Kerdcharoen T.; Cimalla V.; Zacharias M. Electronic nose for toxic gas detection based on photostimulated core-shell nanowires. RSC Adv. 2014, 4, 35084–35088. 10.1039/c4ra06143h. [DOI] [Google Scholar]
- Eom T. H.; Cho S. H.; Suh J. M.; Kim T.; Lee T. H.; Jun S. E.; Yang J. W.; Lee J.; Hong S.-H.; Jang H. W. Substantially improved room temperature NO2 sensing in 2-dimensional SnS2 nanoflowers enabled by visible light illumination. J. Mater. Chem. A 2021, 9, 11168–11178. 10.1039/d1ta00953b. [DOI] [Google Scholar]
- Reddeppa M.; Nam D.-J.; Bak N.-h.; Pasupuleti K. S.; Woo H.; Kim S.-G.; Oh J.-E.; Kim M.-D. Proliferation of the light and gas interaction with GaN nanorods grown on a V-grooved Si(111) substrate for UV photodetector and NO2 gas sensor applications. ACS Appl. Mater. Interfaces 2021, 13, 30146–30154. 10.1021/acsami.1c04469. [DOI] [PubMed] [Google Scholar]
- Espid E.; Noce A. S.; Taghipour F. The effect of radiation parameters on the performance of photo-activated gas sensors. J. Photochem. Photobiol., A 2019, 374, 95–105. 10.1016/j.jphotochem.2019.01.038. [DOI] [Google Scholar]
- Zou Z.; Qiu Y.; Xie C.; Xu J.; Luo Y.; Wang C.; Yan H. CdS/TiO2 nanocomposite film and its enhanced photoelectric responses to dry air and formaldehyde induced by visible light at room temperature. J. Alloys Compd. 2015, 645, 17–23. 10.1016/j.jallcom.2015.04.209. [DOI] [Google Scholar]
- Zhang S.; Zhao L.; Huang B.; Li X. UV-activated formaldehyde sensing properties of hollow TiO2@SnO2 heterojunctions at room temperature. Sens. Actuators, B 2020, 319, 128264. 10.1016/j.snb.2020.128264. [DOI] [Google Scholar]
- Cui J.; Shi L.; Xie T.; Wang D.; Lin Y. UV-light illumination room temperature HCHO gas-sensing mechanism of ZnO with different nanostructures. Sens. Actuators, B 2016, 227, 220–226. 10.1016/j.snb.2015.12.010. [DOI] [Google Scholar]
- Zou Z.; Qiu Y.; Xu J.; Guo P.; Luo Y.; Wang C. Enhanced formaldehyde photoelectric response on ZnO film illuminated with visible light. J. Alloys Compd. 2017, 695, 2117–2123. 10.1016/j.jallcom.2016.11.054. [DOI] [Google Scholar]
- Zhang B.; Bao N.; Wang T.; Xu Y.; Dong Y.; Ni Y.; Yu P.; Wei Q.; Wang J.; Guo L.; Xia Y. High-performance room temperature NO2 gas sensor based on visible light irradiated In2O3 nanowires. J. Alloys Compd. 2021, 867, 159076. 10.1016/j.jallcom.2021.159076. [DOI] [Google Scholar]
- Deng L.; Ding X.; Zeng D.; Tian S.; Li H.; Xie C. Visible-light activate mesoporous WO3 sensors with enhanced formaldehyde-sensing property at room temperature. Sens. Actuators, B 2012, 163, 260–266. 10.1016/j.snb.2012.01.049. [DOI] [Google Scholar]
- Zhai J.; Wang D.; Peng L.; Lin Y.; Li X.; Xie T. Visible-light-induced photoelectric gas sensing to formaldehyde based on CdS nanoparticles/ZnO heterostructures. Sens. Actuators, B 2010, 147, 234–240. 10.1016/j.snb.2010.03.003. [DOI] [Google Scholar]
- Liu D.; Tang Z.; Zhang Z. Visible light assisted room-temperature NO2 gas sensor based on hollow SnO2@SnS2 nanostructures. Sens. Actuators, B 2020, 324, 128754. 10.1016/j.snb.2020.128754. [DOI] [Google Scholar]
- Zhang B.; Liu G.; Cheng M.; Gao Y.; Zhao L.; Li S.; Liu F.; Yan X.; Zhang T.; Sun P.; Lu G. The preparation of reduced graphene oxide-encapsulated α-Fe2O3 hybrid and its outstanding NO2 gas sensing properties at room temperature. Sens. Actuators, B 2018, 261, 252–263. 10.1016/j.snb.2018.01.143. [DOI] [Google Scholar]
- Song X.; Li L.; Chen X.; Xu Q.; Song B.; Pan Z.; Liu Y.; Juan F.; Xu F.; Cao B. Enhanced triethylamine sensing performance of α-Fe2O3 nanoparticle/ZnO nanorod heterostructures. Sens. Actuators, B 2019, 298, 126917. 10.1016/j.snb.2019.126917. [DOI] [Google Scholar]
- Zhang D.; Wu D.; Cao Y.; Zong X.; Yang Z. Construction of Co3O4 nanorods/In2O3 nanocubes heterojunctions for efficient sensing of NO2 gas at low temperature. J. Mater. Sci.: Mater. Electron. 2018, 29, 19558–19566. 10.1007/s10854-018-0087-9. [DOI] [Google Scholar]
- Zhang L.; Gao Z.; Liu C.; Zhang Y.; Tu Z.; Yang X.; Yang F.; Wen Z.; Zhu L.; Liu R.; Li Y.; Cui L. Synthesis of TiO2 decorated Co3O4 acicular nanowire arrays and their application as an ethanol sensor. J. Mater. Chem. A 2015, 3, 2794–2801. 10.1039/c4ta06440b. [DOI] [Google Scholar]
- Souissi R.; Bouguila N.; Labidi A. Ethanol sensing properties of sprayed β-In2S3 thin films. Sens. Actuators, B 2018, 261, 522–530. 10.1016/j.snb.2018.01.175. [DOI] [Google Scholar]
- Wang X.; Zhou C.; Wang W.; Du B.; Cai J.; Feng G.; Zhang R. CdSe nanoparticle-sensitized ZnO sheets for enhanced photocatalytic hydrogen evolution rates. J. Alloys Compd. 2018, 747, 826–833. 10.1016/j.jallcom.2018.02.351. [DOI] [Google Scholar]
- Ho W.; Yu J. C. Sonochemical synthesis and visible light photocatalytic behavior of CdSe and CdSe/TiO2 nanoparticles. J. Mol. Catal. A: Chem. 2006, 247, 268–274. 10.1016/j.molcata.2005.11.057. [DOI] [Google Scholar]
- Song Y.; Li N.; Chen D.; Xu Q.; Li H.; He J.; Lu J. N-Doped and CdSe-sensitized 3D-ordered TiO2 inverse opal films for synergistically enhanced photocatalytic performance. ACS Sustainable Chem. Eng. 2018, 6, 4000–4007. 10.1021/acssuschemeng.7b04395. [DOI] [Google Scholar]
- Niu M.; Cao D.; Sui K.; Liu C. InP/TiO2 heterojunction for photoelectrochemical water splitting under visible-light. Int. J. Hydrogen Energy 2020, 45, 11615–11624. 10.1016/j.ijhydene.2020.02.094. [DOI] [Google Scholar]
- Chizhov A. S.; Mordvinova N. E.; Rumyantseva M. N.; Krylov I. V.; Drozdov K. A.; Li X.; Gas’kov A. M. The Effect of CdSe and InP Quantum Dots on the Interaction of ZnO with NO2 under Visible Light Irradiation. Russ. J. Inorg. Chem. 2018, 63, 512–518. 10.1134/s0036023618040071. [DOI] [Google Scholar]
- Zi B.; Chen M.; Zhang Y.; Rong Q.; Hu J.; Wang H.; He J.; Zhou S.; Zhang D.; Zhang J.; Liu Q. Morphology-dependent formaldehyde detection of porous copper oxide hierarchical microspheres at near-room temperature. Microporous Mesoporous Mater. 2020, 302, 110232. 10.1016/j.micromeso.2020.110232. [DOI] [Google Scholar]
- Kim J.-S.; Yoo H.-W.; Choi H. O.; Jung H.-T. Tunable volatile organic compounds sensor by using thiolated ligand conjugation on MoS2. Nano Lett. 2014, 14, 5941–5947. 10.1021/nl502906a. [DOI] [PubMed] [Google Scholar]
- Zhou Y.; Itoh H.; Uemura T.; Naka K.; Chujo Y. Preparation, optical spectroscopy, and electrochemical studies of novel π-conjugated polymer-protected stable PbS colloidal nanoparticles in a nonaqueous solution. Langmuir 2002, 18, 5287–5292. 10.1021/la011642i. [DOI] [Google Scholar]
- Han L.; Wang D.; Cui J.; Chen L.; Jiang T.; Lin Y. Study on formaldehyde gas-sensing of In2O3-sensitized ZnO nanoflowers under visible light irradiation at room temperature. J. Mater. Chem. 2012, 22, 12915–12920. 10.1039/c2jm16105b. [DOI] [Google Scholar]
- Wang J.; Fan S.; Xia Y.; Yang C.; Komarneni S. Room-temperature gas sensors based on ZnO nanorod/Au hybrids: Visiblelight-modulated dual selectivity to NO2 and NH3. J. Hazard. Mater. 2020, 381, 120919. 10.1016/j.jhazmat.2019.120919. [DOI] [PubMed] [Google Scholar]
- Zhang Q.; Xie G.; Xu M.; Su Y.; Tai H.; Du H.; Jiang Y. Visible light-assisted room temperature gas sensing with ZnO-Ag heterostructure nanoparticles. Sens. Actuators, B 2018, 259, 269–281. 10.1016/j.snb.2017.12.052. [DOI] [Google Scholar]
- Xia Y.; Wang J.; Xu L.; Li X.; Huang S. A room-temperature methane sensor based on Pd-decorated ZnO/rGO hybrids enhanced by visible light photocatalysis. Sens. Actuators, B 2020, 304, 127334. 10.1016/j.snb.2019.127334. [DOI] [Google Scholar]
- Joshi S.; Kumar R.; Jones L. A.; Mayes E. L. H.; Ippolito S. J.; Sunkara M. V. Modulating interleaved ZnO assembly with CuO nanoleaves for multifunctional performance: perdurable CO2 gas sensor and visible light catalyst. Inorg. Chem. Front. 2017, 4, 1848–1861. 10.1039/c7qi00474e. [DOI] [Google Scholar]
- Sun Q.; Li Y.; Hao J.; Zheng S.; Zhang T.; Wang T.; Wu R.; Fang H.; Wang Y. Increased active sites and charge transfer in the SnS2/TiO2 heterostructure for visible-light-assisted NO2 sensing. ACS Appl. Mater. Interfaces 2021, 13, 54152–54161. 10.1021/acsami.1c16095. [DOI] [PubMed] [Google Scholar]
- Wu C.-H.; Chou T.-L.; Wu R.-J. Rapid detection of trace ozone in TiO2-In2O3 materials by using the differential method. Sens. Actuators, B 2018, 255, 117–124. 10.1016/j.snb.2017.08.055. [DOI] [Google Scholar]
- Yang Z.; Guo L.; Zu B.; Guo Y.; Xu T.; Dou X. CdS/ZnO core/shell nanowire-built films for enhanced photodetecting and optoelectronic gas-sensing applications. Adv. Opt. Mater. 2014, 2, 738–745. 10.1002/adom.201400086. [DOI] [Google Scholar]
- Chizhov A. S.; Rumyantseva M. N.; Vasiliev R. B.; Filatova D. G.; Drozdov K. A.; Krylov I. V.; Marchevsky A. V.; Karakulina O. M.; Abakumov A. M.; Gaskov A. M. Visible light activation of room temperature NO2 gas sensors based on ZnO, SnO2 and In2O3 sensitized with CdSe quantum dots. Thin Solid Films 2016, 618, 253–262. 10.1016/j.tsf.2016.09.029. [DOI] [Google Scholar]
- Geng X.; Zhang C.; Debliquy M. Cadmium sulfide activated zinc oxide coatings deposited by liquid plasma spray for room temperature nitrogen dioxide detection under visible light illumination. Ceram. Int. 2016, 42, 4845–4852. 10.1016/j.ceramint.2015.11.170. [DOI] [Google Scholar]
- Chizhov A. S.; Rumyantseva M. N.; Vasiliev R. B.; Filatova D. G.; Drozdov K. A.; Krylov I. V.; Abakumov A. M.; Gaskov A. M. Visible light activated room temperature gas sensors based on nanocrystalline ZnO sensitized with CdSe quantum dots. Sens. Actuators, B 2014, 205, 305–312. 10.1016/j.snb.2014.08.091. [DOI] [Google Scholar]
- Wang H.; Bai J.; Dai M.; Liu K.; Liu Y.; Zhou L.; Liu F.; Liu F.; Gao Y.; Yan X.; Geyu L. Visible light activated excellent NO2 sensing based on 2D/2D ZnO/g-C3N4 heterojunction composites. Sens. Actuators, B 2020, 304, 127287. 10.1016/j.snb.2019.127287. [DOI] [Google Scholar]
- Kwak C. H.; Im U.-S.; Seo S. W.; Kim M. I.; Huh Y. S.; Im J. S. Effects of carbon doping on TiO2 for enhanced visible light-driven NO sensing performance. Mater. Lett. 2021, 288, 129313. 10.1016/j.matlet.2021.129313. [DOI] [Google Scholar]
- Khosravi Y.; Sasar M.; Abdi Y. Light-induced oxygen sensing using ZnO/GO based gas sensor. Mater. Sci. Semicond. Process. 2018, 85, 9–14. 10.1016/j.mssp.2018.05.023. [DOI] [Google Scholar]
- Tian X.; Yang X.; Yang F.; Qi T. A visible-light activated gas sensor based on perylenediimide-sensitized SnO2 for NO2 detection at room temperature. Colloids Surf., A 2019, 578, 123621. 10.1016/j.colsurfa.2019.123621. [DOI] [Google Scholar]
- Huang J.; Jiang D.; Zhou J.; Ye J.; Sun Y.; Li X.; Geng Y.; Wang J.; Du Y.; Qian Z. Visible light-activated room temperature NH3 sensor base on CuPc-loaded ZnO nanorods. Sens. Actuators, B 2021, 327, 128911. 10.1016/j.snb.2020.128911. [DOI] [Google Scholar]
- Yu Y.; Yao B.; He Y.; Cao B.; Ma W.; Chang L. Oxygen defect-rich In-doped ZnO nanostructure for enhanced visible light photocatalytic activity. Mater. Chem. Phys. 2020, 244, 122672. 10.1016/j.matchemphys.2020.122672. [DOI] [Google Scholar]
- Zhang C.; Liu G.; Geng X.; Wu K.; Debliquy M. Metal oxide semiconductors with highly concentrated oxygen vacancies for gas sensing materials: A review. Sens. Actuators, A 2020, 309, 112026. 10.1016/j.sna.2020.112026. [DOI] [Google Scholar]
- Wang J.; Chen R.; Xiang L.; Komarneni S. Synthesis, properties and applications of ZnO nanomaterials with oxygen vacancies: A review. Ceram. Int. 2018, 44, 7357–7377. 10.1016/j.ceramint.2018.02.013. [DOI] [Google Scholar]
- Wang Z.; Miao J.; Zhang H.; Wang D.; Sun J. Hollow cubic ZnSnO3 with abundant oxygen vacancies for H2S gas sensing. J. Hazard. Mater. 2020, 391, 122226. 10.1016/j.jhazmat.2020.122226. [DOI] [PubMed] [Google Scholar]
- Zhang C.; Geng X.; Li J.; Luo Y.; Lu P. Role of oxygen vacancy in tuning of optical, electrical and NO2 sensing properties of ZnO1-x coatings at room temperature. Sens. Actuators, B 2017, 248, 886–893. 10.1016/j.snb.2017.01.105. [DOI] [Google Scholar]
- Peng S.; Wang Z.; Liu R.; Bi J.; Wu J. Controlled oxygen vacancies of ZnFe2O4 with superior gas sensing properties prepared via a facile one-step self-catalyzed treatment. Sens. Actuators, B 2019, 288, 649–655. 10.1016/j.snb.2019.03.056. [DOI] [Google Scholar]
- Liu S.; Gao S.; Wang Z.; Fei T.; Zhang T. Oxygen vacancy modulation of commercial SnO2 by an organometallic chemistry-assisted strategy for boosting acetone sensing performances. Sens. Actuators, B 2019, 290, 493–502. 10.1016/j.snb.2019.03.123. [DOI] [Google Scholar]
- Al-Hashem M.; Akbar S.; Morris P. Role of oxygen vacancies in nanostructured metal-oxide gas sensors: A review. Sens. Actuators, B 2019, 301, 126845. 10.1016/j.snb.2019.126845. [DOI] [Google Scholar]
- Ri J.; Li X.; Shao C.; Liu Y.; Han C.; Li X.; Liu Y. Sn-doping induced oxygen vacancies on the surface of the In2O3 nanofibers and their promoting effect on sensitive NO2 detection at low temperature. Sens. Actuators, B 2020, 317, 128194. 10.1016/j.snb.2020.128194. [DOI] [Google Scholar]
- Ma M.; Peng L.; Li J.; Zhang Y.; Wang Z.; Bi J.; Gao D.; Wu J. Oxygen vacancy engineering and superior sensing properties of hematite prepared via a one-step treatment. Sens. Actuators, B 2021, 339, 129907. 10.1016/j.snb.2021.129907. [DOI] [Google Scholar]
- Tong B.; Meng G.; Deng Z.; Horprathum M.; Klamchuen A.; Fang X. Surface oxygen vacancy defect engineering of p-CuAlO2 via Ar&H2 plasma treatment for enhancing VOCs sensing performances. Chem. Commun. 2019, 55, 11691–11694. 10.1039/c9cc05881h. [DOI] [PubMed] [Google Scholar]
- Gurylev V.; Perng T. P. Defect engineering of ZnO: Review on oxygen and zinc vacancies. J. Eur. Ceram. Soc. 2021, 41, 4977–4996. 10.1016/j.jeurceramsoc.2021.03.031. [DOI] [Google Scholar]
- Liang H.; Guo L.; Cao N.; Hu H.; Li H.; Frans de Rooij N.; Umar A.; Algarni H.; Wang Y.; Zhou G. Practical room temperature formaldehyde sensing based on a combination of visible-light activation and dipole modification. J. Mater. Chem. A 2021, 9, 23955–23967. 10.1039/d1ta06346d. [DOI] [Google Scholar]
- Srinivasan P.; Prakalya D.; Jeyaprakash B. G. UV-activated ZnO/CdO n-n isotype heterostructure as breath sensor. J. Alloys Compd. 2020, 819, 152985. 10.1016/j.jallcom.2019.152985. [DOI] [Google Scholar]
- Liu Y.; Zhang Q.; Yuan H.; Luo K.; Li J.; Hu W.; Pan Z.; Xu M.; Xu S.; Levchenko I.; Bazaka K. Comparative study of photocatalysis and gas sensing of ZnO/Ag nanocomposites synthesized by one- and two-step polymer-network gel processes. J. Alloys Compd. 2021, 868, 158723. 10.1016/j.jallcom.2021.158723. [DOI] [Google Scholar]
- Hsu C.-L.; Chang L.-F.; Hsueh T.-J. Light-activated humidity and gas sensing by ZnO nanowires grown on LED at room temperature. Sens. Actuators, B 2017, 249, 265–277. 10.1016/j.snb.2017.04.083. [DOI] [Google Scholar]
- Basnet P.; Samanta D.; Chanu T. I.; Chatterjee S. Visible light facilitated degradation of alternate dye solutions by highly reusable Mn-ZnO nano-photocatalyst. J. Alloys Compd. 2021, 867, 158870. 10.1016/j.jallcom.2021.158870. [DOI] [Google Scholar]
- Li F.; Jiang Y.; Hu L.; Liu L.; Li Z.; Huang X. Structural and luminescent properties of ZnO nanorods and ZnO/ZnS nanocomposites. J. Alloys Compd. 2009, 474, 531–535. 10.1016/j.jallcom.2008.06.149. [DOI] [Google Scholar]
- Sun G.; Cao M.; Wang Y.; Hu C.; Liu Y.; Ren L.; Pu Z. Anionic surfactant-assisted hydrothermal synthesis of high-aspect-ratio ZnO nanowires and their photoluminescence property. Mater. Lett. 2006, 60, 2777–2782. 10.1016/j.matlet.2006.01.088. [DOI] [Google Scholar]
- Choi H.-S.; Vaseem M.; Kim S. G.; Im Y.-H.; Hahn Y.-B. Growth of high aspect ratio ZnO nanorods by solution process: Effect of polyethyleneimine. J. Solid State Chem. 2012, 189, 25–31. 10.1016/j.jssc.2011.12.008. [DOI] [Google Scholar]
- Chen X.; Li Y.; Pan X.; Cortie D.; Huang X.; Yi Z. Photocatalytic oxidation of methane over silver decorated zinc oxide nanocatalysts. Nat. Commun. 2016, 7, 12273. 10.1038/ncomms12273. [DOI] [PMC free article] [PubMed] [Google Scholar]
- Li L.; Li G.-D.; Yan C.; Mu X.-Y.; Pan X.-L.; Zou X.-X.; Wang K.-X.; Chen J.-S. Efficient sunlight-driven dehydrogenative coupling of methane to ethane over a Zn+-modified zeolite. Angew. Chem., Int. Ed. 2011, 50, 8299–8303. 10.1002/anie.201102320. [DOI] [PubMed] [Google Scholar]
- Wang L.; Li Y.; Yue W.; Gao S.; Zhang C.; Chen Z. High-performance formaldehyde gas sensor based on Cu-doped Sn3O4 hierarchical nanoflowers. IEEE Sens. J. 2020, 20, 6945–6953. 10.1109/jsen.2020.2977972. [DOI] [Google Scholar]
- Zhu K.; Ma S.; Tie Y.; Zhang Q.; Wang W.; Pei S.; Xu X. Highly sensitive formaldehyde gas sensors based on Y-doped SnO2 hierarchical flower-shaped nanostructures. J. Alloys Compd. 2019, 792, 938–944. 10.1016/j.jallcom.2019.04.102. [DOI] [Google Scholar]
- David S. P. S.; Veeralakshmi S.; Nehru S.; Kalaiselvam S. A highly sensitive, selective and room temperature operatable formaldehyde gas sensor using chemiresistive g-C3N4/ZnO. Mater. Adv. 2020, 1, 2781–2788. 10.1039/d0ma00529k. [DOI] [Google Scholar]
- Fu X.; Yang P.; Xiao X.; Zhou D.; Huang R.; Zhang X.; Cao F.; Xiong J.; Hu Y.; Tu Y.; Zou Y.; Wang Z.; Gu H. Ultra-fast and highly selective room-temperature formaldehyde gas sensing of Pt-decorated MoO3 nanobelts. J. Alloys Compd. 2019, 797, 666–675. 10.1016/j.jallcom.2019.05.145. [DOI] [Google Scholar]
- Timsorn K.; Wongchoosuk C. Inkjet printing of room-temperature gas sensors for identification of formalin contamination in squids. J. Mater. Sci.: Mater. Electron. 2019, 30, 4782–4791. 10.1007/s10854-019-00772-9. [DOI] [Google Scholar]
- Song Y.; Zhang Y.; Ma M.; Ren J.; Liu C.; Tan J. Visible light-assisted formaldehyde sensor based on HoFeO3 nanoparticles with sub-ppm detection limit. Ceram. Int. 2020, 46, 16337–16344. 10.1016/j.ceramint.2020.03.191. [DOI] [Google Scholar]
- Wang J.; Deng H.; Li X.; Yang C.; Xia Y. Visible-light photocatalysis enhanced room-temperature formaldehyde gas sensing by MoS2/rGO hybrids. Sens. Actuators, B 2020, 304, 127317. 10.1016/j.snb.2019.127317. [DOI] [Google Scholar]
Associated Data
This section collects any data citations, data availability statements, or supplementary materials included in this article.