

Abstract

Janus kinase (JAK) deregulation of the JAK/signal transducers and activators of transcription pathway leads to myelofibrosis that can be treated by JAK inhibitors including Ruxolitinib and Tofacitinib. Even though both inhibitors are effective against myelofibrosis, each of them has a different mode of action in the cells. Ruxolitinib is an inhibitor for selective JAK1/2, and Tofacitinib is an inhibitor for JAK3. This study evaluated the chemical fingerprints of TF-1 cells after JAK inhibitor treatments by the synchrotron Fourier transform infrared microspectroscopy (S-FTIR) spectrum. Tofacitinib and Ruxolitinib treatments in TF-1 cells were applied with a chemical fingerprint approach in S-FTIR spectroscopy and in vitro cytotoxicity in a cell-based assay. Principal component analysis or PCA was utilized to classify three cell treatments with three biochemical alteration absorbances of lipid vibration by the C–H stretching, protein amide I that appeared from the C=O stretching, and a P=O phosphodiester bond from nucleic acids. The results showed that the inhibition effect of Ruxolitinib on the TF-1 cell lines was two-fold higher than Tofacitinib. PCA distinguishes untreated and drug-treated cells by detecting cellular biochemical alteration. The loading plots identify that proteins and nucleic acids were the different main components in disparate cell treatments. Tofacitinib was distinct from the others in lipid and nucleic acid. The second derivative spectra of the three molecular components had decreased lipid production and accumulation, changes in secondary structures in proteins, and a high level of RNA overexpression in cell treatment. The JAK inhibitors caused different spectroscopic biomarkers of the modifications of secondary protein conformation, stimulated cell lipid accumulation, and phosphorylation from untreated cells. The alteration of cellular biochemical components suggests that FTIR is a potential tool to analyze specific patterns of drug cellular responses at the molecular level.
1. Introduction
Janus kinases (JAKs) are a family of intracellular and nonreceptor tyrosine kinases including JAK1, JAK2, JAK3, and tyrosine kinase 2 (TYK2) that play a role in signal transductions due to cytokines and growth factors.1 These kinases are intermediaries between the signal induction of cytokine and transcriptional factor phosphorylation and signal transducers and activators of transcription (STAT) passing through the JAK/STAT pathway. Therefore, JAK/STAT pathway deregulation can initiate cancer inflammation and autoimmune diseases.2,3
JAK1 related to mutated sites has been associated with acute leukemia or B-cell lymphoma. JAK2 mutation is also associated with thrombocytosis, myelofibrosis, leukemia, and lymphoma, and increasing JAK3 signaling can develop T-cell acute lymphocytic leukemia.2,4 The tyrosine kinase domain location is in the JH1 domain at the C-terminal of the JAKs. This domain is controlled through a pseudokinase domain or JH2 that lacks Asp residue for phosphotransfer in the His/Arg/Asp motif of the catalytic loop in kinase activity. Hence, this domain is assumed to regulate the JH1 domain catalytic activity.5 Among the JAKs, JAK2 is a critical target for the treatment of cancer disease. JAK2 inhibition can decrease the risk of bone marrow cancer due to the prevention of JAK2 activation.
Myelofibrosis cancer can be treated by JAK inhibition.6 Ruxolitinib and Tofacitinib are two FDA-approved drugs that are widely used in clinical treatment of this cancer. These drugs interact in the ATP site of the JAKs and prevent JAK activation. As a result, signal transduction cannot occur, and the risk of this cancer is decreased. Ruxolitinib is selective for JAK1/2 (the half-maximal inhibitory concentration (IC50) for JAK1 = 3.3 and for JAK2 = 2.8 nM),7 whereas Tofacitinib is more selective for JAK3 (IC50 = 34 nM) than JAK1/2 (IC50 = 81 and 80 nM, respectively).8 Ruxolitinib is effective for JAK1/2 inhibition, whereas Tofacitinib can inhibit JAK1/3 more than JAK2. It is an interesting approach to investigate the binding pattern of both drugs with JAKs.
FTIR is an effective tool for studying the biological systems by considering the effect of molecular changes in cells on antitumor drugs based on the FTIR spectrum.9 Numerous FTIR chemical fingerprints between cancer cells and drugs have been reported. The leukemic cell lines (K562) treated with an Akt1/2 kinase inhibitor (A6730) showed a noticeable change in the α-helix/β-strand conformation ratio.10 A previous report revealed the capability of FTIR spectroscopy to evaluate the drug sensitivity in cells as well as the interactions of different molecular components of anti-cancer drugs.11 TF-1 cell lines originate from erythroleukemia in humans. These cells’ proliferation is responsive to the granulocyte-macrophage colony-stimulating factor (GM-CSF) or interleukin-3 (IL-3) through the JAK2/STAT signaling pathway activation.12 Understanding the different inhibition patterns of drugs resulting from JAK2, based on the FTIR spectrum in cells treated with drugs, is important to better characterize the effect of JAK2 inhibition and the potential explanation for differences in clinical effectiveness.
In this study, the objective was to assess the chemical fingerprints of TF-1 cells after Tofacitinib and Ruxolitinib treatments. To achieve this, we applied a chemical fingerprint approach, using the information of both drugs from S-FTIR spectroscopy and in vitro cytotoxicity in a cell-based assay. These findings proposed that S-FTIR can be used for analyzing distinct patterns of cellular responses with drug treatments at the molecular level.
2. Results
2.1. Effect of Ruxolitinib and Tofacitinib on the TF-1 Cell Lines
We used the TF-1 cells to investigate the dose dependence of drug treatment using a PrestoBlue assay. At 72 h, the IC50 of Ruxolitinib was 14.47 ± 0.59 μM and that of Tofacitinib was 30.29 ± 1.98 μM on TF-1 cells (Figure 1). These results showed that drugs can inhibit the viability of TF-1 cells, and the inhibitory effect indicated that Ruxolitinib can inhibit TF-1 cells more than two-fold higher than Tofacitinib. However, the effect of both drugs on the TF-1 cells was further evaluated to consider molecular changes in cells by FTIR spectrum analysis.
Figure 1.

TF-1 cell viability after treatment with Ruxolitinib and Tofacitinib at various concentrations.
2.2. Molecular Docking
To demonstrate the interaction and binding mode of known drugs (Ruxolitinib and Tofacitinib) with JAK1 and JAK2, both compounds were individually docked into the binding pocket of the JAK1 and JAK2 proteins by using GOLD docking. The docking scores of Ruxolitinib in complex with both proteins (59.40 kcal mol–1 for JAK1 and 57.81 kcal mol–1 for JAK2) were higher than Tofacitinib (50.91 kcal mol–1 for JAK1 and 51.88 kcal mol–1 for JAK2) (Figure S1). These results confirmed the previous reports that the Ruxolitinib strongly interacts with JAK1 compared to JAK2 whereas Tofacitinib strongly interact with JAK2 compared to JAK1. Moreover, the binding pattern and 2D interactions of all systems are illustrated in Figure 2. We found that Ruxolitinib and Tofacitinib bound at the binding site with a similar pattern to JAK1/2; both compounds bound well with the deazapurine ring and stabilized through other interactions such as π-sulfur, π-alkyl, π-σ, and van der Waals (Figures S2 and S3). Both drugs are effective with JAK1 or JAK2 depending on the binding interactions and binding position inward these proteins. Glu957 and Leu959 are important interactions in the hinge region of JAK1,13 and this interaction is determined to be significant for the binding of inhibitors within the kinase protein. Therefore, Ruxolitinib strongly binds with JAK1 compared to Tofacitinib via the formation of two strong hydrogen bonds. Moreover, the Glu930 and Leu932 residues in the hinge region are unique to JAK2,14 and we found that Ruxolitinib strongly binds with JAK1 compared to Tofacitinib via the formation of three strong hydrogen bonds.
Figure 2.
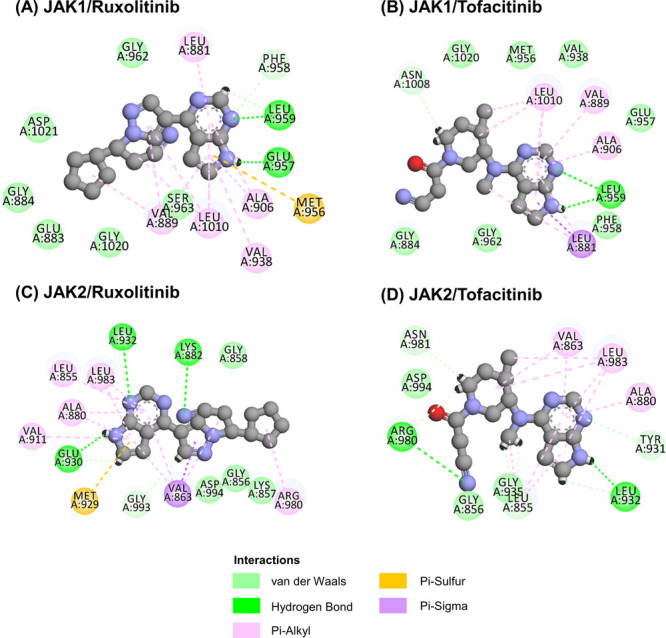
2D interactions of Ruxolitinib and Tofacitinib complexed with (A, B) JAK1 and (C, D) JAK2.
2.3. FTIR Analysis
To further investigate if the different modes of action between both drugs could affect the inhibition of the cell differently, FTIR was used to see differences in the biochemical cell responses. The overall FTIR spectrum was obtained from whole-cell lines between wavelength lengths 3800–1000 cm–1 in Figure 3A. The selected peaks at 2923, 1656, and 1238 cm–1 were assigned to the C–H stretch, C=O stretch, and P=O stretch, respectively.15 The selected spectral groups were adjusted using third polynomial order, 11 smoothing points, and linear baseline correction for finished Savitzky–Golay smoothing converted to second derivatives and EMSC by Unscrambler X 10.4. For an additional detailed comparison between different cell treatments, these average spectra were analyzed by PCA.
Figure 3.

(A) Average absorbance FTIR spectra of TF-1 cells under untreated conditions (blue), Tofacitinib-treated cells (red), and Ruxolitinib-treated cells (green). (B) Two-dimensional PCA score plot in PC1-2. (C) PCA corresponding loading plot PC1-2 indicating all samples’ biomarker differentiation.
2.4. PCA Distinguishes Untreated and Drug-Treated Cells by Detecting Cellular Biochemical Alteration
The goal was to distinguish the different cell treatments with biochemical alteration by PCA. PCA is a dimensionality-reduction method that uses multivariate exploratory analysis techniques allowing identification of the significant variables or wavenumbers describing differences between samples. PCA could be achieved and could represent two types of information, namely, plot scores indicating class separation and loading plots for identification of the variables, providing clustering for the responsible information.15 The 2D score plots in Figure 3B distinctly show the three samples; PC-1 was sufficient to separate the TF-1 drug treatment from the untreated cells with an accuracy of 83% while PC-2 explained 5% total variance in the model. From Figure 3C, the loading plots identify various biochemical components by PC-1 and PC-2. The major components in the different treatment cells were differentiated at around 1700–1500 cm–1 for protein; it was reported that JAK inhibitor-treated cells compared to untreated cells by PC-1 had higher signals for amide I.16 Previous research indicated that the range was around 3000–2800 cm–1 for the CH2 and CH3 asymmetric/symmetric stretching in lipids, fatty acids, and proteins and 1300–1000 cm–1 for the PO2– asymmetric stretching of DNA and RNA in PC-2.17 PC-2 loading scores showed that Tofacitinib was distinct from the others with less lipid and a higher level of nucleic acid accumulation. For further detailed analysis, the secondary derivative spectra were created and overlapped for comparison.
2.5. Cellular Biochemical Identification and Differentiation Detected by S-FTIR
The average FTIR absorbance spectra of the three samples were subsequently transformed to a second derivative to reduce baseline slopes and cover every single band in the unrefined spectra of samples. To identify the band and sub-band components, the spectra after the second derivative process of the three major molecular components, namely, lipid, protein, and nucleic acid, are presented in Figures 4–6. The peak areas were assigned to the molecular vibrations in individual wavenumbers or IR frequencies that are summarized in Table 1.
Figure 4.

Average of second derivative FTIR spectra characterizing the lipid regions in the wavelengths from 3000 to 2800 cm–1: 60 spectra of untreated TF-1 cells (blue), 100 spectra of cells treated with 30.28 μM Tofacitinib (red), and 42 spectra of cells treated with 14.47 μM Ruxolitinib (green) after incubation for 72 h.
Figure 6.

Average second derivative FTIR spectra characterizing nucleic acids regions in wavelength from 1300 to 1000 cm–1: 60 spectra of untreated TF-1 cells (blue), 100 spectra of 30.28 μM Tofacitinib-treated cells (red), and 42 spectra of 14.47 μM Ruxolitinib-treated cells (green) after incubation for 72 h.
Table 1. Second Derivative FTIR Spectra Band Assignments for the Vibration of Functional Groups That Are Found in Untreated and Drug-Treated TF-1 Cells.
| regions | second derivative spectra (cm–1) band | band assignments |
|---|---|---|
| lipid | 2963 | C–H asymmetric stretching (CH3) in fatty acids, lipids, and proteins17 |
| 2923 | C–H asymmetric stretching (CH2) in fatty acids, lipids, and proteins17 | |
| 2874 | C–H symmetric stretching (CH3) in fatty acids, lipids, and proteins17 | |
| 2852 | C–H symmetric stretching (CH2) in fatty acids, lipids, and proteins17 | |
| protein | 1656–1650 | α-helix structure of amide I17 |
| 1639–1633 | β-sheet structure of amide I17 | |
| nucleic acid | 1243–1238 | PO–2 asymmetric and symmetric stretching (phosphate I) nucleic acids, phosphorylated proteins, and phospholipids)17,19 |
| 1226–1216 | PO–2 asymmetric stretching (phosphate I)17 | |
| 1191 | amide III band region17 |
2.5.1. FTIR Spectra of Treated Cells Display Lipid Alteration
The spectra in the region of 3000–2800 cm–1 detected vibrations of the C–H groups CH2 in lipids and CH3 from fatty acids, lipids, and proteins using symmetric/asymmetric parameters. The average of the three samples’ second derivative spectra exhibited high absorbance at 2963, 2923, and 2852 cm–1 (Figure 4). Untreated cells were stronger than the others for high lipid accumulation. After treatment with Tofacitinib and Ruxolitinib, the result clearly shows that both drug treatments decrease lipid production and accumulation. However, the absorbance of the C–H symmetric stretching of CH3 at 2874 cm–1 was increased after drug treatment.
2.5.2. FTIR Spectra Display Treated Cell Changes of Secondary Structures in Proteins
The most apparent measurable differences of second derivatives are the fact that they were surrounded by reflecting vibrations of protein amide I in 1700–1600 cm–1 (Figure 5). The major absorptions of the amide I band from the C=O stretching of the backbone and the peptide backbone vibrations of the N–H bending and C–N stretching were detected and assigned vibrations revealing the secondary structure change in proteins. On this basis, infrared bands in the 1660–1650 cm–1 range were defined to be the α-helix structure, β-sheets were imposed in the wavelengths of 1640–1620 cm–1, and β-turn and β-sheet structures were determined in the 1695–1660 cm–1 region. Furthermore, the 1650–1620 cm–1 region was defined to be the unordered structures.16,18 All the sample results showed that the absorption peaks exhibited the α-helix (1656 cm–1) and β-sheet (1639 cm–1) in the amide I. Although Tofacitinib- and Ruxolitinib-treated cells had remarkably reduced α-helix absorbance, they exhibited an increase in the β-sheet peak at 1639–1633 cm–1. Particularly, the aggregated peak at 1630–1620 cm–1 was increased in Tofacitinib-treated cells. This implies that the intramolecular β-sheet structures collapsed into aggregated forms.
Figure 5.

Average second derivative FTIR spectra characterizing the protein regions in wavelengths from 1700 to 1600 cm–1: 60 spectra of untreated TF-1 cells (blue), 100 spectra of Tofacitinib-treated (30.28 μM) cells (red), and 42 spectra of Ruxolitinib-treated (14.47 μM) cells (green) after incubation for 72 h.
2.5.3. High Levels of RNA Overexpression in Cell Treatment
The average second derivative FTIR spectra characterizing nucleic acid regions in wavelengths from 1300 to 1000 cm–1 are shown in Figure 6. Treated cells exhibited high synthesized nucleic acid levels at 1243–1238 cm–1 peaks together with 1226–1216 cm–1 related to the asymmetrical stretching of PO2– in the phosphodiester backbone of DNA or RNA and also the high absorption of amide III band region at 1191 cm–1. In previous publications, the FTIR application establishes biomarkers for early screening of B-cell precursor lymphoblastic leukemia (BCP-ALL). The control group peak area at 1241 cm–1 was identified as the asymmetric/symmetric stretching of PO2– (nucleic acids, phosphorylated proteins, and phospholipids).19 This correlates with the peak result of the treated cells, which exhibited high synthesized nucleic acid levels at 1243–1238 cm–1. As a result of both type I inhibitor effect mechanisms, Ruxolitinib decreased signaling can be associated with the accumulation of activation loop phosphorylation for preventing JAK2 dephosphorylation and ubiquitination.20
3. Discussion
The JAK–STAT pathway is related to cellular processes such as cell division, proliferation, cell death, tumor formation, and immunity. The pathway information from the chemical signals outside to the nucleus of the cell results in the initiation of genes through a process called transcription.21 Ruxolitinib and Tofacitinib are first-generation and type I kinase inhibitors, which are competitive ATP binding sites and repress the enzyme activity of JAK kinases; thus, the effect of inhibitors is silencing the signal transduction and action of cytokine. As a result, signal transduction cannot occur, and the risk of this cancer is decreased. Therefore, FTIR is an effective tool to study biological systems and consider the molecular change of cells subjected to antitumor drugs based on the FTIR spectrum.9
This study evaluates the chemical fingerprints of TF-1 cells after Tofacitinib and Ruxolitinib treatments. The TF-1 cells have proliferative responses to IL-3 or GM-CSF that can result in activation of the JAK2/STAT signaling pathway. Both JAK inhibitor drugs are selective JAK inhibitors, but Ruxolitinib is effective for JAK1/2 inhibition, whereas Tofacitinib causes a higher inhibition of JAK1/3 than JAK2.22 This result corresponds to the higher inhibition of TF-1 cells by Ruxolitinib than Tofacitinib.
From the binding mode analysis of known drugs (Ruxolitinib and Tofacitinib) with JAK1 and JAK2, we found that the docking scores of Ruxolitinib in complex with both proteins were higher than Tofacitinib (Figure S1). These results suggested that Ruxolitinib fits better with both proteins than Tofacitinib due to the fact that Ruxolitinib is a dual inhibitor against JAK1/2, whereas Tofacitinib is a dual inhibitor for JAK1/3.23 Additionally, 2D interactions and the binding pattern bound well with the deazapurine ring at the ATP binding site (Figure S2). In JAK1, the nitrogen atoms on the deazapurine ring of Ruxolitinib formed two hydrogen bonds (H-bonds) with Glu957 and Leu959, while Tofacitinib formed H-bonds with Leu959. For JAK2, we found that nitrogen atoms on the deazapurine ring and nitrile group formed H-bonds with Lys882, Glu930, and Leu932 for Ruxolitinib and Leu932 and Arg980 for Tofacitinib (Figure 2). Apart from that, all compounds are stabilized through other interactions such as π-sulfur, π-σ, π-alkyl, and van der Waals interaction; these interactions are called hydrophobic interactions (Figure S3).
The goal was to evaluate the chemical fingerprints of TF-1 cells after Tofacitinib and Ruxolitinib treatments. FTIR analysis was performed and determined from the absorption (or transmission) versus wavelength (or frequency) of infrared radiation associated with the vibrations of functional groups within the molecule and chemical bonds between atoms undergoing various forms.24 The second derivative spectra of the three major molecular components, namely, lipid, protein, and nucleic acid, are presented. (1) Part of the lipid region is allocated for the phospholipid bilayer and organelle membranes of the cell. This consists of the fatty acid side chains that have repeated moieties of CH2– and CH3– stretching vibration. (2) The protein region is designated to the amide bonds of amino acid binding in proteins and the peptide bond that provides the stretching vibration of amide I and bending vibration of amide II. (3) The region of nucleic acid is given for phosphodiester bond binding to form DNA/RNA. Accordingly, the sensitized TF-1 cells of Ruxolitinib compared to Tofacitinib in the JAK/STAT pathway control can be observed and represent the FTIR spectrum. Biologically, the JAK/STAT pathway controls crucial cellular processes.25 Ruxolitinib withdrew phosphorylated STAT3, stimulated caspase-3 cleaving, enhanced apoptosis, and inhibited tumor growth.26 The inhibitors induced autophagosome accumulation and reduced the IL-6, IL-18, JAK2, TYK2, and AKT gene expression in multiple myeloma cells.27 In a previous publication, Han et al. provided the Western blot results of Ruxolitinib treatment using ovarian cancer cells and explained the inhibition of STAT3 phosphorylation.28 For Tofacitinib, the drug effect in JAK/STAT signaling inhibition is anti-myeloma therapeutic. The result of Western blotting demonstrates a decrease in STAT3 phosphorylation after treatment with 1 μM Tofacitinib.29In vivo, Tofacitinib represses JAK–STAT pathways by downregulating the phosphorylation of STAT1, STAT3, STAT4, and STAT5, which also decreases the expression of interferon-regulated and metalloproteinase genes in rheumatoid arthritis disease.30
4. Conclusions
The study revealed that FTIR microspectroscopy and PCA analysis represent methods for classifying the biochemical pattern of untreated and treated TF-1 cells. The absorbance spectra of C–H lipids, C=O amide I protein, and the P=O phosphodiester bond from nucleic acids were detected. Possibly, Ruxolitinib- and Tofacitinib-treated cells induced the modifications of secondary protein conformation, stimulated lipid accumulation, and induced protein phosphorylation. These conclusions imply that FTIR can be a prospective tool for analyzing individual cellular response patterns in drug-treated cells at the molecular level.
5. Materials and Methods
5.1. Cell Culture of TF-1 Cell Lines
The human erythroleukemia TF-1 cells (ATCC CRL-2003, Manassas, VA, USA) were grown in a complete RPMI-1640 medium (Gibco, Thermo Fisher Scientific Inc., Waltham, Massachusetts, USA) supplemented with fetal bovine serum (FBS) (10% v/v) (Gibco), penicillin (100 U/mL), streptomycin (100 μg/mL) (Gibco), and GM-CSF (2 ng/mL) (Sigma-Aldrich, Merck KGaA, Darmstadt, Germany). Cells were incubated at 37 °C in a humidified incubator containing CO2 (5% v/v) and air (95% v/v).
5.2. Cytotoxicity
Tofacitinib and Ruxolitinib (Sigma-Aldrich) in dimethyl sulfoxide (DMSO) (Sigma-Aldrich) toward the TF-1 cells were determined using the PrestoBlue assay. The cell suspensions with a density of 50,000 cells/well were prepared by a 96-well microplate seeding and incubation overnight at 37 °C. After treatment with the drugs, the cells were incubated for 72 h. Subsequently, the cells were added to the PrestoBlue reagent (10 μL) (Invitrogen, Thermo Fisher Scientific Inc., Waltham, Massachusetts, USA) and incubated at 37 °C for 1 h. Finally, the absorbance of Resorufin was measured at 570 nm and compared to the vehicle control by a microplate reader (Infinite M200 microplate reader, Tecan, Männedorf, Switzerland). The experiment was performed in triplicate independent experiments (n = 9).
5.3. Molecular Docking
The crystal structures of JAK1 (PDB ID: 3EYG) and JAK2 (PDB ID: 3FUP)14,31 were obtained from the Protein Data Bank (PDB). The 3D structures of the drugs (Ruxolitinib and Tofacitinib) were downloaded in SDF format from the ZINC database. All docking tests were performed by GOLD docking software version 2020.1. The docking protocols of each system were set as 12 Å for sphere docking and GOLD score and ChemScore (rescore) for the scoring function. Then, docking into the ATP-binding pocket with 100 docking poses occurred. The binding between proteins and drugs was visualized using the Discovery Studio 2020 (Accelrys Inc.) and the UCSF Chimera package.
5.4. Sample Preparation for S-FTIR
The TF-1 cells with a density of 300,000 cells/well were seeded in a 24-well microplate and incubated overnight at 37 °C. Afterward, the cells were replenished with a medium without drugs or a medium containing 2-fold concentrations of Tofacitinib or Ruxolitinib for a half-inhibitory concentration. After incubation for 72 h, cells were harvested by centrifugation at 300g for 5 min. The pelleted cells were suspended and washed in NaCl (0.9% w/v) two times, and then cells were fixed with formaldehyde (4% v/v) at 25 °C for 30 min. After decanting with formaldehyde, cells were washed three times and re-suspended with sterile distilled water (20 μL). The resuspended cells (2 μL) were dropped onto 22 m-diameter × 1 mm-thickness calcium fluoride IR (CaF2) windows for monolayer formation, then vacuum-dried, and stored in a desiccator until spectra were acquired from FTIR analysis.
5.5. Synchrotron Fourier-Transform Infrared Spectroscopy
The S-FTIR experiments were accomplished at the BL4.1 Infrared Spectroscopy and Imaging (ISI), Synchrotron Light Research Institute (SLRI), Nakhon Ratchasima, Thailand. Samples were examined in the transmission mode of measurement using a photon energy range of 0.01–0.5 eV with a 36× Schwarzschild Objective, a Bruker Vertex 70 spectrometer coupled to a Bruker Hyperion 2000 microscope (Bruker Optics Ltd., Ettlingen, Germany), and a 100-micron narrow band mercury-cadmium-telluride (MCT) detector cooled with liquid nitrogen. The infrared spectra of the samples were collected in the spectral range between 3800 and 1000 cm–1 using a 10 × 10 μm square aperture with a spectral resolution of 6 cm–1 in 40 to 100 scans. The instrument control and spectral achievement were performed by OPUS 7.2 software (Bruker Optics Ltd., Ettlingen, Germany) and evaluated in the spectral ranges of 3000–2800 and 1800–1000 cm–1 for each sample group for PCA by Unscrambler 10.4 software (CAMO, Oslo, Norway). The absorbance of molecules of interest during vibrational modes was identified by spectral secondary derivative analysis. The absorbances of the C–H stretching of lipids were detected between 3000 and 2800 cm–1. The absorbances between 1700 and 1500 cm–1 from the C=O stretching protein amide I and P=O phosphodiester bond from nucleic acids were detected in the absorbance of 1300–1000 cm–1.
5.6. Statistical Analysis
The IC50 values data are presented as mean ± standard error of the mean (SEM). In the cytotoxicity experiments, significant differences were determined by comparing each treatment with an independent T-test. P < 0.05 was indicative of a statistically significant difference.
Acknowledgments
This work is supported by the Royal Golden Jubilee (RGJ) Ph.D. Programme between the National Research Council of Thailand (NRCT) and the Synchrotron Light Research Institute (SLRI) (Grant no. PHD/0137/2561) and Kasetsart University Research and Development Institutes (KURDI (FF(KU)6.64)).
Glossary
Abbreviations
- JAKs
Janus kinases
- FTIR
Fourier transform infrared spectroscopy
- TYK2
tyrosine kinase 2
- STAT
signal transducers and activators of transcription
- IC50
half-maximal inhibitory concentration
- GM-CSF
granulocyte-macrophage colony-stimulating factor
- IL-3
interleukin-3
- DMSO
dimethyl sulfoxide
- FBS
fetal bovine serum
- SLRI
Synchrotron Light Research Institute
- ISI
Infrared Spectroscopy and Imaging
- MCT
mercury-cadmium-telluride
- SEM
standard error of the mean
- PCA
principal component analysis
Supporting Information Available
The Supporting Information is available free of charge at https://pubs.acs.org/doi/10.1021/acsomega.2c02404.
(Figure S1) docking energy scores of known drugs with the JAK1 and JAK2 proteins; (Figure S2) binding patterns of known drugs within JAK1 and JAK2; (Figure S3) summary of histograms showing interactions of Ruxolitinib and Tofacitinib complexed with JAK1 and JAK2 (PDF)
The authors declare no competing financial interest.
Supplementary Material
References
- Stark G. R.; Darnell J. E. Jr. The JAK-STAT Pathway at Twenty. Immunity 2012, 36, 503–514. 10.1016/j.immuni.2012.03.013. [DOI] [PMC free article] [PubMed] [Google Scholar]
- O’Shea J. J.; Holland S. M.; Staudt L. M. JAKs and STATs in Immunity, Immunodeficiency, and Cancer. New Engl J Med 2013, 368, 161–170. 10.1056/NEJMra1202117. [DOI] [PMC free article] [PubMed] [Google Scholar]
- Mascarenhas J.; Mughal T.; Verstovsek S. Biology and Clinical Management of Myeloproliferative Neoplasms and Development of the JAK Inhibitor Ruxolitinib. Curr. Med. Chem. 2012, 19, 4399–4413. 10.2174/092986712803251511. [DOI] [PMC free article] [PubMed] [Google Scholar]; Banerjee S.; Biehl A.; Gadina M.; Hasni S.; Schwartz D. M. JAK-STAT Signaling as a Target for Inflammatory and Autoimmune Diseases: Current and Future Prospects (vol 77, pg 521, 2017). Drugs 2017, 77, 1261–1261. 10.1007/s40265-017-0772-7. [DOI] [PMC free article] [PubMed] [Google Scholar]
- Zhang X.; Hu F.; Li G.; Li G.; Yang X.; Liu L.; Zhang R.; Zhang B.; Feng Y. Human colorectal cancer-derived mesenchymal stem cells promote colorectal cancer progression through IL-6/JAK2/STAT3 signaling. Cell Death Dis. 2018, 9, 25. 10.1038/s41419-017-0176-3. [DOI] [PMC free article] [PubMed] [Google Scholar]
- Alicea-Velazquez N. L.; Boggon T. J. The Use of Structural Biology in Janus Kinase Targeted Drug Discovery. Curr. Drug Targets 2011, 12, 546–555. 10.2174/138945011794751528. [DOI] [PMC free article] [PubMed] [Google Scholar]
- Vainchenker W.; Leroy E.; Gilles L.; Marty C.; Plo I.; Constantinescu S. N. JAK inhibitors for the treatment of myeloproliferative neoplasms and other disorders. F1000Res 2018, 7, 82. 10.12688/f1000research.13167.1. [DOI] [PMC free article] [PubMed] [Google Scholar]
- Quintás-Cardama A.; Vaddi K.; Liu P.; Manshouri T.; Li J.; Scherle P. A.; Caulder E.; Wen X.; Li Y.; Waeltz P.; et al. Preclinical characterization of the selective JAK1/2 inhibitor INCB018424: therapeutic implications for the treatment of myeloproliferative neoplasms. Blood 2010, 115, 3109–3117. 10.1182/blood-2009-04-214957. [DOI] [PMC free article] [PubMed] [Google Scholar]
- Chrencik J. E.; Patny A.; Leung I. K.; Korniski B.; Emmons T. L.; Hall T.; Weinberg R. A.; Gormley J. A.; Williams J. M.; Day J. E.; et al. Structural and Thermodynamic Characterization of the TYK2 and JAK3 Kinase Domains in Complex with CP-690550 and CMP-6. J. Mol. Biol. 2010, 400, 413–433. 10.1016/j.jmb.2010.05.020. [DOI] [PubMed] [Google Scholar]
- Gasper R.; Vandenbussche G.; Goormaghtigh E. Ouabain-induced modifications of prostate cancer cell lipidome investigated with mass spectrometry and FTIR spectroscopy. Biochim. Biophys. Acta 2011, 1808, 597–605. 10.1016/j.bbamem.2010.11.033. [DOI] [PubMed] [Google Scholar]
- Travo A.; Desplat V.; Barron E.; Poychicot-Coustau E.; Guillon J.; Déléris G.; Forfar I. Basis of a FTIR spectroscopy methodology for automated evaluation of Akt kinase inhibitor on leukemic cell lines used as model. Anal. Bioanal. Chem. 2012, 404, 1733–1743. 10.1007/s00216-012-6283-1. [DOI] [PubMed] [Google Scholar]
- Denbigh J. L.; Perez-Guaita D.; Vernooij R. R.; Tobin M. J.; Bambery K. R.; Xu Y.; Southam A. D.; Khanim F. L.; Drayson M. T.; Lockyer N. P.; Goodacre R.; Wood B. R. Probing the action of a novel anti-leukaemic drug therapy at the single cell level using modern vibrational spectroscopy techniques. Sci. Rep. 2017, 7, 2649. 10.1038/s41598-017-02069-5. [DOI] [PMC free article] [PubMed] [Google Scholar]
- Kitamura T.; Tange T.; Terasawa T.; Chiba S.; Kuwaki T.; Miyagawa K.; Piao Y. F.; Miyazono K.; Urabe A.; Takaku F. Establishment and characterization of a unique human cell line that proliferates dependently on GM-CSF, IL-3, or erythropoietin. J. Cell. Physiol. 1989, 140, 323–334. 10.1002/jcp.1041400219. [DOI] [PubMed] [Google Scholar]; Li J.; Favata M.; Kelley J. A.; Caulder E.; Thomas B.; Wen X. M.; Sparks R. B.; Arvanitis A.; Rogers J. D.; Combs A. P.; et al. INCB16562, a JAK1/2 Selective Inhibitor, Is Efficacious against Multiple Myeloma Cells and Reverses the Protective Effects of Cytokine and Stromal Cell Support. Neoplasia 2010, 12, 28–38. 10.1593/neo.91192. [DOI] [PMC free article] [PubMed] [Google Scholar]
- Keretsu S.; Ghosh S.; Cho S. J. Computer aided designing of novel pyrrolopyridine derivatives as JAK1 inhibitors. Sci. Rep. 2021, 11, 23051. 10.1038/s41598-021-02364-2. [DOI] [PMC free article] [PubMed] [Google Scholar]
- Sanachai K.; Mahalapbutr P.; Choowongkomon K.; Poo-Arporn R. P.; Wolschann P.; Rungrotmongkol T. Insights into the Binding Recognition and Susceptibility of Tofacitinib toward Janus Kinases. ACS Omega 2020, 5, 369–377. 10.1021/acsomega.9b02800. [DOI] [PMC free article] [PubMed] [Google Scholar]
- Junhom C.; Weerapreeyakul N.; Tanthanuch W.; Thumanu K. FTIR microspectroscopy defines early drug resistant human hepatocellular carcinoma (HepG2) cells. Exp. Cell Res. 2016, 340, 71–80. 10.1016/j.yexcr.2015.12.007. [DOI] [PubMed] [Google Scholar]
- Gerwert K.; Kötting C.. Fourier Transform Infrared (FTIR) Spectroscopy, eLS; 2010. [Google Scholar]
- Movasaghi Z.; Rehman S.; ur Rehman D. I. Fourier Transform Infrared (FTIR) Spectroscopy of Biological Tissues. Appl. Spectrosc. Rev. 2008, 43, 134–179. 10.1080/05704920701829043. [DOI] [Google Scholar]
- Bellisola G.; Sorio C. Infrared spectroscopy and microscopy in cancer research and diagnosis. Am. J. Cancer Res. 2012, 2, 1–21. [PMC free article] [PubMed] [Google Scholar]
- Chaber R.; Kowal A.; Jakubczyk P.; Arthur C.; Łach K.; Wojnarowska-Nowak R.; Kusz K.; Zawlik I.; Paszek S.; Cebulski J. A Preliminary Study of FTIR Spectroscopy as a Potential Non-Invasive Screening Tool for Pediatric Precursor B Lymphoblastic Leukemia. Molecules 2021, 26, 1174. 10.3390/molecules26041174. [DOI] [PMC free article] [PubMed] [Google Scholar]
- Tvorogov D.; Thomas D.; Liau N. P. D.; Dottore M.; Barry E. F.; Lathi M.; Kan W. L.; Hercus T. R.; Stomski F.; Hughes T. P.; et al. Accumulation of JAK activation loop phosphorylation is linked to type I JAK inhibitor withdrawal syndrome in myelofibrosis. Sci. Adv. 2018, 4, eaat3834–eaat3834. 10.1126/sciadv.aat3834. [DOI] [PMC free article] [PubMed] [Google Scholar]; PubMed
- Aaronson D. S.; Horvath C. A Road Map for Those Who Don’t Know JAK-STAT. Science 2002, 296, 1653–1655. 10.1126/science.1071545. [DOI] [PubMed] [Google Scholar]
- Kontzias A.; Kotlyar A.; Laurence A.; Changelian P.; O’Shea J. J. Jakinibs: a new class of kinase inhibitors in cancer and autoimmune disease. Curr. Opin. Pharmacol. 2012, 12, 464–470. 10.1016/j.coph.2012.06.008. [DOI] [PMC free article] [PubMed] [Google Scholar]; PubMed; Schwartz D. M.; Kanno Y.; Villarino A.; Ward M.; Gadina M.; O’Shea J. J. JAK inhibition as a therapeutic strategy for immune and inflammatory diseases. Nat. Rev. Drug Discov. 2017, 17, 78. 10.1038/nrd.2017.267. [DOI] [PMC free article] [PubMed] [Google Scholar]; PubMed
- Coricello A.; Mesiti F.; Lupia A.; Maruca A.; Alcaro S. Inside Perspective of the Synthetic and Computational Toolbox of JAK Inhibitors: Recent Updates. Molecules 2020, 25, 3321. 10.3390/molecules25153321. [DOI] [PMC free article] [PubMed] [Google Scholar]
- Gaffney J. S.; Marley N. A.; Jones D. E. Fourier Transform Infrared (FTIR) Spectroscop\y. Charact. Mater. 2002, 1–33. [Google Scholar]; Haris P. I.; Chapman D. Does Fourier-transform infrared spectroscopy provide useful information on protein structures?. Trends Biochem. Sci. 1992, 17, 328–333. 10.1016/0968-0004(92)90305-S. [DOI] [PubMed] [Google Scholar]
- Lee M.; Rhee I. Cytokine Signaling in Tumor Progression. Immune Network 2017, 17, 214–227. 10.4110/in.2017.17.4.214. [DOI] [PMC free article] [PubMed] [Google Scholar]; PubMed
- Dolatabadi S.; Jonasson E.; Lindén M.; Fereydouni B.; Bäcksten K.; Nilsson M.; Martner A.; Forootan A.; Fagman H.; Landberg G.; et al. JAK-STAT signalling controls cancer stem cell properties including chemotherapy resistance in myxoid liposarcoma. Int. J. Cancer 2014, 145, 435–449. 10.1002/ijc.32123. [DOI] [PMC free article] [PubMed] [Google Scholar]; From N. L. M.; Hu Y.; Hong Y.; Xu Y.; Liu P.; Guo D. H.; Chen Y. Inhibition of the JAK/STAT pathway with ruxolitinib overcomes cisplatin resistance in non-small-cell lung cancer NSCLC. Apoptosis 2014, 19, 1627–1636. 10.1007/s10495-014-1030-z. [DOI] [PubMed] [Google Scholar]; From NLM
- Kusoglu A.; Bagca B. G.; Ay N. P. O.; Saydam G.; Avci C. B. Ruxolitinib Regulates the Autophagy Machinery in Multiple Myeloma Cells. Anti-Cancer Agents Med. Chem. 2020, 20, 2316–2323. 10.2174/1871520620666200218105159. [DOI] [PubMed] [Google Scholar]
- Han E. S.; Wen W.; Dellinger T. H.; Wu J.; Lu S. A.; Jove R.; Yim J. H. Ruxolitinib synergistically enhances the anti-tumor activity of paclitaxel in human ovarian cancer. Oncotarget 2018, 9, 24304–24319. 10.18632/oncotarget.24368. [DOI] [PMC free article] [PubMed] [Google Scholar]
- Lam C.; Murnane M.; Liu H.; Smith G.; Wong S.; Taunton J.; Liu J.; Mitsiades C.; Hann B.; Aftab B.; et al. Repurposing tofacitinib as an anti-myeloma therapeutic to reverse growth-promoting effects of the bone marrow microenvironment. Haematologica 2017, 1218. 10.1101/143206. [DOI] [PMC free article] [PubMed] [Google Scholar]
- Boyle D. L.; Soma K.; Hodge J.; Kavanaugh A.; Mandel D.; Mease P.; Shurmur R.; Singhal A. K.; Wei N.; Rosengren S.; et al. The JAK inhibitor tofacitinib suppresses synovial JAK1-STAT signalling in rheumatoid arthritis. Annals of the Rheumatic Diseases 2015, 74, 1311. 10.1136/annrheumdis-2014-206028. [DOI] [PMC free article] [PubMed] [Google Scholar]
- Williams N. K.; Bamert R. S.; Patel O.; Wang C.; Walden P. M.; Wilks A. F.; Fantino E.; Rossjohn J.; Lucet I. S. Dissecting specificity in the Janus kinases: the structures of JAK-specific inhibitors complexed to the JAK1 and JAK2 protein tyrosine kinase domains. J. Mol. Biol. 2009, 387, 219–232. 10.1016/j.jmb.2009.01.041. [DOI] [PubMed] [Google Scholar]
Associated Data
This section collects any data citations, data availability statements, or supplementary materials included in this article.