

Abstract
Alzheimer’s disease (AD) and Alzheimer’s disease-related dementias (ADRDs) affect 6 million Americans, and they are projected to have an estimated health care cost of $355 billion for 2021. A histopathological hallmark of AD and many ADRDs is the aberrant intracellular accumulation of the microtubule-associated protein tau. These neurodegenerative disorders that contain tau aggregates are collectively known as tauopathies, and recent structural studies have shown that different tauopathies are characterized by different “strains” of tau filaments. In addition, mutations in the gene that encodes for tau protein expression have been associated with a group of tauopathies known as frontotemporal dementias with parkinsonism linked to chromosome 17 (FTDP-17 or familial frontotemporal dementia). In vitro studies often use small molecules to induce tau aggregation as tau is extremely soluble and does not spontaneously aggregate under typical laboratory conditions, and the use of authentic filaments to conduct in vitro studies is not feasible. This study highlights how different inducer molecules can have fundamental disparities to how disease-related mutations affect the aggregation dynamics of tau. Using three different classes of tau aggregation inducer molecules, we characterized disease-relevant mutations in tau’s PGGG motifs at positions P301S, P332S, and P364S. When comparing these mutations to wild-type tau, we found that depending on the type of inducer molecule used, we saw fundamental differences in total aggregation, aggregation kinetics, immunoreactivity, and filament numbers, length, and width. These data are consistent with the possibility that different tau aggregation inducer molecules make different structural polymorphs, although this possibility would need to be confirmed by high-resolution techniques such as cryo-electron microscopy. The data also show that disease-associated missense mutations in tau impact tau aggregation differently depending on the mechanism of aggregation induction.
Introduction
Neurodegenerative disorders are often characterized by the aggregation of one or more proteins.1 In Alzheimer’s disease (AD) and Alzheimer’s disease-related dementias (ADRDs), the microtubule-associated protein tau (MAPT, UniProtKB—P10636) accumulates within neurons and glia of the central nervous system. These terminal maladies are not only devastating to the 6.2 million Americans who suffer from them but also cause patients to require round-the-clock care during advanced stages of disease. This effect is felt more broadly by society as AD and ADRDs are estimated to have associated health care costs of $355 billion in the United States for 2021 and an estimated 11 million unpaid caregivers.2 To make matters worse, the number of cases and associated costs of AD and ADRDs are expected to increase dramatically over the next few decades.
The aberrant accumulation of tau into beta sheet-enriched amyloid folds correlates strongly with the progression and severity of cognitive decline in AD patients.3 In AD, tau primarily accumulates into twisted paired helical filaments (PHFs) and untwisted straight filaments (SFs). Other tauopathies can include PHFs or SFs, but many are characterized by tau filaments dissimilar to those found in AD. ADRDs include Pick’s disease, progressive supranuclear palsy, corticobasal degeneration, chronic traumatic encephalopathy, and other frontotemporal dementias with parkinsonism linked to chromosome 17 (FTDP-17 or familial frontotemporal dementias—fFTD). FTDP-17 tauopathies are of particular interest to the research field because in addition to having tau accumulation as a histopathological hallmark, they have been associated with over 50 different intronic and exonic mutations of the MAPT gene that encodes the expression of all six isoforms of tau in the human adult central nervous system.4
The nomenclature of the six tau isoforms expressed in adults is based on the inclusion of 0, 1, or 2 N terminal domains, as well as the inclusion of three or four microtubule binding repeat domains (MTBR). This results in the 6 tau isoforms of the central nervous system being named 2N4R, 1N4R, 0N4R, 2N3R, 1N3R, or 0N3R.5 Each of the microtubule binding repeats ends with a PGGG motif. Interestingly, a P to S substitution mutation on three of the four PGGG motifs has been associated with cases of FTDP-17 at positions 301,6 332,7 and 3648 (numbering based on the full-length 2N4R human tau isoform). In addition, P301S is one of the most common mutations used in both in vitro and in vivo tau aggregation model systems, primarily due to the formation of PHF-like filaments, proaggregation properties, and relatively poor affinity toward microtubules.9 The PGGG motif found at the end of microtubule binding repeat 1, position 270, has not been associated with disease-linked mutations. Although recent structural studies of tau filaments isolated from disease have shown that this region of tau, MTBR 1, does form a part of the ordered filament core isolated from the three repeat tauopathy [Pick’s disease (PiD),10 it is not found as a part of the ordered fibril core of mixed 3R-4R tauopathies [AD11 and chronic traumatic encephalopathy (CTE),12 as well as the 4R tauopathy [corticobasal degeneration (CBD).13
In this study, we compare the aggregation characteristics of three of these FTDP-17 P to S mutations, as well as the nondisease-related P270S mutation, to wild-type (WT) 2N4R tau. We used site-directed mutagenesis to recombinantly express and purify each of the P to S mutations at positions 270, 301, 332, and 364 in the full-length isoform of human tau, 2N4R (HT40) (Figure S1).
However, because tau is natively unfolded, contains high numbers of both positively and negatively charged residues, and is highly soluble in solution, it is resistant to spontaneous aggregation.5 Therefore, biochemical “inducers” of tau aggregation are widely employed to initiate and enhance the aggregation of tau in vitro. One of the most commonly used tau aggregation inducers, heparin,14 induces polymorphic tau aggregate structures that are dissimilar to any structures found in filaments isolated from disease.14,15 Heparin is therefore not likely to be a useful model in studies characterizing and identifying tau aggregation-based therapeutics or the molecular dynamics of aggregation. Therefore, we chose three alternative inducers of tau aggregation for this study: the polyunsaturated fatty acid arachidonic acid (ARA), polyphosphate (polyP), and ribonucleic acid (RNA), although, to date, there have not been any high-resolution structures published of in vitro filaments of full-length 2N4R tau protein generated with these inducers.
We have previously found that ARA rapidly polymerizes tau to form filaments that have similar low-resolution gross morphological characteristics to straight filaments isolated from AD in terms of filament width and density.16,17 In addition, ARA is found within the intracellular environment at elevated levels during times of oxidative stress and could play numerous roles in the pathology of AD.18 Furthermore, antibodies raised against ARA-induced filaments have been shown to have a high affinity toward aggregated tau in diseased brain tissue.19,20 We have also shown that two different small-molecule tau aggregation inhibitors (TAIs), the isoquinoline ANTC-15 and the phenothiazine LMTX, appear to inhibit heparin and ARA-induced filaments in an inducer-specific manner.21 For example, ANTC-15 inhibits ARA-induced filaments but not heparin-induced filaments. Conversely, LMTX inhibits heparin-induced filaments but not those induced by ARA. It is therefore likely that the polymorphs formed from ARA and heparin induction are structurally distinct. PolyP is present in mammalian neurons and has been shown to induce the aggregation of tau in vitro.22−24 RNA has been shown to induce the aggregation of tau in vitro,25,26 and tau aggregates in disease can sequester RNA.27 Although the molecular ultrastructures formed by ARA, polyP, and RNA have not yet been determined for full-length 2N4R tau protein and it is unclear whether they play a direct role in tau aggregation in disease progression, they have the potential to form biologically relevant, and potentially disease relevant, aggregates of tau. It should be noted, however, that a recent publication has demonstrated that the quaking-induced conversion of 0N4R tau at 200 rpm for 96 h in the presence of polyA RNA produced filament structures similar to those of heparin-induced filaments and dissimilar to those found in disease,28 and a separate publication demonstrated that filaments of 2N4R induced by total mouse liver RNA formed cross-beta amyloid-like cores in the carboxy terminus that do not share obvious structural similarity to pathogenic structural polymorphs of tau aggregates.29
Using right-angle laser light scattering (LLS), transmission electron microscopy, and conformationally sensitive ELISA assays, we compared the maximum protein aggregation, filament length and numbers, and immunoreactivity of toxic tau species formed in vitro by WT tau and tau variants in the presence of different classes of inducers and different sizes of inducers within a class.
To our knowledge, this is not only the first study to complete a direct biochemical comparison of this group of disease-related mutations but also the first to directly compare multiple in vitro aggregation inducers to study biochemical characteristics of multiple disease-related mutations. Using this combination of approaches, we have found that not only different classes of tau aggregation inducer molecules can influence typical aggregation characteristics such as the length of filaments and the total amount and rate of aggregation but also the type of inducer used can have effects on the fundamental differences between WT tau and mutant constructs and immunoreactivity toward conformationally sensitive antibodies. The data strongly support the hypothesis that filaments formed in the presence of different inducer molecules have different characteristics in terms of the amount of aggregation, the number and length distributions of aggregates, the dynamics of aggregation, assay compatibility, and immunoreactivity. These findings illustrate the importance of identifying disease-relevant inducer molecules to be used in studies of characterizing disease-related mutations.
Materials and Methods
Chemicals and reagents: Full-length 2N4R tau (HT40, 441 amino acids, UniProtKB—P10636) and all mutant constructs were expressed and purified as previously described.30 Using the HT40 Pt7c WT construct, amino acid substitutions were introduced using a QuikChange II XL site-directed mutagenesis kit (200521) purchased from Agilent (Santa Clara, CA). After transformation into BL21-Gold (DE3) competent cells, protein was expressed and purified using Ni-His Tag affinity purification and size exclusion chromatography. King et al. have shown that the poly-histidine tag does not appear to influence 2N4R tau aggregation and therefore was not removed prior to concentration quantification and subsequent in vitro studies.16 The concentration of protein was quantified using a Pierce BCA protein assay kit (23225) purchased from Thermo Fisher Scientific (Rockford, IL), and each protein prep was at a concentration between 1 and 2 mg/mL. Tau purity and concentration were confirmed by SDS PAGE. Individual aliquots of 50–100 μL were prepared and stored at −80 °C, and a fresh aliquot was used for each experiment to avoid repeated freeze/thaw cycles. ARA (90010) was purchased from Cayman Chemical (Ann Arbor, MI). Pure sodium polyphosphate (AC390932500), herein referred to total polyphosphate, was used to optimize aggregation conditions with WT 2N4R tau and was purchased from Fisher Scientific (Hampton, NH). The polyphosphate medium chain [P100 (EUI005)—a heterogenous mixture with most chains being between 45 and 160 phosphate units, with a modal size of 75 phosphates and a purity of <1% monophosphate] and long chain [P700 (EUI002)—a heterogenous mixture with most chains between 200 and 1300 phosphate units with a modal size of 700 phosphates and a purity of <1% monophosphate] were purchased from Kerafast (Boston, MA). TOC1, TNT1, and Tau 5, Tau 7, and Tau 12 antibodies were a kind gift from Dr. Nicholas Kanaan, Michigan State University. Each of these antibodies was at a concentration of approximately 1 mg/mL. The T22 antibody (ABN454) was purchased from Millipore Sigma (Burlington, MA). The primary detection antibody (Tau 5, 7, and 12 were used as primary detection against the T22 capture antibody) was an anti-tau polyclonal rabbit antibody (A002401-2) purchased from Agilent (Santa Clara, CA). A goat anti-rabbit IgG (H + L) and goat anti-mouse IgG (H + L) antibody with the HRP conjugate (1706515 and 1706516, respectively, Bio-Rad, Hercules, CA) was used as a secondary detection antibody. A Qiagen miRNeasy mini kit (217004) and Qiagen RNeasy MinElute clean up kit (74204) were purchased from Qiagen (Germantown, MD). HEK293T cells (ATCC CRL-3216) were kindly provided by Dr. David Davido, University of Kansas. Mini Trans-Blot precut filter paper (1703932) and a 0.22 μm nitrocellulose membrane (16020112) were purchased from Bio-Rad (Hercules, CA). The chemiluminescent kit was a Supersignal West pico plus chemiluminescent substrate (34577) purchased from Thermo Scientific (Rockford, IL).
RNA Isolation
Mammalian RNA was isolated from HEK293T cells using two different procedures. HEK293T (ATCC CRL-3216) cells were maintained in Dulbecco’s modified Eagle’s medium (Cytiva) and supplemented with 5% fetal bovine serum (FBS), 2 mM l-glutamine, 10 U/mL penicillin, and 10 U/mL streptomycin. Cells were grown in a BioLite 175 cm2 vented flask (Thermo Scientific) and maintained in a humidified incubator containing 5% CO2 at 37 °C.
To isolate the small RNA (RNA < 200 nts) and long RNA (RNA > 200 nts) separately, a modified version of the Qiagen miRNeasy mini kit and MinElute cleanup kit isolation procedure was used to isolate samples into small RNA or long RNA fractions. The cells were lysed using the QIAzol lysis reagent by adding 8.75 mL to the cell-culture dish. The lysate was collected and vortexed to mix and then stored in 700 μL aliquots at −80 °C. After thawing, the homogenate was incubated at room temperature (∼20 °C) for 5 min. Under a fume hood, 140 μL of chloroform was added to the tube containing the homogenate and vortexed vigorously for 15 s. The tube was incubated at room temperature for 2–3 min and then centrifuged for 15 min at 12,000×g at 4 °C. The upper aqueous phase was transferred to a new collection tube, and 1 volume of 70% ethanol was added and mixed thoroughly by vortexing. The sample was pipetted into an RNeasy Mini spin column placed in a 2 mL collection tube and centrifuged at 10,000×g for 15 s at room temperature (15–25 °C). The flow-through was pipetted into a 2 mL reaction tube. The used spin column was set aside to isolate long RNA. 100% ethanol (450 μL) was added to the flow-through and mixed thoroughly by vortexing. The sample (700 μL) was pipetted into an RNeasy MinElute spin column placed in a 2 mL collection tube and then centrifuged for 15 s at 10,000×g at room temperature. The flow-through was then discarded, and this was repeated until the whole sample had been pipetted into the spin column. Buffer RPE (500 μL) was then pipetted into the RNeasy MinElute spin column and centrifuged for 15 s at 10,000×g, and the flow-through was discarded. Next, 500 μL of 80% ethanol was added to the RNeasy MinElute spin column and centrifuged for 2 min at 10,000×g to dry the spin column membrane. The flow-through and collection tube were discarded. The spin column was placed into a new 2 mL collection tube and centrifuged for 5 min at 10,000×g. The RNeasy MinElute spin column was then placed into a 1.5 mL collection tube, and 14 μL of RNase-free water was pipetted onto the spin column membrane. It was then centrifuged for 1 min at 10,000×g to elute the small RNA-enriched fraction.
Using the previously reserved RNeasy Mini spin column, the long RNA was eluted. Buffer RWT (700 μL) was added into the RNeasy Mini spin column and centrifuged for 15 s at 10,000×g to wash the spin column membrane. The flow-through was discarded, and 500 μL of Buffer RPE was added to the RNeasy Mini spin column. It was centrifuged for 15 s at 10,000×g, and the flow-through was discarded. Another 500 μL of Buffer RPE was added into the RNeasy Mini spin column and centrifuged for 15 s at 10,000×g. The flow-through and collection tube were discarded. The RNeasy Mini spin column was placed in a new 2 mL collection tube and centrifuged at 16,000×g for 1 min. The RNeasy Mini spin column was then placed into a new 1.5 mL collection tube, and 30 μL of RNase-free water was pipetted directly onto the spin column membrane. It was centrifuged for 1 min at 10,000×g to elute the total RNA. This process was repeated for all samples of HEK293T cells. After this protocol was completed, a high-sensitivity RNA TapeStation was used to run 2 μL samples of both fractions of RNA to confirm the size fractioning, the results of which showed that significant size fractioning was achieved (Figure S2).
To determine the concentration of the differing RNA samples, readings were taken using a nanodrop and diluted to a concentration of 270 ng/μL using RNase-free water. The molar concentration for the small RNA sample was estimated by assuming a modal size of 100 nucleotides (Figure S2) and an average molecular weight of 330 g/mol per nucleotide. The molar concentration for the long RNA sample was estimated by assuming a modal size of 2471 nucleotides (∼30% 1150 nucleotides and ∼70% 3000 nucleotides, Figure S2) also with an average molecular weight of 330 g/mol per nucleotide. The samples were stored at −80 °C until used in reactions.
Aggregation Reactions
Reactions were set up using each of the P to S tau mutations, P270S, P301S, P332S, and P364S, as well as WT tau. A no tau–inducer-only negative control and no inducer–tau-only negative control were also prepared and incubated with all other samples. Each mutant and WT tau were induced with small RNA, long RNA, P100, P700, or ARA in separate reaction tubes. All endpoint reactions were performed in 1.5 mL reaction tubes with a total volume of 200 μL. All reactions used to study aggregation kinetics were completed in a 5 mm × 5 mm optical glass fluorometer cuvette (Starna Cells, Atascadero, CA) also at a final volume of 200 μL. Ultrapurified molecular biology-grade H2O was added first, followed by 4 μL of 250 mM DTT, to the reaction tube and mixed by pipetting and lightly tapping the reaction tube. NaCl (1 M) was added to bring the final NaCl concentration to 100 mM for ARA reactions or 25 mM for polyphosphate and RNA reactions. Again, each sample was mixed by pipetting and gentle tapping. HEPES at a pH of 7.64 was added in an 8 μL volume of 250 mM to a final concentration of 10 mM. After mixing by pipetting and gentle tapping, 20 μL of 1 mM EDTA stock was added in the same manner for a final concentration of 0.1 mM.
To ensure that RNase activity did not degrade the RNA inducer, a stock of EDTA, HEPES, NaCl, and DTT was also made using DEPC-treated H2O. However, there were no significant changes to RNA-induced aggregation of WT tau using DEPC-treated reagents when compared to preliminary studies that did not use DPEC-treated H2O (data not shown). Either WT or mutated tau was then added to a final concentration of 2 μM and mixed by pipetting and gently tapping. The inducer was then added as follows to the respective samples: 10 μL of either small RNA or long RNA was added for a final RNA concentration of 13.5 ng/μL (approximately 0.4 μM for small RNA and approximately 0.02 μM for long RNA), 10 μL of either P100 or P700 was added for a final concentration of 10 ng/μL (approximately 1.4 μM for P100 and approximately 0.2 μM for P700), and 7.5 μL of 2 mM ARA diluted in 100% ethanol was added to give a final concentration of 75 μM ARA 3.75% ethanol. For the controls, a Sup200 buffer (250 mM NaCl, 10 mM HEPES, 0.1 mM EGTA, pH 7.64) was used in place of the tau and RNase-free water was used in place of the RNA inducer, molecular biology-grade H2O was used for no polyphosphate control, and 7.5 μL of ethanol was used for the no ARA control. The reaction tubes were then incubated without agitation at 37 °C for 72 h for RNA, 48 h at 37 °C for polyphosphate, and 20 h at 25 °C for ARA.
Sandwich ELISA
Following aggregation reactions, samples were analyzed using a modified sandwich ELISA assay based on previously described conditions.21,31 The capture antibody was used to coat Corning 3590 EIA/RIA 96-well microplate wells at a volume of 100 μL/well of either TOC1 (2 ng/μL), TNT1 (1 ng/μL), T22 (1 ng/μL), or a mixture of Tau 5, Tau 7, and Tau 12 antibodies (referred to as 5, 7, 12) (1 ng/μL each). Capture antibodies were diluted in borate saline buffer (BSB) capture buffer (100 mM boric acid, 25 mM sodium tetraborate, 75 mM NaCl, 250 μM thimerosal, pH 8.56). Plates were then sealed and incubated with gentle agitation overnight at 4 °C. After capture antibody incubation, the plate was blotted and washed 2× with 300 μL/well of BSB wash buffer (100 mM boric acid, 25 mM sodium tetraborate, 75 mM NaCl, 250 μM thimerosal, 60 μM BSA, 0.1% Tween 20, pH 8.56). Plates were then blocked and incubated for a further 1.5 h with 300 μL of 5% nonfat dry milk (NFDM) dissolved in BSB wash buffer, then sealed and incubated at room temperature with gentle agitation. Samples were diluted in 5% NFDM BSB wash buffer to a concentration of 100 nM for the TOC1 capture antibody, 25 nM for TNT1, 50 nM for T22, and 50 nM for 5, 7, 12. To provide an internal standard curve, dilution series of no compound polymer and monomer controls were added to the plate in the range of 3.125–400 nM for TOC1, 3.125–75 nM for TNT, and 1.5–150 nM for T22. In our hands, the EC50 of the polymerized tau affinity curve was found to be 105, 28, and 35 nM for TOC1, TNT1, and T22 respectively. As 5, 7, 12 detects total tau, only a monomer standard curve was used at dilutions of 5–200 nM. Samples were added to a volume of 100 μL/well. Plates were sealed and incubated with gentle agitation for 1.5 h at room temperature. Following incubation, plates were washed 2× using BSB wash buffer. A primary detection antibody was added at volumes of 100 μL/well. For TNT1, TOC1, and 5, 7, 12, the polyclonal rabbit detection antibody diluted to a concentration of 50 ng/mL in 5% NFDM BSB wash buffer was added. For the T22 capture antibody, 5, 7, 12 was added at a concentration of 1:1000 dilution. Further incubation was carried out after sealing the plate at room temperature for 1.5 h with gentle agitation. Following incubation with the primary detection antibody, plates were washed 2× using BSB wash buffer before the addition of an appropriate secondary detection antibody (100 μL/well of the goat anti-rabbit IgG for TOC1, TNT1, and 5, 7, 12 capture antibody, and 100 μL/well of goat anti-mouse IgG for the T22 capture antibody). Both secondary detection antibodies were diluted 1:5000 in 5% NFDM BSB wash buffer. The plate was sealed and incubated at room temperature with gentle agitation for 1.5 h. After incubation, plates were washed 3× using BSB wash buffer before the addition of 50 μL per well of the tetramethylbenzidine (TMB) substrate. Plates were then covered and incubated with gentle agitation at room temperature for 20 min before the addition of 50 μL of a 3.6% H2SO4 stop solution. Readings were taken at an absorbance of 450 nm using a Varian Cary 50 UV–vis spectrophotometer with a Varian Cary microplate reader. Raw data readings were zeroed against a monomeric control of each mutant and then converted to % light absorbance. As a positive control, a sandwich ELISA using the 5, 7, 12 capture antibody (total tau) and the rabbit polyclonal detection antibody (total tau) on the polymerization reactions with ARA, P100, P700, sRNA, and lRNA was normalized against the monomeric protein for each mutation and WT to confirm that any differences observed with TOC1, TNT1, and T22 capture antibodies were due to differences in the aggregation state (Figures S3 and S4). Statistical analyses were completed using an un-paired t-test to compare each mutation to WT 2N4R for TOC1, TNT1, and T22 ELISAs. In the case of 5, 7, 12, a Tukey’s multiple test was completed. For both tests, the statistical significance was defined as *p ≤ 0.05; **p ≤ 0.01; ***p ≤ 0.001.
For this experiment, four different capture antibodies were used, 5, 7, 12 (a mixture of three monoclonal total tau antibodies that bind to residues 9–18 tau-12,32 218–225 tau-5, and 430–441 tau-7,33), TNT119 (binds to the phosphatase activating domain epitope at residues 7–12 that are made accessible through tau fibrilization), TOC120 (recognizes an epitope between residues 209–224 with a high affinity for small tau oligomers and larger aggregates), and T2234 (has been shown to bind specifically to tau oligomers that have been seeded using Aβ42 oligomers and in vitro heparin induced oligomers). All epitope residue numbers are based on full-length 2N4R tau (441 residues).
Transmission Electron Microscopy
Samples were diluted 1:10 in polymerization buffer and fixed with 2% glutaraldehyde for 5 min at room temperature. The samples were then affixed to a 300-mesh carbon formvar-coated copper grid, purchased from Electron Microscopy Sciences, (Hatfield, PA) by floating the grid on a 10 μL droplet of sample for 1 min. The grid was then blotted on filter paper and washed on a droplet of ddH2O before being blotted and stained by floating the grid on a droplet of 2% uranyl acetate as previously described.35 Each grid was imaged using a JEOL JEM 1400 transmission electron microscope fitted with a LaB6 electron source (Electron Microscopy Research Lab, University of Kansas Medical Center). Five random images per grid were taken at a 5000× magnification (to improve statistical power, 15 images were taken for both small RNA- and long RNA-induced filaments). Images were analyzed using Image Pro Plus 6.0 software by measuring the number, length, area, and perimeter of filaments >25 nm in length. Under our experimental conditions, it is very difficult to identify filaments less than 25 nm. To avoid erroneous results, the assay has been limited to measuring tau filaments and oligomers greater than 25 nm. Filament width measurements were taken using Image Pro Plus 6.0 software on high magnification images taken at a magnification of 30,000×. The measurements were made by manually drawing a line from one side of a filament to the other and measuring the length of the line. Filament width measurements were taken approximately every 50 nm of the filament length (avoiding areas where filaments overlapped) until 100 filament width measurements were taken. For shorter filaments (∼130 nm), 2–3 width measurements were taken, and for longer filaments (∼750 nm), approximately 14–15 measurements were taken. Statistical analysis was performed using ordinary one-way ANOVA with Tukey’s multiple comparisons test in GraphPad Prism 9 (p < 0.05*; **p < 0.01**; p < 0.001 ***; and p < 0.0001****).
Right-Angle Laser Light Scattering
Aggregation reactions were analyzed using right-angle LLS, as previously described,36 to determine the amount of aggregated material. The average light intensity measured for each sample was zeroed against a no inducer monomeric control for the respective tau mutant being imaged and a no tau/inducer-only control by subtracting the background signal from the measured signal of the endpoint aggregation reactions. Briefly, samples were transferred to a 5 mm × 5 mm optical glass fluorometer cuvette (Starna Cells, Atascadero, CA) in the light path of a 532 nm wavelength 12 mW solid-state laser operating at 7.6 mW (B&W Tek Inc. Newark, DE), and images were captured using a Sony XC-ST270 digital camera with an aperture of f/5.6. Images were analyzed using Adobe Photo Shop 2021 by taking histogram readings of the pixel intensity across the scattered light path.
Right-Angle Laser Light Scattering Kinetics of Aggregation
Using the right-angle LLS assay described above, samples were placed into a cuvette at time zero prior to the addition of the respective inducer molecule. An image was captured prior to induction and at time 0 immediately after induction of each protein with either ARA, P100, or P700 as inducers. In the case of ARA, readings were taken every 5 min between 0 and 30 min post induction (p.i), then at 45, 60, 90, and 120 min p.i., and then every hour until 6 h p.i. In the case of P700, images were taken at subsequent time points every 5 min p.i. for the first 60 min p.i. and then at the following p.i. time points: 1.5, 2, 3, 4, 6, 8.5, 10 h 40 min, 15, and 16 h. In the case of P100, images were taken at the same timepoint p.i. as for P700 (except 16 h p.i.) with additional readings at 24 and 48 h. The resulting polymerization curves were fit by nonlinear regression to a plateau followed by a one-phase exponential curve, a Finke-Watzky two-step model,37 and a three-parameter Gompertz growth function38 in GraphPad Prism 9. The plateau followed by the one-phase exponential curve consistently gave the best fit to all data sets, especially at early time points (Figure S5). We used the plateau followed by the one-phase exponential equation
where X0 is the time at which the association begins and can be fit manually by visual inspection and determination of goodness of fit or fit by GraphPad Prism 9; Y0 is the average value of Y up to time X0 (typically constrained to a value greater than 0); plateau is the Y value at infinite times (Ymax); and K is the rate constant, expressed in reciprocal of the X axis time units, and each individual curve was fit to determine the best-fit values of X0, K, and Ymax. The average values of X0, K, and Ymax for three independent experiments ± standard deviation were compared for each condition. Anomalous background light scattering by sRNA and lRNA prevented any meaningful fit of the data to any of the three models (Figure S6).
Thioflavin Fluorescence
A standard assay in tau aggregation studies is thioflavin fluorescence which uses thioflavin S or thioflavin T. Although thioflavin fluorescence is a useful tool in monitoring ARA and polyphosphate-induced filament formation, we found that RNA gave a false positive result when using thioflavin T and quenched fluorescence of thioflavin S (data not shown).
Dot-Blot Assay
A 0.22 μm nitrocellulose membrane was presoaked for 10 min in tris buffered saline (TBS—500 mM NaCl, 20 mM Tris, pH 7.5). Polymerized 2N4R tau samples were diluted to a concentration of 20 ng/uL in TBS and added to the membrane using a dot-blot manifold (no vacuum). Samples were incubated on the membrane for 30 min at room temperature before removal of excess liquid and blocking the membrane with 5% nonfat dried milk (NFDM) in TBST (TBS + 0.05% Tween 20). The membrane was blocked for 1.5 h with gentle agitation at room temperature. After incubation, the membrane was washed for 5 min 3× with TBST. The T22 primary detection antibody was diluted at 1:1000 concentration in 5% NFDM in TBST, and the membrane was submerged in T22 and incubated at room temperature for 2 h with gentle agitation. The secondary antibody (goat anti-rabbit IgG) was diluted in 5% NFDM in TBST to a 1:3000 concentration. The membrane was washed 2× in TBST, before being submerged in the secondary antibody at room temperature for 2 h with gentle agitation. The membrane was once again washed for 5 min 2× using TBST before being developed using a Thermo Fisher Supersignal West Pico Plus chemiluminescent substrate. An image of the blot was taken using a UVP Chemidoc IT2 Western blot imager and analyzed using Adobe Photoshop software using the histogram function to measure dot-blot intensity (Figure S7).
Results
Inducing WT Tau Aggregation
To initiate the aggregation of 2 μM 2N4R WT tau, we employed ARA (75 μM ARA) under high salt conditions (100 mM NaCl), polyphosphate (polyP) with average chain lengths of 100 and 700 (∼1.4 μM P100 and ∼0.2 μM P700, respectively), and human RNA separated by size to generate RNA mixtures less than 200 nucleotides and greater than 200 nucleotides (∼0.4 μM sRNA and ∼μM 0.02 lRNA, respectively) under low salt conditions (25 mM) (Figure 1). Conditions for the ARA induction were chosen because this ratio of ARA to 2N4R tau has previously been shown to be the optimal conditions for ARA.39 P100, P700, sRNA, and lRNA gave better results using low-salt conditions similar to those optimal for the heparin induction of tau aggregation39 (data not shown). The inducer concentrations for P100 and P700 were determined using the peak induction concentration for total polyphosphate (Figure S8), and peak inducer concentrations for sRNA and lRNA were determined directly (Figure S9). Using LLS, semi-quantitative transmission electron microscopy (TEM), and sandwich-enzyme-linked immunosorbent assays (sELISAs), we were able to compare total aggregation (Figures 1K,L), number of filaments (Figure 1M), average filament length (Figure 1N), and immunoreactivity toward TNT1 (Figure 1O), TOC1 (Figure 1P), and T22 (Figure 1Q) conformationally sensitive antibodies.
Figure 1.

LLS, TEM, and ELISA endpoint measurements of WT aggregation reactions. Representative TEM micrographs at both high magnification (30,000 X) (A–E) and low magnification (5000 X) (F–J) of endpoint aggregation of 2 μM 2N4R WT tau induced with 75 μM ARA (A,F), 10 ng/mL (∼1.4 μM) P100 (B,G), 10 ng/mL (∼0.15 μM) P700 (C,H), 13.5 ng/mL (∼0.4 μM) sRNA (D,I), and 13.5 ng/mL (∼0.02 μM) lRNA (E,J). The scale bar in figure (E) represents 100 nm for figures (A–E). The scale bar in figure (J) represents 500 nm for figures (F–J). (K) Endpoint total amount of induced aggregation of WT 2N4R tau, quantified using LLS (n = 3 ± s.d). Five TEM micrographs selected at random from a single electron microscope grid were quantified to measure the (L) total filament mass of each micrograph ± s.d., (M) average number of filaments (>25 nm) per micrograph ± s.d., and (N) average induced filament length (>25 nm) ± s.d. (O) A total of 100 filament width measurements were taken for each of the inducers. Bars represent the mean ± s.d. Immunoreactivity was measured by sandwich ELISA using capture antibodies TNT1 (P), TOC1 (Q), and T22 (R). In figures (P–R), the Y-axis represents the % light absorbed value (converted from A450 reading). Error bars represent ± s.d of three independent experiments. Statistical analysis was performed using ordinary one-way ANOVA with Tukey’s multiple comparisons test in GraphPad Prism 9 [p < 0.05 (*); **p < 0.01 (**); p < 0.001 (***); and p < 0.0001(****)].
LLS readings at the apparent steady state of the aggregation reactions indicated that ARA and P100 induced the greatest amount of tau aggregation, with P700 aggregation induction being slightly lower. The amount of total aggregation induced with both sRNA and lRNA is dramatically decreased when compared to ARA, P100, and P700 (Figure 1K). We then compared the reactions using negative stain transmission electron microscopy (TEM). A comparison of the total amount of filament formation detected (sum of all filament lengths per micrographs) gave the expected result that the amounts of aggregation induced by ARA and P100 were similar and dramatically greater than that observed with sRNA and lRNA (Figure 1L). Surprisingly, P700 induction yielded more filament formation than either ARA or P100, but the large degree of variability in filament numbers and average filament lengths from different micrographs could indicate that P700 filaments are unevenly distributed on the EM grid.
High-magnification TEM micrographs (Figure 1A–E) and low-magnification TEM micrographs (Figure 1F–J) show differences in the number and length distributions between the different classes of inducers. For example, ARA induces many short filaments with an average length of ∼130 nm, whereas P100 forms filaments with an average length of ∼500 nm (Figure 1N). sRNA and lRNA both formed substantially fewer filaments than either ARA, P100, or P700 (Figure 1M), but these filaments tended to be longer than what was observed with other inducers (Figure 1N). ARA filaments were significantly wider than polyP filaments and RNA filaments (Figure 1O). RNA filaments were significantly wider than polyP filaments, but there was no significant difference between P100 and P700 or sRNA and lRNA (Figure 1O). There were occasional images that could indicate higher resolution morphological differences, such as differences in width resembling helical filament cross-overs with P100 (Figure 1B) and sRNA (Figure 1D), but the variations in the negatively stained images and the presence of the filament fuzzy coat made any meaningful quantitation of these changes prohibitive.
We also compared the amount of aggregation detected by three different conformationally sensitive antibodies that preferentially recognize aggregated tau. TNT1 measurement of aggregation gave results that appear to reflect the total amount of aggregation measured using LLS and TEM, with ARA, P100, and P700 having similar levels of aggregation and sRNA and lRNA having very low levels of aggregation (Figure 1P). However, P100 and P700 aggregates had a lower TOC1 detection level than ARA (although this difference did not reach statistical significance by ordinary one-way ANOVA and Tukey’s multiple comparison test, Figure 1Q). Only ARA-induced tau aggregates had T22 reactivity in the sandwich ELISA format (Figure 1R), although we could see some (highly variable) T22 reactivity for P100, P700, sRNA, and lRNA using a dot blot assay (Figure S7).
Kinetics of Induced WT Tau Aggregation
In addition to studying total aggregation, filament numbers and length distributions, and immunoreactivity, we also compared the kinetics of aggregation of WT tau in the presence of ARA (Figure 2A), P100 (Figure 2B), P700 (Figure 2C), sRNA (Figure 2D), and lRNA (Figure 2E) using LLS. Reactions were measured at regular time intervals until an apparent steady state was reached. Figure 2F shows that the apparent steady state differed greatly among the different inducers. Both sRNA- and lRNA-induced aggregates showed high levels of light scattering at time zero (Figure S6), and therefore, it was not possible to calculate the rate of aggregation or lag time using a plateau followed by one-phase association nonlinear regression model. However, we were able to measure the maximum polymerization (Figure 2G) and validated these results by visualizing the filaments using TEM.
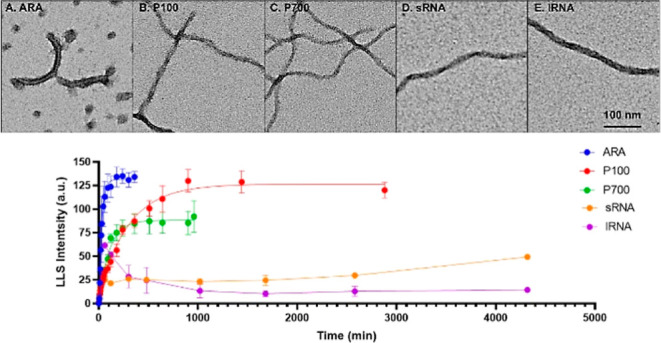
Figure 2.

Kinetics of induced WT tau aggregation as measured by LLS. LLS intensities (y-axis) at different time points (x-axis) were measured for three independent reactions using 2 μM 2N4R WT tau induced with 75 μM ARA (A), 10 ng/mL (∼1.4 μM) P100 (B), 10 ng/mL (∼0.15 μM) P700 (C), 13.5 ng/mL (∼0.4 μM) sRNA (D), and 13.5 ng/mL (∼0.02 μM) lRNA (E). Data were fit to a nonlinear regression model: plateau (lag) followed by a one-phase association equation in GraphPad Prism 9. Aggregation curves of each inducer are shown together in figure (F) for comparison. Maximum polymerization (G), rate of polymerization (H), and lag time (I) were calculated to compare each of the inducers (goodness of fit for sRNA and lRNA was insufficient to include values for rate and lag). Error bars represent ± s.d. of three independent experiments. Statistical analysis was performed using ordinary one-way ANOVA with Tukey’s multiple comparisons test in GraphPad Prism 9 [p < 0.05 (*); **p < 0.01 (**); p < 0.001 (***); and p < 0.0001(****)].
Using a nonlinear regression equation, the plateau followed by one-phase association, we were able to compare the lag time and rate of polymerization of aggregates induced with ARA, P100, and P700. ARA had the fastest rate of polymerization (Figure 2H) and longest lag time (Figure 2I). Although P100 and P700 had similar very short lag times, P700 appeared to have a slightly higher rate of polymerization when compared with P100 (Figure 2H).
Effect of P to S Mutations on ARA-Induced Aggregation
To study the effect of disease-related missense mutations on ARA-induced aggregation, we compared each of the P to S mutations in a 2N4R tau isoform to WT 2N4R by completing endpoint aggregation reactions (Figure 3). The most notable changes occurred with the P301S mutation, leading to an increase in total polymerization as measured by LLS (Figure 3A). Although the average total filament mass of P301S as measured by TEM (Figure 3B) was also greater than that of the WT, there was a high level of variability among the images analyzed. The P301S mutation led to a decrease in the number of filaments (Figure 3C) and an increase in average filament length (Figure 3D). As measured by both LLS and TEM total filament mass, P332S mutation caused a decrease in the total aggregation (Figure 3A,B). The P332S mutation also decreased the number of filaments, but had no effect on the average filament length (Figure 3C,D). The P270S mutation increased the number of filaments and decreased the average filament length. The P364S mutation appeared to have no effect on total aggregation as measured by LLS and TEM or on the average filament length and number of filaments.
Figure 3.

LLS, TEM, and ELISA endpoint measurements of P to S mutations induced by ARA. (A) Endpoint total amount of induced aggregation of each P to S mutation at 2 μM induced with 75 μM ARA quantified using LLS (n = 3 ± s.d). TEM micrographs selected at random were quantified to measure the (B) total filament mass of each micrograph ± s.d., (C) average number of filaments (>25 nm) per micrograph ± s.d., and (D) average induced filament length (>25 nm) ± s.d. Immunoreactivity as measured by sandwich ELISA using capture antibodies TOC1 (E), TNT1 (F), and T22 (G). In figures (E–G), the y-axis represents the % light absorbed value (converted from A450 reading). Error bars represent ± s.d. of three independent experiments. All results were compared to average measurements of 2 μM WT tau induced with 75 μM ARA ± 95% CI (gray-shaded box) using an unpaired t-test (p < 0.05 *, p < 0.01 **, and p < 0.001 ***).
None of the mutations caused any difference in immunoreactivity using the TOC1 (Figure 3E) and TNT1 (Figure 3F) antibodies; however, T22 (Figure 3G) reactivity was reduced by the P301S, P332S, and P364S mutations.
Kinetic Measurement of P to S Mutations Induced by ARA
Aggregation kinetics induced with ARA were monitored by LLS using P270S (Figure 4A), P301S (Figure 4B), P332S (Figure 4C), and P364S (Figure 4D). Each of the P to S mutations aggregation curves was compared to WT tau. When comparing WT tau to P270S, P332S, and P364S, there was no noteworthy change in the maximum polymerization, rate of aggregation, and lag time (Figure 4E–G). However, the P301S mutation caused a clear increase in maximum polymerization, consistent with the results of the LLS endpoint reactions (Figure 4E). In addition, the P301S mutation caused an increase in the lag time when compared to the WT (Figure 4F). Although none of the P to S mutations appeared to affect the average rate of polymerization, data points measured for P270S and P332S appeared to be much more variable than those for the WT (Figure 4G). Typically, a longer lag time and slower rate of polymerization are indicative of fewer filaments with a longer average filament length. Therefore, the results from these aggregation kinetic experiments support, at least in part, the findings from the TEM studies (Figure 3).
Figure 4.

Kinetics of ARA-induced aggregation of P to S mutations measured by LLS. LLS intensity (y-axis) at different time points (x-axis) were measured for three independent reactions using 2 μM P270S (A), P301S (B), P332S (C), and P364S (D) in the presence of 75 μM ARA. Data were fit to a nonlinear regression plateau followed by a one-phase association model. Aggregation curves of each mutant are compared to 2 μM WT tau (gray solid circles). Maximum polymerization (E), rate of polymerization (F), and lag time (G) were calculated to compare each of the inducers. Error bars ± s.d. of three independent experiments. All results were compared to average measurements of WT tau induced with ARA ± 95% CI (gray shaded box) in figures (E–G) using an unpaired t-test (p < 0.01**).
Effect of P to S Mutations on P100-Induced Aggregation
We compared each of the P to S mutations to WT tau aggregation when induced with P100 (Figure 5). These results were different from those previously seen with ARA as the P270S mutation resulted in a slight decrease and P301S caused no change in the total aggregation as measured by LLS (Figure 5A). Both P332S and P364S showed a decrease in total filament mass as measured by TEM (Figure 5B). This change appears to be due to a large decrease in the number of filaments (Figure 5C) rather than the average length of filaments, which was found to increase with these two mutations (Figure 5D). In general, the TEM results from experiments using P100 appeared to have larger variability than those conducted using ARA as an inducer. None of the mutations showed any effect on the immunoreactivity of P100-induced aggregates (Figure 5E–G). Each of the mutations had no reactivity with T22 reactivity, as was previously seen with WT tau in Figure 1Q.
Figure 5.

LLS, TEM, and ELISA endpoint measurements of P to S mutations induced by P100. (A) Endpoint total amount of induced aggregation of each P to S mutation at 2 μM induced with ∼1.4 μM P100 quantified using LLS (n = 3 ± s.d). TEM micrographs selected at random were quantified to measure the (B) total filament mass of each micrograph ± s.d, (C) average number of filaments (>25 nm) per micrograph ± s.d., and (D) average induced filament length (>25 nm) ± s.d. Immunoreactivity as measured by sandwich ELISA using capture antibodies TOC1 (E), TNT1 (F), and T22 (G). In figures (E–G), the y-axis represents the % light absorbed value (converted from A450 reading). Error bars represent ± s.d. of three independent experiments. All results were compared to average measurements of 2 μM WT tau induced with ∼1.4 μM P100 ± 95% CI (gray shaded box) by an unpaired t-test (p < 0.05*, p < 0.01**, and p < 0.001***).
Kinetic Measurement of P to S Mutations Induced by P100
Similar to the ARA aggregation studies, we used LLS to monitor protein aggregation over time (Figure 6). The average maximum LLS of P270S (Figure 6A), P301S (Figure 6B), and P332S (Figure 6C) was similar to that of the WT. However, P364S (Figure 6D) maximum LLS was slightly lower compared to WT tau. Due to the lack of measurable lag time for WT tau, it is difficult to reliably compare calculated values for each of the mutations to WT tau. However, it is clear from the data presented in Figure 6F that P270S and P332S have high levels of variability with an average lag time of 50 min. Similar to the WT, P301S also had no measurable lag time, whereas P364S had a longer lag time than the WT. Both P270S and P364S have similar rates of polymerization to the WT. Conversely, P301S has an increased rate of polymerization, as shown by the relatively steep slope of polymerization curve in Figure 6B, and P332S seems to cause a slight decrease in the rate of polymerization (Figure 6G).
Figure 6.

Kinetics of P100-induced aggregation of P to S mutations measured by LLS. LLS intensity (y-axis) at different time points (x-axis) were measured for three independent reactions using 2 μM P270S (A), P301S (B), P332S (C), and P364S (D) in the presence of ∼1.4 μM P100. Data were fit to a nonlinear regression plateau followed by a one-phase association model. Aggregation curves of each mutant are compared to 2 μM WT tau and ∼1.4 μM ARA (gray solid circles). Maximum polymerization (E), rate of polymerization (F), and lag time (G) were calculated to compare each of the inducers. Error bars represent SD of three independent experiments. All results were compared to average measurements of 2 μM WT tau and ∼1.4 μM ARA P100 ± 95% CI (gray shaded box) in figures (E–G) using an unpaired t-test (p < 0.05*).
Effect of P to S Mutations on P700 Induced Aggregation
Using the P700 inducer, we were able to study the effects of each of the P to S mutations on aggregation induced with long-chain polyphosphate (Figure 7). The total aggregation as measured by LLS revealed an increase caused by the P301S mutation (Figure 7A). However, TEM measurements of total filament mass showed no difference between P301S and WT (Figure 7B). A slight decrease in the number of filaments (Figure 7C) and an increase in average filament length (Figure 7D) were also measured. In terms of changes in filament length and number of filaments, the same results were seen with the other P to S mutations. However, P270S and P332S also saw a much more noticeable decrease in the number of filaments and total filament mass. Similar to the P100 inducer, there was no change in immunoreactivity using the TOC1 (Figure 7E) and TNT1 (Figure 7F) capture antibodies. Once again, there was no reactivity among any of the P to S mutations with the T22 antibody (Figure 7G).
Figure 7.

LLS, TEM, and ELISA endpoint measurements of P to S mutations induced by P700. (A) Endpoint total amount of induced aggregation of each P to S mutation at 2 μM induced with ∼0.15 μM P700 quantified using LLS (n = 3 ± s.d). TEM micrographs selected at random were quantified to measure the (B) total filament mass of each micrograph ± s.d., (C) average number of filaments (>25 nm) per micrograph ± s.d., and (D) average induced filament length (>25 nm) ± s.d. Immunoreactivity as measured by sandwich ELISA using capture antibodies TOC1 (E), TNT1 (F), and T22 (G). In figures (E–G), the y-axis represents the % light absorbed value (converted from A450 reading). Error bars in (E–G) represent ± s.d. of three independent experiments. All results were compared to average measurements of 2 μM WT tau induced with ∼0.15 μM P700 ± 95% CI (gray shaded box) using an unpaired t-test (p < 0.05*, p < 0.01**, and p < 0.001***).
Kinetic Measurement of P to S Mutations Induced by P700
In the presence of P700 as an inducer molecule, the P270S mutation showed similar average maximum LLS values (Figure 8A,E). Although the average lag time of P270S was greater than that of the WT, it was also highly variable, as shown in Figure 8F. However, the P270S mutation did cause a slight, but consistent decrease in the rate of polymerization (Figure 8G). The P301S mutation appeared to have similar effects to that seen when using P100 as an inducer molecule. The most notable difference in aggregation kinetics was seen with the P332S mutation which greatly decreases maximum LLS (Figure 8E) and increases the lag time (Figure 8F); however, no obvious change was measured in the P332S rate of polymerization (Figure 8G). Aggregation kinetics of the P364S mutant appeared to be the most consistent with the results seen using WT tau (Figure 8D).
Figure 8.

Kinetics of P700-induced aggregation of P to S mutations measured by LLS. LLS intensity (y-axis) at different time points (x-axis) were measured for three independent reactions using 2 μM P270S (A), P301S (B), P332S (C), and P364S (D) and ∼0.15 μM P700. Data were fit to a nonlinear regression plateau followed by a one-phase association model. Aggregation curves of each mutant are compared to 2 μM WT tau and ∼0.15 μM P700 (gray solid circles). Maximum polymerization (E), rate of polymerization (F), and lag time (G) were calculated to compare each of the inducers. Error bars represent ± s.d. of three independent experiments. All results were compared to average measurements of 2 μM WT tau induced with ∼0.15 μM P700 ± 95% CI (gray shaded box) in figures (E–G) using an unpaired t-test (p < 0.05*, p < 0.01**, and p < 0.001***).
RNA-Induced Aggregation Using Different P to S Mutations
Endpoint aggregation experiments were performed using small RNA and long RNA as inducers, and the analysis of aggregation was completed using LLS and TEM (Figures 9 and 10) similar to ARA, P100, and P700. WT tau and many of the mutants had total amounts of aggregation that were much lower than reactions induced with ARA, P100, and P700 (compare to Figures 3, 5, and 7).
Figure 9.

LLS, TEM, and ELISA endpoint measurements of P to S mutations induced by sRNA. (A) Endpoint total amount of induced aggregation of each P to S mutation at 2 μM induced with ∼0.4 μM sRNA quantified using LLS (n = 3 ± s.d). TEM micrographs selected at random were quantified to measure the (B) total filament mass of each micrograph ± s.d., (C) average number of filaments (>25 nm) per micrograph ± s.d., and (D) average induced filament length (>25 nm) ± s.d. Immunoreactivity as measured by sandwich ELISA using capture antibodies TOC1 (E), TNT1 (F), and T22 (G). In figures (E–G), the y-axis represents the % light absorbed value (converted from A450 reading). Error bars in (E–G) represent SD of three independent experiments. All results were compared to average measurements of 2 μM WT tau induced with ∼0.4 μM sRNA ± 95% CI (gray shaded box) using an unpaired t-test (p < 0.05*, p < 0.01**, and p < 0.001***).
Figure 10.

LLS, TEM, and ELISA endpoint measurements of P to S mutations induced by lRNA. (A) Endpoint total amount of induced aggregation of each P to S mutation at 2 μM induced with ∼0.04 μM lRNA quantified using LLS (n = 3 ± s.d). TEM micrographs selected at random were quantified to measure the (B) total filament mass of each micrograph ± s.d., (C) average number of filaments (>25 nm) per micrograph ± s.d., and (D) average induced filament length (>25 nm) ± s.d. Immunoreactivity as measured by sandwich ELISA using capture antibodies TOC1 (E), TNT1 (F), and T22 (G). In figures (E–G), the y-axis represents the % light absorbed value (converted from A450 reading). Error bars in (E–G) represent ± s.d. of three independent experiments. All results were compared to average measurements of 2 μM WT tau induced with ∼0.02 μM lRNA ± 95% CI (gray shaded box) using an unpaired t-test (p < 0.05*, p < 0.01**, and p < 0.001***).
Effect of P to S Mutations on sRNA-Induced Aggregation
Using sRNA, we compared the effect of each of the P to S mutations to WT tau aggregation using LLS, TEM, and ELISA to measure endpoint aggregation reactions. When comparing small RNA-induced P301S and WT tau, the P301S mutation had a large effect size, causing an approximately threefold increase in LLS (Figure 9A). This increase was also reflected in results from the TEM analysis by an increase in total filament mass (Figure 9B) and number of filaments (Figure 9C). Using sRNA as an inducer, P270S, P332S, and P364S mutations caused no change in total aggregation as measured by LLS. However, TEM analysis revealed that the P270S and P364S mutations led to a decrease in the number of filaments and total filament mass (Figure 9B,C) and P332S caused an increase in the number of filaments as measured by TEM. Measurements of immunoreactivity using the ELISA revealed no difference in any of the mutations for TOC1 and T22 reactivity (Figure 9E,G). However, a large increase in TNT reactivity was seen with the P301S mutation (Figure 9F).
Effect of P to S Mutations on lRNA-Induced Aggregation
In contrast to the results using ARA, P100, and P700, total filament mass as determined by TEM (Figure 10B) showed that the P270S mutation caused a slight increase in aggregation when induced with lRNA. As measured by LLS, the P301S mutation caused a more than fivefold increase when compared to WT tau (Figure 10A). This was further supported by an approximately fivefold increase in filament mass as measured by TEM (Figure 10B). In contrast to the results of the ARA-induced reactions, P301S induced with long RNA did not result in increased filament length but did cause an increase in the total number of filaments (compare Figures 3C,D to 10C,D). Similarly, the P332S mutation also resulted in an increase in filament mass and number (Figure 9C,D). Although P364S reactions did show more light scattering than the WT (Figure 9A), no filaments were detected using TEM (Figure 9B–E). This suggests that either long RNA-induced P364S aggregates are not stable and depolymerize during TEM grid preparation, filaments are below the TEM detection threshold (<25 nm), RNA interacts with P364S causing it to scatter light, but not form filaments, or long RNA-induced P364S aggregates have properties that reduce their adherence to EM grids. Although a slight increase in average immunoreactivity of P301S in both TOC1 (Figure 10E) and TNT1 (Figure 10F) ELISA was seen, there was also high variability among the data sets. There was no difference measured between any of the P to S mutation and WT tau in terms of TOC1 and TNT1 reactivity, and once again, there was no measurable signal in the T22 ELISA using lRNA as an inducer molecule (Figure 10G).
Comparison of Each Inducer Molecule
Table 1 summarizes the statistical analyses of the results from each experiment using the five inducer molecules: ARA, P100, P700, long RNA, and small RNA. It is clear from this summary that the choice of inducer molecules and method of aggregate detection can influence whether differences are detected and also the absolute extent of differences. It is also apparent that the P301S more consistently demonstrates differences from the WT protein regardless of the inducer and method of detection as compared to the other P to S mutations.
Table 1. Comparison of In Vitro Aggregation Results by the Inducer, Mutant, and Method of Detection.
| method | LLS | TEM |
sELISA |
kinetics |
||||||
|---|---|---|---|---|---|---|---|---|---|---|
| parameter | max | L̅ | Σ | # | TNT1 | TOC1 | T22 | max | rate | lag |
| ARA | ||||||||||
| P270S | ≈ | --- | ≈ | + | ≈ | ≈ | ≈ | ≈ | ≈ | ≈ |
| P301S | ++ | ++ | ≈ | --- | ≈ | ≈ | --- | ++ | ≈ | ++ |
| P332S | - | ≈ | --- | -- | ≈ | ≈ | --- | ≈ | ≈ | ≈ |
| P364S | ≈ | ≈ | ≈ | ≈ | ≈ | ≈ | - | ≈ | ≈ | ≈ |
| Polyphosphate P100 | ||||||||||
| P270S | - | + | ≈ | ≈ | ≈ | ≈ | n.a. | ≈ | ≈ | ≈ |
| P301S | ≈ | ≈ | ≈ | -- | ≈ | ≈ | n.a. | ≈ | + | ≈ |
| P332S | ≈ | ++ | --- | --- | ≈ | ≈ | n.a. | ≈ | - | ≈ |
| P364S | ≈ | +++ | - | --- | ≈ | ≈ | n.a. | - | ≈ | + |
| Polyphosphate P700 | ||||||||||
| P270S | ≈ | ++ | - | --- | ≈ | ≈ | n.a. | ≈ | - | ≈ |
| P301S | + | ++ | ≈ | - | ≈ | ≈ | n.a. | ≈ | + | ≈ |
| P332S | ≈ | +++ | - | --- | ≈ | ≈ | n.a. | -- | ≈ | +++ |
| P364S | ≈ | +++ | ≈ | - | ≈ | ≈ | n.a. | ≈ | ≈ | ≈ |
| Long RNA (> 200 nts) | ||||||||||
| P270S | ≈ | ≈ | + | ≈ | ≈ | ≈ | n.a. | n.a. | n.a. | n.a. |
| P301S | +++ | ≈ | +++ | +++ | ≈ | ≈ | n.a. | n.a. | n.a. | n.a. |
| P332S | ≈ | ≈ | +++ | ++ | ≈ | ≈ | n.a. | n.a. | n.a. | n.a. |
| P364S | + | --- | -- | -- | ≈ | ≈ | n.a. | n.a. | n.a. | n.a. |
| Small RNA (<200 nts) | ||||||||||
| P270S | ≈ | ≈ | - | --- | ≈ | ≈ | n.a. | n.a. | n.a. | n.a. |
| P301S | +++ | ≈ | +++ | +++ | + | ≈ | n.a. | n.a. | n.a. | n.a. |
| P332S | ≈ | ≈ | ≈ | + | ≈ | ≈ | n.a. | n.a. | n.a. | n.a. |
| P364S | ≈ | ≈ | -- | --- | ≈ | ≈ | n.a. | n.a. | n.a. | n.a. |
This is a summary of the results from inducer aggregation experiments. L̅ is the average filament length; Σ is the total filament mass; # is the number of filaments per micrograph; ≈ is no significant change; + indicates p ≤ 0.05 significant increase from wt; ++ is p ≤ 0.01; +++ is p ≤ 0.001; - indicates p ≤ 0.05 significant decrease from wt; -- is p ≤ 0.01; --- is p ≤ 0.001; n.a. (not applicable) indicates that the method could not be used for those conditions.
Discussion
It has been known for several decades that the term tauopathy includes a wide range of neurological disorders with diverse etiology, clinical presentation, and histopathology. Recent advances in structural biology techniques, primarily cryo-electron microscopy, have now shown that different tauopathies also include a range of structurally diverse tau aggregates.12,13,40,41 Because the addition of heparin, a glycosaminoglycan commonly used as an in vitro inducer molecule, to WT tau results in the formation of aggregates with molecular ultrastructures dissimilar to those found in disease, we are interested in whether other, potentially more biologically relevant in vitro molecules have the potential for inducing disease-relevant aggregate structures of tau. While high-resolution studies are underway, this report is a description of the initial characterization and comparison of three such inducers.
ARA, a polyunsaturated fatty acid, has been used extensively as an inducer for in vitro aggregation studies with recombinantly expressed human tau to form filaments that have similar morphology to straight filaments isolated from AD in terms of average width and density.17,42 Polyphosphate (polyP, linear polymers of phosphate residues linked by phosphoanhydride bonds) of various lengths can also induce the in vitro aggregation of tau into filaments with gross morphological similarities to tau aggregates associated with disease.23 Similarly, multiple classes of RNA have been used to induce tau aggregation in vitro into filaments that have been described as Alzheimer’s-like, but early cryoEM structures suggest that at least some RNA-induced tau aggregate structures do not share similarity with those found in AD or other related neurodegenerative tauopathies.
We asked the question whether low-resolution techniques using three independent assays (LLS, TEM, and sELISA) for studying the filament formation of full-length 2N4R tau in the presence of ARA, two different lengths of polyP, and two different lengths of RNA would allow us to predict whether these inducers were generating distinct structural polymorphs. Although we will not be able to be certain until the structures can be determined directly, the results of this initial study are consistent with the possibility that ARA, polyP, and RNA are generating structural polymorphs, and to a lesser degree, the results could be consistent with different sizes of polyP and RNA inducing different structures.
The first piece of evidence is that at the apparent steady state, the overall amounts of aggregation were different for the inducers, with ARA and short polyP (P100) having similar amounts of aggregation, short RNA (sRNA) and long RNA (lRNA) having the least, and long polyP (P700) being intermediate. However, these results could simply be the result of differences in the concentration of the inducer used to achieve approximately optimal amounts of aggregation (75 μM ARA, ∼1.4 μM P100 (assuming a modal size of 75 phosphates), ∼0.15 μM P700 (assuming a modal size of 700 phosphates, ∼0.4 μM sRNA (assuming a modal molecular weight of 33,000 g/mol), and ∼0.02 μM lRNA (assuming a modal molecular weight of 815,430 g/mol)). One argument against this possibility could be that similar levels of aggregation are observed for ARA and P100, although P100 is present at an approximately 50-fold lower concentration. However, the buffer conditions for ARA induction (10 mM HEPES, 100 mM NaCl, and 3.75% ethanol) and P100 induction (10 mM HEPES, 25 mM NaCl, and no organic solvent) were also different, which could account for the observed similarities in the amount of aggregation despite differences in concentrations. We also cannot rule out the possibility that although inducer concentrations, polymerization buffer conditions, and the amount of aggregation are different for the inducers, it does not necessarily mean that they are making different structural polymorphs.
The use of negative stain transmission electron microscopy also showed differences in filament numbers, length distributions, and filament widths. For example, P100 made fewer but substantially longer filaments than ARA, while P700 induced considerably more filaments than ARA with approximately the same average lengths. Both sRNA and lRNA induced very few filaments, most of which were substantially longer than either ARA or polyP. Also, ARA filaments, polyP filaments, and RNA filaments had significantly different filament widths. However, this technique can only be considered to be “semiquantitative” due to various limitations of resolution and solution sampling. Although there were significant differences in filament widths or even helical pitch, these measurements can be skewed by the amount of stain on the TEM grid or changes in the “fuzzy coat” of the filaments. Again, it is possible that the differences in filament numbers, filament length distributions, and filament widths are due to changes in inducer concentrations or buffer conditions. However, this possibility seems less likely when comparing the more numerous and shorter filaments at the apparent steady state induced by P700 (approx. 0.15 μM) to the fewer and longer filaments induced by sRNA (approx. 0.4 μM) under identical buffer conditions.
Aggregation kinetics can often provide insights into the mechanism of filament formation with different inducers. For example, the formation of ARA filaments has a more substantial lag phase but an increased rate of aggregation as compared to the two different lengths of polyphosphate inducers. In fact, the ARA-induced kinetics could be reasonably fit by a plateau (lag phase) followed by a one-phase exponential model and also the more sigmoidal models such as the Finke-Watzky two-step model and the three-parameter Gompertz growth function (Figure S5). However, the P100 data were best fit by setting the lag phase to zero for the plateau (lag phase) followed by a one-phase exponential model (essentially reducing it to a simple one-phase exponential) and by reducing the elongation factor K2 to near zero for the two-step Finke-Watzky model (once again essentially reducing it to a one-step model). Constraining the fit of the Gompertz growth function to avoid negative lag times resulted in a poor fit of the data (Figure S5). The fits of the P700 aggregation reactions were similar to the P100, although the reduction of the second step for the Finke-Watzky model was less severe than that of P100. These differences in the kinetics of the reactions could indicate different mechanisms of aggregation which in turn could be consistent with the formation of distinct structural polymorphs, although we cannot currently rule out the possibility that the differences in kinetics could be due to differences in buffer conditions, inducer concentrations (and therefore charge differences), or limitations to detecting aggregation formation by right-angle LLS.
We were unfortunately unable to fit the RNA light scattering data to any models due to the noise in the data. When completing kinetic studies using long RNA (Figure 2E), and to a lesser extent small RNA (Figure 2D), as an inducer molecule, we witnessed a strange phenomenon where initial addition of the inducer caused almost immediate light scattering (Figure S6) that then faded over a period of approximately 28 h. This was then followed by a steady increase in light scattering between 28 and 72 h. Samples prepared for TEM imaging at the same time of initial light scattering were observed to show no filaments. However, images of samples at the 72 h time point showed a proportional amount of tau filaments to the amount of light scattering. Initial light scattering may be due to an immediate interaction between RNA and monomeric tau that is then followed by dissociation and subsequent filament formation. Alternatively, initial light scattering could be due to RNA acting as a crowding agent causing liquid–liquid phase separation that forms highly concentrated droplets of monomeric tau that are able to scatter light. However, more extensive studies would be required to fully understand this process, and it was considered outside the scope of this initial investigation.
Other important considerations are the results with conformationally sensitive antibodies to measure aggregation using sandwich ELISA assays. For example, when comparing the amount of reactivity for the conformationally sensitive antibody TNT1, ARA, P100 and P700 were similar to each other, which was consistent with total aggregation levels measured by light scattering or semiquantitative electron microscopy. There was less reactivity with sRNA and rRNA, which was also consistent with light scattering and EM. However, when using the oligomeric specific antibody, TOC1, P100 and P700 had less reactivity than ARA aggregates, and sRNA and lRNA had some TOC1 reactivity. Finally, the conformationally sensitive antibody T22 did recognize ARA filaments but did not recognize either polyphosphate- or RNA-induced aggregates using any size of the inducer. This suggests that the epitopes for T22 and TNT1 or TOC1 are differently accessible in these aggregates, which could be consistent with structural polymorphs. However, alternative explanations are possible. For example, the TOC1 antibody is enriched for detection of oligomers and filament ends.20 Therefore, differences in aggregate length distributions and the availability of aggregate ends could change the amount of TOC1 reactivity, even with aggregates with identical structural cores. Another example is that T22 was reactive against RNA and polyphosphate when used in a dot blot assay (Figure S5) rather than a sandwich ELISA. This suggests that the polyanion inducer molecules block the T22 binding, but this interaction can be disrupted through thorough wash steps that occur prior to interaction between aggregate samples and the T22 antibody. With these and other potential limitations in mind, it is important to be cautious when conclusions are based on any single assay.
A final consideration is the effect of disease-relevant missense mutations in tau associated with frontotemporal lobar dementia on the different inducers that can be used in aggregation assays. A reasonable assumption would be that if the different inducer molecules are generating the same structures, then the relative effects of FTD mutations would be proportionately equal between inducers. Moreover, on average, the P301S mutation consistently had the largest impact on in vitro tau aggregation. However, the P301S mutation causes an increase in maximum aggregation for ARA, a slight but not significant increase for P100, and no change to P700-induced filaments. In the case of ARA-induced filaments, P301S has a significantly longer lag time with a slightly slower rate of aggregation when compared to the WT. This increased lag time suggests that the P301S mutation slows the nucleation step for ARA. Conversely, in the case of both P100 and P700, neither the WT nor P301S has a measurable lag time, but the P301S rate of aggregation is substantially faster. This shows a fundamental difference between polyphosphate and ARA-induced filaments in regard to the effect of the P301S mutation on aggregation kinetics. The P301S mutation had a much more substantial effect on both sRNA and lRNA induction as compared to ARA and polyphosphate. Another example is that P364S reduces the number of filaments and increases the filament length for P100 and P700 and increases the overall length of filaments, but this mutation has no measurable effect on ARA induction and reduces the number and/or length of aggregates induced by sRNA and lRNA. It is more difficult to find alternative hypotheses for the differential effects of these mutations on the relative amounts of aggregation using these inducers than the possibility that they have differential effects because they are involved in making structures with unique inter- and intramolecular contacts, and the consequences of the P to S mutations at different positions have impacts of aggregation of fundamentally distinct degrees. This is also supported by the results with the mutation P270S which is not associated with disease and is likely outside the aggregate core40 which shows very little impact on tau aggregation with all inducers tested.
Conclusions
In conclusion, while it is tempting to speculate that ARA, different sizes of polyphosphate, and different sizes of RNA can generate unique structural polymorphs, mutations within the tau molecule can also modify the structures that are induced, and these modifications result in differences in the structure that can change the amount of filament formation that can be detected using different biophysical methods, the available data can be also explained by other confounding factors. We believe that this demonstrates the need to determine the ultrastructures of these aggregates at a near-atomic resolution using high-resolution cryoEM techniques (these studies are currently in the early stages). The results presented in this report are consistent with the possibility that these structures will be different. This possibility is also buoyed by recent results demonstrating that tau can adopt a wide variety of structures under different in vitro conditions.28 Ultimately, as the cryo-EM technique becomes more accessible, it may be possible to more routinely determine whether filaments induced by various in vitro conditions and different tau isoforms, tau mutations, or tau post-translational modifications result in the formation of aggregate ultrastructures relevant to disease, which will be vital for our understanding of the mechanisms of tau aggregation in vitro and in disease.
Acknowledgments
We would like to thank Dr. David Davido and his laboratory for providing HEK 293T cells that were used for isolating RNA and Dr. Nicholas Kanaan, Michigan State University, for his kind gift of TOC and TNT antibodies.
Glossary
Abbreviations
- ARA
arachidonic acid
- RNA
ribonucleic acid
- AD
Alzheimer’s disease
- CTE
chronic traumatic encephalopathy
- MAPT
microtubule-associated protein tau
- FTDP-17
frontotemporal dementia with parkinsonism linked to chromosome 17
- PolyP
polyphosphate
- TEM
transmission electron microscopy
- ELISA
enzyme-linked immunosorbent assay.
Supporting Information Available
The Supporting Information is available free of charge at https://pubs.acs.org/doi/10.1021/acs.biochem.2c00111.
Schematic of PGGG motifs within the microtubule binding, repeat regions of tau, RNA tapestation results, immunoreactivity as measured by ELISA and dot-blot experiments, early timepoint aggregation kinetics of WT tau induced with ARA, P100, and P700, initial light scattering and TEM micrographs of RNA-induced aggregation reactions, and inducer concentration optimization experiments using polyphosphate and RNA (PDF)
Author Present Address
† Department of Neuroscience, Developmental and Regenerative Biology, University of Texas San Antonio, San Antonio, Texas, 78249, USA
Author Contributions
D.J.I. completed all ELISA experiments and endpoint and kinetic experiments for polyphosphate and kinetic experiments for both sRNA and lRNA. D.J.I. collected all TEM images, completed analysis, and drafted the manuscript. K.H. completed site-directed mutagenesis and protein purification and ARA endpoint and kinetic experiments. M.M. completed sRNA and lRNA endpoint experiments and isolation of RNA from cell culture. T.C.G. conceived the original studies and participated in their design and coordination, as well as helped draft the manuscript. All authors have read and approved the final manuscript.
National Institute on Aging of the National Institutes of Health (grant R21 AG069112), T.C.G. Roofe Fellowship, K.U. Endowment, and the Institute for Neurological Discoveries, D.J.I. National Institute of General Medical Sciences Graduate Training Program in Dynamic Aspects of Chemical Biology (grant T32 GM008545), D.J.I. K.U. undergraduate research award, K.H.
The authors declare no competing financial interest.
Supplementary Material
References
- Kurtishi A.; Rosen B.; Patil K. S.; Alves G. W.; Møller S. G. Cellular Proteostasis in Neurodegeneration. Mol. Neurobiol. 2019, 56, 3676–3689. 10.1007/s12035-018-1334-z. [DOI] [PubMed] [Google Scholar]
- 2021 Alzheimer’s disease facts and figures. Alzheimer’s Dementia 2021, 17, 327−406. 10.1002/alz.1232 [DOI] [PubMed] [Google Scholar]
- La Joie R.; et al. Prospective longitudinal atrophy in Alzheimer’s disease correlates with the intensity and topography of baseline tau-PET. Sci. Transl. Med. 2020, 12, eaau5732 10.1126/scitranslmed.aau5732. [DOI] [PMC free article] [PubMed] [Google Scholar]
- Ghetti B.; Oblak A. L.; Boeve B. F.; Johnson K. A.; Dickerson B. C.; Goedert M. Invited review: Frontotemporal dementia caused by microtubule-associated protein tau gene (MAPT) mutations: a chameleon for neuropathology and neuroimaging. Neuropathol. Appl. Neurobiol. 2015, 41, 24–46. 10.1111/nan.12213. [DOI] [PMC free article] [PubMed] [Google Scholar]
- Wang Y.; Mandelkow E. Tau in physiology and pathology. Nat. Rev. Neurosci. 2016, 17, 22–35. 10.1038/nrn.2015.1. [DOI] [PubMed] [Google Scholar]
- Morris H. R. The Genetic and Pathological Classification of Familial Frontotemporal Dementia. Arch. Neurol. 2001, 58, 1813. 10.1001/archneur.58.11.1813. [DOI] [PubMed] [Google Scholar]
- Deramecourt V.; Lebert F.; Maurage C.-A.; Fernandez-Gomez F.-J.; Dujardin S.; Colin M.; Sergeant N.; Buée-Scherrer V.; Clot F.; Ber I. L.; Brice A.; Pasquier F.; Buée L. Clinical, Neuropathological, and Biochemical Characterization of the Novel Tau Mutation P332S. J. Alzheim. Dis. 2012, 31, 741–749. 10.3233/jad-2012-120160. [DOI] [PubMed] [Google Scholar]
- Štrafela P.; Pleško J.; Magdič J.; Koritnik B.; Zupan A.; Glavač D.; Bresjanac M.; Popović M. Familial tauopathy with P364SMAPTmutation: clinical course, neuropathology and ultrastructure of neuronal tau inclusions. Neuropathol. Appl. Neurobiol. 2018, 44, 550–562. 10.1111/nan.12456. [DOI] [PubMed] [Google Scholar]
- Götz J.; Bodea L.-G.; Goedert M. Rodent models for Alzheimer disease. Nat. Rev. Neurosci. 2018, 19, 583–598. 10.1038/s41583-018-0054-8. [DOI] [PubMed] [Google Scholar]
- Falcon B.; Zhang W.; Murzin A. G.; Murshudov G.; Garringer H. J.; Vidal R.; Crowther R. A.; Ghetti B.; Scheres S. H. W.; Goedert M. Structures of filaments from Pick’s disease reveal a novel tau protein fold. Nature 2018, 561, 137–140. 10.1038/s41586-018-0454-y. [DOI] [PMC free article] [PubMed] [Google Scholar]
- Fitzpatrick A. W. P.; Falcon B.; He S.; Murzin A. G.; Murshudov G.; Garringer H. J.; Crowther R. A.; Ghetti B.; Goedert M.; Scheres S. H. W. Cryo-EM structures of tau filaments from Alzheimer’s disease. Nature 2017, 547, 185–190. 10.1038/nature23002. [DOI] [PMC free article] [PubMed] [Google Scholar]
- Falcon B.; Zivanov J.; Zhang W.; Murzin A. G.; Garringer H. J.; Vidal R.; Crowther R. A.; Newell K. L.; Ghetti B.; Goedert M.; Scheres S. H. W. Novel tau filament fold in chronic traumatic encephalopathy encloses hydrophobic molecules. Nature 2019, 568, 420–423. 10.1038/s41586-019-1026-5. [DOI] [PMC free article] [PubMed] [Google Scholar]
- Zhang W.; Tarutani A.; Newell K. L.; Murzin A. G.; Matsubara T.; Falcon B.; Vidal R.; Garringer H. J.; Shi Y.; Ikeuchi T.; Murayama S.; Ghetti B.; Hasegawa M.; Goedert M.; Scheres S. H. W. Novel tau filament fold in corticobasal degeneration. Nature 2020, 580, 283–287. 10.1038/s41586-020-2043-0. [DOI] [PMC free article] [PubMed] [Google Scholar]
- Zhang W.; Falcon B.; Murzin A. G.; Fan J.; Crowther R. A.; Goedert M.; Scheres S. H. Heparin-induced tau filaments are polymorphic and differ from those in Alzheimer’s and Pick’s diseases. Elife 2019, 8, e43584 10.7554/elife.43584. [DOI] [PMC free article] [PubMed] [Google Scholar]
- Fichou Y.; Vigers M.; Goring A. K.; Eschmann N. A.; Han S. Heparin-induced tau filaments are structurally heterogeneous and differ from Alzheimer’s disease filaments. Chem. Commun. 2018, 54, 4573–4576. 10.1039/c8cc01355a. [DOI] [PubMed] [Google Scholar]
- King M. E.; Gamblin T. C.; Kuret J.; Binder L. I. Differential Assembly of Human Tau Isoforms in the Presence of Arachidonic Acid. J. Neurochem. 2000, 74, 1749–1757. 10.1046/j.1471-4159.2000.0741749.x. [DOI] [PubMed] [Google Scholar]
- King M. E.; Ghoshal N.; Wall J. S.; Binder L. I.; Ksiezak-Reding H. Structural analysis of Pick’s disease-derived and in vitro-assembled tau filaments. Am. J. Pathol. 2001, 158, 1481–1490. 10.1016/s0002-9440(10)64099-0. [DOI] [PMC free article] [PubMed] [Google Scholar]
- Thomas M. H.; Pelleieux S.; Vitale N.; Olivier J. L. Arachidonic Acid in Alzheimer’s disease. J Neurol Neuromedicine 2016, 1, 1–6. 10.29245/2572.942x/2016/9.1086. [DOI] [Google Scholar]
- Combs B.; Hamel C.; Kanaan N. M. Pathological conformations involving the amino terminus of tau occur early in Alzheimer’s disease and are differentially detected by monoclonal antibodies. Neurobiol. Dis. 2016, 94, 18–31. 10.1016/j.nbd.2016.05.016. [DOI] [PMC free article] [PubMed] [Google Scholar]
- Ward S. M.; Himmelstein D. S.; Ren Y.; Fu Y.; Yu X.-W.; Roberts K.; Binder L. I.; Sahara N. TOC1: a valuable tool in assessing disease progression in the rTg4510 mouse model of tauopathy. Neurobiol. Dis. 2014, 67, 37–48. 10.1016/j.nbd.2014.03.002. [DOI] [PMC free article] [PubMed] [Google Scholar]
- Ingham D. J.; Blankenfeld B. R.; Chacko S.; Perera C.; Oakley B. R.; Gamblin T. C. Fungally Derived Isoquinoline Demonstrates Inducer-Specific Tau Aggregation Inhibition. Biochemistry 2021, 60, 1658–1669. 10.1021/acs.biochem.1c00111. [DOI] [PMC free article] [PubMed] [Google Scholar]
- Cremers C. M.; Knoefler D.; Gates S.; Martin N.; Dahl J.-U.; Lempart J.; Xie L.; Chapman M. R.; Galvan V.; Southworth D. R.; Jakob U. Polyphosphate: A Conserved Modifier of Amyloidogenic Processes. Mol. Cell 2016, 63, 768–780. 10.1016/j.molcel.2016.07.016. [DOI] [PMC free article] [PubMed] [Google Scholar]
- Wickramasinghe S. P.; Lempart J.; Merens H. E.; Murphy J.; Huettemann P.; Jakob U.; Rhoades E. Polyphosphate Initiates Tau Aggregation through Intra- and Intermolecular Scaffolding. Biophys. J. 2019, 117, 717–728. 10.1016/j.bpj.2019.07.028. [DOI] [PMC free article] [PubMed] [Google Scholar]
- Dinkel P. D.; Holden M. R.; Matin N.; Margittai M. RNA Binds to Tau Fibrils and Sustains Template-Assisted Growth. Biochemistry 2015, 54, 4731–4740. 10.1021/acs.biochem.5b00453. [DOI] [PMC free article] [PubMed] [Google Scholar]
- Kampers T.; Friedhoff P.; Biernat J.; Mandelkow E.-M.; Mandelkow E. RNA stimulates aggregation of microtubule-associated protein tau into Alzheimer-like paired helical filaments. FEBS Lett. 1996, 399, 344–349. 10.1016/s0014-5793(96)01386-5. [DOI] [PubMed] [Google Scholar]
- Zhang X.; Lin Y.; Eschmann N. A.; Zhou H.; Rauch J. N.; Hernandez I.; Guzman E.; Kosik K. S.; Han S. RNA stores tau reversibly in complex coacervates. PLoS Biol. 2017, 15, e2002183 10.1371/journal.pbio.2002183. [DOI] [PMC free article] [PubMed] [Google Scholar]
- Ginsberg S. D.; Crino P. B.; Lee V. M.-Y.; Eberwine J. H.; Trojanowski J. Q. Sequestration of RNA in Alzheimer’s disease neurofibrillary tangles and senile plaques. Ann. Neurol. 1997, 41, 200–209. 10.1002/ana.410410211. [DOI] [PubMed] [Google Scholar]
- Lövestam S.; Koh F. A.; van Knippenberg B.; Kotecha A.; Murzin A. G.; Goedert M.; Scheres S. H. W. Assembly of recombinant tau into filaments identical to those of Alzheimer’s disease and chronic traumatic encephalopathy. Elife. 2022, 11, e76494 10.7554/eLife.76494. [DOI] [PMC free article] [PubMed] [Google Scholar]
- Abskharon R.; Sawaya M. R.; Boyer D. R.; Cao Q.; Nguyen B. A.; Cascio D.; Eisenberg D. S. Cryo-EM structure of RNA-induced tau fibrils reveals a small C-terminal core that may nucleate fibril formation. Proc Natl Acad Sci U S A. 2022, 119, e2119952119 10.1073/pnas.2119952119. [DOI] [PMC free article] [PubMed] [Google Scholar]
- Rankin C. A.; Sun Q.; Gamblin T. C. Pseudo-phosphorylation of tau at Ser202 and Thr205 affects tau filament formation. Mol. Brain Res. 2005, 138, 84–93. 10.1016/j.molbrainres.2005.04.012. [DOI] [PubMed] [Google Scholar]
- Combs B.; Tiernan C. T.; Hamel C.; Kanaan N. M. Production of recombinant tau oligomers in vitro. Methods Cell Biol. 2017, 141, 45–64. 10.1016/bs.mcb.2017.06.005. [DOI] [PMC free article] [PubMed] [Google Scholar]
- Horowitz P. M. Early N-Terminal Changes and Caspase-6 Cleavage of Tau in Alzheimer’s Disease. J. Neurosci. 2004, 24, 7895–7902. 10.1523/jneurosci.1988-04.2004. [DOI] [PMC free article] [PubMed] [Google Scholar]
- Kanaan N. M.; Grabinski T. Neuronal and Glial Distribution of Tau Protein in the Adult Rat and Monkey. Front. Mol. Neurosci. 2021, 14, 607303. 10.3389/fnmol.2021.607303. [DOI] [PMC free article] [PubMed] [Google Scholar]
- Lasagna-Reeves C. A.; Castillo-Carranza D. L.; Sengupta U.; Sarmiento J.; Troncoso J.; Jackson G. R.; Kayed R. Identification of oligomers at early stages of tau aggregation in Alzheimer’s disease. FASEB J. 2012, 26, 1946–1959. 10.1096/fj.11-199851. [DOI] [PMC free article] [PubMed] [Google Scholar]
- Combs B.; Voss K.; Gamblin T. C. Pseudohyperphosphorylation Has Differential Effects on Polymerization and Function of Tau Isoforms. Biochemistry 2011, 50, 9446–9456. 10.1021/bi2010569. [DOI] [PMC free article] [PubMed] [Google Scholar]
- Mutreja Y.; Gamblin T. C. Methods in Tau Cell Biology Optimization of in vitro conditions to study the arachidonic acid induction of 4R isoforms of the microtubule-associated protein tau. Methods Cell Biol. 2017, 141, 65–88. 10.1016/bs.mcb.2017.06.007. [DOI] [PubMed] [Google Scholar]
- Morris A. M.; Watzky M. A.; Agar J. N.; Finke R. G. Fitting neurological protein aggregation kinetic data via a 2-step, minimal/“Ockham’s razor” model: the Finke-Watzky mechanism of nucleation followed by autocatalytic surface growth. Biochemistry 2008, 47, 2413–2427. 10.1021/bi701899y. [DOI] [PubMed] [Google Scholar]
- Necula M.; Kuret J. Pseudophosphorylation and glycation of tau protein enhance but do not trigger fibrillization in vitro. J. Biol. Chem. 2004, 279, 49694–49703. 10.1074/jbc.m405527200. [DOI] [PubMed] [Google Scholar]
- Carlson S. W.; Branden M.; Voss K.; Sun Q.; Rankin C. A.; Gamblin T. C. A Complex Mechanism for Inducer Mediated Tau Polymerization. Biochemistry 2007, 46, 8838–8849. 10.1021/bi700403a. [DOI] [PubMed] [Google Scholar]
- Shi Y.; et al. Structure-based Classification of Tauopathies. Nature 2021, 598, 359–363. Cold Spring Harbor Laboratory 10.1038/s41586-021-03911-7. [DOI] [PMC free article] [PubMed] [Google Scholar]
- Goedert M.; Falcon B.; Zhang W.; Ghetti B.; Scheres S. H. W. Distinct Conformers of Assembled Tau in Alzheimer’s and Pick’s Diseases. Cold Spring Harbor Symp. Quant. Biol. 2018, 83, 163–171. 10.1101/sqb.2018.83.037580. [DOI] [PubMed] [Google Scholar]
- Wilson D. M.; Binder L. I. Free fatty acids stimulate the polymerization of tau and amyloid beta peptides. In vitro evidence for a common effector of pathogenesis in Alzheimer’s disease. Am. J. Pathol. 1997, 150, 2181–95. [PMC free article] [PubMed] [Google Scholar]
Associated Data
This section collects any data citations, data availability statements, or supplementary materials included in this article.