

Abstract
We describe a “union advantage” in health insurance coverage and access to care. Using multiple statistical models and data from the Medical Expenditure Panel Survey for 1996–2019, we show that—compared to non-union workers—union workers are more likely to have health insurance coverage (98% vs. 86%), more likely to have a regular care provider (83% vs. 74%), visited office-based providers 31% more often (5.64 vs. 4.27 visits), spend $832 more on healthcare annually, and pay a lower share of their expenditures out-of-pocket (26% vs. 37%). When we control for demographic characteristics across variety of specifications, these differences almost always remain at a statistically significant level. Further, we show that the union advantage is greater for low-income workers. Next, we demonstrate that—although the Affordable Care Act (ACA) appears to have reduced the union advantage in health insurance coverage by increasing coverage rates among non-union workers—a substantial union advantage in access to care remains after the ACA’s main provisions become effective. Finally, we explore how the ACA interacted with the trade union goal of maintaining employer-based health insurance. We show that unionized workers are less likely to contribute to “enrollment shifting,” which occurs when individuals shift from existing employer-based insurance to a new government funded program. This suggests that union bargaining over fringe benefits may have positive externalities in the form of cost reductions to the public sector.
Keywords: Health insurance, Trade unions, Healthcare, Affordable Care Act, Collective bargaining, Enrollment shifting, Healthcare disparities
Introduction
A defining feature of the United States’ employer-based health insurance system is differential access to health insurance coverage and health care services according to labor market status (Blumenthal, 2006, p. 85).1 Claxton et al. (2021) report that 75% of firms in manufacturing offer employee health insurance, compared to 48% of the firms in retail. Similarly, in firms with many “low income” workers, more than half of employees paid in excess of 25% of their insurance premium, compared to only one-third of workers in firms with many “high income” workers (Claxton et al., 2021).
The Affordable Care Act (ACA)—signed into law in March 2010, with major provisions made effective January 2014—aimed to reduce disparities in coverage resulting from the employer sponsored health insurance system by (among other things): implementing an individual health insurance mandate, requiring employers to cover their workers or pay penalties (with exceptions for smaller employers), subsidizing the purchase of health insurance by low-income populations, and creating state-based healthcare exchanges to facilitate the purchase of health insurance plans by individuals and small businesses (Gruber & Sommers, 2019). A primary measure of the success of the Affordable Care Act is thus whether disparities in health insurance coverage across employees at different firms, in different occupations, and in different industries were reduced after the law’s passage. While a number of studies have examined the impact of the ACA on coverage disparities by race and ethnicity (Buchmueller et al., 2016), income (Courtemanche et al, 2018; Sommers et al., 2016), and age (in-particular, as a result of an ACA provision requiring insurance plans to cover young adults on parents’ policies, e.g., see Barbaresco et al., 2015), few studies have directly examined the impact of the ACA on coverage disparities by labor-market-specific individual characteristics. In this paper, we provide one such example by exploring the role of union membership in determining the availability of coverage, access to care, and healthcare utilization before and after the passage of the Affordable Care Act.
Despite the decline in union membership over the course of the twentieth century—from 20.1% in 1983 to approximately 10% in 20212—collective bargaining remains an important feature of US labor markets. Not only do union workers enjoy an earnings premium relative to their non-union counterparts, but unions also appear to raise the share of compensation allocated to “fringe benefits” including healthcare (Buchmueller et al., 2002; Freeman, 1981). Recent literature suggests the impact of collective bargaining on fringe benefits has become more important as the union earnings premium has declined (Knepper, 2020). An important question thus concerns to what extent do union workers enjoy an advantage in health insurance coverage and access to care relative to other workers? Using data for the years 1983 to 1997, Buchmueller et al. (2002) provide evidence of a positive effect of unions on the probability of health insurance coverage, and attribute between 20%-35% of the decline in employee health coverage observed in their sample to the secular decline in union membership. However, Buchmueller et al. (2002) provide no evidence on whether differences in coverage by union status translate to differences in access to care or healthcare utilization. Further, given the changes to the US healthcare system enacted by the ACA, it is worth examining whether the effect of unions on insurance coverage has changed over time.
In this paper, we demonstrate the existence of a “union advantage” in health insurance coverage and access to care. First, using data from the Medical Expenditure Panel Survey (MEPS) for the years 1996 to 2019, we show that union workers are more likely to have health insurance coverage, are more likely to have a regular care provider, have higher levels of total healthcare expenditures, and have a lower share of out-of-pocket costs than non-union workers. Over the sample period union workers are approximately 10% more likely to have health insurance coverage, 6.8% more likely to have a regular care provider, visit office-based providers 31% more often than non-union workers, $832 more on healthcare annually, and have an out-of-pocket expenditure share approximately 11 percentage points lower than non-union workers. Further, we show that the union advantage in coverage and access to care is greater for low-income workers.
Second, we examine the impact of the Affordable Care Act (ACA) on the union advantage. We show that—although the ACA appears to reduce the union advantage in health insurance coverage by increasing coverage rates among non-union workers—a significant union advantage remains even after the ACA’s main provisions become effective.
Finally, we show that unionized workers are less likely to contribute to “enrollment shifting,” which occurs when individuals shift from existing employer-based insurance to a new government funded program. This suggests that union bargaining over fringe benefits may have positive externalities in the form of cost reductions to the public sector. Further, the issue of enrollment shifting provides an additional lens through which to examine the interaction between the ACA and collective bargaining. In particular, the ACA’s employer mandate and union resistance to fringe benefit cuts are likely to be mutually reinforcing, acting as a barrier to enrollment shifting among union workers.
The rest of the paper is as follows. Section 2 discusses the relevant literature. Section 3 presents the data and discusses the empirical methodology. Section 4 presents the results. Section 5 offers some additional discussion of the results. Section 6 concludes.
Literature review
Unions and healthcare
Unions have played a major role in the growth and shaping of American health insurance. Morrisey (2020) identifies the expansion of organized labor as one of three causes of the rapid spread of health insurance in the 1940’s and 1950’s. In part this was due to the Taft–Hartley Act of 1947, which made health insurance a subject for collective bargaining. Starr (2017) notes that after the Supreme Court reaffirmed unions’ bargaining rights on health insurance in the Inland Steel case most of the major industrial unions negotiated contracts with expanded health benefits, and coverage grew rapidly. By 1954 one fourth of the health insurance in America was purchased through union negotiated contracts, covering 12 million workers and 17 million dependents.
A second of Morrisey’s causes of the rapid growth of health insurance is tax advantages. Pauly (1999) notes a double tax incentive for health insurance, as neither the employer nor employees are taxed when the employer pays for insurance and the employees are also not taxed when they receive benefits from health insurance. In contrast, with fringe benefits such as pensions, employees are not taxed when employers contribute to pensions, but employees are taxed when they receive pension distributions. Clearly, the unions’ ability to negotiate for health insurance enhances the value of tax incentives.3 This may be a contributing factor to findings that unions raise fringe benefit receipts by a greater percentage than wages (Freeman, 1981).4
Besides generating growth in insurance coverage, unions influence specific features of health insurance in the U.S.. Cunningham and Cunningham (1997) report that part of the reason Blue Cross Blue Shield plans moved from indemnity benefits to service benefits was to meet unions’ preferences. Cunningham and Cunningham (1997) also note that community rating became unfeasible once the unions could do better with experience rating. Unions also influence the management of fringe benefits. One provision of the Taft Hartley Act established “Taft Hartley funds” which allow unions to require in contracts that employers contribute to a health insurance plan run by a board of trustees with equal union and management representation. (Massachusetts Coalition of Taft-Hartley Trust Funds, 2022). This is particularly important for workers who often move from employer to employer, such as carpenters. In another example of union intervention in the management of employer sponsored health insurance, Snavely and Priddle (2015) note the United Auto Workers’ efforts to reshape automakers’ health benefits program.
Reynolds and Brady (2012) suggest the influence of unions on the health of workers is larger than the provision of health insurance. For example, unions may influence the health of workers through establishing work safety rules, limiting toxic inputs, and establishing workplace preventive health programs. Indirectly, unions are associated with higher incomes, and higher incomes are associated with improved health (Reynolds & Brady, 2012). Reynolds and Brady (2012) cite additional research, including Andersen (1995), that incorporates a broad range of work-related variables into models that explore the causes of health disparities. Similarly, unions can be viewed as part of a society’s “health production function” that integrates both health services and other inputs to produce health.5
Not only do union workers enjoy an earnings premium relative to their non-union counterparts, but unions also appear to raise the share of compensation allocated to “fringe benefits”, including healthcare. Freeman (1981), and Freeman and Medoff (1984) emphasized that unions are political as well as economic organizations. They suggest non-union employers offer compensation packages targeting the “marginal” worker, who tends to be mobile, young, and relatively less interested in health insurance. Union workplaces tend to have compensation packages targeted to more stable older workers, who value health insurance more than young workers. The political importance of health insurance to unions is further noted by Weil (1997), who reports that one reason for labor’s divided response to Clinton’s health proposals was that the managers of Taft Hartley plans, particularly in the building trades, did not want to give up control of a strong link between the union and members.
Several attempts have been made to measure the advantage in health insurance coverage unions confer to their members. In a heavily cited study, Freeman and Medoff (1984) used data from the 1970’s and found that union employers were more likely to offer health insurance; the proportion of premiums paid by union employers was 14% higher than non-union employers; and union plans tended to offer a broader range of benefits. Even and MacPherson (1991) found evidence that the union premium fell between 1983 and 1988. Given the changes enacted by the ACA, it is worth examining whether the effect of unions on insurance coverage changed over time.
A further question concerns differences in the value of benefits received, rather than merely the extent of coverage. The Bureau of Labor Statistics (BLS) tracks the amounts per labor hour employers pay for health insurance. BLS reports that as of June 2019 (i.e. pre-COVID), union employers averaged paying $6.33 per labor hour for health insurance (up 100% from $3.16 in 2004) compared to nonunion employers paying $2.24 per hour as of June 2019 (up 66% from $1.35 in 2004) (US Department of Labor 2021).
The ACA
The ACA had differing impacts on health insurance coverage for various demographic groups. Buchmueller et al. (2016) find that—after the ACA went into effect—the percentage of adults who were uninsured decreased 5.1 percentage points among blacks, 7.1 percentage points among Hispanics, and 3 percentage points among whites. Barbaresco et al., (2015) estimate that the ACA provision requiring insurance plans to cover young adults on parents’ policies increased coverage for 23–35-year-olds between 5.5 and 6.7 percentage points. Courtemanche et al. (2018) review previous studies and conclude that the ACA increased coverage by an average of 5.9% in Medicaid expansion states and by 2.8% in non-expansion states. Sommers et al., (2016), compared first year impacts for Medicaid programs in three states. They found that the uninsurance rate declined by 14 percentage points in the two expansion states (Kentucky and Arkansas), relative to the non-expansion state (Texas). Duggan, Goda, and Li (2020) find that for the near-elderly (age 60–64) coverage increased by 4.5%, and work participation declined by 0.6 percent.
Enrollment shifting
When applied to health insurance, the term “crowding out” refers to a situation when an expansion of a public program results in some enrollees in employer-sponsored health insurance transferring to the public program. “Crowding out” is a problematic term for several reasons. When applied to other markets, crowding out refers to a public program taking market share away from an entity that desires that market share. For example, public investments in concert halls may crowd out for-profit dinner theaters. But in the health insurance case the entity that is “crowded out’ may actually want to reduce costs by transferring enrollees. This enrollment shifting is undesirable for a public program because it adds to the cost required to expand coverage. Thus, in this paper instead of “crowding out” we will emphasize the term “enrollment shifting” to refer more broadly to instances where a program change results in enrollment shifting across programs. Enrollment shifting appears in many forms, including forms that are positive for some public programs. At times many states have tried to shift enrollment away from state financed programs to Medicaid in order to shift expenditures to the federal government. For example, Coughlin et al. (1994) used case studies on nine states during the period 1988–1992 and found that four states had shifted enrollees in mental health-metal retardation (MH-MR) programs to Medicaid, Florida had shifted maternal and child health (MCH) enrollees to Medicaid, Connecticut had shifted from both MH-MR and MCH programs to Medicaid, and New York had shifted MH-MR and General Assistance enrollees. Similarly, intentional enrollment shifting occurs at the federal level. Feldstein (2006) notes the AFL-CIO argued for financing Medicare through the Social Security payroll tax in order to shift enrollment away from employer’s retirees’ plans, with a goal of freeing funds for additional coverage for workers.
Studies have looked at a variety of variables and outcomes associated with enrollment shifting when public programs are expanded, although the impact of unions is not addressed. Davidson et al. (2004) provide a table of 25 studies of enrollment shifting. They conclude that determining whether changes in private coverage are directly related to changes in public programs is difficult, the range of estimates is large, and individual estimates are not precise. Hudson et al. (2005) conclude that estimates of enrollment shifting are sensitive to the choice of econometric techniques. Menifield et al. (2021) analyze the State Childrens’ Health Insurance Program (SCHIP) program and determine that “crowd out” likely occurs. Buettgens and Banthin (2020) report that the Urban Institute’s Health Insurance Policy Simulation Model (HIPSM) for 2020 assumes a rate of 22% for “crowd out”.
We anticipate a differential rate of enrollment shifting between union and non-union employers. As noted above, unions partially constrain employers’ behavior in health insurance markets, both for government employers and private sector employers. In one survey 11 of 25 public employers reported strong union influence on benefits (Watts et al., 2003). The study also found examples where governments’ administrative rules governing the purchase of health insurance required roles for unions. Importantly for our paper, Watt et al. (2003) finds that unions reduce the ability of the government to cut benefits for government employees. Unions also push back in the private sector. One study of the effort by the United Mine Workers to impose cost sharing ended early when the miners struck over benefits (Scheffler, 1984; also reported in Morrisey, 2020). Despite the potential for union resistance to benefit cuts to constrain enrollment shifting, studies that examine an extensive list of factors influencing enrollment shifting in response to the expansion of government funded programs (such as Medicaid and SCHIP) generally do not include union coverage as a factor that could constrain enrollment shifting (e.g., Davidson et al., 2004; Harris & Mok, 2015). Our study adds to the literature by considering the degree to which unions—both those covering government employees and those in private sector firms—may constrain enrollment shifting when government financed programs such as SCHIP and Medicaid attempt to expand coverage.
Lastly, an important characteristic of the ACA is the employer mandate. One aspect of the mandate required employers to offer insurance or pay a penalty. The mandate also required some employers to offer a different set of benefits. Given that prior to the ACA coverage varied from employer to employer—and given variation in other factors such as state laws—the interaction between the mandate and union efforts to resist benefit cuts is complex. However, both the employer mandate and the tendency of unions to negotiate higher levels of fringe benefits should work against enrollment shifting among union workers. Further, we note that—given high levels of insurance coverage for union workers in the pre-ACA period—the employer mandate was likely to be non-binding for firms with a unionized workforce, suggesting that the main channel through which the ACA is likely to impact the union advantage is via changes in coverage rates among non-union workers.
Data and methodology
Data
The primary data in this paper come from the Integrated Public Use Microdata Series (IPUMS) for the Medical Expenditure Panel Survey (MEPS) (Blewett et al., 2019). MEPS is an on-going panel survey started in 1996, produced by the Agency for Healthcare Research and Quality (AHRQ). MEPS represents a subset of households responding to the previous year’s National Health Interview Survey (NHIS). Each household included in the MEPS data is interviewed five times over a 2-year period. In any given year, two separate panels are included in the sample. During the first survey year participants are interviewed twice, and each interview has a reference period of the first survey year. During the second survey year participants are interviewed three times. The fourth and fifth interview always have a reference period of the second year. The third interview may have a reference period of the first year, the second year, or may reference both years.
To arrive at our final sample, we make the following adjustments. First, we restrict the sample to employed survey respondents for which information on union status is available6 in at least one interview round in each sample year. Second, we restrict the sample to working-age adults, keeping only individuals between the ages of 18 and 65. Finally, we keep only the first- and fourth-round interview, such that each respondent enters our dataset as a two-period panel. Our final sample consists of 256,310 observations covering 128,155 survey respondents. Table 1 presents sample means for our key variables for the entire sample, as well as union and non-union subsamples.
Table 1.
Sample Means, 1996–2019
| (1) | (2) | (3) | |
|---|---|---|---|
| Full sample | Non-union | Union | |
| Union Member |
0.12 (0.32) |
||
| Potential access | |||
| Health Insurance |
0.87 (0.33) |
0.86 (0.35) |
0.98 (0.15) |
|
Paid Sick Leave N = 122,713 |
0.64 (0.48) |
0.62 (0.49) |
0.80 (0.40) |
|
Paid MD Leave N = 121,138 |
0.58 (0.49) |
0.56 (0.50) |
0.72 (0.45) |
|
Has PCP N = 233,477 |
0.74 (0.44) |
0.73 (0.45) |
0.83 (0.38) |
| Realized Access | |||
| HC Expenditure |
$2,861.17 (8,800.71) |
$2,763.12 (8,552.15) |
$3,595.54 (10,447.48) |
|
Share Self Pay N = 202,827 |
0.36 (0.31) |
0.37 (0.32) |
0.26 (0.25) |
| Office Visits |
4.43 (8.49) |
4.27 (8.28) |
5.64 (9.85) |
| ER Visits |
0.14 (0.46) |
0.14 (0.46) |
0.15 (0.47) |
| Demographic | |||
| Age |
41.08 (12.07) |
40.68 (12.16) |
44.08 (10.90) |
| Married |
0.59 (0.49) |
0.58 (0.49) |
0.64 (0.48) |
| College |
0.42 (0.49) |
0.41 (0.49) |
0.43 (0.50) |
| Ln(Income) |
11.03 (0.78) |
11.01 (0.79) |
11.19 (0.62) |
|
Diabetes N = 219,297 |
0.05 (0.22) |
0.05 (0.21) |
0.06 (0.24) |
|
Hyperlipidemia N = 139,396 |
0.23 (0.42) |
0.23 (0.42) |
0.28 (0.45) |
|
Hypertension N = 139,447 |
0.24 (0.42) |
0.23 (0.42) |
0.28 (0.45) |
| N | 256,310 | 226,924 | 29,386 |
Standard deviations in parenthesis. Sample means calculated using IPUMS-MEPS sample weights. Dollar values converted to constant 2009 dollars using the Bureau of Labor Statistics (BLS) Consumer Price Index (CPI). Changes to sample size due to variable availability are indicated under each variable label (E.g., “Hypertension” and “Hyperlipidemia” are available in IPUMS-MEPS from 2007 onward).
Use of MEPS provides access to a set of variables that are not all included in other data sets. Our final sample includes variables about a respondent’s union status, health benefits, health expenditures, health utilization, economic status, and demographics. The variable “Union Member” is a dummy variable indicating an individual’s union status.
To measure the union advantage, we include four variables that measure “potential access,” which consider the ability of an individual to access care when they desire the care (Andersen, 1995). We also track four measures of “realized” access to health care, which measures whether someone actually utilizes health care. Including measures of both potential and realized access allows for a deeper analysis of factors that might impact use of health care. For example, individuals with potential access may not realize access because of health beliefs or lack of need.
For measures of potential access, “Health Insurance” is a dummy variable indicating whether an individual reported having health insurance.7 “Paid Sick Leave” is a dummy variable indicating whether an individual receives paid sick leave as a work benefit. “Paid MD Leave” indicates whether an individual receives paid doctor visit leave as a work benefit. “Has PCP” indicates whether a respondent reports having a particular doctor's office, clinic, health center, or other place they usually go if they are sick or need advice about their health.
For measures of realized access, “HC Expenditure” reports total annual expenditure on healthcare (from all sources including out-of-pocket payments, payments by private insurance, and payments by Medicaid, Medicare, or other public programs). Expenditure is measured as actual payments made, rather than charges. “Share Self Pay” reports the fraction of annual healthcare expenditure that is out of pocket for the employee. “Office Visits” reports the annual total number of visits made to office-based medical providers; “ER Visits” reports the annual total number of visits made to emergency rooms.
We also include demographic variables as controls. “Age,” “Married,” and “Ln(Income)” report the respondents age, marital status (married or not), and the natural log of total family income. Finally, “Diabetes,” “Hyperlipidemia,” and “Hypertension” report an individual’s recollection of whether a physician has ever informed them that they have diabetes, hyperlipidemia, or hypertension.
The sample means presented in Table 1 show that union workers have advantages in all four measures of potential access. For example, health insurance coverage is 98% for union workers, 86% for non-union workers, for an advantage of 12%. Union workers also have advantages in all four measures of realized access. For example, Table 1 reports annual health expenditures of $3595 for union workers and $2763 for non-union workers, a difference of $832 (or 30.1%). The results for measures in Table 1 are not adjusted for demographic differences between union workers and non-union workers. The demographic differences are substantial. As shown in Table 1, union workers on average are older, more likely to be married, more likely to have attended college, and have higher average incomes. Union workers are also more likely to have the measured health conditions. The next section describes the process used in this paper to adjust estimates of the access measures in Table 1 for demographic differences. The discussion section will consider the unadjusted and adjusted results for each of the eight access measures.
Methodology
We adjust the results in Table 1 by controlling for demographic variables with the following regression specification for each of the eight access measures:
| 1 |
where “” is the outcome (access variable) of interest for individual “i” at time “t”, is a dummy variable indicating whether an individual is in a union, is a vector of individual-specific controls (including age, age-squared, sex, race, educational attainment, marital status, income), is a year-fixed effect, and is an idiosyncratic error term.
Considering the panel-nature of our data, we also adopt an alternative estimation strategy in which we modify Eq. (1) by adding a variable to control for individual-specific fixed-effects.
| 2 |
where is an individual-specific fixed-effect. Equations (1) and (2) differ in that the estimated effect of union status in Eq. (2) is driven by within-respondent variation (as a result of the individual fixed-effect), which is likely smaller than the overall variation in union status in the sample, given that within-respondent variation only captures variation over a 2-year period.8
Next, for each measure of access, we explore the impact of the ACA on the union advantage by estimating the following difference-in-differences specification:
| 3 |
where is an indicator variable taking a value of 1 after 2014—following the implementation of the central the Affordable Care Act provisions—and a value of 0 in prior periods. is a Census region-fixed effect.9 All other variables are defined as before. Although variables detailing the state of residence of individual survey respondents are unavailable in the public-use MEPS data, inclusion of Census region-by-year fixed effects is intended to capture the aspects of ACA policy that were state driven (e.g., Medicaid expansion or state-specific policies related to health insurance exchanges). To the extent that the state-level policy response is correlated across states within Census regions (e.g., every state in the Northeast region has expanded Medicaid, while only about half of the states in the South region have expanded Medicaid), region-by-year fixed-effects will capture differential exposure to the ACA across regions that may otherwise bias the results. Given the above set-up, for each measure of access, the regression coefficient of interest , provides an estimate of the impact of the ACA on the union advantage. A negative value for is consistent with a reduction in the union advantage for an access measure after the passage of the Affordable Care Act.
Finally, we examine whether there are differences in the susceptibility to public-program enrollment shifting of private insurance plans among insured workers conditional on union status. If union health insurance plans differ systematically from those offered to non-union workers, then union workers with health insurance may be less likely to shift to a public plan after public program expansions. To assess whether passage of the ACA caused differential rates of enrollment shifting for non-union workers, we estimate the following specification on the insured sub-sample of our data:
| 4 |
where is an indicator variable for whether an individual is insured by Medicaid or another public insurance plan, is a dummy variable for whether an individual is not in a union, and all other variables are defined as before. The coefficient captures the enrollment shifting effect of the ACA on non-union workers. A value would indicate that insured non-union workers are more susceptible to private-to-public enrollment shifting than union workers. A key point is that because MEPS is a short-panel, and we do not observe the same insured workers for a significant period both before and after the policy change, it is important to assess the extent to which a positive value of is truly driven by already insured workers switching to public plans (rather than new take-up by the previously uninsured). Thus, we also estimate (3) on a sub-sample of high-income individuals who have a higher likelihood of being previously insured.10 Because expansion of enrollment in public programs following the ACA is primarily driven by increased Medicaid take-up, we also estimate a version of Eq. (4) that uses an indicator for whether a respondent has Medicaid as the dependent variable.
We offer one additional caveat before presenting our results. Although we address many possible sources of unobserved heterogeneity, it is unlikely that we can address all possible sources of unobserved time-varying individual heterogeneity (beyond that which is captured by region-by-year-fixed effects, individual-fixed effects, year-fixed effects, and individual covariates) that may be related to both union status and either healthcare access or utilization. Thus, we are cautious about overemphasizing the causal nature of the estimates obtained via the empirical set-up discussed above. Nonetheless, we believe our results are meaningful insofar as the correlations observed are informative about disparities in access to care linked to union status and how those disparities have evolved in response to the Affordable Care Act.
Results
The union advantage
Table 2 presents results from estimating Eqs. (1) and (2) on variables measuring insurance coverage and three other measures of potential access to care. For binary variables, we estimate Eq. (1) using a simple linear probability model. Each regression includes controls for age, age-squared, sex, race, educational attainment, marital status, income, and year-fixed effects.11 In the top panel of Table 2 we present results without individual-specific fixed-effects. In the bottom panel of Table 2 we present results with individual-specific fixed-effects.
Table 2.
Estimation results – Potential access to care
| No fixed effects | (1) | (2) | (3) | (4) |
|---|---|---|---|---|
| Health insurance | Paid sick leave | Paid MD leave | Has PCP | |
| Union Member |
0.0974*** (0.00170) |
0.116*** (0.00420) |
0.102*** (0.00467) |
0.0688*** (0.00348) |
| N | 256,310 | 122,713 | 121,138 | 233,477 |
| Controls | Y | Y | Y | Y |
| Year FE | Y | Y | Y | Y |
| Individual FE | N | N | N | N |
| Fixed effects | (1) | (2) | (3) | (4) |
|---|---|---|---|---|
| Health insurance | Paid sick leave | Paid MD leave | Has PCP | |
| Union Member |
0.0503*** (0.00941) |
0.170*** (0.0271) |
0.143*** (0.0276) |
0.00840 (0.0158) |
| N | 256,310 | 122,713 | 121,138 | 233,477 |
| Controls | Y | Y | Y | Y |
| Year FE | Y | Y | Y | Y |
| Individual FE | Y | Y | Y | Y |
Table presents regression results from estimating Eq. (1). Estimates obtained from a simple linear probability model. Standard errors in parenthesis, clustered at the individual level.
*p < 0.10, **p < 0.05, ***p < 0.01. Observations weighted using IPUMS-MEPS sample weights. Each regression includes controls for age, age-squared, sex, race, educational attainment, marital status, income, and year-fixed effects.
The results in Table 2 demonstrate the presence of a significant union advantage in health insurance coverage, paid MD leave, paid sick leave, and access to a usual source of care (PCP). during the 1996–2019 period. The top panel of Table 2 indicates that union workers are approximately 9.7% more likely to have health insurance, 11.6% more likely to have paid sick leave, 10.2% more likely to have paid leave for doctor’s visits, and 6.9% more likely to have a regular place of medical care. Even after including individual-specific fixed-effects, the estimated regression coefficient remains statistically significant for all variables except “Has PCP.”
An important—albeit, unsurprising—feature of the results presented in Table 2 is the advantage of union workers in paid leave benefits. That union workers are more likely to receive paid-leave fringe benefits is an important feature of differential access. The Covid-19 pandemic made evident the public health relevance of paid leave and paid physician visit policies, as the inability to take time off work—either when sick with Covid-19 or to get vaccinated—became a stumbling block for pandemic containment efforts in some communities (Mays et al., 2021; McMorrow & Thomas, 2021). To the extent that union membership continues to decline, this suggests that the loss of fringe benefits driven by a declining population of union workers may be a source of negative public health externalities.
Table 3 presents results from estimating Eqs. (1) and (2) on variables measuring healthcare utilization (“realized access”). For continuous variables such as healthcare expenditure, we estimate Eq. (1) using ordinary least squares. For count variables—such as the number of office-based medical provider visits and the number of emergency room visits—we use either negative binominal regression or Poisson pseudo-maximum likelihood.12 As before, each regression includes controls for age, age-squared, sex, race, educational attainment, marital status, income, and year-fixed effects. In the first panel of Table 3 we present results without individual-specific fixed-effects and without controls for chronic health conditions (diabetes, hypertension, hyperlipidemia). In the second panel of Table 3 we present results without individual-specific fixed-effects but with controls for chronic health conditions. In the third panel of Table 3 we add individual-specific fixed-effects but leave off controls for chronic health conditions. Finally, in the last panel of Table 3 we include both individual-specific fixed-effects and controls for chronic health conditions. Consequently, Table 3 tests for the presence of a union advantage by using four different measures, each measure tested across four different statistical models, for a total of 16 tests.
Table 3.
Estimation Results – Healthcare Utilization (Realized Access)
| No fixed effects, no chronic condition | (1) | (2) | (3) | (4) |
|---|---|---|---|---|
| Ln(HC Exp) | Share Self pay | Office visits | ER visits | |
| Union Member |
0.469*** (0.0211) |
− 0.113*** (0.00233) |
0.271*** (0.0179) |
0.168*** (0.0252) |
| N | 256,310 | 202,827 | 256,310 | 256,310 |
| Controls | Y | Y | Y | Y |
| Chronic Condition | N | N | N | N |
| Year FE | Y | Y | Y | Y |
| Individual FE | N | N | N | N |
| No fixed effects, chronic condition | (1) | (2) | (3) | (4) |
|---|---|---|---|---|
| Ln(HC Exp) | Share Self pay | Office visits | ER visits | |
| Union Member |
0.450*** (0.0295) |
− 0.103*** (0.00322) |
0.268*** (0.0251) |
0.142*** (0.0373) |
| N | 139,349 | 108,756 | 139,349 | 139,349 |
| Controls | Y | Y | Y | Y |
| Chronic Condition | Y | Y | Y | Y |
| Year FE | Y | Y | Y | Y |
| Individual FE | N | N | N | N |
| Fixed effects, no chronic condition | (1) | (2) | (3) | (4) |
|---|---|---|---|---|
| Ln(HC Exp) | Share Self pay | Office visits | ER visits | |
| Union Member |
0.131* (0.0792) |
− 0.0473*** (0.0122) |
0.104** (0.0520) |
0.312*** (0.0956) |
| N | 256,310 | 202,827 | 256,310 | 256,310 |
| Controls | Y | Y | Y | Y |
| Chronic Condition | N | N | N | N |
| Year FE | Y | Y | Y | Y |
| Individual FE | Y | Y | Y | Y |
| Fixed effects, chronic condition | (1) | (2) | (3) | (4) |
|---|---|---|---|---|
| Ln(HC Exp) | Share Self pay | Office visits | ER visits | |
| Union Member |
0.153 (0.119) |
− 0.0422** (0.0196) |
0.132 (0.0804) |
0.486*** (0.134) |
| N | 139,349 | 108,756 | 139,349 | 139,349 |
| Controls | Y | Y | Y | Y |
| Chronic Condition | Y | Y | Y | Y |
| Year FE | Y | Y | Y | Y |
| Individual FE | Y | Y | Y | Y |
Table presents regression results from estimating Eq. (1). Estimates for continuous variables obtained using ordinary least squares. Estimates for count variables obtained from either negative binomial regression or Poisson pseudo-maximum likelihood (when individual fixed-effects are included). Standard errors in parenthesis, clustered at the individual level.
*p < 0.10, **p < 0.05, ***p < 0.01. Observations weighted using IPUMS-MEPS sample weights. Each regression includes controls for age, age-squared, sex, race, educational attainment, marital status, income, and year-fixed effects. Table reports regression coefficients, such that—for count data models—one can obtain the incidence rate ratio by exponentiating the parameter estimate
The results in Table 3 show that union membership has a statistically and economically significant impact on healthcare utilization in 14 of the 16 tests. The estimates suggest that being in a union increases annual healthcare expenditures between 13.1 and 46.9% (between $363 and $1296, relative to the mean non-union worker), reduces out-of-pocket expenditures between 4.2 and 11.3 percentage points, increases office-based provider visits between 11 and 31% (0.43 to 1.32 additional office visits per-year, relative to the mean non-union worker), and increases emergency room visits between 18 and 62%. In Table 3, the only estimates that are not significant are the effects of union status on total health expenditures and office visits when we control for chronic health conditions. In both cases the effect size is larger than the effect size in the specification where we exclude controls for chronic conditions. The two results are not statistically significant because the standard error for resource-use is larger when controls for chronic conditions are included. This should be expected, because individuals needing chronic care have heterogeneous resource uses – some chronic conditions require little in resource use, while other chronic conditions are very resource intensive. Interestingly, for seven of the eight measures, the coefficient for “no chronic condition” specifications were not substantially different than the coefficient for the “chronic condition” specification, the exception again being ER visits in the fixed-effects model. This suggests that the difference in realized access between union and non-union workers was similar for individuals with and without chronic conditions. We expect that individuals with the types of chronic conditions that result in high levels of utilization might be attracted to the expanded coverage offered by union plans. Selection of this sort would increase the union premium for the group of individuals with chronic conditions. On the other hand, government funded programs, such as Medicare and Medicaid, have design features that may result in a relatively high proportion of individuals with the types of chronic conditions that result in high levels of utilization. For example, individuals less than age 65 may be eligible for Medicare if they are disabled or need dialysis. Similarly, many state Medicaid programs include “spend down” provisions that allow individuals whose income exceeds eligibility standards to qualify for Medicaid coverage if they have high healthcare expenses. Consequently, both some union plans and some non-union plans might be expected to attract individuals with chronic conditions who have high expenses. Since chronic conditions increase the utilization of both of types of plans, the offsetting effects would reduce any relative difference and therefore also the estimated union premium.
Low income workers
Table 4 extends our baseline specifications to the low-income individuals in our sample. If low-income non-union workers are less likely to be covered by employer-based health plans than high-income non-union workers, then the union premium should be larger for these workers (e.g., given that unions matter less for the probability of being insured for high-income workers). We count individuals as low-income if total family income is less than 200% of the federal poverty line. We report results from our simple specification without fixed-effects and without controls for chronic conditions, such that—for the purpose of comparison—the baseline regression coefficients are contained in the first panels of Tables 2 and 3, respectively.
Table 4.
Estimation results – Low-income sample
| (1) | (2) | (3) | (4) | |
|---|---|---|---|---|
| Health insurance | Paid sick leave | Paid MD leave | Has PCP | |
| Union Member |
0.231*** (0.00748) |
0.274*** (0.0139) |
0.237*** (0.0145) |
0.124*** (0.0105) |
| N | 64,247 | 32,966 | 32,537 | 59,214 |
| Controls | Y | Y | Y | Y |
| Chronic Condition | N | N | N | N |
| Year FE | Y | Y | Y | Y |
| Individual FE | N | N | N | N |
| (1) | (2) | (3) | (4) | |
|---|---|---|---|---|
| Ln(HC Exp) | Share Self Pay | Office Visits | ER Visits | |
| Union Member |
0.723*** (0.0670) |
− 0.152*** (0.00762) |
0.423*** (0.0563) |
0.0826 (0.0665) |
| N | 64.247 | 42.899 | 64.247 | 64.247 |
| Controls | Y | Y | Y | Y |
| Year FE | Y | Y | Y | Y |
| Individual FE | N | N | N | N |
Table presents regression results from estimating our primary specification on a sample of low-income survey respondents. Estimates for continuous variables obtained using ordinary least squares. Estimates for binary variables obtained from a linear probability model. Estimates for count variables obtained from negative binomial regression. Standard errors in parenthesis, clustered at the individual level.
*p < 0.10, **p < 0.05, ***p < 0.01. Observations weighted using IPUMS-MEPS sample weights. Each regression includes controls for age, age-squared, sex, race, educational attainment, marital status, income, and year-fixed effects. Table reports regression coefficients, such that—for count data models—one can obtain the incidence rate ratio by exponentiating the parameter estimate
The results presented in Table 4 suggest that the union advantage is larger for low-income workers. For every dependent variable except emergency room visits, the estimated coefficient in the low-income sample is increased in absolute magnitude. For example, low-income workers in a union are approximately 23% more likely to be covered by health insurance compared to their non-union counterparts: an effect nearly double in magnitude compared to the estimate obtained from the full sample (9.74%). The results in Table 4 thus suggest that being covered under a collective bargaining agreement is a particularly important source of disparity in coverage and access to care for low-income workers.
The smaller union advantage for emergency room visits among low-income workers likely reflects the complex interaction of a series of financial incentives when low-income workers receive insurance. One incentive is that new enrollees may reduce the use of the ER as a substitute for office visits. Sommers et al. (2016) contrasted the experience of two states (Kentucky, Arkansas) that participated in the Medicaid expansion following ACA with a state that did not participate (Texas). Relative to Texas, expansion states had a 5.1% drop in the share of families that reported EDs as their usual source of care, a relative drop of 1.7% of families that used the ED and an average of 0.1 fewer visits to the ED per family.
The ACA and the union advantage
A major rationale for the passage of the Affordable Care Act was to address the disparities in health insurance coverage and access to care across the labor market that resulted from the employer-sponsored health insurance system. If the ACA was successful, we should see a reduction (or elimination) of the union advantage after the ACA’s major provisions become effective in 2014. Figure 1 is suggestive, with union coverage roughly constant over the period shown in the graph, and non-union coverage trending down from 2000 until the ACA was enacted, then expanding thereafter.13
Fig. 1.
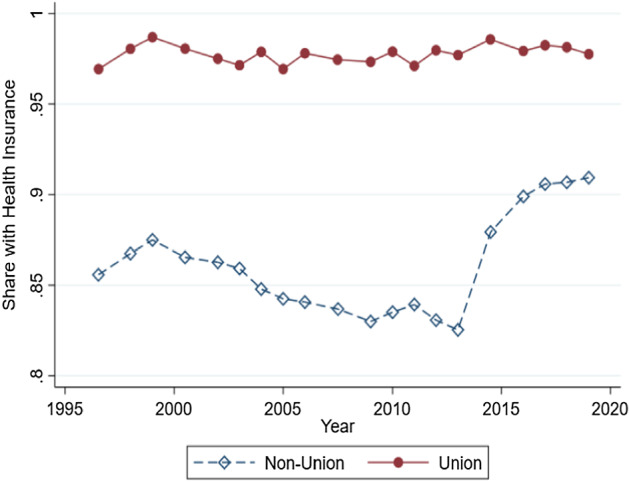
Health Insurance Coverage by Union Status, 1996–2019 Figure presents a binned scatterplot of health insurance coverage by union status for employed workers for the entire sample period. Observations weighted by IPUMS-MEPS sample weights
To assess whether the ACA succeeded in reducing coverage disparities by union status, Table 5 presents our results from estimating Eq. (3). The results in Table 5 suggest that the ACA reduced the union advantage in health insurance coverage, visits to office-based providers, and the out-of-pocket expenditure share. As an example, the advantage in health insurance coverage for union members prior to the ACA dropped by 4.24 percentage points post-ACA. The results in Table 5 also suggest that the union advantage in out-of-pocket payment share drops from 11 percentage points to 7.2 percentage points. The union advantage in office-based provider visits is also statistically significantly reduced. In contrast, the union advantage in having a primary care provider, total healthcare expenditures, emergency room visits, and other fringe benefits (paid sick leave and paid MD leave) is either not statistically different after the ACA or increases (in the case of paid MD leave). Thus, although the ACA does appear to have marginally reduced disparities in coverage and access to care along some important dimensions, there nonetheless remains a significant union advantage (even among those variables where the union advantage appears to be reduced).
Table 5.
Estimation results – Affordable care Act
| (1) | (2) | (3) | (4) | |
|---|---|---|---|---|
| Health Insurance | Paid Sick Leave | Paid MD Leave | Has PCP | |
| Union Member |
0.100*** (0.00198) |
0.116*** (0.00478) |
0.0992*** (0.00530) |
0.0571*** (0.00373) |
| Union Post ACA |
− 0.0424*** (0.00392) |
0.00367 (0.0103) |
0.0289** (0.0114) |
− 0.00838 (0.00849) |
| N | 256,310 | 122,713 | 121,138 | 233,477 |
| Controls | Y | Y | Y | Y |
| Chronic Condition | N | N | N | N |
| Year FE | Y | Y | Y | Y |
| Individual FE | N | N | N | N |
| Region-by-Year FE | Y | Y | Y | Y |
| (1) | (2) | (3) | (4) | |
|---|---|---|---|---|
| Ln(HC Exp) | Share Self pay | Office visits | ER visits | |
| Union Member |
0.436*** (0.0237) |
− 0.109*** (0.00267) |
0.223*** (0.0186) |
0.160*** (0.0287) |
| Union Post ACA |
− 0.0260 (0.0517) |
0.0319*** (0.00548) |
− 0.0650* (0.0373) |
− 0.0754 (0.0631) |
| N | 256,310 | 202,827 | 256,310 | 256,310 |
| Controls | Y | Y | Y | Y |
| Chronic Condition | N | N | N | N |
| Year FE | Y | Y | Y | Y |
| Individual FE | N | N | N | N |
| Region-by-Year FE | Y | Y | Y | Y |
Table presents regression results from estimating Eq. (2). Estimates for continuous variables obtained using ordinary least squares. Estimates for binary variables obtained from a linear probability model. Estimates for count variables obtained from negative binomial regression. Standard errors in parenthesis, clustered at the individual level.
*p < 0.10, **p < 0.05, ***p < 0.01. Observations weighted using IPUMS-MEPS sample weights. Each regression includes controls for age, age-squared, sex, race, educational attainment, marital status, income, region-by-year fixed-effects, and year-fixed effects. Table reports regression coefficients, such that—for count data models—one can obtain the incidence rate ratio by exponentiating the parameter estimate. Because the panel-structure of the data only follows individuals for 2 years, we omit individual fixed-effects here. Inclusion of individual fixed-effects would limit the identifying variation to the small group of individuals whose two-period panel allows them to have observations before and after the enactment of the main ACA provisions in 2014
Table 6 indicates that a similar reduction in the union advantage prevails for low-income workers—the group most likely to be impacted by the ACA’s main provisions. In particular, the union advantage in health insurance coverage and out-of-pocket payments is once again reduced (although not eliminated), but there is no statistically significant reduction in the union advantage for any other measure of access or utilization. The coefficient for the effect of the ACA on the union advantage in visits to office-based providers remains negative but is now statistically insignificant (possibly due to the reduced sample size). However, the (marginally) increased magnitude of the reduction in the union advantage for health insurance coverage and out-of-pocket payment share in the low-income sample is suggestive regarding the mechanism by which the ACA reduced the union advantage. Because the effect (reduction in union advantage) appears slightly larger in the low-income sample, this suggests that it is Medicaid expansion—rather than the employer mandate—that is primarily responsible for reducing the union advantage.
Table 6.
Estimation Results – Affordable Care Act, Low-Income Workers
| (1) | (2) | (3) | (4) | |
|---|---|---|---|---|
| Health insurance | Paid sick leave | Paid MD leave | Has PCP | |
| Union Member |
0.216*** (0.00909) |
0.263*** (0.0157) |
0.223*** (0.0162) |
0.0969*** (0.0114) |
| Union Post ACA |
− 0.0672*** (0.0168) |
0.0404 (0.0330) |
0.0756** (0.0350) |
− 0.0228 (0.0253) |
| N | 64,247 | 32,966 | 32,537 | 62,135 |
| Controls | Y | Y | Y | Y |
| Chronic Condition | N | N | N | N |
| Year FE | Y | Y | Y | Y |
| Individual FE | N | N | N | N |
| Region-by-Year FE | Y | Y | Y | Y |
| (1) | (2) | (3) | (4) | |
|---|---|---|---|---|
| Ln(HC Exp) | Share Self pay | Office visits | ER visits | |
| Union Member |
0.601*** (0.0766) |
− 0.137*** (0.00911) |
0.305*** (0.0540) |
0.0639 (0.0850) |
| Union Post ACA |
0.00804 (0.151) |
0.0544*** (0.0170) |
− 0.0802 (0.117) |
0.0687 (0.147) |
| N | 64,247 | 42,899 | 64,246 | 64,241 |
| Controls | Y | Y | Y | Y |
| Chronic Condition | N | N | N | N |
| Year FE | Y | Y | Y | Y |
| Individual FE | N | N | N | N |
| Region-by-Year FE | Y | Y | Y | Y |
Table presents regression results from estimating Eq. (2) for low-income workers (those with total family incomes less that 200% of the federal poverty line). Estimates for continuous variables obtained using ordinary least squares. Estimates for binary variables obtained from a linear probability model. Estimates for count variables obtained from negative binomial regression. Standard errors in parenthesis, clustered at the individual level.
*p < 0.10, **p < 0.05, ***p < 0.01. Observations weighted using IPUMS-MEPS sample weights. Each regression includes controls for age, age-squared, sex, race, educational attainment, marital status, income, region-by-year fixed-effects, and year-fixed effects. Table reports regression coefficients, such that—for count data models—one can obtain the incidence rate ratio by exponentiating the parameter estimate. Because the panel-structure of the data only follows individuals for two years, we omit individual fixed-effects here. Inclusion of individual fixed-effects would limit the identifying variation to the small group of individuals whose two-period panel allows them to have observations before and after the enactment of the main ACA provisions in 2014
Enrollment shifting
Finally, we examine the extent to which union workers are differentially subject to public program enrollment shifting out of private insurance. Specifically, we report estimates from Eq. (4) on the sub-sample of insured workers. However—in the absence of any adjustments—the result will be an upwardly biased estimate of enrollment shifting because some new enrollment into ACA programs comes from the previously uninsured. Consequently, we also report results from a restricted version of Eq. (4) where we limit the sample to only insured high-income workers, to limit bias that might result from expansion of coverage among the uninsured. This reflects the fact that high-income workers are more likely to have health insurance coverage in the pre-ACA period. We define high-income workers as individuals with total family income more than 400% of the federal poverty line.14 For comparison, we report estimates from a sample that excludes this group (for which the ACA should have a larger effect). Finally, we also include estimates from a specification examining the impact on Medicaid specifically, rather than public programs in general.
The results in Table 7 suggest that union workers are less likely to be subject to private-to-public enrollment shifting than non-union workers. In particular, the results in Column (1) of Table 7 indicate that the passage of the ACA increased the probability of an insured non-union worker having a public health insurance plan by approximately 2.75 percentage points, relative to union workers. This would be 27,500 per million insured non-union insured workers, a large number given the change in coverage due to ACA. Importantly, this amount includes both workers who switched enrollment from non-union insurance to public insurance and non-union workers who did not have insurance until they enrolled in the ACA.
Table 7.
Estimation Results—ACA and Enrollment Shifting Among the Insured
| (1) | (2) | (3) | (4) | (5) | |
|---|---|---|---|---|---|
| Public Insurance | Public Insurance (High Income Only) | Public Insurance (Excluding High Income) | Medicaid | Medicaid (Excluding High Income) | |
| Non Union | 0.0302***(0.00115) | 0.00612***(0.000518) | 0.0526***(0.00250) | 0.0258***(0.00132) | 0.0450***(0.00291) |
| Non Union Post | 0.0275***(0.00350) | 0.00895***(0.00215) | 0.0466***(0.00796) | 0.0338***(0.00796) | 0.0506***(0.00930) |
| N | 212,934 | 99,391 | 113,543 | 212,934 | 113,543 |
| Controls | Y | Y | Y | Y | Y |
| Chronic Condition | N | N | N | N | N |
| Year FE | Y | Y | Y | Y | Y |
| Individual FE | N | N | N | N | N |
| Region-by-Year FE | Y | Y | Y | Y | Y |
Table presents results from estimating Eq. (3) on the sub-sample of insured individuals. The dependent variable is either (A) a dummy variable indicating whether an individual had a public health insurance plan, or (B) a dummy variable indicating whether an individual had Medicaid. Estimates are obtained using a linear probability model. Standard errors in parenthesis, clustered at the individual level.
*p < 0.10, **p < 0.05, ***p < 0.01. Observations weighted using IPUMS-MEPS sample weights. Each regression includes controls for age, age-squared, sex, race, educational attainment, marital status, income, region-by-year-fixed effects, and year-fixed effects
Column (2) adjusts for the possibility that our estimate is biased upward due to enrollment into ACA programs among the previously uninsured. In Column (2) we restrict the sample to high income individuals who were likely to have insurance prior to the ACA’s passage. The estimated coefficient is reduced, but nonetheless statistically significant, suggesting that the ACA increased the probability that an insured high-income non-union worker is on a public health insurance program by just less than 1 percentage point (0.90%) relative to a union worker. Column (3) illustrates that the effect of the ACA on non-union take-up of public programs is larger when high-income households are excluded—suggesting these households may be more prone to enrollment shifting than the high-income group. Columns (4) and (5) examine enrollment shifting to Medicaid in particular, rather than public programs in general. The magnitude of the coefficients suggests that the enrollment shifting response in Columns (1)-(3) is primarily driven by enrollment in Medicaid. When high income households (those least likely to be eligible for Medicaid) are excluded, Column (5) indicates that the ACA increased the probability an insured non-union worker is on Medicaid by nearly 5 percentage points.
In Table 8, we present results from an alternative specification that regresses Medicaid status on an interaction between Census region-fixed effects and an indicator variable for the post-ACA period. We estimate this specification separately for union and non-union samples. This specification serves two purposes. First, this specification acts as a pseudo placebo test. Insofar as Medicaid expansion is concentrated among states in certain Census regions, this specification allows us to make sure we are not finding effects (or rather, that the effects are small) in regions where a smaller proportion of states are Medicaid expansion states. Second, this specification functions as an alternative test for enrollment shifting. If growth in Medicaid enrollment in expansion states is larger for insured non-union workers, this would be suggestive of greater enrollment shifting (relative to union workers) among this group.
Table 8.
Effect of ACA on Insured Workers by Census Region and Union Status
| (1) | (2) | |
|---|---|---|
| Medicaid (Non-Union) | Medicaid (Union) | |
| Post ACA |
0.0866*** (0.00752) |
0.0206 (0.0222) |
| Omitted Region: South | ||
| Post ACA Northeast |
0.0631*** (0.0176) |
0.0263 (0.0264) |
| Post ACA Midwest | 0.0304**(0.0127) | 0.0184(0.0271) |
| Post ACA West | 0.0655*** | 0.0695**(0.0327) |
| N | 184,416 | 28,519 |
| Controls | Y | Y |
| Year FE | Y | Y |
| Region-by-Year FE | Y | Y |
| Individual FE | N | N |
| Chronic Condition | N | N |
Table 8 presents results from regressions of Medicaid status on an interaction between a post-ACA indicator variable and Census region indicator variables. Column (1) presents results for insured non-union workers. Column (2) presents results for insured union workers. Estimates are obtained using a linear probability model. Standard errors in parenthesis, clustered at the individual level.
*p < 0.10, **p < 0.05, ***p < 0.01. Each regression includes controls for age, age-squared, sex, race, educational attainment, marital status, income, region-by-year-fixed effects, and year-fixed effects
For each Census region, the results in Table 8 suggest that—for non-union workers—the effect of the ACA on Medicaid enrollment was larger in regions where a larger fraction of the population was subject Medicaid expansion. Because the omitted region category is the “South” Census region, the results in Column (1) suggest that—relative to the impact in the “South” region—the ACA increased the probability a non-union worker was on Medicaid by 6.3% in the “Northeast” region, 3.4% in the “Midwest” region, and 6.5% in the “West” region. In contrast, not only is the “Post ACA” variable insignificant, but there is no statistically significant additional impact in either the “Northeast” or “Midwest” regions for union workers. Only in the “West” region did the probability of Medicaid enrollment increase among union workers in the post-ACA period. The results in Table 8 thus indicate that increased Medicaid enrollment was in-fact concentrated in Census regions where more states expanded Medicaid. Second, the results in Table 8 indicate that the increase in Medicaid enrollment for insured non-union workers in response to Medicaid expansion was greater than for insured union workers, suggestive of possible enrollment shifting among the former.
Taken together, the results in Table 7 and 8 suggest that policymakers developing budgets for new public programs may want to consider the implications of enrollment shifting and/or differential rates of program participation due to union coverage (or lack thereof) in their region.
Additional discussion
The ACA
The ACA appears to have reduced disparities in access to care between union and non-union workers along some important dimensions. For example, for one measure of potential access, the 10% higher coverage for union members prior to the ACA dropped 4.24 percentage-points post ACA, resulting in a 5.76% advantage post-ACA difference (a statistically significant pre/post ACA difference). Since paid sick leave and paid MD leave were not addressed in the ACA, it is not surprising that there was no improvement in these measures. It is worth noting that post-ACA there was a statistically significant increase in the union advantage for paid MD leave.
The ACA appears to have done somewhat better when disparities are measured for realized access. All four measures show a reduction in the disparity between union and non-union workers, and the difference is statistically significant for two of the measures. The union advantage in out-of-pocket payment share dropped from 10.9 percentage points to 7.71 percentage points, and the union advantage in office-based provider visits also declines in a statistically significant fashion (although statistical significance is lost in the low-income sample). For ER visits there was a small reduction (a reduction of about a third of the difference), but the large standard error results in this not being statistically significant. There was also a small reduction in the difference in expenditures for union and non-union workers, also not statistically significant.
In summary, for those measures it was intended to address (health insurance coverage, out-of-pocket costs), the ACA seems to have reduced disparities according to union status. Despite this, measurable disparities remain. It appears that lack of paid sick leave and paid MD leave remain significant barriers to potential access, and this could account for some of the remaining difference in measures of realized access. Further, the structure of some of the ACA insurance plans—characterized by high deductibles and providing primarily catastrophic coverage—may have limited gains in some measures of realized access, despite expanded health insurance coverage.
Enrollment shifting
Tables 7 and 8 indicates that union workers are less subject to “enrollment shifting” resulting from expansion of public health insurance plans. This suggests that unions may confer a positive externality by reducing the cost of public health insurance programs as a result of bargaining over fringe benefits. To the extent that this is true, the decline in union membership over the course of the twentieth and early twenty-first century may be the source of economically meaningful negative externalities (in the form of increased costs for the public sector).
Expanding public coverage may lead employers and employees to drop health insurance coverage, shift enrollment to the public plan, and share the savings via higher wages. The presence of unions may reduce this process for several reasons. First, the presence of unions tends to produce relatively strong health insurance coverage for employees. Consequently, it is likely that a shift to a public program would result in weaker health care coverage. Second, the distribution of the gains and losses from enrollment shifting would be unequal between healthy and unhealthy union households. This is particularly important because some job searchers—for example those who have family members with costly chronic diseases—may select a union job because it offers strong health care coverage. Gruber (2000) points to evidence that wives are more likely to select jobs that offer health insurance if their husbands lack coverage. As a result, if a union agreed to trade health benefits for wages it would be potentially divisive among union members.15 Third, furthering our earlier discussion of political factors, Feldstein (2006) points out that labor unions spread their organizations’ cost of over a series of causes on their agenda. We suggest that given a multi-item agenda, if a union pursues a position that is divisive for its members the union risks the success of other causes on its agenda.
For these reasons, unions may push back against management proposals to shift enrollment from employer insurance to public programs. In one such case, Domonoske (2016) reported that Verizon workers in 2016 went out on strike. Verizon offered a 6% raise, but the offer included “critical changes to its legacy contracts to reduce health care costs and retirement benefits." In estimating the importance of union push back policymakers could consider that union membership rates vary from region to region.
Conclusion
We find a “union advantage” in health insurance coverage and access to care. We describe this advantage with eight different measures of potential and realized access to care which are tested with a range of statistical models. Compared to non-union workers, union workers are more likely to have health insurance coverage (98% vs. 86%), more likely to have a regular care provider (83% vs. 74%), visited office-based providers 31% more often (5.64 vs. 4.27 visits), spend $832 more on healthcare annually, and pay a lower share of their expenditures out-of-pocket (26% vs. 37%). The ACA appears to have reduced the union advantage by increasing coverage rates among non-union workers. However, a significant union advantage remains across the measures we study, even after the ACA’s main provisions become effective. Finally, insured union workers appear to be less subject to private-to-public enrollment shifting than non-union workers. Union bargaining over fringe benefits may thus have positive externalities in the form of cost reductions to the public sector. When estimating the likely shifts in enrollment associated with an expansion of public programs, policymakers may want to consider the proportion of workers (in the relevant region) covered by union-negotiated health insurance plans. The issue of enrollment shifting also shows how the ACA might be expected to interact with existing labor market institutions, such as unions. One important characteristic of the ACA is the employer mandate. The mandate required some employers to either offer insurance or pay a penalty. Consequently, the mandate and the tendency of the unions to resist benefit cuts are mutually reinforcing, as both should work against enrollment shifting.
Appendix A: Additional trend plots
See Fig. 2.
Fig. 2.

Additional Trend Plots Figure presents binned scatter plots for additional dependent variables over the sample period. Observations weighted by IPUMS-MEPS sample weights
Footnotes
The normative justification for these coverage disparities appears to be tenuous at best, given the accidental fashion in which the United States came to rely on employer-sponsored health insurance (e.g., as a response by employers to wage- and price-controls imposed during World War II, see Thomasson, 2002 and Buchmueller and Monheit, 2009).
Source: Bureau of Labor Statistics (2022).
More recently, Health Savings Accounts offer a triple advantage, earnings on the account are exempt from taxes.
Morrisey’s third reason the United States came to rely on employer-sponsored health insurance was as a response by employers to wage- and price-controls imposed during World War II, (see also Thomasson, 2002 and Buchmueller and Monheit, 2009). The normative justification for coverage disparities appears to be tenuous at best, given the accidental fashion in which the United States came to rely on employer-sponsored health insurance. Starr ( 2017) suggests the health care system evolved, like other social structures, as an outcome of historical processes in which particular structures are created because individuals pursue their interests and ideals within larger arenas of social and political power. Unions make Starr’s short list of important actors in both the process of financing health care and the process of providing access to health care to please their constituents.
For a discussion of the health production function see Feldstein (2012).
Households which reported either “yes,” “no,” or for which the IPUMS MEPS reports that union status was “determined in previous round.”.
Nyman 1999 suggests that in addition to value from insurance due to avoiding risk of financial loss, health insurance is demanded because it is a mechanism for gaining access to health care that would otherwise be unaffordable. Thus Nyman the economist and Andersen the sociologist are both considering that health insurance adds value because it creates the potential for access.
Of the 130,134 individuals included in the sample, 1,887 experience a change in union status over the two periods of observation. 881 individuals exit a union and 1,006 individuals become union members. Because individual-specific fixed-effects absorb any time-invariant individual-specific heterogeneity, the regression co-efficient obtained from estimating Eq. (1’) will be driven entirely by the variation in union status stemming from those 1,887 individuals who experience a change in union status from 1 year to the next.
Survey respondents are indicated as residing in one of four Census Regions, comprised of the following states. South: Alabama, Arkansas, Delaware, District of Columbia, Florida, Georgia, Kentucky, Louisiana, Maryland, Mississippi, North Carolina, Oklahoma, South Carolina, Tennessee, Texas, Virginia, and West Virginia. Northeast: Connecticut, Maine, Massachusetts, New Hampshire, New Jersey, New York, Pennsylvania, Rhode Island, and Vermont. Midwest: Indiana, Illinois, Iowa, Kansas, Michigan, Minnesota, Missouri, Nebraska, North Dakota, Ohio, South Dakota, and Wisconsin. West: Alaska, Arizona, California, Colorado, Hawaii, Idaho, Montana, Nevada, New Mexico, Oregon, Utah, Washington, and Wyoming.
For example, Davison, Call and Blewett (2004) cite 2001 and 2002 CPS data that indicates 18% of the individuals under 100% of the poverty level have employer sponsored health insurance (ESI) and 84% of the individual earning over 300% of poverty have ESI.
Full regression results available upon request. Note that all individual-specific time-invariant controls (sex, race, etc.) will be washed out of regression specifications including individual-fixed effects.
When individual-fixed effects are included in the count-data models, we make use of the “ppmlhdfe” package in Stata, which implements Poisson pseudo-maximum likelihood regressions with multi-way fixed effects as described in Correia, Guimaraes, and Zylkin (2020).
Additional trend plots presented in Appendix A.
For a two-person household in 2021 this corresponds to a total family income of approximately $70,000. This definition corresponds to the “high income” category in the IPUMS-MEPS variable “povcat.”.
Goldstein and Pauly (1976) suggest that group health insurance could be viewed as a “local public good.” In other words, each covered individual has the same unlimited access to benefits. Viewed in this light, an attempt to trade health benefits for wages would be putting restrictions on those individuals who most used the public good.
Publisher's Note
Springer Nature remains neutral with regard to jurisdictional claims in published maps and institutional affiliations.
Contributor Information
Luke Petach, Email: luke.petach@belmont.edu.
David K. Wyant, Email: david.wyant@belmont.edu
References
- Andersen RM. Revisiting the behavioral model and access to medical care: does it matter? Journal of health and social behavior. 1995;36:1–10. doi: 10.2307/2137284. [DOI] [PubMed] [Google Scholar]
- Barbaresco S, Courtemanche C, Qi Y. Impacts of the affordable care actdependent coverage provision on health-related outcomes of young adults. Journalof Health Economics. 2015;40:54–68. doi: 10.1016/j.jhealeco.2014.12.004. [DOI] [PubMed] [Google Scholar]
- Blewett, L., Drew, J., Griffin, R., & Williams, K. (2019). IPUMS Health surveys: medical expenditure panel survey, Version 1.1. Minneapolis, MN: IPUMS, 2019. 10.18128/D071.V1.1. https://meps.ipums.org
- Blumenthal D. Employer-sponsored health insurance in the United States—origins and implications. New England Journal of Medicine. 2006;355:82–88. doi: 10.1056/NEJMhpr060703. [DOI] [PubMed] [Google Scholar]
- Buchmeuller T, Levinson Z, Levy H, Wolfe B. Effect of the affordable care acton racial and ethnic disparities in health insurance coverage. American Journal of Public Health. 2016;106(8):1416–1421. doi: 10.2105/AJPH.2016.303155. [DOI] [PMC free article] [PubMed] [Google Scholar]
- Buchmueller T, Dinardo J, Valletta R. Union effects on health insuranceprovision and coverage in the United States. ILR Review. 2002;55(4):610–627. doi: 10.1177/001979390205500403. [DOI] [Google Scholar]
- Buchmueller T, Monheit A. Employer-sponsored health insurance and the promise of health insurance reform. INQUIRY: The Journal of Healthcare Organization, Provision, and Financing. 2009;46(2):187–202. doi: 10.5034/inquiryjrnl_46.02.187. [DOI] [PubMed] [Google Scholar]
- Buettgens, M., Banthin, J. (2020). The Health Insurance Policy Simulation Model for 2020: Current-Law Baseline and Methodology. The Urban Institute, https://www.urban.org/research/publication/health-insurance-policy-simulation-model2020/view/full_report
- Claxton, G., Rae, M., Young, G, Kurani, K, Whitmore, H., Kerns, J., Cifuentes, J., Shimavonian, G., & Damico, A. (2021). 2021 Employer Health Benefits Survey. Kaiser FamilyFoundation. https://www.kff.org/health-costs/report/2021-employer-health-benefitssurvey/
- Correia S, Guimaraes P, Zylkin T. Fast Poisson Estimation with High-Dimensional Fixed-Effects. The Stata Journal. 2020;20(1):5–115. doi: 10.1177/1536867X20909691. [DOI] [Google Scholar]
- Coughlin TA, Ku L, Holahan J, Heslam D, Winterbottom C. State responses to the Medicaid spending crisis: 1988 to 1992. Journal of Health Politics, Policy andLaw. 1994;19(4):837–864. doi: 10.1215/03616878-19-4-837. [DOI] [PubMed] [Google Scholar]
- Courtemanche C, Marton J, Ukert B, Yelowitz A, Zapata D. Early effects ofthe Affordable Care Act on health care access, risky health behaviors, and selfassessed health. Southern Economic Journal. 2018;84(3):660–691. doi: 10.1002/soej.12245. [DOI] [Google Scholar]
- Cunningham R, Cunningham RM. The Blues: A history of the Blue Cross and Blue Shield system. Northern Illinois University Press; 1997. [Google Scholar]
- Davidson, G., Blewett, L.A., & Call, K.T. (2004). Public Program Crowd Out of Private Coverage: What Are the Issues? Princeton, NJ: Robert Wood Johnson Foundation; 2004. June. Research Synthesis Report No. 5 [PubMed]
- Domonoske C. (2016). Tens Of Thousands Of Verizon Workers Go On Strike. https://www.npr.org/sections/thetwo-way/2016/04/13/474052786/tens-of-thousands-ofverizon-workers-go-on-strike
- Duggan, M., Goda, G., & Li, G. (2020). The Effects of the Affordable Care Act on the Near-Elderly: Evidence for Health Insurance Coverage and Labor Market Outcomes. NBER Working Paper, No. 27936.
- Even WE, Macpherson DA. The impact of unionism on fringe benefitcoverage. Economics Letters. 1991;36(1):87–91. doi: 10.1016/0165-1765(91)90061-O. [DOI] [Google Scholar]
- Feldstein P. J. (2012). Chapter 4 The Production of Health: the impact of Medical Services on Health. In: Health care economics. 7th ed. Cengage Learning. pp. 75–104.
- Feldstein PJ. The politics of health legislation: An economic perspective. 3. Health Administration Press; 2006. [Google Scholar]
- Freeman R. The effect of unionism on fringe benefits. ILR Review. 1981;34(4):489–509. doi: 10.1177/001979398103400401. [DOI] [Google Scholar]
- Freeman R, Medoff J. What Do Unions Do. Basic Books; 1984. [Google Scholar]
- Goldstein, G.S., & Pauly, M.V. (1976). Group health insurance as a local public good. In The role of health insurance in the health services sector (pp. 73–114). NBER.
- Gruber J. Health insurance and the labor market. Handbook of Health Economics. 2000;1:645–706. doi: 10.1016/S1574-0064(00)80171-7. [DOI] [Google Scholar]
- Gruber J, Sommers B. The Affordable Care Act’s effects on patients, providers, and the economy: What we’ve learned so far. Policy Analysis and Management. 2019;38(4):1028–1052. doi: 10.1002/pam.22158. [DOI] [Google Scholar]
- Harris E, Mok S. How CBO estimates the effects of the Affordable Care Act on the labor market. Congressional Budget Office; 2015. [Google Scholar]
- Hudson JL, Selden TM, Banthin JS. The impact of SCHIP on insurance coverage of children. INQUIRY: The Journal of Health Care Organization, Provision, and Financing. 2005;42(3):232–254. doi: 10.5034/inquiryjrnl_42.3.232. [DOI] [PubMed] [Google Scholar]
- Knepper M. From the fringe to the fore: Labor unions and employeecompensation. Review of Economics and Statistics. 2020;102(1):98–112. doi: 10.1162/rest_a_00803. [DOI] [Google Scholar]
- Liu J, Yu F, Song L. A systematic investigation on the research publications that have used the medical expenditure panel survey (MEPS) data through a bibliometrics approach. Library Hi Tech. 2020;38(4):705–721. doi: 10.1108/LHT-09-2019-0185. [DOI] [Google Scholar]
- Mays V, Cochran S, Sprague A, Heymann J. Social justice is not the Covid-19 vaccine alone: It is addressing structural racism through policies that shape health. American Journal of Public Health. 2021;111:S75–S79. doi: 10.2105/AJPH.2021.306442. [DOI] [PMC free article] [PubMed] [Google Scholar]
- McMorrow, S., & Thomas, T. (2021). Historic vaccination patterns provide insights for Covid-19 vaccine rollout. Urban Institute. https://www.urban.org/research/publication/historic-vaccination-patterns-provideinsights-covid-19-vaccine-rollout
- Menifield CE, Bian M, Fletcher A. Reducing the number of uninsured children: An examination of the chip program. Journal of Cultural Diversity. 2021;28(3):59–66. [Google Scholar]
- Morrisey MA. Health insurance. 3. Health Administration Press; 2020. [Google Scholar]
- Nyman JA. The value of health insurance: The access motive. Journal of Healtheconomics. 1999;18(2):141–152. doi: 10.1016/s0167-6296(98)00049-6. [DOI] [PubMed] [Google Scholar]
- Pauly MV. Health benefits at work: An economic and political analysis of employment based health insurance. University of Michigan Press; 1999. [Google Scholar]
- Reynolds MM, Brady D. Bringing you more than the weekend: Union membershipand self-rated health in the United States. Social Forces. 2012;90(3):1023–1049. doi: 10.1093/sf/sor023. [DOI] [Google Scholar]
- Scheffler RM. The United Mine Workers' Health Plan: An analysis of the cost-sharing program. Medical Care. 1984;22:247–254. doi: 10.1097/00005650-198403000-00008. [DOI] [PubMed] [Google Scholar]
- Snavely, B., & Priddle A. (2015). Can UAW pull off brave, new health deal? Detroit Free Press. Aug 22 2015. https://www.freep.com/story/money/cars/2015/08/22/uaw-chief-aimsaddress-health-care-costs-talks/32048489/
- Sommers B, Blendon R, Orav EJ. Both the ‘private option’ and traditionalmedicaid expansion improved access to care for low-income adults. Health Affairs. 2016;35(1):96–105. doi: 10.1377/hlthaff.2015.0917. [DOI] [PubMed] [Google Scholar]
- Starr, P. (2017). The social transformation of American medicine: The rise of a sovereign profession and the making of a vast industry. 2nd ed. Basic Books.
- The Massachusetts Coalition of Taft-Hartley Trust Funds, Inc. (2022). “Taft-Hartley Trust Funds.” http://www.macoalthtf.org/taft-hartley-trust-funds.html
- Thomasson M. From sickness to health: The twentieth-century development of U.S. Health Insurance. Explorations in Economic History. 2002;39:233–253. doi: 10.1006/exeh.2002.0788. [DOI] [Google Scholar]
- U.S. Department of Labor, Bureau of Labor Statistics. (2021). Employer Costs for Employee Compensation, Historical Listing March 2004-September 2021.
- U.S. Department of Labor, Bureau of Labor Statistics. (2022). Union Members—2021 January2022. https://www.bls.gov/news.release/pdf/union2.pdf
- Watts C, Christianson JB, Heineccius L, Trude S. The role of public employers in a changing health care market. Health Affairs. 2003;22(1):173–180. doi: 10.1377/hlthaff.22.1.173. [DOI] [PubMed] [Google Scholar]
- Weil LA. Organized labor and health reform: Union interests and the Clinton plan. Journal of Public Health Policy. 1997;18(1):30–48. doi: 10.2307/3343356. [DOI] [PubMed] [Google Scholar]