

Abstract
Coronavirus pandemic has driven the entire world to crush. It has influenced every single segment of society straightforwardly and in a roundabout way. There is an unexpected break in everything. A monetary downturn, psychological maladjustment, and joblessness are spreading its underlying foundations alongside the spread of COVID-19. To forestall the spread of COVID-19, the Indian government has made different strides. One such measure was the whole country lockdown, which was put in place on March 22, 2020. Despite the fact that the countrywide lockdown was implemented to curtail the spread of infection, numerous issues have risen alongside the lockdown. In this chapter, we compare the impact of COVID-19 on the five worst-hit countries in the world. Further, temporal sentiment analysis of Twitter data to understand the effect of lockdown on public perception in these five countries is presented. Results reveal that sentiments in the United States vary from neutral to negative, whereas, in India and Italy, people have mixed attitudes toward the 2019-nCOV-2 virus crises. Further, the impact of government control policies through various stages of lockdown in India is analyzed, which provides interesting aspects of public emotions. Some of the most trending hashtags such as #WorkFromHome and #MigrantLabour are also analyzed using sentiment analysis techniques. It was observed that most people had positive sentiments about working from home during the lockdown. At the same time, migrant workers’ stories dominated on Twitter.
Keywords: Sentiment analysis, COVID-19, lockdown, social media analysis, #WorkFromHome, #MigrantLabour
7.1. Introduction
The coronavirus disease (2019-nCoV) pandemic is an unprecedented crisis that has affected almost every individual in view of poverty, sustainability, and development all over the globe. Therefore, it becomes even more important to analyze such an effect on the development of people’s lives (Cruz & Ahmed, 2018). After the spread of the SARS-COV-2 epidemic out of China, evolution in the coronavirus disease (2019-nCoV) pandemic shows dramatic differences among countries across the globe(Bhatnagar et al., 2020; Singh et al., 2020; Sohrabi et al., 2020). The panic of the COVID-19 outbreak has traversed around the globe that significantly impacted the global economy and the lifestyle of people all over the world (Qiu, Chen, Shi, & 2020, 2020). However, most of the countries adopted aggressive containment strategies of “lockdown” to mitigate the spread of the highly infectious COVID-19 disease (Chawla, Mittal, Chawla, & Goyal, 2020). The increase in the number of cases during the lockdown period has also spread the disruption, worry, stress, fear, disgust, sadness, and most importantly loneliness among the public at large (Zaroncostas, 2020).
On March 25, India, the world’s second-most populous country with 1.3 billion citizens, witnessed the exhaustive confinement experiment in its history, in an endeavor to combat the COVID-19 disease (Roy et al., 2020, Sharma and Agarwal, 2020). India faced several challenges to deal with the increasing number of infected cases, mainly due to maintaining social distancing among its densely populated residential areas (Covid Social distancing, 2020). With firm preventive control measures and curtailments put in place by the Government of India in the form of nationwide lockdown, the citizens are experiencing a wide range of psychological and emotional responses such as fear and anxiety (Bao, Sun, Meng, Shi, Lu). In the same order, the Indian government imposed a complete lockdown on March 25, 2020, till April 14, 2020 (i.e., lockdown 1.0), which was extended till May 3, 2020 (lockdown 2.0), and further extended this in terms of lockdown 3.0 till May 17, 2020 (Lockdown in India, 2020). During all these lockdowns, the sentiments and psychological state of the public changed significantly, primarily due to various government policies imposed from time to time (Adam, 2020).
In the era of 24 h availability of various social media platforms and also due to social distancing, sentiment analysis plays a major role to understand public opinion. The Obama administration used sentiment analysis to measure public opinion before the 2012 presidential election. Various studies have shown social media is an important platform for information extraction. Sentiment analysis, also known as opinion mining, refers to the techniques and processes that help organizations or policymakers to retrieve information about how their people are reacting to a particular policy or situation.
With the worldwide spread of the COVID-19 infection and as a result of the lockdown and “work from home”, individual activity on social media platforms such as Facebook, Twitter, and YouTube began to increase. Sentiment analysis provides some insights about various important issues from the perspective of common people. Through sentiment analysis, the decision is based on a significant amount of data rather than simple intuitions. It helps to understand the opinion of people about the situation or policy. We use social media cues to understand the relationship between people’s sentiments and the effectiveness of the countermeasures deployed by the government during different phases of the complete lockdown in India. In a situation of a pandemic in a dynamic and developing country like India, policymakers cannot respond to every issue. Sentiment analysis in social media can help them prioritize the most important challenges (Agarwal & Mittal, 2016). This study aims at providing certain help in quickly identifying the policy priorities by examining and analyzing the sentiments of its people via a popular social media platform (Harjule et al., 2020, Zaroncostas, 2020).
Social media has been a major mode of communication among people that creates a large amount of user-generated opinionated textual data (Garrett, 2020). This huge collection of the data is a rich source for understanding the variations in the sentiment of the public toward different policies in India (Bhat et al., 2020). We use one of the most popular social media platforms—Twitter—to gauge the feelings of Indians toward the lockdown and other government policies.
A large amount of opinionated text on social media can provide important insights into understanding the public sentiments. In this chapter, we present the temporal sentiment analysis of Twitter data to understand the effect of lockdown on public perception. The impact of government control policies through various stages of lockdown in India is analyzed, which provides interesting aspects of public emotions. In addition, the analysis done in this study may offer a forward-thinking experience about the pandemic from the focal point of social media. Does this study provide answers to certain questions, such as how is Twitter being utilized to flow fundamental data and updates? What is the subject of conversation among individuals in the hour of corona emergencies? Results of lockdown and how individuals are responding to it? It was observed that initially, the positive sentiments were dominating, which was slowly shifted toward the negative sentiments by the end of the third lockdown.
This book chapter is organized as follows: Section 2 describes the data collection part. In Section 3, the impact of COVID-19 in the whole world is studied by finding out the countries that are most affected by the corona crisis. A choropleth map has been given to depict the same. The top four countries are compared from the number of cases point of view by plotting per capita graphs. Along with this sentiment analysis is done for the top five countries by extracting the tweets from those countries.
Further, in Section 4, data analysis of COVID-19 in India is carried out by understanding its trend through sentiment analysis of the tweets collected from India. This is visualized by making word cloud, scatter plot, and bar graphs. To do an in-depth analysis of COVID-19, the analysis for a particular city is done. The relationship between the number of tweets and days is done by using graphs. The frequency of most used words is also shown graphically and by word cloud. The sentiment analysis for the tweets from particular cities is done by the help of different types of plots such as box plot, scatter plot, polarity, and density curve. In Section 5, some of the most trending hashtags such as #WorkFromHome and #MigrantLabour are analyzed by doing sentiment analysis, word cloud, and by finding the frequency of words graphically. Finally, the conclusion is given in Section 6.
7.2. Data collection
To understand the public opinion and reaction over social media, we gathered tweets identified with COVID-19 utilizing Twitter’s stream API from March 1, 2020 to May 26, 2020. A verified application associates with an open stream involving an example of the tweets being posted on Twitter. A channel showing which tweets are to be returned is remembered for each solicitation. For our exploration, the tweets were separated utilizing a rundown of explicit hashtags that we recognized dependent on the web look for mainstream COVID-19-related hashtags. The hashtags used for the analysis are as follows: #Lockdown, #StaySafe, #corona, #StayHome, #covid, #WorkFromHome, #indiafightscorona, #MigrantWorkers.
7.3. Sentiment analysis of the tweets collected worldwide
As on the condition of COVID-19 throughout the world till May 24, 2020, the worst-hit country due to COVID-19 is the United States, followed by the United Kingdom and Italy. From the graph as shown in Fig. 7.1 , we can notice that within few days India is also going to enter in the list of the worst-hit countries due to COVID-19. To understand the trend of COVID-19, we will be analyzing these countries. As the population of the country varies, the effect of coronavirus on a country can be perfectly determined by the per capita graph. The population of Italy is least among all the mentioned countries; we can infer from the graph that it was having the most number of cases within 1 lakh people, and in that sense, COVID-19 impacted Italy the most.
Figure 7.1.
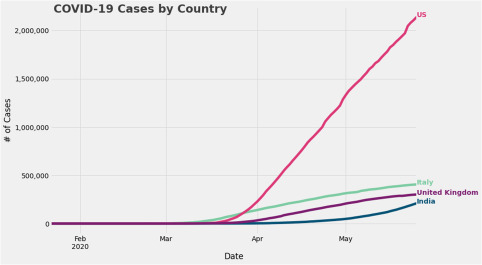
Number of cases in the United States, the United Kingdom, Italy, and India.
Sentiment analysis helps us to know the observational thinking patterns of the people regarding a particular event. For this analysis, we collected the tweets with several hashtags related to the COVID-19 and coronavirus. All those tweets that mention COVID-19 or coronavirus in their text are collected. from these data we tried to know their sentiment, whether the tweets having COVID-19 as a keyword are positive, negative, or neutral. A glimpse of sample tweets has been shown in Table 7.1 , which indicates how people have shown their views on social media. From Table 7.1, it should be noted that the polarity for tweet no. 1 is negative. This is because it consists of the negative word “failure” in this case. The sentiment of tweet no. 2 is positive as it involves the use of positive words. The word “lovely” is responsible for making the sentiment of tweet positive. The sentiment for the tweet no. 3 is neutral because it does not contain any specific word to make this tweet either positive or negative. Therefore it has neutral sentiment.
Table 7.1.
Tweets collected from worldwide.
| Tweets | Polarity | Sentiment | |
|---|---|---|---|
| 1 | Why are you hiding the number of people tested for COVID? You’ve been doing this for days now. Every time a statistic appears that shows your abject failure, it gets omitted. Are we living in North Korea? | −0.3166 | Negative |
| 2 | Lovely lockdown treat @needaphone | 0.5000 | Positive |
| 3 | That’s the entire point of using excess deaths as the metric. It means the method of counting COVID deaths doesn’t influence the figures. | 0 | Neutral |
The pie chart shown in Fig. 7.2 denotes the percentage of tweets collected worldwide with positive, neutral, and negative sentiments. We can infer from the graph that most of the tweets are with neutral sentiments (around 44%), which are followed by positive sentiments (around 40%), and negative tweets are merely 16%. From the observation, it is concluded that in this tough time, negativity is overshadowed by the positive attitude of people.
Figure 7.2.

Percentage distribution of tweets worldwide.
Next, sentiment analysis for the different countries is done separately. For this analysis, we had chosen the countries with the most number of cases. Table 7.2 depicts the sample tweets collected from the United States. Tweet no. 1 is of neutral sentiment, tweet no. 2 is with negative sentiment because it has the word “fail,” which is responsible for making it negative. The tweet no. 3 is having the positive word “love” due to which it has positive sentiments. On similar grounds, Table 7.3 shows the sample tweets from the United Kingdom. Table 7.4 depicts the sample tweets from Italy. And, Table 7.5 consists of sample tweets from India.
Table 7.2.
Tweets from the United States.
| Tweets | Polarity | Sentiment | |
|---|---|---|---|
| 1 | That was before he gave himself coronavirus. | 0.000 | Neutral |
| 2 | Cuomo admits “we all failed” at making coronavirus projections #FoxNews | −0.334 | Negative |
| 3 | Today’s coronavirus prayer, concerning our love of God | 0.463 | Positive |
Table 7.3.
Tweets from the United Kingdom.
| Tweets | Polarity | Sentiment | |
|---|---|---|---|
| 1 | Awesome work being done by @CaringCity. Today they are generously delivering their #SoapAid to Edinburgh again to @SpaceBroomhouse. #NeverMoreNeeded. | 0.5784 | Positive |
| 2 | Agree re the scrums. Wrong in many ways—even before this coronavirus pandemic. | −0.235 | Negative |
| 3 | Coronavirus is a once in a lifetime chance to reshape how we travel | 0.000 | Neutral |
Table 7.4.
Tweets from Italy.
| Tweets | Polarity | Sentiment | |
|---|---|---|---|
| 1 | Enhancements will improve CPAC experience. #Cairns #Coronavirus #Council #Covid19 #Covidagenparl #Iorestoacasa | 0.223 | Positive |
| 2 | Are hand dryers effective in killing the ancient red pestilence? Women are also getting infected and spreading coronavirus to men. | −0.435 | Negative |
| 3 | Coronavirus, la scoperta in Cina: tracce del virus | 0.000 | Neutral |
Table 7.5.
Tweets from India.
| Tweets | Polarity | Sentiment | |
|---|---|---|---|
| 1 | India: Coping with the challenge of biomedical waste amidst coronavirus pandemic | 0.00000 | Neutral |
| 2 | Coronavirus recovery rate in India rises to over 42%, nearly 65,000 cured | 0.1875543 | Positive |
| 3 | Patience is extremely scarce in our country; that’s why I fear #coronavirus will keep troubling us for plenty of months ahead. | −0.303456 | Negative |
Fig. 7.3 shows the graphs for sentiment analysis of the aforementioned countries. It can be inferred from the graphs (Fig. 7.3) that the country with the maximum number of tweets with positive sentiments is India, which is followed by Italy and the United States. Apart from this, the number of negative sentiments is almost the same in every country except the United States. The number of neutral sentiments is marginally high in the case of the United States. It can be observed from the graphs that the tweets in the United States vary from neutral to positive sentiments. In the case of the United Kingdom, the sentiment varies from neutral to negative. It clearly shows that either people are unable to cope up with COVID-19 effectively, or they are unhappy with the policies taken by the government for COVID-19 eradication, whereas, in India and Italy people have mixed attitudes toward coronavirus crises.
Figure 7.3.
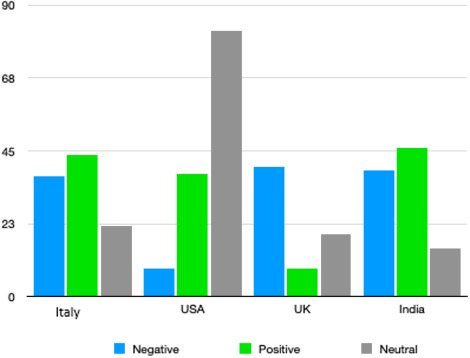
Sentiment analysis of different countries.
7.4. Sentiment analysis of Tweets for India
Sentiment analysis is contextual mining of text, which identifies and extracts subjective information in the source material and helps to understand the social sentiment of people while monitoring online conversations. It analyzes the given tweet and detects whether the underlying sentiment is positive, negative, or neutral. The tweets posted in India are crawled, and their corresponding subjectivity and polarity were computed. Polarity value lies in the range of [−1,1] where 1 means positive statement and −1 means a negative statement. Subjective sentences generally refer to personal opinion, emotion, or judgment. Subjectivity is also a float that lies in the range of [0,1]. The sentiment analysis in India demonstrates that most of the public is positive even in a tough time due to COVID-19. Fig. 7.4 is the word cloud of all the tweets collected during this time in India, which shows the most used words by the people of India in the times of corona crises.
Figure 7.4.
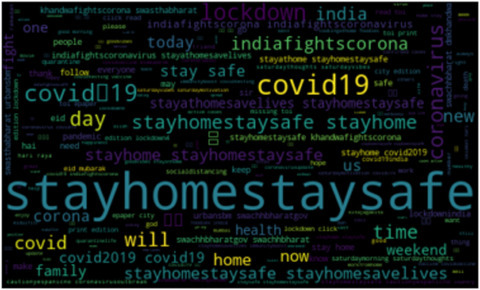
Word cloud of tweets collected in India.
As is seen from the word cloud (Fig. 7.4) that the most used word is Stayhome StaySafe, which is followed by COVID-19. These days people are tweeting more about the COVID-19, which clearly shows that it is the topic that is discussed the most among people of India. These tweets display a message, which is—stay home and stay safe and is the only measure to prevent ourselves from COVID-19. Further, Fig. 7.5 depicts the scatter plot that shows that the majority of the tweets are positive, as many points are on the right side of the polarity value 0.00.
Figure 7.5.
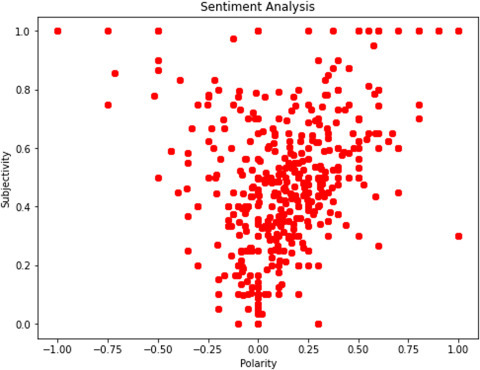
Scatter plot of polarity values of tweets.
The percentage of tweets with positive, negative, and neutral sentiments are observed as follows. The percentage of tweets with positive sentiments was 42.5%, and tweets with negative sentiments were 18.4%, while the rest was neutral tweets. Based on the initial 900 tweets gathered, Fig. 7.6 portrays the number of tweets with positive, negative, and neutral sentiments. From this, it can be inferred that the majority of tweets posted by individuals of India are more declined toward the positive side. This shows that no matter what, Indians were clear that they should consistently look toward the better side seeking for better days to come.
Figure 7.6.

Sentiment analysis of tweets in India.
We also show a few of the sample tweets from the data collected during COVID-19 in India in Table 7.6 .
Table 7.6.
Tweets collected from India.
| Tweets | Polarity | Sentiment | Subjectivity | |
|---|---|---|---|---|
| 1 | That’s a great initiative. Learning with the game. Amazing. #TogetherWeCan, #StayHomeStaySafe #StayHomeSaveLives #IndiaFightsCorona #worldfightscorona #StayHomeStayStrong #COVID19 #pandemic | 0.476111 | Positive | 1.000 |
| 2 | The trauma of #2014 & #2019 elections loss is still haunting you &your @INCIndia, which is very evident in your tweets & opinions. #COVID-19 is not the right time to show your frustration. #StayHomeStaySafe. | −0.26554 | Negative | 0.644 |
| 3 | President Kenyatta hints at lifting the curfew and lockdown measures in the near future but, insists on individual responsibility to contain the spread of COVID-19. | 0.000000 | Neutral | 0.000 |
It can be observed from the sample tweets that the public are positive mainly due to new initiatives, taking lockdown time for learning.
7.4.1. COVID-19 analysis for individual city of India—Mumbai
To better understand the sentiment analysis in India, we further do more fine-grained analysis by considering only the most affected city of India, that is, Mumbai. The chart (Fig. 7.7 ) demonstrates the impact of COVID-19 on the individuals of Mumbai. The diagram is between the number of likes and the day on which the post is being liked. From the Fig. 7.7, it can be construed that most tweets identified with corona can be seen after March 15, when the COVID-19 came into the picture. It can be observed that the number of tweets related to corona saw an abrupt increment on the first day of lockdown, that is March 25 and on May 1 when the lockdown part 3 was declared by the prime minister of India. The scatter plot (Fig. 7.7) and line chart (Fig. 7.8 ) depicts the pattern by which tweets are posted. This trend helps us to predict which day most users will tweet.
Figure 7.7.

Scatter plot of the polarity of tweets in Mumbai.
Figure 7.8.

Line graph of the polarity of tweets in Mumbai.
The accompanying examination is on the number of tweets gathered from Mumbai. The investigation is done on the tweets relating to COVID-19 and its impact. The information is gathered from twitter from the hashtags, for example, #Lockdown, #covid, and #corona. Fig. 7.9 delineates the number of tweets gathered from March 20 to May 13. We can induce from the chart that the most talked about subject among the individuals of Mumbai is identified with the issue because of corona lockdown, which is accompanied by hashtags #covid and #coronavirus.
Figure 7.9.

Quantity and distribution of tweets gathered in Mumbai for analysis.
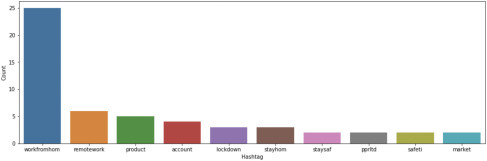
Moreover, a word cloud is drawn from the collected tweets and demonstrated in Fig. 7.10 , in which the most used hashtags by the people of Mumbai from March 20 to May 13 are shown.
Figure 7.10.
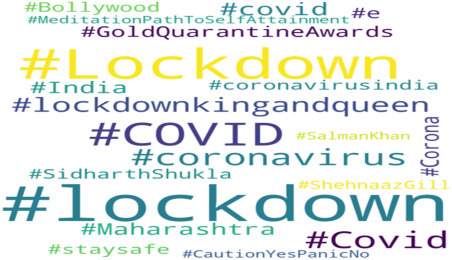
The word cloud of the collected tweets.
Fig. 7.11 shows the tweets relating to the utilization of various blends of words together, for example, how frequently the word lockdown and corona are used together. It likewise shows the occasions when a word is used alone. From this chart (Fig. 7.11) we can see that during the hours of corona emergency, lockdown is bothering people the most as it is used alone 399 times, it is followed by the use of lockdown and COVID together. This graph depicts the trend of the most discussed topic among the people of Mumbai. Fig. 7.12 shows the words that are used most frequently by the people in the tweets.
Figure 7.11.
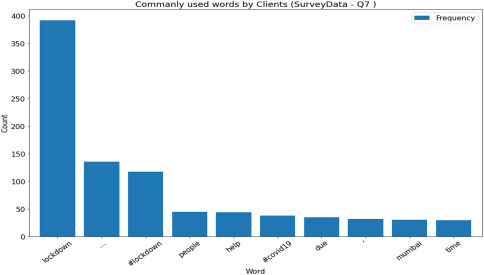
The occurrences of a frequent occurring hashtags.
Figure 7.12.
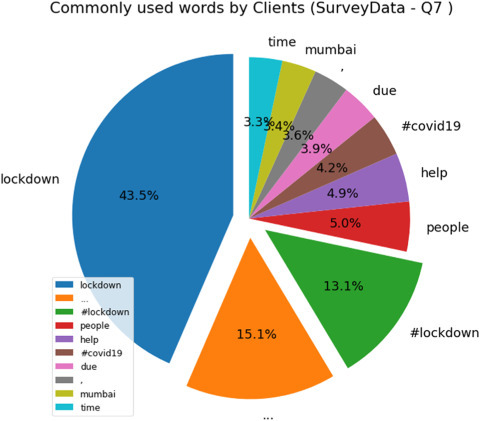
The pie-chart for the most used words among the tweets in Mumbai.
7.4.1.1. Sentiment analysis of tweets in Mumbai
The sentiment analysis of the tweets of people of Mumbai is performed, and corresponding to subjectivity and polarity values are computed. Table 7.7 represents the sentiment, subjectivity, and polarity of a few sample representative tweets. The average polarity from all the tweets was collected, and that came out to be 0.080461, which shows that on average, most people are in between neutral to a positive opinion regarding the corona crises.
Table 7.7.
Sample tweets with the sentiment, polarity, and subjectivity from Mumbai.
| Tweets | Polarity | Sentiment | Subjectivity | |
|---|---|---|---|---|
| 1 | @indiahaier thank you very much for your assistance during such lockdown period we truly appreciate the same thanks to your team for giving solution | 0.498655 | Positive | 0.6433333 |
| 2 | almost 52000 cases are from Maharashtra Gujarat Delhi Tamilnadu these states have failed to tackle COVID and break the chain even after 55 days of lockdown | −0.165543 | Negative | 0.2888889 |
| 3 | this lockdown @runcaralisarun | 0.000000 | Neutral | 0.00000000 |
The covariance between the subjectivity and polarity is computed to be 0.058285491, its positive value suggests that variables change in the same direction. In addition, the correlation is 0.74972, which shows that as subjectivity increases, the polarity in the response also increases. In other words, the more opinions/feelings are expressed, the more the overall positive sentiments will be. Fig. 7.13 shows the scatter diagram of the polarity and subjectivity of the collected tweets.
Figure 7.13.
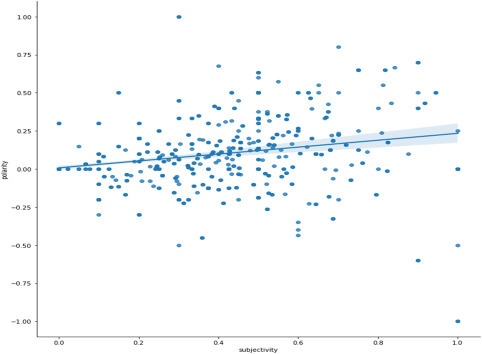
The scatter diagram of the polarity and subjectivity of the collected tweets.
The boxplot of subjectivity and polarity along with polarity distribution of tweets are shown in Figure 7.14, Figure 7.15 . It can be observed that most of the tweets are with normal sentiments, around 120 times, which is followed by most positive sentiments. In addition, we show the density graph in Fig. 7.16 , which shows that most of the tweets are dense at neutral polarity value.
Figure 7.14.
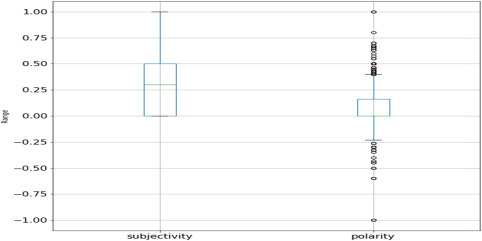
Boxplot of subjectivity and polarity of tweets in Mumbai.
Figure 7.15.

Polarity distribution of the tweets.
Figure 7.16.
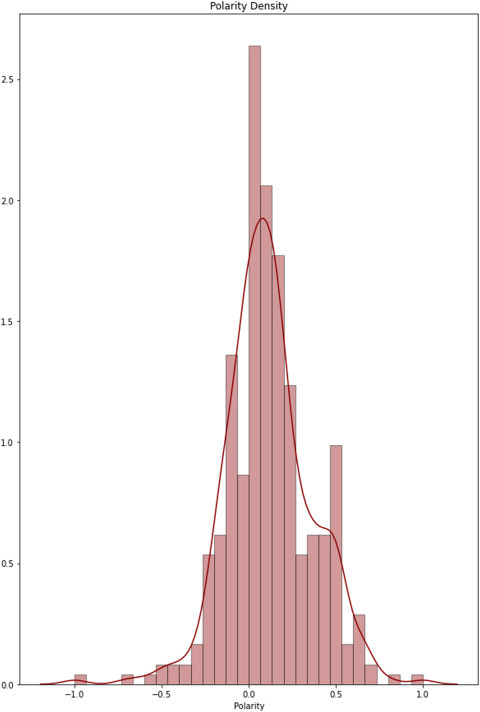
The density graph of the polarity of tweets.
7.5. Analysis of few most trending hashtags
So far, the analysis was based on geographical locations, it is also important to understand the sentiments of people concerning specific policies such as WorkFromHome, MigrantWorkers, etc. In this part, we will analyze some of the most trending hashtags such as #WorkFromHome, #MigrantWorkers, #MeTooMigrant, etc.
7.5.1. Opinion analysis for the hashtag #WorkFromHome
The world is witnessing the impact of COVID-19 on all facets of life, in all countries, and all industries. No one is certain about how much and how long the impact of the pandemic will last on the global economy. During the lockdown, the Indian IT industry made employees “Work from Home” as per the government’s mandate. As a result, about 90% of employees worked from home with 65% of them from homes in metros and the rest 35% from homes in small towns.
To understand the attitude of people toward the work from home policy, we crawled the tweets in India. Few examples of tweets mentioning work from home are illustrated in Table 7.8 , along with the sentiment and polarity.
Table 7.8.
Sample tweets having hashtag #WorkFromHome.
| Tweets | Polarity | Sentiment | |
|---|---|---|---|
| 1 | This is a lovely (funny but melancholy) piece about what we miss when we work from home | 0.375000 | Positive |
| 2 | Some of us do not want 2 risks getting sick & taking this home 2 family. If you go to a store, you can wear a mask for a 1/2 hr or get someone else to shop for you. | −0.357143 | Negative |
| 3 | Office calls especially this work from home period | 0.00000 | Neutral |
The word cloud shown in Fig. 7.17 represents some of the most used words that were used in the tweets, along with hashtag work from home. From this word cloud, we can infer that the most used words are work and home.
Figure 7.17.
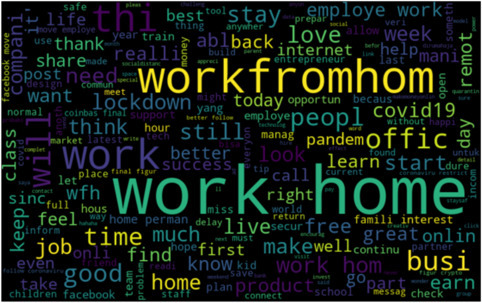
The word cloud of the tweets having hashtag #WorkFromHome.
7.5.1.1. Sentiment analysis of #WorkFromHome
For the analysis of the keyword work from home, we have gathered almost 1000 tweets that are classified in positive, negative, and neutral sentiments depicted in Fig. 7.18 .
Figure 7.18.
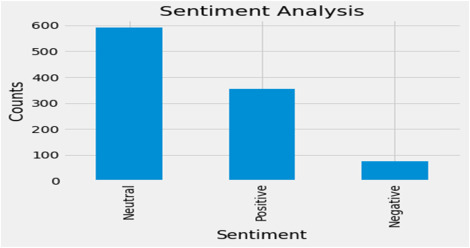
The sentiment analysis of the tweets having hashtag #WorkFromHome.
From the graph in Fig. 7.18, we can notice that most of the tweets are with the neutral sentiment (around 600), followed by positive sentiments (around 350), and least are the tweets with neutral sentiments (around 90). This shows that feedback on the work from home is good as most of the people are enjoying this new trend (Fig. 7.19 ). Fig. 7.20 represents the most frequent words used in tweets with these hashtags.
Figure 7.19.

The scatter plot of the polarity values and subjectivity towards #WorkFromHome.
Figure 7.20.
Most frequent words in the tweets with hashtag #WorkFromHome.
7.5.2. Sentiment analysis of #MigrantWorkers
India is dealing with another issue that is also challenging, such as dealing with coronavirus lockdown. India’s nationwide lockdown amidst the COVID-19 pandemic has critically dislocated its migrant population. Lacking jobs and money, and with public transportation shut down, hundreds of thousands of migrants were forced to walk hundreds of miles back to their home villages. To understand the situation and sentiment for migrant people, we crawled 1000 tweets mentioning the hashtag #MigrantWorkers in India. Few of such tweets are shown in Table 7.9 .
Table 7.9.
Tweets with #MigrantWorkers.
| Tweets | Polarity | Sentiment | |
|---|---|---|---|
| 1 | Excellent write up by @MukandRita “The way a nation treats their poor reveals the health, hearts, and mental state of the nation and if a nation is kind to their poor, that nation is rich in spirit, heart, and wealth.” #MigrantWorkers #CoronaWarriorsIndia #MigrantCrisis | 0.67500 | Positive |
| 2 | Bombay HC Asks Maharashtra Govt To Submit Status Report of Migrants In Mumbai#BombayHC #Mumbai #MigrantWorkers | 0.00000 | Neutral |
Fig. 7.21 shows the word cloud that consists of the most used words in the tweets. The frequency of word migrantworkers is highest. We can infer from the word cloud that most of the tweets consist of positive words such as wonderful, happy, etc. These tweets can either be more of an appreciation tweet for helping out the workers.
Figure 7.21.

The word cloud of the tweets collected having hashtag #MigrantWorkers.
In the sentiment analysis of such tweets, it was observed that most of the tweets are with neutral sentiments, crossing 500, followed by positive tweets (just less than 500), and rest very few tweets are negative. It is observed that tweets were not showing negative sentiments because most of the people using Twitter social media platforms were a highly educated population, and very few migrant workers use it. And most of the tweets about the migrant workers are posted by them discussing what can be done for them, and also help out the workers. It can be intuitively thought that the negative sentiment could not be seen over social media during this time, possibly because such people did not express their feelings on Twitter. The polarity of these tweets varies between 0 and above.
7.6. Conclusion
This chapter focuses on the analysis with the impact of COVID-19 based on the opinion expressed over social media. The COVID-19 has affected each country adversely, but few of them are suffering the most. The sentiment analysis was carried out in the chapter, which is a powerful tool to know the reaction of people toward an event. Most of the tweets gathered vary from neutral to positive sentiments starting from the pandemic with afterward. It means that people are moving forward with the optimistic approach in these tough times. The relation between the number of tweets and date was analyzed, which showed that most tweets were noted on the following day when important announcements were made, like that of lockdown. The chapter demonstrates the sentiment analysis concerning the geographical locations with time, in addition, to specific policy hashtags such as #WorkFromHome and #MigrantWorkers. The inferences drawn from these data help to get an insight into the mental space of the majority of people during the harsh conditions of lockdown in India. Further, it may also help the government to redesign and redefine the further course of actions in order to prevent the spread of COVID-19 while taking into account the valuable opinions of its people.
References
- Adam D. Special report: The simulations driving the world’s response to COVID-19. Nature. 2020;580(7803):316–318. doi: 10.1038/d41586-020-01003-6. [DOI] [PubMed] [Google Scholar]
- Agarwal B., Mittal N. Springer Book Series: Socio-affective Computing series. Springer International Publishing; 2016. Prominent feature extraction for sentiment analysis; pp. 1–115. [DOI] [Google Scholar]
- Bao Y., Sun Y., Meng S., Shi J., Lu L. 2019-nCoV epidemic: Address mental health care to empower society. The Lancet. 2020;395:E37–E38. doi: 10.1016/S0140-6736(20)30309-3. [DOI] [PMC free article] [PubMed] [Google Scholar]
- Bhat M., Qadri M., Beg N.A., Kundroo M., Ahanger N., Agarwal B. Sentiment analysis of social media response on the Covid19 outbreak. Brain, Behavior, and Immunity. 2020;87 doi: 10.1016/j.bbi.2020.05.006. [DOI] [PMC free article] [PubMed] [Google Scholar]
- Bhatnagar V., Poonia R.C., Nagar P., Kumar S., Singh V., Raja L., Dass P. Descriptive analysis of COVID-19 patients in the context of India. Journal of Interdisciplinary Mathematics. 2020:1–16. [Google Scholar]
- Chawla S., Mittal M., Chawla M., Goyal L.M. Corona virus − SARS-CoV-2: An insight to another way of natural disaster. EAI Endorsed Transactions on Pervasive Health and Technology. 2020;2020 [Google Scholar]
- Covid Social Distancing, https://www.bbc.com/news/world-asia-india-52393382, accessed on May 10, 2020.
- Cruz M., Ahmed S.A. On the impact of demographic change on economic growth and poverty. World Development. 2018;105:95–106. [Google Scholar]
- Garrett L. COVID-19: The medium is the message. The Lancet. 2020;395(10228):942–943. doi: 10.1016/S0140-6736(20)30600-0. [DOI] [PMC free article] [PubMed] [Google Scholar]
- Harjule P., Gurjar A., Seth H., Thakur P. (2020). Text classification on Twitter data, 3rd International Conference on Emerging Technologies in Computer Engineering: Machine Learning and Internet of Things, pp. 160–164, Available from 10.1109/ICETCE48199.2020.9091774. [DOI]
- Lockdown in India. 2020. https://en.wikipedia.org/wiki/~COVID-19_pandemic_lockdown_in_India (Accessed on May 21, 2020).
- Qiu Y., Chen X., Shi W. Impacts of social and economic factors on the transmission of coronavirus disease 2019 (COVID-19) in China. Journal of Population Economics. 2020;2020 doi: 10.1007/S00148-020-00778-2. [DOI] [PMC free article] [PubMed] [Google Scholar]
- Roy D., Tripathy S., Kar S.K., Sharma N., Verma S.K., Kaushal V. Study of knowledge, attitude, anxiety & perceived mental healthcare need in Indian population during COVID-19 pandemic. Asian Journal of Psychiatry. 2020;51 doi: 10.1016/j.ajp.2020.102083. [DOI] [PMC free article] [PubMed] [Google Scholar]
- Sharma A., Agarwal B. A cyber-physical system approach for model based predictive control and modeling of COVID-19 in India. Journal of Interdisciplinary Mathematics. 2020;24 [Google Scholar]
- Singh V., Poonia R.C., Kumar S., Dass P., Agarwal P., Bhatnagar V., Raja L. Prediction of COVID-19 coronavirus pandemic based on time series data using support vector machine. Journal of Discrete Mathematical Sciences & Cryptography. 2020;23 [Google Scholar]
- Sohrabi C., Alsafi Z., O’Neill N., Khan M., Kerwan A., Al-Jabir A.…Agha R. World Health Organization declares global emergency: A review of the 2019 novel coronavirus (COVID-19) International Journal of Surgery (London, England) 2020;76:71–76. doi: 10.1016/j.ijsu.2020.02.034. [DOI] [PMC free article] [PubMed] [Google Scholar]
- Zaroncostas J. How to fight an infodemic. The Lancet. 2020;395(10225) doi: 10.1016/S0140-6736(20)30461-X. [DOI] [PMC free article] [PubMed] [Google Scholar]