Abstract
A novel nucleic acid stain, SYBR Gold, was used to stain marine viral particles in various types of samples. Viral particles stained with SYBR Gold yielded bright and stable fluorescent signals that could be detected by a cooled charge-coupled device camera or by flow cytometry. The fluorescent signal strength of SYBR Gold-stained viruses was about twice that of SYBR Green I-stained viruses. Digital images of SYBR Gold-stained viral particles were processed to enumerate the concentration of viral particles by using digital image analysis software. Estimates of viral concentration based on digitized images were 1.3 times higher than those based on direct counting by epifluorescence microscopy. Direct epifluorescence counts of SYBR Gold-stained viral particles were in turn about 1.34 times higher than those estimated by the transmission electron microscope method. Bacteriophage lysates stained with SYBR Gold formed a distinct population in flow cytometric signatures. Flow cytometric analysis revealed at least four viral subpopulations for a Lake Erie sample and two subpopulations for a Georgia coastal sample. Flow cytometry-based viral counts for various types of samples averaged 1.1 times higher than direct epifluorescence microscopic counts. The potential application of digital image analysis and flow cytometry for rapid and accurate measurement of viral abundance in aquatic environments is discussed.
Since the discovery of highly abundant viruslike particles (VLPs) in natural seawater (2, 9, 16), marine viruses have been considered one of the major factors regulating microbial biomass, population, and genetic diversity in natural environments. In order to understand the potential impact of marine viruses on other marine microorganisms, the abundance of viral particles has been estimated in many marine environments (5, 6, 8, 10, 15, 22). The concentration of viral particles generally exceeds that of bacteria by 5- to 10-fold in many of these environments (8, 10, 15, 22). It is now known that viruses are a dynamic component in the aquatic microbial food web, so protocols for fast and accurate estimates of VLPs in seawater are needed if a meaningful understanding of these dynamics is to be achieved.
Two major approaches have been used to enumerate marine viruses in natural seawater: one is based on transmission electron microscopy (TEM) (2, 16, 22), and the other is based on a fluorescent-staining method using epifluorescence microscopy (EFM) (10, 11, 14, 21). Counting viral particles by TEM is time-consuming and expensive and is not practical for field studies. Fluorescent dyes, such as DAPI (4′,6′-diamidino-2-phenylindole), YoPro-1 {4-[3-methyl-2,3-dihydro-(benzo-1,3- oxazole)-2-methylmethyledene]-1(3′-trimethylammoniumpropyl)-quinoliniumdiiodide}, and SYBR Green I have been used to enumerate VLPs in marine samples (10, 11, 14). Although counts based on fluorescent-staining methods are highly correlated with those based on the TEM method, the former usually yields a higher count than the latter (14, 21). Moreover, the precision of fluorescence-based counting is much greater than that of the TEM method (21).
The development of more sensitive nucleic acid stains has greatly advanced our ability to visualize stained viral particles by EFM. DAPI, a DNA-specific fluorochrome, was first used to count viral particles (18). More recently, the nucleic acid stain YoPro-1 was found to provide a brighter fluorescence intensity than DAPI when staining marine viruses (11). Because the original staining method with YoPro-1 required an optimal 2-day incubation, a modified protocol involving the microwaving of YoPro-1-stained samples was developed to shorten the staining time to a few minutes (24). Most recently, another sensitive nucleic acid stain, SYBR Green I, has been used for the rapid and accurate enumeration of viral particles in various marine samples (14). SYBR Green I yielded a brighter fluorescent signal than DAPI when staining viral particles. However, this fluorescence could fade within 30 s under some conditions, requiring the use of high concentrations of SYBR Green I and a special antifading mixture (14). After several existing nucleic acid stains, including DAPI, YoPro-1, and SYBR Green I, were compared simultaneously, the modified YoPro-1 staining method (23) was recommended for enumerating viral particles in aquatic environments (3). The fluorescence intensity of SYBR Green I was similar to that of YoPro-1, but SYBR Green I faded much faster than YoPro-1 (3).
Sensitive detection devices and techniques, such as cooled charge-coupled device (CCD) cameras or flow cytometry (FCM), make possible more accurate and rapid enumeration of fluorescently stained microbes or VLPs than EFM. FCM has been used for the enumeration of total bacteria (4, 13, 17), Synechococcus and Prochlorococcus groups (4, 7), or a specific group of microbes detected by a fluorescently labeled probe in marine environments (1). Recently, FCM has been shown to be capable of enumerating marine viruses stained with SYBR Green I (12). In their study, Marie et al. had to treat samples with deep freezing or heating at 80°C in the presence of detergent to obtain reliable results with SYBR Green I (12).
SYBR Gold (Molecular Probes, Inc., Eugene, Oreg.) is another sensitive fluorescent stain for detecting double- or single-stranded DNA or RNA. According to the manufacturer, this stain is more sensitive than SYBR Green I and II for staining nucleic acids in gels. In our preliminary tests, marine viruses stained with SYBR Gold yielded a bright fluorescent signal that was much more stable than that from SYBR Green I. In this study, we demonstrate that SYBR Gold can be a good alternative fluorochrome for rapidly staining and accurately counting viral particles in various types of aquatic samples. We also examine the possibility of using digital image analysis (DIA) and FCM for rapid and precise enumeration of SYBR Gold-stained marine viruses.
MATERIALS AND METHODS
Sample collection.
Water samples were collected from three Georgia coastal rivers, the Satilla, the Altamaha, and the Savannah, during cruises onboard the R/V Bluefin in July 1998. The salinity of water samples ranged from 0 to 34‰. Samples were collected 1 m below the surface. Two subsamples (50 ml) were taken at each station and stored in sterile polypropylene centrifuge tubes. The first subsample was fixed with glutaraldehyde (2.5% final concentration) for counting total viruses and bacteria, while the second, unfixed sample was used for isolation and enumeration of cyanophages that infect marine Synechococcus spp. All samples were stored in the dark at 4°C until they were used. Samples from Lake Erie were kindly provided by Steve Wilhelm at the University of Tennessee, Knoxville.
Cyanophage strains.
The cyanophages P1 and P49 (Myoviridae), which infect the marine Synechococcus strains WH7803 and WH7805, respectively, were isolated and purified from the water samples collected from Georgia coastal rivers according to published protocols (20).
Staining viruses with SYBR Gold and SYBR Green I.
The original SYBR Gold stock solution (10,000×) was diluted to a secondary stock solution (25×) with high-performance liquid chromatography-grade water. The secondary SYBR Gold stock solution can be stored at 4°C for up to 1 month according to our preliminary test. To enumerate viral particles, viral lysates or natural virus communities were stained with 2.5× (final concentration) SYBR Gold solution for 10 min in the dark and filtered through a 0.02-μm-pore-size Al2O3 Anodisc membrane filter (Whatman Inc., Clifton, N.J.), backed by a 0.2-μm-pore-size cellulose membrane (Gelman Sciences, Ann Arbor, Mich.) at approximately 20 kPa vacuum. The stained Anodisc filter was mounted on a glass slide with a drop of Slow Fade (Molecular Probes, Inc.) and a coverslip. When SYBR Gold was compared with SYBR Green I, two different concentrations (2.5× and 25×) of SYBR stains were tested using the protocol described by Noble and Fuhrman (14).
In this study, three different methods were used for enumerating SYBR-stained viral particles: (i) direct count from EFM, (ii) DIA, and (iii) FCM analysis.
EFM.
Slides were examined under a BX-40 (Olympus America Inc., Melville, N.Y.) epifluorescence microscope with an ×100 high-resolution U Plan Oil objective lens (N. A. = 1.35 to 0.50). Viruses and bacteria stained with SYBR Green I or SYBR Gold were visualized with blue excitation light. To estimate the concentration of stained viruses, at least 300 viruses were counted.
DIA.
Images from the microscopic viewfield were acquired with a cooled CCD, SenSys:1400 (1,317 by 1,035 image array; 6.8- by 6.8-μm pixel; 12 bit) (Photometrics, Tucson, Ariz.) and processed with the Oncor image software package version 2.02 (Oncor, Inc., Gaithersburg, Md.) on a Power Macintosh 9500. To enumerate viral numbers in culture lysates or field samples, 5 to 10 images were captured for each sample and all the images were processed with identical image analysis functions, e.g., exposure time, focusing, thresholding, object identification, and counting. After a digital image was focused and acquired, it was processed with the Enhance VEC image function. Objects were then defined with the interactive notch tool. Viruses were counted as a category with the pixel value that ranged from 5 (minimum) to 12, while bacteria were counted as a category with the pixel value that ranged from 13 to 100. Alternatively, viruses and bacteria can also be counted manually by examining the digital images on the computer screen.
FCM.
Virus samples stained with SYBR Gold and SYBR Green I were analyzed on an EPICS 753 flow cytometer (Coulter Corp., Miami, Fla.) equipped with a 5-W argon ion laser (tuned to 488 nm; 750-mW output) and modified for high sensitivity as described previously (4). SYBR Gold or SYBR Green I fluorescence was measured above 495 nm; data collection was triggered on this signal. All the samples used for FCM analysis were diluted with TE buffer (10 mM Tris, 1 mM EDTA, pH 7.5). Cyanophage lysates were diluted 1:100 to 1:1,000, while natural water samples were diluted 1:10.
TEM.
Thirty-five milliliters of viral sample was transferred into a 36-ml ultracentrifuge tube (Sorvall, Inc., Newtown, Conn.), in which two carbon- and Formvar-coated electron microscopy grids had been presettled on a solid platform made of epoxy glue. Viral particles were then spun onto the grids with an ultracentrifuge (Sorvall Discovery 100S) with a SURESPIN 630 swinging bucket rotor (Sorvall Inc.) at 166,800 × g and 4°C for 4 h. The samples on the grids were then stained with 2% urinate acetate for 1 min. Viral particles were enumerated by TEM (JEOL 100 CXII at 80 kV and ×27,000 magnification), located in The Microscopic Center of The University of Georgia. More than 200 viral particles were counted for each sample, and the virus concentration was calculated as described elsewhere (19).
RESULTS AND DISCUSSION
Viruses stained with SYBR Gold.
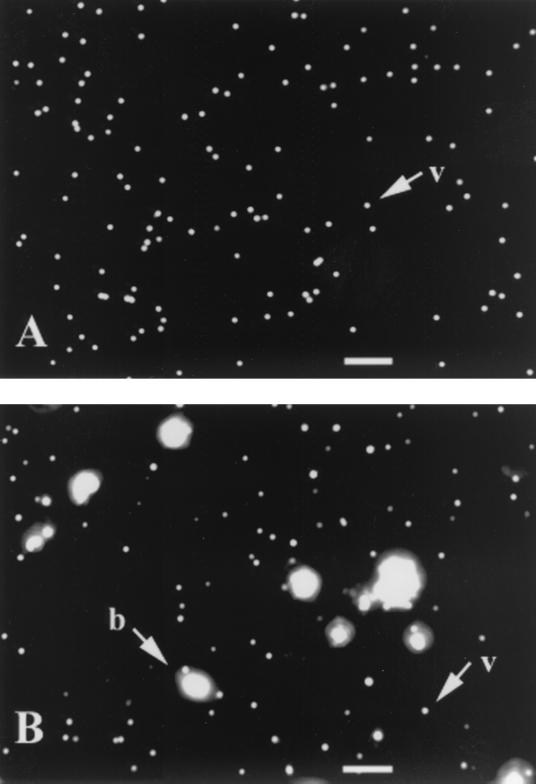
Viral particles in cyanophage lysates and natural water samples stained brightly with SYBR Gold. Cyanophages P1 and P49 stained with SYBR Gold yielded a bright and stable yellow-green fluorescence under EFM and could be easily detected by a cooled CCD camera (Fig. 1A). When SYBR Gold was tested in natural samples with salinities ranging from 0 to 34.8‰, viral particles and bacteria in all natural communities yielded bright yellow-green fluorescence. Due to their larger genomic sizes, SYBR Gold-stained bacteria usually yielded much brighter fluorescence than SYBR Gold-stained viruses. Among viruses, the brightness of the SYBR Gold signal varied, likely due to different genome sizes (20 to 300 kb) among viral particles (Fig. 1B). Under blue excitation, a majority of the detrital materials in our samples yielded orange-red fluorescence that was readily distinguished from the yellow-green fluorescence of SYBR Gold-stained viruses. Because SYBR Gold specifically stains nucleic acids, we were able to count viral particles that were adsorbed onto detrital material.
FIG. 1.
Digital images of SYBR Gold-stained viruses. Cyanophage P49 particles (A) and viral and bacterial communities (B) in a Georgia coastal water sample, July 1998, are shown. v, virus; b, bacteria. Scale bars, 5 μm.
In a comparison between SYBR Gold and SYBR Green I, it was found that the fluorescence of SYBR Gold-stained viruses lasted longer than that of SYBR Green I-stained viruses when the standard concentration (2.5×) was used for both stains (data not shown). Without any antifading solution, the fluorescence of SYBR Gold-stained viruses was stable for more than 2 min, while the SYBR Green I signal faded within 30 s. In a recent study, SYBR Green I was found to fade faster than most other nucleic acid stains (e.g., DAPI and Yo-Pro) that have been used to stain viral particles in aquatic environments (3). The stability of SYBR Gold fluorescence represents a distinct advantage for the accurate enumeration of viruses by EFM with a cooled CCD camera. Although the fluorescence of both SYBR Gold- and SYBR Green I-stained viruses was brighter and more stable when a higher concentration of stain (25×) was used (14), it was found that under these conditions many bacterial cells were overstained, and the resultant fluorescent halos around those cells could mask the fluorescence of the stained viruses.
Comparison of viral counts by TEM and EFM.
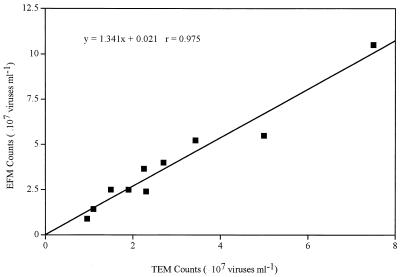
A direct comparison of 10 natural samples from the Satilla River showed that EFM- and TEM-based counts were highly correlated (r = 0.975; n = 10) (Fig. 2). However, estimates of viral abundance based on the EFM method were generally higher (by a factor of 1.34 on average) than those made by TEM. The results of other studies comparing EFM- and TEM-based viral counts are similar (9, 13, 19). Thus, for example, SYBR Green I-based viral counts were found to be about 1.28 times higher than those by TEM (14). It appears, therefore, that TEM-based counts generally underestimate viral abundance. Several factors might contribute to lower counts by the TEM method: (i) loss of viral particles during staining and washing of grids, (ii) high background due to sedimentation of detrital materials onto grids, and (iii) nonparallel paths of viral sedimentation during ultracentrifugation (19). Most of the samples collected from Georgia coastal rivers contained large amounts of detrital material. High background due to detritus was believed to result in lower TEM counts in these samples, but it did not appear to interfere with EFM counts.
FIG. 2.
Comparison of viral abundance values based on EFM with SYBR Gold and TEM in 10 natural water samples with salinities ranging from 0 to 34.8‰. The solid line corresponds to a linear regression: y = 1.34x + 0.66 (r = 0.975; n = 10).
Enumeration of SYBR Gold-stained viruses by DIA.
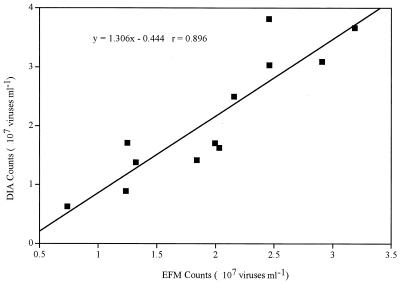
When viral abundance must be determined in many natural samples, a fast and accurate enumeration method is necessary. One of the major concerns with the EFM-based method is how to differentiate small bacterial cells from viral particles. A certain proportion of bacterial cells in natural aquatic samples can be very small, and therefore, they may be confused with viruses. In such a case, counting fluorescently stained viral particles directly by microscopy could be tedious. It was found that digital images recorded by the cooled CCD camera appeared to show more viral particles, suggesting that it could detect some weakly stained viruses that could not be easily detected by human eyes. Estimates of virus numbers based on EFM were compared with those based on DIA (Fig. 3). The 12 samples were all collected from the Savannah and Altamaha River estuary along the Georgia coast, and their salinities ranged from 0 to 30‰. There was a strong linear correlation between the counts by DIA and those by direct EFM (r = 0.896; n = 12); however, the DIA counts were on average 1.31 times higher than the EFM counts. The use of a cooled CCD camera and DIA allowed us not only to detect the weakly stained viral particles but also to enumerate hundreds of viral particles at one time. Digital images of SYBR-stained samples can be quickly captured by a CCD camera and saved for later processing. Therefore, a much higher number of viruses can be counted for a given amount of microscope time.
FIG. 3.
Relationship of SYBR Gold-stained viruses enumerated by DIA and direct EFM counting. Twelve samples collected from three Georgia coastal rivers were used for this analysis. The solid line indicates a linear regression: y = 1.31x − 0.77 (r = 0.896; n = 12).
Enumeration of SYBR Gold-stained viruses by FCM.
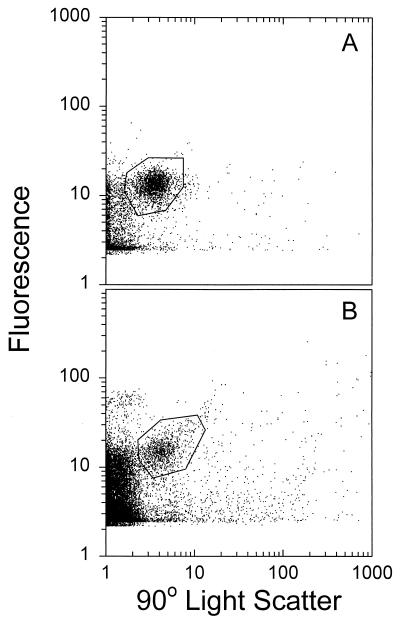
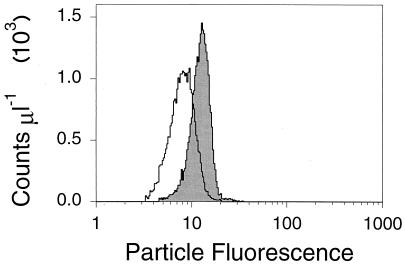
SYBR Gold-stained cyanophages P1 and P49 (Myoviridae) formed distinct populations in flow cytometrically measured side scatter versus green fluorescence (Fig. 4A and B, respectively). The marine cyanophages used in this experiment are representative of most bacteriophages in natural aquatic environments in terms of size and morphology (2). In a recent study, viruses which infect Phaeocystis pouchetii were stained with SYBR Green I and used as a reference strain for FCM analysis (12). However, most marine viruses infecting microalgae are large polyhedral viruses (100 to 170 nm in diameter); they are therefore not representative of natural (bacteriophage-dominated) viral communities. We found that SYBR Gold can be used to rapidly stain phage isolates whether they have been fixed with 2.5% glutaraldehyde or not. FCM counts of cyanophage lysates were highly reproducible, and for phage P49, they averaged about 1.25 times higher than counts based on EFM (Table 1). Although SYBR Gold-stained phage lysates were very bright under EFM, difficulty in obtaining a uniform focal plane for all viral particles could result in the observed underestimation of the actual number of viruses. The fluorescence intensities of viruses stained with SYBR Gold and SYBR Green I were also compared by FCM. The mean fluorescence per P49 virus determined with SYBR Gold was about two times higher than that with SYBR Green I, while the standard deviation was significantly lower (Fig. 5). The samples we used in this study had a wide range of salinities (0 to 34.8‰), but we found no significant impact of salinity on SYBR Gold staining. Finally, SYBR Gold is a much less expensive nucleic acid stain than SYBR Green I.
FIG. 4.
Flow cytometric analysis of SYBR Gold-stained cyanophages P1 (A) and P49 (B). The dots represent individual particles.
TABLE 1.
Comparison of counts obtained by FCM and EFM for various virus samples
| Sample | Viral count (no./ml)
|
FCM/EFM ratio | |
|---|---|---|---|
| FCM | EFM | ||
| Pure lysate | |||
| Cyanophage P49 | (1.28 ± 0.11) × 108 (n = 4) | (1.02 ± 0.21) × 108 (n = 2) | 1.25 |
| Cyanophage P1 | 2.59 × 10⁷ (n = 1) | 2.01 × 10⁸ (n = 1) | 1.28 |
| Lake Erie Station 84 | |||
| Originala | 4.35 × 10⁶ | 3.70 × 10⁶ | 1.17 |
| 0.2 μmb | 2.04 × 10⁶ | 1.62 × 10⁶ | 1.26 |
| 0.02 μmc | 6.97 × 10⁴ | —d | — |
| Georgia coastal water | |||
| Population V-I | |||
| Original | 1.76 × 10⁵ | — | — |
| 0.2 μm | 1.29 × 10⁵ | — | — |
| 0.02 μm | 3.38 × 10² | — | — |
| Population V-II | |||
| Original | 1.14 × 10⁶ | — | — |
| 0.2 μm | 1.23 × 10⁶ | — | — |
| 0.02 μm | 1.73 × 10⁵ | — | — |
| Total viral population | |||
| Original | 1.63 × 10⁶ | 2.18 × 10⁶ | 0.74 |
| 0.2 μm | 1.56 × 10⁶ | 1.78 × 10⁶ | 0.88 |
| 0.02 μm | 1.83 × 10⁵ | — | — |
Original sample without filtration.
Sample filtered through 0.02-μm-pore-size polycarbonate membrane filter.
Sample filtered through 0.02-μm-pore-size Anodisc filter.
—, no data.
FIG. 5.
Flow cytometric fluorescence distribution of cyanophage P49 particles that were stained with SYBR Gold (shaded) and SYBR Green I (open). Both samples were stained with the nucleic acid stain at the final concentration of 2.5×. The histograms are gated as shown in Fig. 4.
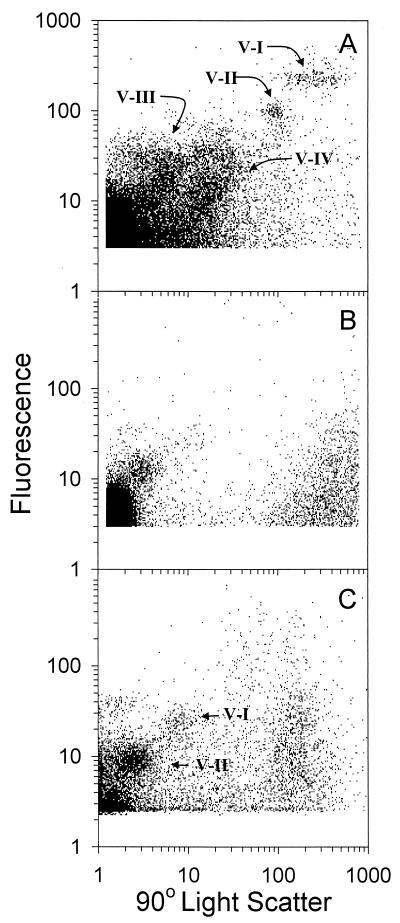
FCM not only allows rapid and automated counts but also provides enough resolving power to separate different viral populations in the natural samples. FCM analysis of a sample from Lake Erie (Fig. 6A) revealed at least four different populations of SYBR Gold-stained particles. Population V-III had scatter and fluorescence characteristics similar to those observed for the cyanophages P1 and P49. Populations V-I and V-II were much less abundant and may represent larger viral particles or some very small bacteria in Lake Erie. More than 98% of the SYBR Gold-stained particles were removed after the sample was filtered through a 0.02-μm-pore-size Anodisc filter (Fig. 6B and Table 1). The viral concentration at Lake Erie Station 84 obtained by FCM was approximately 1.2 times higher than those obtained by direct EFM counting (Table 1).
FIG. 6.
Flow cytometric analysis of viral populations from a Lake Erie sample (A), the same sample filtered through a 0.02-μm-pore-size filter (B), and a Georgia coastal sample (C). Populations V-I through V-IV are indicated.
FCM analysis of a seawater sample from the Georgia coast revealed two distinct populations (Fig. 6C). The dominant population (V-II) had scatter and fluorescence characteristics similar to those observed for the cyanophages P1 and P49, while the minor population (V-I) may represent larger viruses, perhaps those infecting eukaryotic microalgae (12). Viruses in population V-I not only have higher side scatter but also have higher fluorescence intensity than viruses in population V-II (Fig. 6C). The viral concentration in population V-II was about 10-fold higher than that in population V-I (Table 1). In an earlier study, two to three viral populations were seen in natural marine environments, analogous to the populations observed here (12). In that study, the V-II population was 4- to 10-fold more abundant than the V-I population. A small but significant portion (14%) of viral population V-II passed through a 0.02-μm-pore-size filter, while nearly all of population V-I was removed. The viral counts in this seawater sample obtained by FCM were 74 to 88% of those obtained by EFM (Table 1). It was not clear why FCM yielded lower counts for this natural seawater sample. However, we did notice that under EFM, viral particles in the natural seawater sample were not stained as brightly as in the sample from Lake Erie. This may be due to the fact that smaller viruses were more abundant in the seawater sample than in the lake sample. In general, marine viruses with 20- to 100-kb genomes or with 30- to 60-nm capsid size made up the majority of the total virioplankton. The 30- to 60-nm capsid size of aquatic virioplankton is slightly smaller than the 60- to 80-nm range observed for purified marine bacteriophages (23). Even with very sensitive nucleic acid stains, like SYBR Green I or SYBR Gold, it should be noted that some of the stained viral particles were only slightly above the background noise by FCM (Fig. 6). We therefore cannot exclude the possibility that some viral particles fall below the limits of detection in the FCM configuration used here.
A recent study found that natural virus communities stained by SYBR Green I shortly after fixation showed a lower percentage of viral counts by FCM than those analyzed by EFM (12). It was suggested that fresh viruses may not be very accessible to some nucleic acid stains, e.g., SYBR Green I, PicoGreen, SYTOX, and TOTO-1 (12). However, such a hypothesis does not seem to apply to bacteriophages or other virus isolates because they can be stained brightly and usually form a distinguishable FCM pattern. FCM analysis of natural viral communities stained with SYBR Green I require fixed samples to be deep frozen or heated at 80°C in the presence of detergent (12). Our observations suggested that heating at 80°C in the presence of detergent often resulted in nearly 20% lower counts than in the untreated samples (not shown). We also noticed that viral counts based on the SYBR Gold staining method decreased over time for the samples that were fixed in glutaraldehyde and kept at 4°C. Therefore, it is important to count viral particles in the fixed samples shortly after fixation to obtain accurate estimates of the viral concentration in natural environments.
This study focused mainly on developing a rapid technique for counting viral particles in freshwater and marine environments using the SYBR Gold nucleic acid stain. We did not intend to count bacterial cells, although bacteria stained with SYBR Gold could be enumerated by both the DIA and FCM methods (not shown). We demonstrated that SYBR Gold is an alternative dye for rapidly staining and counting viral particles in natural aquatic samples. Viral counts based on DIA or FCM proved to be more efficient and accurate for estimating the numbers of viral particles in natural environments than direct counting by EFM.
ACKNOWLEDGMENTS
We acknowledge support from the following U.S. funding agencies: the National Science Foundation (OCE-9730602 and OCE-0049098), the Department of Energy (DE-FG02-97ER62451), and NOAA/Sea Grants Program (NA66RG0282).
We thank Steve Wilhelm at the University of Tennessee for providing the lake samples and Stephan Jacquet for his suggestions on the manuscript.
Footnotes
Contribution no. 542 from the Center of Marine Biotechnology, University of Maryland Biotechnology Institute.
REFERENCES
- 1.Amann R I, Ludwig W, Schleifer K H. Phylogenetic identification and in situ detection of individual microbial cells without cultivation. Microbiol Rev. 1995;59:143–169. doi: 10.1128/mr.59.1.143-169.1995. [DOI] [PMC free article] [PubMed] [Google Scholar]
- 2.Bergh O, Borsheim K Y, Bratbak G, Heldal M. High abundance of viruses found in aquatic environments. Nature. 1989;340:467–468. doi: 10.1038/340467a0. [DOI] [PubMed] [Google Scholar]
- 3.Bettarel Y, Sime-Ngando T, Amblard C, Laveran H. A comparison of methods for counting viruses in aquatic systems. Appl Environ Microbiol. 2000;66:2283–2289. doi: 10.1128/aem.66.6.2283-2289.2000. [DOI] [PMC free article] [PubMed] [Google Scholar]
- 4.Binder B J, Chisholm S W, Olson R J, Frankel S L, Worden A Z. Dynamics of pico-phytoplankton, ultra-phytoplankton, and bacteria in the central equatorial Pacific. Deep-Sea Res. 1996;43:907–931. [Google Scholar]
- 5.Borsheim K Y, Bratbak G, Heldal M. Enumeration and biomass estimation of planktonic bacteria and viruses by transmission electron microscopy. Appl Environ Microbiol. 1990;56:352–356. doi: 10.1128/aem.56.2.352-356.1990. [DOI] [PMC free article] [PubMed] [Google Scholar]
- 6.Bratbak G, Heldal M, Norland S, Thingstad T F. Viruses as partners in spring bloom microbial trophodynamics. Appl Environ Microbiol. 1990;56:1400–1405. doi: 10.1128/aem.56.5.1400-1405.1990. [DOI] [PMC free article] [PubMed] [Google Scholar]
- 7.Campbell B C, Vaulot D. Photosynthetic picoplankton community structure in the subtropical North Pacific Ocean near Hawaii (station ALOHA) Deep-Sea Res. 1993;40:2043–2060. [Google Scholar]
- 8.Cochlan W P, Wikner J, Steward G F, Smith D C, Azam F. Spatial distribution of viruses, bacteria, and chlorophyll a in neritic, oceanic and estuarine environments. Mar Ecol Prog Ser. 1993;92:77–87. [Google Scholar]
- 9.Fuhrman J A, Suttle C A. Viruses in marine planktonic systems. Oceanography. 1993;6:51–63. [Google Scholar]
- 10.Hara S, Terauchi K, Koike I. Abundance of viruses in marine waters: assessment by epifluorescence and transmission electron microscopy. Appl Environ Microbiol. 1991;57:2731–2734. doi: 10.1128/aem.57.9.2731-2734.1991. [DOI] [PMC free article] [PubMed] [Google Scholar]
- 11.Hennes K P, Suttle C A. Direct counts of viruses in natural waters and laboratory cultures by epifluorescence microscopy. Limnol Oceanogr. 1995;40:1050–1055. [Google Scholar]
- 12.Marie D, Brussaard C P D, Thyrhaug R, Bratbak G, Vaulot D. Enumeration of marine viruses in culture and natural samples by flow cytometry. Appl Environ Microbiol. 1999;65:45. doi: 10.1128/aem.65.1.45-52.1999. [DOI] [PMC free article] [PubMed] [Google Scholar]
- 13.Monger B C, Landry M R. Flow cytometric analysis of marine bacteria with Hoechst 33342. Appl Environ Microbiol. 1993;59:905–911. doi: 10.1128/aem.59.3.905-911.1993. [DOI] [PMC free article] [PubMed] [Google Scholar]
- 14.Noble R T, Fuhrman J A. Use of SYBR Green I for rapid epifluorescence counts of marine viruses and bacteria. Aquat Microb Ecol. 1998;14:113–118. [Google Scholar]
- 15.Paul J H, Jiang S C, Rose J B. Concentration of viruses and dissolved DNA from aquatic environments by vortex flow filtration. Appl Environ Microbiol. 1991;57:2197–2204. doi: 10.1128/aem.57.8.2197-2204.1991. [DOI] [PMC free article] [PubMed] [Google Scholar]
- 16.Proctor L M, Fuhrman J A. Viral mortality of marine bacteria and cyanobacteria. Nature. 1990;343:60–62. [Google Scholar]
- 17.Robertson B R, Button D K. Characterizing aquatic bacteria according to population, cell size, and apparent DNA content by flow cytometry. Cytometry. 1989;10:70–76. doi: 10.1002/cyto.990100112. [DOI] [PubMed] [Google Scholar]
- 18.Sieburth J M, Johnson P W, Hargraves P E. Ultrastructure and ecology of Aureococcus anophagefferens gen. et sp. nov. (Chrysophyceae): the dominant picoplankter during a bloom in Narragansett Bay, Rhode Island, summer 1985. J Phycol. 1988;24:416–425. [Google Scholar]
- 19.Suttle C A. Enumeration and isolation of viruses. In: Kemp P F, Sherr B, Sherr E, Cole J J, editors. Handbook of methods in aquatic microbial ecology. Boca Raton, Fla: Lewis Publishers; 1993. pp. 121–134. [Google Scholar]
- 20.Waterbury J B, Valois F W. Resistance to co-occurring phages enables marine Synechococcus communities to coexist with cyanophages abundant in seawater. Appl Environ Microbiol. 1993;59:3393–3399. doi: 10.1128/aem.59.10.3393-3399.1993. [DOI] [PMC free article] [PubMed] [Google Scholar]
- 21.Weinbauer M G, Suttle C A. Comparison of epifluorescence and transmission electron microscopy for counting viruses in natural marine waters. Aquat Microb Ecol. 1997;13:225–232. [Google Scholar]
- 22.Wommack K E, Hill R T, Kessel M, Russek-Cohen E, Colwell R R. Distribution of viruses in the Chesapeake Bay. Appl Environ Microbiol. 1992;58:2965–2970. doi: 10.1128/aem.58.9.2965-2970.1992. [DOI] [PMC free article] [PubMed] [Google Scholar]
- 23.Wommack K E, Colwell R R. Virioplankton: viruses in aquatic ecosystems. Microbiol Mol Biol Rev. 2000;64:69–114. doi: 10.1128/mmbr.64.1.69-114.2000. [DOI] [PMC free article] [PubMed] [Google Scholar]
- 24.Xenopoulos M A, Bird D F. Virus à la sauce Yo-Pro: microwave-enhanced staining for counting viruses by epifluorescence microscopy. Limnol Oceanogr. 1997;42:1648–1650. [Google Scholar]


