

Abstract
The role of non-neuronal cells in Alzheimer’s disease (AD) progression has not been fully elucidated. Using single-nucleus RNA-seq, we identified a population of disease associated astrocytes (DAAs) in an AD mouse model. The DAA population appeared at early disease stages and increased in abundance with age. We discovered that similar astrocytes appeared in aged wild-type mice and in aging human brains, suggesting their linkage to genetic and age-related factors.
Alzheimer’s disease (AD) is a highly heterogeneous disease, and the most frequent cause of cognitive decline. Recent findings have attributed a major role to non-neuronal cells in disease onset and escalation (e.g. 1–3). However, fully elucidating their function has been challenging, due to the heterogeneity of cells and disease dynamics. Some of this cellular diversity has recently been characterized by single cell or nucleus RNA-seq, highlighting disease-related subsets of microglia in mouse and human brains1,4. However, astrocytes, which have a wide range of activation states5,6, with variable effects on disease onset and progression7, have been less characterized. In particular, massive gliosis has been observed upon AD initiation8, to which a negative effect has been attributed9. Thus, higher-resolution characterization of astrocytes and other non-neuronal cells could help identify novel cellular components of AD pathogenesis10.
We used single nucleus RNA-seq (sNuc-seq)11 to build a cellular-molecular map of the hippocampi of 7-month old mice of either WT or a transgenic model of AD (5xFAD)12 (8 mice, 54,769 high-quality nuclei, Fig. 1a, Supplementary Table 1), using two different protocols to comprehensively capture nuclei across cell types (Extended Data Fig. 1a-c). We partitioned the cells into 23 clusters (Fig. 1b, Extended Data Fig. 1,2), revealing largely similar cellular landscapes in WT and AD, with differences in the proportions of several cell populations (p<0.01, Fig. 1c). There were major differences in astrocyte states in AD relative to WT (Fig. 1c), as well as prominent differences in AD microglia, the frequency of which increased along disease progression (relative to all other cells, Fig. 1c), including the disease associated microglia (DAM) population1 (Extended Data Fig. 2c). The frequency of pericyte/endothelial cells also increased in AD (p<0.01, Fig. 1c), while that of recently activated pyramidal neurons decreased (p<0.01, Fig. 1c, Extended Data Fig. 2d). Several rare stromal populations also decreased in frequency (p<0.01, Fig. 1c, Extended Data Fig. 2e).
Figure 1. A cell atlas of the hippocampus reveals unique disease-associated astrocytes in AD.

(a) Overview of the experimental strategy. (b) Cell map of mouse hippocampus in WT and AD. tSNE embedding of 54,769 single nucleus RNA profiles from hippocampi of 7-month-old male mice, four WT and four 5xFAD (AD); colored by cluster. Right: Hierarchical cluster tree. (c) Changes in frequency of multiple cell types in AD. Right: Boxplot showing fraction of nuclei per cluster in WT and AD mice. Box: 75% and 25% quantile. Line: Median. Dots: individual samples. Left: Log ratio of average fraction in WT vs. AD. Asterisks: Statistically significant differences between AD and WT (n=8 animals, two-sided p-value<0.01, paired t-test or Wilcoxon test for non-normally distributed samples). (d) A continuous trajectory across three major astrocyte states in AD and WT brains. Diffusion map embedding of 7,345 WT and AD astrocytes, colored by cluster (grey: cells of other conditions). The three end states are marked: Gfap-low/high and DAA. Inset: Map colored by Gfap expression level. (e) Marker genes of astrocyte states. Expression level (color scale) of marker genes across clusters and the percentage of cells expressing them (dot size). (f) An increase in frequency of DAAs and reduction in frequency of homeostatic Gfap-low astrocytes in AD. Boxplot (as in c) showing the fraction of nuclei per cluster in WT and AD. Asterisks: Statistically significant differences between AD and WT (n=8 animals. Statistical test as in c). Similar proportions found in cortical brain region and in female mice, Extended Data Fig. 4.
A continuous range of astrocyte profiles (Extended Data Fig. 3a-c), were aligned on a diffusion map along trajectories between three transcriptional states (Fig. 1d, Extended Data Fig. 3d). The cells were partitioned into six transcriptional sub-clusters (Fig. 1d,e, Extended Data Fig. 3a), and their proportions in the various states differed between AD and WT (Fig. 1f, Extended Data Fig. 3e), with the appearance of a unique state observed only in AD. WT astrocytes spanned a trajectory between a homeostatic Gfap-low state (clusters 1 and 2) and a Gfap-high state (cluster 6), in line with previous observations13.
In AD, an additional novel astrocyte Gfap-high state was found, which we termed “Disease-Associated Astrocytes” (DAAs, cluster 4, Fig. 1f). DAAs were observed in both male and female mice (Extended Data Fig. 4a-d), as well as in the cortex (in 7- and 10-month old AD mice, Extended Data Fig. 4e-i), showing that DAAs are not restricted to the hippocampus. The appearance of DAAs was accompanied by a significant decrease in the homeostatic, Gfap-low astrocyte population, relative to WT mice (p<0.01, Methods). Finally, cluster 5 (in WT and AD) reflected a transitional-like intermediate state between the Gfap-low state and Gfap-high states (cluster 6), while cluster 3, which significantly increased in frequency in AD (Fig. 1f), reflected a transitional-like intermediate state between the Gfap-low state and the DAA (cluster 4) (Fig. 1d,e).
The Gfap-high astrocyte population, observed in both WT and AD, and the DAA population, unique in AD, shared a significant number of up-regulated genes compared to Gfap-low astrocytes (hypergeometric p-value<10−100, Fig. 2a,b), with little down-regulation of genes (Fig. 2a, Extended Data Fig. 4j); yet, each state had distinct expression features (Supplementary Table 2). Both populations up-regulated genes involved in development and differentiation, metabolic pathways (lipid, cholesterol), response to toxic compounds, and inflammatory signaling (FDR<0.05, Fig. 2b, Extended Data Fig. 5, Supplementary Table 3). Cells in clusters 3 and 5 upregulated a subset of the genes that were also upregulated in cluster 4 (DAAs) and cluster 6, respectively, supporting their definition as intermediate states (Fig. 2b, Extended Data Fig. 5). Notably, the Gfap-high astrocyte population, found in both AD and WT, specifically expressed markers of end-feet and blood vessels associated astrocytes, such as the Aqp414. DAAs expressed a unique set of genes, including genes involved in endocytosis, complement cascade and aging (FDR<0.05, Methods, Fig. 2a,b). Among the DAA-upregulated genes were Serpina3n, encoding a serine protease inhibitor linked to increased amyloid accumulation15, and Ctsb (Cathepsin B), encoding a lysosomal cysteine protease involved in proteolytic processing of amyloid precursor protein (APP)16 (Fig. 1e, 2a, Extended Data Fig. 4j). Interestingly, DAAs (cluster 4) and the associated intermediate state cluster 3 cells also expressed Apoe and Clu17, along with other genes encoding proteins associated with amyloid metabolism and clearance17 (FDR<0.05, Fig. 2b, Extended Data Fig. 5).
Figure 2. DAAs are associated with diverse molecular pathways and positioned in proximity to Aβ plaques in AD.
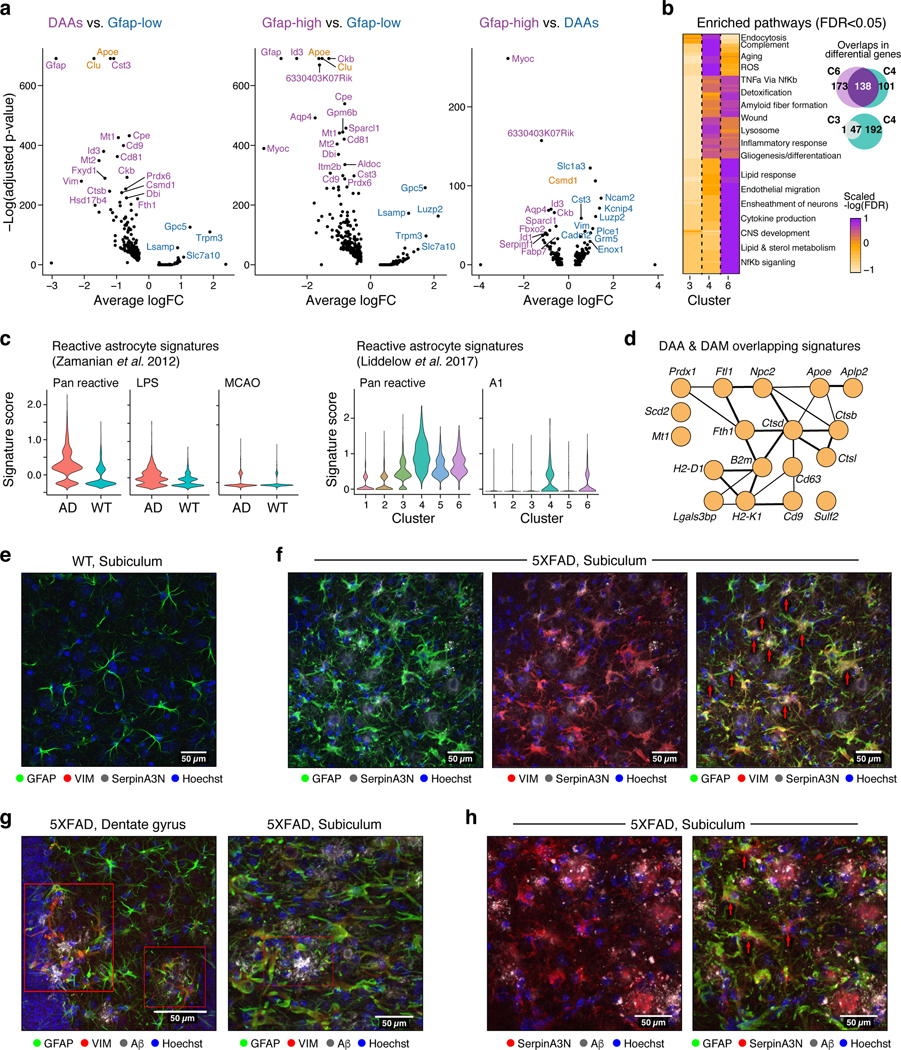
(a) Multiple genes upregulated in DAAs and Gfap-high compared to Gfap-low astrocytes (total 7,345 astrocytes across states). Volcano plot showing differential expression of genes in each pair of states (n=8 animals; 1,594, 478 and 457 cells in clusters 1,4 and 6 respectively; negative binomial p-value, FDR correction). Y-axis: -log10(adjusted p-value) and Xaxis: average log fold change (FC). All cluster pairs in Extended Data Fig. 5a. AD risk factor genes from GWAS marked in orange. (b) Shared and distinct upregulated genes and pathways between clusters 4 (DAAs), 6 (Gfap-high) and 3 (intermediate) astrocytes compared to Gfap-low astrocytes. Left: Geatmap showing the significance of upregulated pathways in the three clusters (n=8 animals. 2265 cells in cluster 3, other cells numbers as in (a); Hypergeometric p-value, FDR<0.05. -log(FDR) values as colorbar) Selected pathway names are highlighted (full list in Extended Data Fig. 5b and Supplementary Table 3). Right: Venn diagrams of up-regulated genes (hypergeometric p-value FDR < 0.01). (c) Signatures of reactive astrocytes found in AD. Violin plots showing the distribution of expression scores (y axis) for previously defined signature genes for (left) pan-reactive, inflammation-associated (LPS), and ischemia-associated (MCAO) reactive astrocytes (from6) across WT (3,831 cells, n=4 animals) and AD (3,514 cells, n=4 animals), and (right) pan-reactive and A1-reactive astrocytes (from5) across clusters (n=8 mice, 10 samples, Extended Data Fig. 6a-c). (d) Overlapping upregulated genes between disease-associated microglia (DAM)1 and DAA. 18 shared genes (nodes), connected by functional links (edges), weighted (edge width) proportionally to the confidence levels (Methods). (e-h) Astrocytes expressing DAA markers are found in AD brains, enriched in the subiculum and in proximity to Aβ plaques. Representative immunofluorescence images in sagittal sections of 7–8-month old mice. Subiculum, stained for GFAP (green), VIM (red), and serpinA3N (gray), in WT mice (e) and 5XFAD mice (f). Dentate gyrus (g, left) and subiculum (g, right), stained for GFAP (green), VIM (red), and Aβ (gray) in 5XFAD mice. Subiculum, stained for GFAP (green), serpinA3N (red), and Aβ (gray) in 5XFAD mice (h). Cell nuclei are shown in blue (Hoechst). Scale bar, 50 μ m. Red arrows or red boxes: colocalization of three proteins. Experiments repeated on 4 brain slices per animal on n=4 AD and WT mice.
To relate DAAs to previously described astrocyte profiles, we examined bulk RNA profiles5,6 and found that AD astrocytes had increased expression of pan-reactive and inflammation/A1 astrocyte signatures compared to WT, but did not show an increase in ischemia/A2 astrocyte signatures (Fig. 2c, Extended Data Fig. 6a-b). While most of the inflammation/A1 signature genes were found to be expressed by DAAs, some were found to be expressed by the other astrocyte populations (Fig. 2c, Extended Data Fig. 6c), indicating that previously reported bulk signatures5,6 captured a mixed population. Notably, there were 18 shared genes (hypergeometric p-value<3*10−4, Fig. 2d) between the 239 DAA signature genes and 213 signature genes previously described for disease associate microglia (DAM1). These included the AD risk gene Apoe and the Ctsb, Ctsd and Ctsl genes, encoding proteins (Cathepsin B, D and L) implicated in AD pathogenesis16.
We verified the presence of DAAs at the protein level and characterized their spatial distribution by co-staining the hippocampus of WT and 5xFAD animals for the GFAP and DAA markers SERPINA3N and VIM (markers of reactive astrocytes6 and NSCs18, respectively, Fig. 2e,f). GFAP+SERPINA3N+VIM+ astrocytes were observed in 5xFAD but not WT mice, confirming our sNuc-Seq profiles, and were most highly concentrated in the subiculum, where disease is known to be most prominent12. While in WT mice VIM+ cells were found in the dentate gyrus, consistent with their known association with the neurogenic niche18, in AD, VIM+GFAP+ astrocytes were prevalent throughout the hippocampus and especially in the subiculum. SERPINA3N+ and VIM+ astrocytes were found adjacent to stained amyloid beta plaques (Fig. 2g,h, Extended Data Fig. 6d). Notably, SERPINA3N, a secreted protein, was also detected embedded in plaques (Fig. 2g,h, Extended Data Fig. 6d), and thus may be expressed by other cells within the diseased brain.
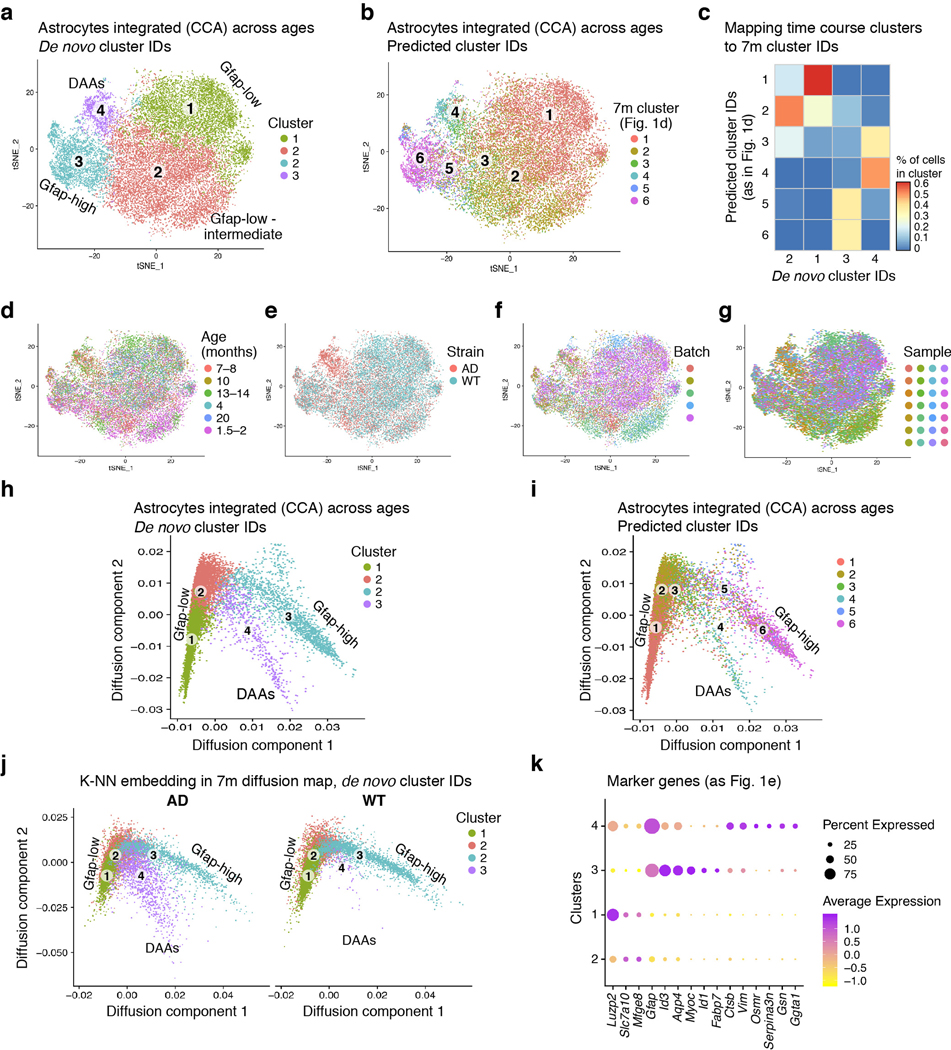
To determine how cells change along disease progression, we profiled cells by sNuc-seq from AD and WT mice at different ages (1.5–2, 4–5, 7–8, 10, 13–14 and 20 month old, 28 mice, 23,863 astrocytes nuclei, Fig. 3a). As reported1, microglia frequencies were higher in AD than WT brains at all time points tested, from 4 month, and increased with age (Fig. 3b). Astrocytes mapped along the same continuous trajectories, spanning from Gfap-low to Gfap-high states in WT mice (aged 1.5–10 month) and young AD mice (1.5–2 month old, Fig. 3c, Extended Data Fig. 7). In AD, however, from 4 month of age, before manifestation of cognitive decline12, there was a consistent reduction in Gfap-low and a corresponding increase in DAAs (Fig. 3d). The results suggest that DAAs arise in the AD mouse model prior to cognitive decline and increase along disease progression.
Figure 3. DAAs are derived from homeostatic Gfap-low astrocytes and increase with age.

(a) sNuc-Seq time course experiment in WT and 5xFAD mice across six age groups (n=28 mice detailed in Supplementary Table 1). (b) Relative increase of microglia frequency with age, in AD compared to WT. Log ratio frequency of microglia cells in AD vs. WT (y axis), by age (x axis), in animal pairs matched by batch and age. (c) Continuous trajectory across three major astrocyte states in AD and WT brains across ages. Embedding of 23,863 astrocytes in diffusion map (as in Fig. 1d), highlighting cells per age and condition (top: WT, bottom: AD), colored by inferred cluster identity (from Fig. 1d, consistent with independent clustering and diffusion map embedding of time course data in Extended Data Fig. 7). Bottom right: Schematic of astrocyte states and predicted transitions. (d) An increase in the frequency of DAAs and a decrease in homeostatic Gfap-low astrocytes with age. Fraction of Gfap-low, DAA and Gfap-high cells out of all astrocytes (y axis) across ages (x axis), in AD (red) and WT (blue). Line: linear regression, with confidence intervals. R and p-values of the linear fit. Inset: fraction of DAAs in WT. (n=23,863 cells across ages. n=28 nmice as detailed in Supplementary Table 1). (e-f) DAAs are predicted to mainly derive from the population of Gfap-low astrocytes. Diffusion map (as in (c)) with directions of transition (directed arrows, Methods) of AD astrocytes (n=12 animals, 10,226 cells) from their optimal nearest neighbor (cell of origin) among all other AD astrocytes outside the cluster (e), or among all AD astrocytes from preceding (measured) time point (f). Additional clusters and mappings in Extended Data Fig. 8. (g) DAAs are predicted to emerge from Gfap-low astrocytes according to the proportion of cells of origin per cluster. Top: For each pair of consecutive time points, the proportion (color bar) of astrocytes (rows) predicted to be derived from cells in each of the clusters in the preceding time point (columns). Bottom: Graph connecting (arrows) pairs of clusters (nodes) between consecutive time points. Only showing edges between clusters if the proportion of cells of origin is at least 14%. Arrow color: proportion. (h) Genes correlated with transitions to DAAs across clusters and ages. Top: Expression across clusters of genes significantly correlated (n=12 animals. Pearson correlation coefficient, FDR<10−3) with the transition to cluster 4 (DAAs), from each cluster in a preceding time point. Dot color: expression level; Dot radius: proportion of cells expressing the gene. Bottom: Assignment of each gene (column) to the transition from a cluster (row) and time point (color bar): upregulated = purple, downregulated = orange. (i) DAA-like cells found in aging human cortex. Right: tSNE of 3,392 sNuc-Seq profiles of cortical post-mortem human astrocytes from aging brains of healthy and AD individuals, taken from Mathys et al.4, colored by de novo cluster ID. Left: Proportions (color bar, scaled per column) of human astrocyte clusters (rows) mapped to mouse astrocyte clusters (columns). Bottom: Proportion of human astrocytes from healthy and AD individuals per the predicted mouse astrocyte cluster ID (n=48 individuals). Box: 75% and 25% quantile. Line: Median. Dots: individuals.
Examining the diffusion map (Fig. 1d, 3c, Extended Data Fig. 7) suggested that Gfap-low astrocytes are the potential source population of both Gfap-high and DAAs (Fig. 3c). To explore this possibility, we devised a computational procedure to infer transitions between cell states. We constructed a cell-cell nearest neighbors graph, and found the optimal global assignment to match each AD astrocyte, at a given time point, to a nearest neighbor, termed an origin cell, chosen either among all AD astrocytes outside its cluster (Methods, Fig. 3e), or among all astrocytes from the preceding measured time point (Fig. 3f, Methods). Calculating for each cluster the frequency of origin cells within all other clusters, revealed that the Gfap-low cells are the main origins for the cells within cluster 3, and that cells in clusters 3 and 5 are the main origins for the DAAs between consecutive time points (cluster 4, Fig. 3g). This is consistent with a model suggesting cluster 3 as an intermediate stage, and Gfap-low astrocytes as the major source of AD-specific cell states. Notably, these results were robust with respect to the source of origin cells (WT vs. AD), the measured time point, and the algorithm used (Extended Data Fig. 8). Next, we extracted the top genes that are most strongly associated with each transition between clusters across time points, by correlating genes with the average movement from the assigned origin cells to the true positions. These top significant genes reveal a set of unique DAA markers (Fig. 3h), which is consistent with our differential expression analysis (Fig. 2a, Supplementary Table 4), and define a set of genes that are activated or repressed during the transition from one state to the other.
Finally, we searched for evidence of DAA or DAA-like cells in aged brains of both WT mice and humans (Fig. 3c,d,i). In WT mice, DAA-like cells began to emerge at 13–14 month and increased in abundance in 20-month old mice (up to 2%, Fig. 3d), suggesting that a similar phenotypic state switch also occurs in normal aging, in line with published results19. Moreover, comparing mouse astrocyte states to aging human astrocytes4 (Methods), identified astrocyte populations similar to the three mouse states in aging post-mortem human brains, including DAA-like cells that appeared at a higher frequency in individuals with AD (Fig. 3i, Extended Data Fig. 9), suggesting that our findings could be relevant to human physiology and disease.
Overall, using sNuc-Seq profiles from 34 WT and 5xFAD mice across ages we identified a population of disease-associated astrocytes (DAAs) that appeared early and increased with disease progression. The DAA-like population also appeared with aging in WT mice and was found in aging human brains. Consistent with previous reports regarding activation of astrocytes by amyloid plaques7,8, astrocytes expressing DAA markers were found adjacent to amyloid plaques in the hippocampus and in the subiculum, where disease manifestations are severe12. The continuous expression spectrum between DAAs and the intermediate cluster 3 astrocytes suggests a dynamic activation process in AD. Moreover, the wide range of activities found in DAAs might reflect changes occurring along disease progression. These dynamics might begin with gliosis as an attempt to contain the damage by demarcating the accumulated misfolded proteins from the still-healthy neurons, and becomes destructive along disease progression, due to expression of an inflammatory and neurotoxic profile, including SerpinA3N, which might interfere with plaque degradation15. Notably, the dynamic astrocyte response probably involves environmental factors20 and a crosstalk between various cells present in the microenvironment, including microglia5,20. Intriguing, our analysis highlighted a shared signature of multiple genes upregulated in both DAAs and DAMs1 (relative to their respective homeostatic states), suggesting a general transcriptional program in response to the pathological state, shared across cell types under disease conditions. Taken together, the extent and nature of astrocyte alterations that we found, and the early stage at which these changes emerge, support their role, at least in part, at the initial stages of disease pathogenesis. Further studies are required to fully understand their role and to determine whether this novel astrocyte state is universal or amyloid-associated. Deciphering the different activities of DAAs, along disease progression, may suggest a novel therapeutic target, enhancing their beneficial effects, while dampening the negative properties of these cells, with the potential for disease modification.
Accession codes.
Raw and processed mouse sequencing data that support the findings of this study have been deposited in the Gene Expression Omnibus (GEO) database under accession number GSE143758 and also available at https://singlecell.broadinstitute.org/single_cell/study/SCP302/mouse-alzheimers-and-disease-astrocytes. Code is available at: https://github.com/naomihabiblab/5xFADs-NucSeq.
Methods
Experimental Design
Heterozygous 5XFAD transgenic mice12 (Tg6799; on a C57/BL6-SJL background) co-overexpress mutant forms of human APP associated with familial AD, the Swedish mutation (K670N/M671L), the Florida mutation, (I716V), and the London mutation (V717I). The study included single nuclei RNA-seq (sNuc-seq) profiles of samples from WT and 5xFAD male mouse hippocampi across six different age groups: 1.5–2 (n=6 mice), 4–5 (n=4), 7–8 (n=10, 12 samples), 10 (n=2), 13–14 (n=6), and 20 (n=2, WT only) month, as well as 5xFAD and WT 7 month old female mouse hippocampi (n=2), WT and 5xFAD male mouse prefrontal cortex (7 month, n=2, 10 month, n=2, same mice used for profiling the hippocampus) (see Supplementary Table 1). Throughout the study, WT controls in each experiment were non-transgenic littermates from the same mouse colony. Additional 5xFAD and WT 7-month old mice were used for immunohistochemistry validations.
Animal care and tissue dissection
Animals were bred and maintained by the Animal Breeding Center of the Weizmann Institute of Science. Animal handling complied with the regulations formulated by the Institutional Animal Care and Use Committee (IACUC) of the Weizmann Institute of Science. Mice were anaesthetized by intraperitoneal injection of ketamine (100 mg/kg) and xylazine (10 mg/kg), and tissue dissection was performed immediately. Tissue was frozen after dissociation and kept in −80oC until further processing.
Nucleus isolation and single nucleus RNA-seq library preparation
Working on ice throughout, hippocampus tissue was transferred into a dounce homogenizer (Sigma Cat No: D8938) with 2mL of EZ Lysis Buffer (as in 11, Sigma-Aldrich: NUC101–1KT) or NP40 Lysis Buffer (as in 21, 0.1% NP40, 10mM Tris, 146mM NaCl, 1mM CaCl2, 21mM MgCl2, 40U/mL of RNAse inhibitor). Tissue was carefully dounced while on ice 22 times with Pestle A followed by 22 times with Pestle B, then transferred to a 15mL conical tube. Next, 3mL of lysis buffer was added to the dounce homogenizer, to rinse residual nuclei, and the suspension was transferred to a 15mL tube at a final volume of 5mL. When using EZ, the lysis homogenate was incubated on ice for 5 mins, for NP40 buffer no incubation was done. The samples were centrifuged with a swinging bucket rotor at 500g for 5 mins at 4°C. Supernatant was removed and the pellet was resuspended in 100 μl of ice cold PBS (for EZ lysis) or Tris buffer (for NP40 lysis, 10mM Tris, 146mM NaCl, 1mM CaCl2, 21mM MgCl2), + 0.04% BSA (NEB B9000S) and 40U/mL of RNAse inhibitor. 40μ m FlowMi cell strainers were pre-wetted with 200μ l of ice cold PBS and the resuspended nuclei were gently filtered through the FlowMi into 1.5mL Eppendorf tubes. Nuclei were counted using the Nexcelom Cellometer Vision and a DAPI stain. DAPI was diluted to 2.5μ g/μ l in PBS and 20μ l of the DAPI was pipette mixed with 20μ l of the filtered nucleus suspension, then 20μ l of the stained nuclei were pipetted into the Cellometer cell counting chamber (Nexcelom CHT4-SD100–002). Nuclei were counted using a custom program with dilution factor set to 2. Finally, 10,000 nuclei were used as input to 10X Genomics single-cell 3’ Gene Expression v2 assay (22 samples) or v3 assay (10 samples) (Supplementary Table 1).
Libraries were prepared following the manufacturer’s protocol. Briefly, single nuclei were partitioned into Gel Beads in Emulsion (GEMs) in the GemCode/Chromium instrument with cell lysis and barcoded reverse transcription of RNA, followed by amplification, shearing and 5′ adaptor and sample index attachment. cDNA was amplified for 12 cycles, and the resulting WTA measured by Qubit HS DNA (Thermo Fisher Scientific: Q32851) and quality assessed by BioAnalyzer (Agilent: 5067–4626). The WTA material was diluted to <8ng/μ l and processed through v2 or v3 library construction, according the manufacturer’s protocol. The resulting libraries were quantified again by Qubit and BioAnalyzer. Libraries were pooled and sequenced on 2 lanes of Illumina HiSeqX by the Broad Institute’s Genomics Platform (22 samples) or on 2 lanes of NextSeq 500 by the Hebrew University Genomics Platform (10 samples).
Pre-processing of single nucleus RNA-seq data
De-multiplexing, alignment to the mm10 transcriptome and unique molecular identifier (UMI)-collapsing were performed using the Cellranger toolkit (version 2.1.1, chemistry V2, or version 3.0.2, chemistry V3) provided by 10X Genomics for chemistry Single Cell 3’, and run using cloud computing on the Terra platform (https://Terra.bio). Since nuclear RNA is expected to include roughly equal proportions of intronic and exonic reads, we built and aligned reads to genome references with pre-mRNA annotations, which account for both exons and introns. For every nucleus, we quantified the number of genes for which at least one read was mapped, and then excluded all nuclei with fewer than 400 detected genes. Genes that were detected in fewer than 10 nuclei were excluded. Expression values Ei,j for gene i in cell j were calculated by dividing UMI counts for gene i by the sum of the UMI counts in nucleus j, to normalize for differences in coverage, and then multiplying by 10,000 to create TPM-like values, and finally computing log2(TP10K + 1) (using the NormalizeData function from the Seurat22 package version 2.3.4).
Identifying variable genes
Selection of variable genes was performed as previously described in Haber et al.(Haber et al. 2017) and adapted from Brennecke et al.23. Briefly, we fit a logistic regression to the nuclear detection fraction, using the total number of UMIs per nucleus as a predictor. Outlier genes expressed in a lower fraction of nuclei than expected were chosen as the variable genes, using a threshold of p-value of 0.05. In order to minimize batch effect, variable genes were found for each batch independently, and their intersection was then used as the variable genes for downstream analysis. We restricted the expression matrix to this subset of variable genes, which was used for batch correction and scaling. For the integrated analysis of the time course data, brain regions and sex comparisons, we used the integrated workflow of Seurat22 V3, including finding variable genes by using the function FindVariableFeatures (setting the selection method to vst and the number of features to 2000).
Batch correction and scaling data matrix
For the 7-month old mouse dataset, batch correction was done using ComBat (ComBat24 function from the sva package in R) on the normalized data set. The batch-corrected data were scaled using the ScaleData function from the Seurat22 with default parameters (version 2.3.4), yielding the relative expression of each gene by scaling and centering. The scaled data matrix was then used for dimensionality reduction and clustering. To rule out the possibility that the resulting clusters were driven by batch or other technical effects, we examined the distribution of samples within each cluster and the distribution of the number of genes detected across clusters (as a measure of nucleus quality). Overall, the nuclei separated into distinct point clouds in tSNE space that were not driven by batch; each cluster/cloud was an admixture of nuclei from all technical and biological replicates, with variable numbers of genes. Related to the number of genes, we note that there was a distinct biological difference in the number of transcripts (and expected RNA content) between neuronal and glial cells in the brain.
Dimensionality reduction, clustering and visualization
We used the scaled expression matrix restricted to the variable genes for principal component analysis (PCA), using RunPCA method in Seurat (a wrapper for the irlba function), computing the top 50 PCs. After PCA, significant principal components (PCs) were identified using the elbow method, plotting the distribution of standard deviation of each PC (PCElbowPlot function in 22), choosing 25 PCs for analysis of all cells, 15 PCs for astrocytes (across all analysis, 7-month-old mice, time course astrocyte, female/male, brain regions, human data). Scores from only significant PCs were used as the input to downstream clustering, visualization by tSNE or UMAP26 and diffusion map modeling. Clustering the nuclei into transcriptionally similar clusters was done using a k-nearest neighbor (k-NN) graph, followed by the Louvain community detection algorithm25, using the top significant PCs as input to a graph-based clustering algorithm, as previously described11, with small modifications and improvements. Briefly, in the first step, we computed a k-nearest neighbor (k-NN) graph, connected each nucleus to its k-nearest neighbors (based on Euclidean distance), then used the k-NN graph as an input to the Louvain algorithm, which decomposes an input graph into communities. We used k=40 for clustering of each full dataset, with varying resolutions from 0.9 to 1.2. For the full dataset across all cell types, at the final stage, cells were hierarchically clustered and re-ordered (using BuildClusterTree method the Seurat package, given the same set of variable genes as input to the PCA analysis), providing the cluster ordering described throughout this study.
For visualization, the dimensionality of the datasets was further reduced using the same top PCs as input to t-Distributed Stochastic Neighbor Embedding (t-SNE, using the runTSNE methods which runs the Barnes-hut approximation of tSNE running the Rtsne function), or Uniform Manifold Approximation and Projection (UMAP26) dimensionality reduction technique (using the RunUMAP method which uses the umap-learn Python package). Cell populations were matched to cell types based on the expression of known marker genes and previously identified expression signatures11,27. Recently activated neuronal populations were identified based on expression of immediate early genes, such as Egr4.
Sub-clustering of astrocytes and diffusion map embedding
To identify subtypes of cells within the astrocyte populations, the same analyses described above were performed, but limited to all nuclei classified by their cluster identity as astrocytes. Astrocytes were identified by marker gene expression including high expression of Slc1a3, Gfap, Aldoc and Glul, and low/no expression of Rarres2 and Slc6a13. As shown in Extended Data Fig. 2, the expression of Slc1a3, Gfap, Rarres2 and Slc6a13 is sufficient to uniquely identify the clusters of astrocyte cells (excluding clusters of doublet cells). Specifically, for the 7 month hippocampus male mouse dataset, astrocyte clusters 1 and 2 from Figure 1b were combined and used in all the downstream analysis.
To model continuous transitions in astrocyte states, we calculated the diffusion components for all astrocytes (applied on the 7-month-old dataset or on the combined time course datasets). The diffusion components were calculated using the cell embedding values in the top 15 principal components (PCs) (generated on either the scaled expression matrix restricted to the variable genes in the 7-month old mouse dataset or on the aligned CCA subspace for the entire time course data), using the DiffusionMap function from the destiny28 package in R (with a k=30 and a local sigma). We then chose the top two diffusion components (DCs) for data visualization (other combinations of components revealed similar continuous trajectories, as shown in Extended Data Fig. 3d).
Doublet detection and removal
For doublet detection and elimination, we used the Scrublet29 method over a random subset of 30,000 nuclei to identify clusters of doublets. Scrublet identifies heterotypic doublets comprised of two different cell types by simulating doublets and building a nearest neighbor classifier. Scrublet was run with the following parameters: k=30 for the k-NN graph, doublet simulation rate of 0.3 and an expected doublet rate of 0.1. Nuclei receiving Scrublet scores over 0.25 were classified as doublets. We then clustered our data at high resolution (resolution parameter = 2.5), generating 39 clusters, and found multiple small clusters that had over 70% of nuclei classified as doublets, which we then excluded from downstream analysis. We validated that these clusters are “doublet clusters” based on a traditional inspection of expression patterns of cell type marker genes, showing that they co-express markers of at least two different cell types (the main markers we use in these inspections are shown in Extended Data Fig. 2). Notably, some clusters, such as the fibroblast cells, could have been misclassified as a doublet cluster based on the marker gene approach alone, since they express markers of several other cell types, demonstrating the importance of a computational approach that does not depend entirely on prior knowledge. In the downstream analysis of astrocytes, a second inspection for doublets was done using the traditional inspection of expression patterns of cell type marker genes. Specifically, this was done in the cortex and the female datasets before integration, removing small clusters highly expressing neuronal cell markers (such as Meg3).
Cell fraction estimations
The change in fraction of the different cell populations (clusters) was separately computed for each mouse/sample across all clusters, as the fraction of nuclei in each cluster, out of the total number of nuclei. To assess statistically significant changes in a fraction of a specific population, we first performed the Shapiro-Wilk test for normality (using the shapiro.test function in R), followed by paired t-test (for normally distributed populations) and an additional paired non-parametric Wilcoxon test (using t.test and wilcox.test functions in R). Results with p-value<0.01 were reported as significant.
Differential expression, pathway analysis, and scoring gene signatures
Differentially expressed signatures were calculated using a negative binomial test and controlled false-discovery rates (FDR) using the Benjamini-Hochberg procedure, to find genes that are upregulated within each cluster compared to the rest of the nuclei in the dataset or between pairs of clusters, including genes with less than FDR 1%. Genes were required to be expressed in at least 10% of nuclei in the given cluster, and at least 0.3-fold less in all other cells.
Gene sets enrichment
The differential expression signatures were tested for enriched pathways and gene sets, using a hypergeometric test (function enrichment in the bc3net package in R), and corrected for multiple hypotheses by FDR. Results with FDR < 0.05 were reported as significantly enriched pathways. Gene sets and pathways were taken from the MSigDB/GSEA resource (combining data from Hallmark pathways, KEGG, Reactome, PID, Canonical Pathways and GO biological process)30. Gene signatures of reactive astrocytes were obtained from Zamanian et al.6 and Liddelow et al.5.
Scoring gene signatures across cells, was done by following a procedure adapted from Smillie et al.31. Briefly, we compute for every cell the log transformed geometric average of expression values of all genes in the signature was computed, using the scaled log normalized data matrix of UMI counts. To correct for highly expressed genes, the log-transformed geometric mean of a random set of genes of with similar expression levels was then subtracted.
To compare intermediate (cluster 3), Gfap-high and DAA states, we identified genes upregulated in each of the three states vs. the homeostatic astrocytes (cluster 1) and performed pathway analysis as described above. We then combined the FDR q-values across the union of all enriched pathways, using a threshold of FDR<0.05. Enriched pathways with higher FDR values were marked as non-significant.
Disease associated microglia (DAM) microglia
The list of DAM up-regulated genes compared to the homeostatic microglia was taken from the literature (Supplementary table 2 in Keren-Shaul et al.1), and the DAM signature was defined as all genes with fold change greater than 1.2, and -log FDR > 3.3 resulting in 213 genes. Genes were filtered to include only genes found to be detected in the sNuc-seq data (retaining a total of 152 genes). All cells in our dataset from WT and AD mice were scored for the DAM signature (as described above for scoring gene signatures), and the distribution of scores was compared. To identify overlaps in the DAA and DAM signatures, we used the differentially expressed genes in DAA (cluster 4) compared to the homeostatic state (cluster 1, following the procedure defined above for Differential expression). Display of gene-gene functional links within the shared DAM-DAA signature genes, were done using the STRING database32, setting edges to reflect the confidence of the prediction, based on the following categories: co-expression, databases, text mining and experiments.
Comparison across brain regions and sex by CCA integrated analysis
Comparison of astrocyte profiles across two groups (i.e. sex, in Extended Data Fig. 4a-d, or brain regions, in Extended Data Fig. 4e-i), was done by integrated clustering of cells from the two groups (i.e. males and females or hippocampus and cortex samples), and annotating the de novo clusters by projecting the astrocyte clusters defined for the hippocampus of 7-month old male mice (from Fig. 1d). These annotated clusters were used to identify DAAs, homeostatic Gfap-low and Gfap-high astrocytes in female mice and in the cortex brain region, and to compare the relative abundance of astrocyte states between AD and WT mice across sex and brain regions. This was done by the following steps: We first identified the astrocyte cells in each of the additional datasets: sNuc-seq profiles of cortex brain region or of female hippocampus region (Supplementary Table 1), were analyzed following the procedures for normalization, scaling and clustering described above in the section “Dimensionality reduction, clustering and visualization” (using Seurat V.3). Astrocyte clusters were identified by marker genes expression (as described above) and selected for further analysis.
To compare the astrocyte cell states across regions and sex, we combined the astrocyte cells (from female mice or male cortex) with sNuc-Seq profiles from four 7-month-old mouse hippocampi (Supplementary Table 1). Datasets were combined and batch corrected by anchor based joint canonical correlation analysis (CCA)22,33, Using Seurat V3, we first normalized each dataset separately (log-transform) and found variable genes (using the function, FindVariableFeatures, setting the parameters: selection.method to vst and nfeatures to 2000). We then searched for integration anchors, which are pairwise correspondences between individual cells, with the underlying assumption that cells originating from the same biological state will be matched (using the function FindIntegrationAnchors, over the first 20 dimensions). We integrated the data using this list of anchors (using the function IntegrateData). Following the data integration, the integrated expression matrix was analyzed by repeating the standard analysis steps on the integrated expression matrix: data scaling, PCA, clustering and 2-D tSNE embedding for visualization. The top 15 PCs were used for the clustering and tSNE embedding.
To annotate the clusters, we used a similar analysis, based on the CCA22,33 approach (using Seurat V3), to project the cluster IDs from the 7-month-old mouse dataset (IDs as in Figure 1d) to the integrated set. We set the 7-month-old male mouse clusters as a reference, and predicted the cluster identity of all other cells (of different sex or brain regions), using the functions FindTransferAnchors and TransferData (in Seurat V3). Each cluster in the integrated dataset was matched to one (or two) of the astrocyte states (homeostatic Gfap-low, Gfap-high, DAA state, intermediate-sate DAA and Gfap-high intermediate state) by a majority vote within all cells in the cluster, while ambiguous results were not matched with any state. Finally, the fraction of astrocytes across clusters/states was calculated for each mouse, comparing the relative frequencies of the DAA, homeostatic Gfap-low and Gfap-high clusters in matching pairs of WT and 5xFAD mice. The CCA integrated analysis was used to enable comparison of astrocyte states, while excluding technical batch effects (differences between 10x versions), sex-specific expression patterns, or regional biases (such as regional specific ambient RNA). It is of note that not all cells in the comparison matched the original dataset of 7-month old male mice hippocampi. For example, the homeostatic astrocytes split to separate clusters between the cortex and hippocampus brain regions, while the DAAs and Gfap-high cells clustered together across brain regions. Thus, when using the CCA approach, we were able to identify distinct expression profiles in astrocytes (across brain regions), and also to identify shared expression profiles, such as DAAs astrocytes in female 5xFAD mice and in the cortex of 5xFAD mice.
For comparison of expression profiles of clusters across region or sex, we used the top marker genes, identified for the 7-month male hippocampus mice (as in Fig. 1e), of the three major astrocyte states, DAAs, homeostatic Gfap-low and Gfap-high.
Immunohistochemistry
Immunohistochemistry was performed on mouse brain sections. Mice were perfused with PBS prior to brain tissue fixation, followed by tissue processing to form 30μ m-thick floating sections. The following primary antibodies were used: rabbit anti-GFAP (1:150; Dako #Z0334 #LOT 20056262), chicken anti-VIM (1:150; Abcam #24525, # LOT GR3216660–15), goat anti-serpinA3N (1:200; R&D systems #AF4709-SP,# LOT CBKW0318051), mouse anti-Aβ 1–16 (1:150; Biolegend #803001 #LOT B247600). Secondary antibodies were Cy2/Cy3/Cy5 donkey anti- rabbit/chicken/goat/mouse antibodies, respectively (1:150; Jackson ImmunoResearch). Staining with secondary antibody alone was used to rule out nonspecific staining. The following secondary antibodies were used: Cy2/Cy3/Cy5 donkey anti- rabbit/chicken/goat/mouse antibodies, respectively (1:150; Jackson ImmunoResearch. As reported in the Reporting Summary Document: 711–225-152, cy2 Donky anti Rabbit, lot 142845; 715–225-150, Cy2AffiniPure Donkey Anti-Mouse; lot 142843; 705–225-147, Cy2-AffiniPure Donkey Anti-Goat IgG; lot 122781; 711–165-152, Cy3 Donkey anti Rabbit, lot 143202; 715–165-151, Cy3AffiniPure Donkey Anti-Mouse IgG, lot 143017; 705–165-147, Cy3 Donkey Anti-Goat, lot 143201; 715–175-151, Cy5-AffiniPure Donkey Anti-Mouse IgG, lot 144119; 711–175-152, Cy5-AffiniPure Donkey Anti-Rabbit IgG, lot 144221; 705–175-147, Cy5-AffiniPure Donkey AntiGoat, lot 134531;). For nuclear staining, Hoechst was used (1:4000; Invitrogen Probes) for 30s prior to sealing of the slides. Confocal microscopy was used for analysis (Zeiss, LSM880). Representative images were merged and optimized using ImageJ (Java.version: 1.8.0_66).
Time course datasets pre-processing and integration
The time course dataset consisted of four datasets (or batches), a 7-month old mice dataset (including 4 5xFAD and WT mice from the dataset in Figs. 1 and 2 of samples prepared with EZ lysis buffer to match the conditions in the other time points), and three additional datasets from 5xFAD and WT mice ranging in age from 1.5 to 20-month old 5xFAD and WT mice (Supplementary Table 1). Each dataset in the time course was analyzed separately, repeating the analysis steps described for the 7-month-old mice. Clusters of astrocytes or microglia were selected from each batch for further analysis.
For microglia, the fraction of microglia cells was calculated for each sample out of the total number of cells, and compared across ages and conditions, matching pairs of littermates AD and WT mice that were processed at the same sequencing batch.
For astrocytes, data across all 4 batches were combined and batch corrected by anchor based joint CCA22,33, using Seurat V3, as described for Comparison across brain regions and sex by CCA integrated analysis. Following the data integration, the integrated expression matrix was analyzed by repeating the standard analysis steps on the integrated expression matrix: data scaling, PCA, clustering and 2-D tSNE embedding for visualization, as well as diffusion map modeling, using the top 15 PCs for clustering, tSNE and diffusion map steps). The diffusion map embedding of the time course dataset aligned cells along two continuous trajectories, a Gfap-low to Gfap-high trajectory and a homeostatic-DAAs trajectory (shown in Extended Data Fig. 7), which matched the trajectories found for the 7-month old mice (Figure 1d). Notably, for consistency and clarity reasons, in Fig. 3 we show the embedding of the time-course datasets in the diffusion map of the 7-month old mice (as in Fig. 1d, which was done as described in the section Dynamic modeling, k-nearest neighbors embedding and gene expression dynamics).
Dynamic modeling, k-nearest neighbors embedding and gene expression dynamics
To computationally model dynamic transitions between astrocyte cell states along disease progression, we assigned a unique “origin cell” for each astrocyte in AD. This was done using the Hungarian algorithm34 (munkres function in MATLAB) by globally optimizing the pairwise distances, in the PCA or CCA space, between all AD astrocyte cells and their matched neighbors, selected from all AD cells at the preceding time point or among all other AD cells outside its cluster. We predicted origin cells for both reference sets to capture the dynamics in astrocyte states along different stages of the disease as well as the continuous range of astrocytes within a given time point. The predictions of origin cells were used to: (1) map the trajectory of AD cells along disease stages in the diffusion space using force fields; (2) predict the source population of the DAAs by quantifying the transitions between clusters; (3) find putative genes underlying the transitions in astrocyte states. For assigning the “origin” cells, we searched for the optimal assignment of AD astrocytes, by globally minimizing the sum of pairwise Euclidean distances in the PCA/CCA space between all pairs of cells and their assigned origin cell. For each AD time point (or AD cluster), we searched for the globally optimal assignment between all AD cells at a given time point (or a given cluster) and all other AD cells at a preceding time point (or all other AD cells outside the cluster), which we termed “origin” cells.
We devised a new computational approach to identify the genes most strongly associated with the transitions in astrocyte states. To this end, we first computed the average trajectory (in the PCA/CCA space) of cells from each AD cluster to every other AD cluster (between time points or within a given time point). We then correlated the average trajectory with the PCA/CCA loading values of each gene to identify genes that are up or down regulated in the transition from one state to the other. Genes with significant Pearson correlation (FDR<1e-2) were marked as putative marker genes for each transition.
Importantly, diffusion map analysis of the time course data aligned the astrocytes along trajectories similar to the ones identified in the 7-month dataset, in which astrocytes traverse a homeostatic-to-Gfap-high trajectory and a homeostatic-to-DAA trajectory (as shown in Extended Data Fig. 7). However, for visualization and annotation purposes, we embedded the time course data into the diffusion map of the 7-month dataset (Fig. 1d) using a k-nearest neighbor approach. To embed each cell in the 7-month diffusion space, we first identified the k nearest nuclei within the CCA space (K=10), and calculated their relative Euclidean distances di. We then calculated the relative normalized weights for each of the k neighbors, as: such that ∑𝑤i = 1, and calculated the estimated position of that nucleus within the 7-month diffusion space as a weighted average of the positions of the k neighboring nuclei (Xi). Similarly, we predicted the cluster IDs (as in Figure 1d) of embedded cells using a weighted majority vote based on the cluster IDs of their k neighbors, using the same relative normalized weights as above.
Finally, we computed the relative trajectory of each nucleus from its “origin” cells (or embedded position ) to its position Yi in the diffusion space, and visualized this trajectory as a directed arrow using force fields (quiver function in MATLAB). To validate robustness, the same analysis was done comparing AD cells to all WT cells in the 7m dataset across all cells, or to all WT and AD cells outside the cluster, per each cluster.
Comparison to aging human astrocytes
The count matrix of sNuc-Seq data from human astrocytes was obtained from Mathys et al.4, using the published cluster annotations to select all astrocyte cells. To compare the human and the mouse astrocytes, mouse genes were first mapped to human genes, using annotations from the UCSC genome browser (for mouse mm10 genome). The human data were re-analyzed following the steps described above for normalization, variable genes detection, scaling, clustering and visualization (using Seurat V3). Finally, cluster identity was assigned to the human clusters using the CCA approach (Seurat V3), with the data and cluster IDs of 7-month old male mice (as in Fig. 1d, Supplementary Table 1) (following the steps detailed in the section Comparison across brain regions and sex by CCA integrated analysis). The cluster of human astrocytes with the highest identity to the mouse DAAs cluster, was termed DAA-like. The fraction of astrocytes assigned to each of the mouse clusters out of all astrocytes, was calculated for each individual, and split to show the distributions in healthy individuals and individuals with Alzheimer’s disease. For comparison of human and mouse expression signatures, we chose top marker genes from the mouse. Notably, while a single human cluster showed the highest similarity to the mouse DAAs, more than one human cluster could be associated with the mouse DAAs by the predicted cluster IDs and by the expression of marker genes (Extended Data Fig. 9, Fig. 3i), suggesting high diversity of astrocyte states in the human brain.
Reproducibility and blindness
Sample size, data exclusion and randomization: The main dataset consisted of 4 WT and 4 transgenic 5xFAD mice, based on published results by us and other groups, showing high consistency in single nucleus RNA-seq libraries between mice, but due to technical variability it is recommended to have at least 3 animals per group. The time course data had additional 12 WT and 10 5xFAD animals across time points. Immunohistochemistry was repeated, for every set of antibodies, over n=4 AD and WT mice, with 4 brain slices per animal. No statistical methods were used to pre-determine sample sizes but our sample sizes are similar to those reported in previous publications3,11,21,27,35. Number of nuclei per animal was determined to enable detection of rare populations around 2% of all cells (calculated based on our previous data in the mouse brain11,21). No sample or animals were excluded from the analysis. As commonly done, nuclei libraries were filtered using previously established methods: nuclei with fewer than 400 detected genes were excluded from the analysis. Animals were assigned randomly to the various experimental batches according to their age, while matching transgenic Alzheimer’s model 5xFAD animals with WT non-transgenic litter-mate from the same mouse colony and age. Notably the clustering analysis and specifically the identification of the different astrocyte populations, was done blindly to the animal strain, sex and age.
Statistics
Several statistical tests were used throughout this work, as mentioned in each relevant section. These tests can be divided to the following tasks: (1) Finding statistically significant changes in fraction of cellular populations between WT and 5xFAD mice: We first performed the Shapiro-Wilk test for normality. On normally distributed cellular populations we used the two-sided paired t-test and for non-normally distributed samples we used the paired non-parametric two-sided Wilcoxon test (matching mice by experimental batch and litter mate). In both cases, tests were applied to n=8 animals (10 samples), and cellular populations with p-value <0.01 were reported. The number of cells per population varied (as shown in Fig. 1 and Extended Data Fig. 1). (2) Identifying differentially expressed genes between clusters: Negative binomial test and controlled false-discovery rates (FDR) using the Benjamini-Hochberg procedure, between pairs of clusters. For Figure 2a and Supplementary Table 2: n=8 animals, FDR<1%, and genes were required to be expressed in at least 10% of nuclei in the given cluster, and at least 0.3-fold less in all other cells, as routinely done. Data distribution was estimated to be negative binomial, though this assumption might not fit every gene. (3) Finding enriched pathways. Done by calculating the hypergeometric p-value and controlled false-discovery rates (FDR) using the Benjamini-Hochberg procedure (all gene-sets used are reported above). For Figure 2b and Supplementary Table 3: n=8 animals and a threshold of FDR<5%. (4) Testing for consistent changes in cell frequency across ages we used linear regression, computing a confidence interval per time point. Calculated with: n=12 5xFAD animals or n=16 WT animals across ages, for each astrocyte state (reporting the R value and p-value). (5) Identify the genes associated with the transitions in astrocyte states, we used our new procedure described above. Briefly, we find genes that are statistically significant (p-value controlled for false-discovery rates (FDR) using the Benjamini-Hochberg procedure <0.001) correlated with the direction of average trajectory by computing the Pearson correlation coefficient. This was done using n=12 animals, and 10,226 cells from 5xFAD mice across ages. Additional information can be found in the Life Sciences Reporting Summary.
Data and Code Availability.
Raw and processed mouse sequencing data that support the findings of this study have been deposited in the Gene Expression Omnibus (GEO) database under accession number GSE143758 and also available at https://singlecell.broadinstitute.org/single_cell/study/SCP302/mouse-alzheimers-anddisease-astrocytes. Code is available at: https://github.com/naomihabiblab/5xFADs-NucSeq.
Extended Data
Extended Data Fig. 1. A cellular map of the mouse hippocampus of WT and 5xFAD mice and quality controls.

(a) Doublet detection and elimination. 2-D tSNE embedding of 60,818 single nuclei RNA profiles from hippocampus of four WT and four 5xFAD 7- month old mice, before filtration. Top: Color coded by cluster assignment. Bottom: Color coded by doublet score assigned per cell by the Scrublet1 software, used to infer doublet cells and clusters to exclude from the analysis. (b) Number of genes and transcripts across clusters. Violin plots showing the distribution of number of genes (top) and transcripts (unique UMIs, bottom) detected in each cluster (n=8 mice, 10 samples). Cluster numbers as in Fig. 1b. (c) 2-D tSNE embedding of single nuclei RNA profiles from hippocampus of WT and 5xFAD mice (as in Fig. 1b), colored by (from left to right): batch, mouse strain (WT or AD) and sample. (d) Similar distribution of samples and batches across clusters. The percent of cells per cluster, in WT and 5xFAD mice. Middle: Colored by batch/lysis buffer (red= EZ lysis. Blue = NP40 lysis, Methods), Right: Colored by sample (blue color scale, 4 animals and 5 samples per mouse strain, AD or WT). Left: The hierarchical cluster tree and annotations of clusters, as in Fig. 1b.
Extended Data Figure 2. Cell type marker genes and assignments.

(a) Expression of marker genes across clusters. 2-D tSNE embedding of single nuclei RNA profiles from hippocampi of WT and 5xFAD mice (as in Fig. 1b), colored by expression levels of marker genes: Grin2b (neurons), Gad2 (GABAergic neurons), Vcan (Oligodendrocytes precursor cells, OPCs), Hmha1 (microglia), Flt1 (endothelial), Vtn (pericytes), Plp1 (oligodendrocytes), Slc1a3 (astrocytes), Gfap (astrocytes), Rarres2 (ependymal/NPCs), Slc6a13 (fibroblasts), Homer1 (immediate early gene, IEGs). (b) Clusters and marker genes. Dot plot showing the expression level (color scale) and the percent of cells expressing (dot size) marker genes across all clusters (rows). Cluster numbers as in Fig. 1b. (c) Disease associated microglia (DAM) signature enriched in AD. Violin plots showing the distribution in WT (n=8 animals, 896 cells) and AD (n=8 animals, 1,540 cells) of microglia expression scores for signatures of genes up-regulated in DAM compared to homeostatic microglia (from keren-Shaul et al.2, Methods). Expression score per cell is the geometric mean normalized expression level (TPMs) across all signasture genes, corrected by subtraction of the geometric mean expression of a random set of genes of similar expression levels (Methods). (d) Recently activated pyramidal neurons. Left: Dot plot as in (c) showing the expression of immediate early genes (IEGs) across all clusters (as in Fig. 1b), showing cluster 23, capturing pyramidal neurons expressing IEGs. Right: tSNE plot of all cells, color coded by the expression level of the Egr4 gene in CA3/CA1/Subiculum (cluster 23), and DG excitatory neurons (part of cluster 12). (e) Cell type specific markers. Dot plots showing the expression level (color scale) and the percent of cells expressing (dot size) genes across all clusters (rows, as in Fig. 1b), showing markers found to be specific to cells classified as (from left to right): ependymal/NPCs, fibroblasts and pericytes.
Extended Data Figure 3. Diversity of astrocyte states in WT and 5xFAD mice.

(a) 2-D Umap3 embedding of 7,345 single nuclei RNA profiles of astrocytes (as in Fig. 1d) from hippocampus of 4 WT (left) and 4 5xFAD (AD, right) 7-month old mice. Colored by cluster, all other cells in light yellow in the background. (b) 2-D Umap3 embedding as in (a), colored by sample (left), or batch (right). (c) Number of genes and transcripts across clusters. Violin plots showing the distribution of number of genes (top) and transcripts (unique UMIs, bottom) detected per cluster (n=8 animals, total of 7,345 cells). Cluster numbers as in (a). (d) Diffusion maps4 of 7,345 single nuclei RNA profiles of astrocytes in the hippocampus of WT and 5xFAD mice, showing 2-D embedding of cells in combinations of the top four diffusion components (DC), colored by mouse strain, WT (blue) and 5xFAD (AD, red). (e) Distribution of astrocyte states in WT and AD brains. Box plots showing the fraction of each astrocyte cluster (compared to total number of astrocyte cells, clusters as in Fig. 1d, n=8 animals, 10 samples), in WT and 5xFAD mice. Displaying the median (thick lines), 25% and 75% quantiles (box), and individual samples (dots).
Extended Data Figure 4. DAAs in hippocampus of both female and male 5xFAD mice and in the cortex.

(a) 2-D tSNE embedding of single nuclei RNA profiles of astrocytes from hippocampus of 7-month old female (1,500 nuclei, 2 mice, left) and male (5,183 nuclei, 4 mice, right) of three WT and three 5xFAD (AD) mice. Colored by cluster assignment. The three end states are marked on the graph: homeostatic Gfap-low, Gfap-high and DAA (annotated by projection of cluster IDs and expression patterns from Fig. 1d, Methods). (b) 2-D tSNE embedding as in (a), colored by cluster IDs of male mice, classified as cluster 4 (DAA) and cluster 6 (Gfap-low) from Figure 1d. All other cells in grey. (c) Male and female astrocytes share expression of marker genes across clusters. Expression levels (as color scale) and the percent of cells expressing (as dot size) of marker genes for DAA (Ggta1, Gsn, Osmr, Vim, Serpina3n, Ctsb, Gfap), Gfap-low (Fabp7, Slc38a1, Myoc, Aqp4, Id1, Id3, Gfap) and Gfap-low (Mfge8, Slc7a10, Luzp2) across clusters, split to male (purple color scale) and female (yellow color scale) mice. (d) Proportion of DAAs increase and homeostatic Gfap-low astrocytes decrease in AD female mice. The proportion of astrocytes classified as Gfap-low (clusters 1,2,5,6 in (a)), DAAs (cluster 3 in (a)) and Gfap-high (cluster 4 in (a)) in male and female mice. Bar: individual mice, colored by strain and sex. (e) DAAs found in 5xFAD mice cortex at age 7 and 10 months. 2-D tSNE embedding of single nuclei RNA profiles of astrocytes from WT and AD mice, from the cortex of 7 and 10 month old mice (6,062 nuclei, 4 mice) and hippocampus of 7-month old mice (5,344 nuclei, 4 mice). Colored by cluster assignments: Gfap-low (three clusters split to hippocampus and cortex), Gfap-high, DAA, intermediate and other. (f) Similar expression patterns of marker genes in astrocytes in the hippocampus and cortex. Dot plot showing the expression level (as color scale) and the percent of cells expressing (as dot size) marker genes for DAAs, Gfap-high and Gfap-low across clusters (as in (e)), split by brain region to hippocampus (Hip, yellow color scale) and cortex (Crtx, purple color scale). (g) 2-D tSNE embedding as in (e), colored by predicted cluster ID of hippocampal astrocytes from 7-month old male mice (inferred by CCA5,6 projections, as in Fig. 1d, Methods). (h) Cortical astrocyte populations match astrocyte states identified in the hippocampus. Heat map showing the correspondence between the de novo cluster IDs (rows, from (e)) of the cross regional dataset, and the predicted cluster IDs (columns) using the hippocampal astrocytes cluster IDs as reference (as from Fig. 1d). Color scale based on the proportion of predicted IDs per de novo cross-regional cluster. (i) DAAs appear in the cortex of 5xFAD (AD) mice. The proportion of astrocytes, per sample, across clusters, including clusters of Gfap-low, DAAs, and Gfap-high astrocytes. Bars: Individual mice, color annotated by region: cortex or hippocampus (Hip), age: 7 or 10 months (m), and strain: AD or WT. (j) Astrocyte marker genes expressed in 7-month old male mice (complementary to Fig. 1e). Left: Average expression level (color scale) and the percent of cells expressing (dot size) marker genes for: Gfap-low (Slc7a10, encoding a solute carrier transporter of D-serine and other amino acids7; Trpm3, encoding a transient receptor potential M3 channel related to store-operated calcium entry in astrocytes8), DAA (Ctsb, encoding a protease involved in proteolytic processing of amyloid precursor protein9,10; Csmd1, associated with cognitive functions11; C4b, encoding complement factor 4; Vim, a marker of adult neurogenesis/NSCs12), common to DAA and Gfap-high (Cd9, encoding a transmembrane protein, reported to be expressed by neural stem cells like astrocytes13), and Gfap-high (Sparcl1/Hevin, encoding a pro-synaptic protein in astrocytes14,15; Aqp4, a known marker of astrocyte endfeet16), for each cluster (cells and clusters as in Fig. 1e). Right: Violin plots (n=8 animals, 10 samples), showing the expression level distributions of Csmd1 and Ctsb in WT and AD astrocytes.
Extended Data Figure 5. DAAs and physiological Gfap-high astrocytes have shared and distinct transcriptional programs.

(a) Differential expression across astrocyte states. Volcano plots showing differentially expressed genes in each pair of states (n=8 animals, 10 samples. y-axis:-log adjusted hypergeometric p-value, following FDR multiple hypothesis correction, x-axis:average log fold change). AD risk factor genes from GWAS marked in orange (as in Fig. 2a). (b) DAAs, Gfap-high astrocytes, and cluster 3 astrocytes share multiple upregulated genes and pathways compared to the homeostatic Gfap-low astrocyte population, but also have distinct expression programs. Pathway (rows) enrichment for upregulated genes in cluster 4 (C4, DAAs, n=478 cells), cluster 6 (C6, Gfap-high, n=457), or cluster 3 (C3, intermediate state,n=1,666 cells), compared to Gfap-low astrocytes (n=1,594 cells). Enriched pathways21,22 (hypergeometric pvalue with FDR<0.05. n=8 animals, 10 samples), colored by -log FDR values (as in Fig. 2b, with full list of pathway annotations and no scaling).
Extended Data Figure 6. DAAs express signatures of reactive astrocytes and are found across brain regions.

(a-b) Signatures of inflammatory reactive astrocytes found in AD. Ridge plots showing the distribution of expression scores across each astrocyte cluster, for previously defined signature genes of: pan-reactive, A1, and A2 (from Liddelow et al.17, left), or of: pan-reactive, inflammation (LPS-induced), and ischemia (MCAO-induced) (from Zamanian et al.18 right). Expression score per cell is the geometric mean normalized expression level (TPMs) across all signature genes, corrected by subtraction of the geometric mean expression of a random set of genes of similar expression levels. (b) Violin plots showing the distribution of expression scores across WT (3,831 cells, n=4 animals) and AD (3,514 cells, n=4 animals), for signature genes for: A1 and A2 astrocytes (as defined in Liddelow et al.17). Scores computed as in (a). (c) Expression of genes from reactive, A1, and A2 signatures, showing diversity of gene patterns across astrocyte clusters. 2-D umap3 embedding of 7,345 single nuclei RNA profiles of astrocytes in the hippocampus of WT and 5xFAD mice (as in Extended Data Fig. 3a), colored by the gene expression level. Area of the graph with highest expression is marked in dotted black lines. Gene name on top of each graph. The signature the gene is associate with (pan reactive, A1 or A2) on the right side of each panel. (d) Astrocytes expressing DAA markers are present in AD brains, enriched in the subiculum and in proximity to Aβ plaques. Representative immunofluorescence images (staining repeated over n=4 AD and WT mice, with 4 brain slices per animal) in sagittal sections of 7–8-month old 5XFAD mice (with Figure 2f-h). From top to Bottom: Subiculum, stained for GFAP (green), VIM (red), and serpinA3N (gray), (as in Fig. 2f). Dentate gyrus (in Figure 2g, left) and subiculum (in Figure 2g, right), stained for GFAP (green), VIM (red), and Aβ (gray). Subiculum, stained for GFAP (green), serpinA3N (red), and Aβ (gray) (as in Figure 2h). Cell nuclei are shown in blue (Hoechst). Scale bar, 50μm.
Extended Data Figure 7. Clustering of astrocyte cells from both WT and 5xFAD mice across ages.
(a-b) A map of astrocyte states in WT and AD across ages. 2-D tSNE embedding of sNuc-Seq profiles of astrocytes in WT and 5xFAD (AD) mice across 6 different age groups (in months): 1.5–2 (n=6 mice), 4–5 (n=4), 7–8 (n=8), 10 (n=2), 13–14 (n=6), and 20 (n=2, WT only). (23,863 cells, from four batches, united by CCA integrated analysis5,6, Methods). Colored by: cluster IDs (in (a)), or predicted cluster IDs (using reference cluster IDs of astrocytes of 7-month old mice as in Fig. 1d, in (b)). (c) The correspondence between the de novo cluster IDs (columns) of the time course data, and the predicted cluster IDs (rows) from astrocytes of 7-month old mice (as in Fig. 1d). Color scale = proportion of predicted IDs per de novo cluster. (d-g) 2-D tSNE embedding of time course astrocytes as in (a), colored by: age (d), mouse strain, AD/WT (e), batch (f), or sample (g). (h) Continuous trajectory of astrocyte states across ages in WT and AD. 2-D diffusion map embedding of astrocytes across ages. Colored by de novo clusters: Gfap-low (1), Gfaplow/ intermediate (2), Gfap-high (3), and DAAs (4). 15,113 astrocyte cells, down sampled randomly from 23,863 cells to capture 2,500 cells of each age group (or the maximum number of cells available if less than 2,500). (i) 2-D diffusion map embedding (as in (h)), colored by predicted cluster IDs (as in (b)). (j) 2-D embedding of the 15,113 astrocytes of AD (left) and WT (right) cells across ages, projected onto the diffusion map of 7-month old mice (embedded by the weighted average position of the K-NN in the diffusion map in Fig. 1d, Methods). Colored by the de novo clusters (as in (a)). (k) The expression level (as color scale) and the percent of cells expressing (as dot size) of marker genes for DAAs (Ggta1, Gsn, Osmr, Vim, Serpina3n, Ctsb, and Gfap), Gfaphigh (Fabp7, Slc38a1, Myoc, Aqp4, Id1, Id3, and Gfap) and Gfap-low (Mfge8, Slc7a10, Luzp2), across de novo clusters of astrocytes in the time course dataset.
Extended Data Figure 8. DAAs are largely derived from Gfap-low astrocytes.

(a-b) Direction of transition of AD astrocytes from their global optimal nearest neighbor (origin) cell (predicted by the Hungarian algorithm19, Methods) to their given position in the diffusion map. For each cluster, force field (black arrows) marking the directionality of transitions along the diffusion map4 (as in Figure 1d), cells colored by cluster ID. Showing transitions from the predicted cell of origin among all WT cells or AD cells outside the cluster (a), or among all WT cells only (b) (transition from origin cells among all AD cells outside the cluster or AD cells in different clusters from a preceding time point, shown in Fig. 3). (c) Proportion of cells of origin per cluster (dot size and color) for each AD cluster (rows), from all WT cells (left) or from AD cells from all other clusters (right). (d) Scheme of transitions. A graph showing arrows between pairs of clusters with high proportion of origin cells (>15%) when mapping AD to all WT cells. Color and width of edge reflects the proportion. Diffusion map as in (a) in the background. (e) Genes correlated with predicted transitions from WT cells to DAA in AD. The expression level across clusters (dot color) and the percent of cells expressing (dot size) significant (Pearson Correlation coefficient, FDR qvalue<0.001, n=28 mice, 25,076 cells, Supplementary Table 1) genes that correlated with the transition to cluster 3 (intermediate) or cluster 4 (DAAs) from WT cells. Bottom: Assignment of each gene to a transition between pairs of clusters (upregulated = purple, downregulated = orange). (f) Direction of transition on the diffusion space of AD astrocytes in each cluster from their weighted K-nearest neighbor position among all other WT cells. Force field showing the directionality of transitions between the expected position in the diffusion map (weighted average position of K-NN among all WT cells, k=10) to the true position along the diffusion map (as in Figure 1d) for each cell. Colored by cluster IDs. Cluster numbers labeled on top of each graph.
Extended Data Figure 9. DAA-like astrocytes found in aging human cortex.

(a-b) Diversity of human astrocytes. 2-D tSNE embedding of 3,392 sNuc-Seq profiles of cortical human astrocytes from post-mortem aging brains of AD and non-AD individuals, taken from Mathys et al.20, colored by cluster ID (de novo clustering, clusters A-F, (a)), or by predicted cluster IDs (clusters 1–6, by CCA5,6 projections, (b)) using as reference clusters of 7-month old mice (as in Fig. 1d). (c) The average prediction scores (as color scale) and the percent of cells with score above 0 (as dot size) for the three major end-states mouse clusters (from Fig. 1d), across the human astrocyte clusters (as in a, Mathys et al. 20). From left to right: Gfap-low (mouse cluster 1), DAAs (mouse cluster 4), and Gfap-high (mouse cluster 6). (d) Dot plot showing the expression level (as color scale) and the percent of cells expressing (as dot size) marker genes for mouse astrocyte states: DAA (OSMR, VIM, GFAP), Gfap-high (ID1, ID3, SLC38A1, GFAP) and homeostatic Gfap-low (MFGE8), across clusters of the human cortical astrocytes (from Mathys et al.20).
Supplementary Material
Acknowledgments.
We thank R. Herbst, I. Avraham-Davidi and members of the Habib lab for discussions and helpful suggestions. L. Gaffney for graphics and J. Rood for editing. We thank Dr. I. Shif, Dr. M. Bronstein for help with library preparation and sequencing. This work was supported by the NIH BRAIN Initiative grant (U19MH114821 for AR), the Klarman Incubator and Klarman Cell Observatory (AR), HHMI (AR) and MOST-IL flagship grant (for NH). MS holds the Maurice and Ilse Katz Professorial Chair in Neuroimmunology, NH holds the Goren-Khazzam Chair in Neurobiology. The work was supported in part by Advanced European Research Council grants no. 232835 (MS); Israel Science Foundation (ISF)- research grants no. 991/16 (MS), 913/15 (TK), 1250/18 (TK); and ISF-Legacy Heritage Biomedical Science Partnership-research grant no. 1354/15 (MS). Adelis Foundation and Thompson Foundation (MS), the MOST IL-China research grant 3–15687 (NH), and the Alon Fellowship (NH).
Footnotes
Competing Interests Statement. AR is a founder and equity holder of Celsius Therapeutics, equity holder in Immunitas Therapeutics and a SAB member of Syros Pharmaceuticals, Thermo Fisher Scientific, Neogene Therapeutics and Asimov. The other authors declare no competing interests.
References
- 1.Keren-Shaul H et al. A Unique Microglia Type Associated with Restricting Development of Alzheimer’s Disease. Cell 169, 1276–1290.e17 (2017). [DOI] [PubMed] [Google Scholar]
- 2.Strooper B & Karran E The Cellular Phase of Alzheimer’s Disease. Cell 164, 603–615 (2016). [DOI] [PubMed] [Google Scholar]
- 3.Baruch K et al. PD-1 immune checkpoint blockade reduces pathology and improves memory in mouse models of Alzheimer’s disease. Nat Med 22, 135–137 (2016). [DOI] [PubMed] [Google Scholar]
- 4.Mathys H et al. Single-cell transcriptomic analysis of Alzheimer’s disease. Nature 570, 332–337 (2019). [DOI] [PMC free article] [PubMed] [Google Scholar]
- 5.Liddelow SA et al. Neurotoxic reactive astrocytes are induced by activated microglia. Nature 541, 481–487 (2017). [DOI] [PMC free article] [PubMed] [Google Scholar]
- 6.Zamanian JL et al. Genomic analysis of reactive astrogliosis. J Neurosci 32, 6391–6410 (2012). [DOI] [PMC free article] [PubMed] [Google Scholar]
- 7.Matias I, Morgado J & Gomes F Astrocyte Heterogeneity: Impact to Brain Aging and Disease. Front Aging Neurosci 11, 59 (2019). [DOI] [PMC free article] [PubMed] [Google Scholar]
- 8.Rodríguez-Arellano J, Parpura V, Zorec R & Verkhratsky A Astrocytes in physiological aging and Alzheimer’s disease. Neuroscience 323, 170–182 (2016). [DOI] [PubMed] [Google Scholar]
- 9.Bates K, Fonte J, Robertson T, Martins R & Harvey A Chronic gliosis triggers Alzheimer’s disease-like processing of amyloid precursor protein. Neuroscience 113, 785–796 (2002). [DOI] [PubMed] [Google Scholar]
- 10.Liao M-C et al. Single-Cell Detection of Secreted Aβ and sAPPα from Human IPSC-Derived Neurons and Astrocytes. J Neurosci 36, 1730–1746 (2016). [DOI] [PMC free article] [PubMed] [Google Scholar]
- 11.Habib N et al. Massively parallel single-nucleus RNA-seq with DroNc-seq. Nat Methods 14, 955–958 (2017). [DOI] [PMC free article] [PubMed] [Google Scholar]
- 12.Oakley H et al. Intraneuronal beta-amyloid aggregates, neurodegeneration, and neuron loss in transgenic mice with five familial Alzheimer’s disease mutations: potential factors in amyloid plaque formation. J Neurosci 26, 10129–10140 (2006). [DOI] [PMC free article] [PubMed] [Google Scholar]
- 13.Zeisel A et al. Molecular Architecture of the Mouse Nervous System. Cell 174, 999– 1014.e22 (2018). [DOI] [PMC free article] [PubMed] [Google Scholar]
- 14.Leitão R et al. Aquaporin-4 as a New Target against Methamphetamine-Induced Brain Alterations: Focus on the Neurogliovascular Unit and Motivational Behavior. Mol Neurobiol 55, 2056–2069 (2018). [DOI] [PubMed] [Google Scholar]
- 15.Mucke L et al. Astroglial Expression of Human α1-Antichymotrypsin Enhances Alzheimer-like Pathology in Amyloid Protein Precursor Transgenic Mice. Am J Pathology 157, 2003–2010 (2000). [DOI] [PMC free article] [PubMed] [Google Scholar]
- 16.Wang C, Sun B, Zhou Y, Grubb A & Gan L Cathepsin B degrades amyloid-β in mice expressing wild-type human amyloid precursor protein. J Biol Chem 287, 39834–39841 (2012). [DOI] [PMC free article] [PubMed] [Google Scholar]
- 17.Roussotte FF et al. Combined effects of Alzheimer risk variants in the CLU and ApoE genes on ventricular expansion patterns in the elderly. J Neurosci 34, 6537–6545 (2014). [DOI] [PMC free article] [PubMed] [Google Scholar]
- 18.von und Halbach O Immunohistological markers for proliferative events, gliogenesis, and neurogenesis within the adult hippocampus. Cell Tissue Res 345, 1–19 (2011). [DOI] [PubMed] [Google Scholar]
- 19.Clarke LE et al. Normal aging induces A1-like astrocyte reactivity. Proc National Acad Sci 115, E1896–E1905 (2018). [DOI] [PMC free article] [PubMed] [Google Scholar]
- 20.Rothhammer V et al. Microglial control of astrocytes in response to microbial metabolites. Nature 557, 724–728 (2018). [DOI] [PMC free article] [PubMed] [Google Scholar]
- 21.Gaublomme JT et al. Nuclei multiplexing with barcoded antibodies for single-nucleus genomics. Nat Commun 10, 2907–8 (2019). [DOI] [PMC free article] [PubMed] [Google Scholar]
- 22.Butler A, Hoffman P, Smibert P, Papalexi E & Satija R Integrating single-cell transcriptomic data across different conditions, technologies, and species. Nat Biotechnol 36, 411–420 (2018). [DOI] [PMC free article] [PubMed] [Google Scholar]
- 23.Brennecke P et al. Accounting for technical noise in single-cell RNA-seq experiments. Nat Methods 10, 1093–1095 (2013). [DOI] [PubMed] [Google Scholar]
- 24.Johnson EW, Li C & Rabinovic A Adjusting batch effects in microarray expression data using empirical Bayes methods. Biostatistics 8, 118–127 (2007). [DOI] [PubMed] [Google Scholar]
- 25.Lancichinetti A & Fortunato S Benchmarks for testing community detection algorithms on directed and weighted graphs with overlapping communities. Phys Rev E 80, 016118 (2009). [DOI] [PubMed] [Google Scholar]
- 26.McInnes L, Healy J & Melville J UMAP: Uniform Manifold Approximation and Projection for Dimension Reduction. (2018). [Google Scholar]
- 27.Habib N et al. Div-Seq: Single-nucleus RNA-Seq reveals dynamics of rare adult newborn neurons. Science 353, 925–928 (2016). [DOI] [PMC free article] [PubMed] [Google Scholar]
- 28.Angerer P et al. destiny : diffusion maps for large-scale single-cell data in R. Bioinformatics 32, 1241–1243 (2016). [DOI] [PubMed] [Google Scholar]
- 29.Wolock SL, Lopez R & Klein AM Scrublet: Computational Identification of Cell Doublets in Single-Cell Transcriptomic Data. Cell Syst 8, 281–291.e9 (2019). [DOI] [PMC free article] [PubMed] [Google Scholar]
- 30.Liberzon A et al. The Molecular Signatures Database (MSigDB) hallmark gene set collection. Cell Syst 1, 417–425 (2015). [DOI] [PMC free article] [PubMed] [Google Scholar]
- 31.Smillie CS et al. Intra- and Inter-cellular Rewiring of the Human Colon during Ulcerative Colitis. Cell 178, 714–730.e22 (2019). [DOI] [PMC free article] [PubMed] [Google Scholar]
- 32.Szklarczyk D et al. STRING v11: protein-protein association networks with increased coverage, supporting functional discovery in genome-wide experimental datasets. Nucleic Acids Res 47, D607–D613 (2019). [DOI] [PMC free article] [PubMed] [Google Scholar]
- 33.Stuart T et al. Comprehensive Integration of Single-Cell Data. Cell 177, 1888–1902.e21 (2019). [DOI] [PMC free article] [PubMed] [Google Scholar]
- 34.Munkres J Algorithms for the Assignment and Transportation Problems. J Soc Ind Appl Math 5, 32–38 (1957). [Google Scholar]
- 35.Baruch K et al. Breaking immune tolerance by targeting Foxp3(+) regulatory T cells mitigates Alzheimer’s disease pathology. Nat Commun 6, 7967–12 (2015). [DOI] [PMC free article] [PubMed] [Google Scholar]
Associated Data
This section collects any data citations, data availability statements, or supplementary materials included in this article.
Supplementary Materials
Data Availability Statement
Raw and processed mouse sequencing data that support the findings of this study have been deposited in the Gene Expression Omnibus (GEO) database under accession number GSE143758 and also available at https://singlecell.broadinstitute.org/single_cell/study/SCP302/mouse-alzheimers-anddisease-astrocytes. Code is available at: https://github.com/naomihabiblab/5xFADs-NucSeq.