


Abstract
Long noncoding RNAs (lncRNAs) and microRNAs (miRNAs) modulate gene expression programs in physiology and disease. Here, we report a noncoding RNA regulatory network that modulates myoblast fusion into multinucleated myotubes, a process that occurs during muscle development and muscle regeneration after injury. In early stages of human myogenesis, the levels of lncRNA OIP5-AS1 increased, while the levels of miR-7 decreased. Moreover, OIP5-AS1 bound and induced miR-7 decay via target RNA-directed miRNA decay; accordingly, loss of OIP5-AS1 attenuated, while antagonizing miR-7 accelerated, myotube formation. We found that the OIP5-AS1-mediated miR-7 degradation promoted myoblast fusion, as it derepressed the miR-7 target MYMX mRNA, which encodes the fusogenic protein myomixer (MYMX). Remarkably, an oligonucleotide site blocker interfered with the OIP5-AS1-directed miR-7 degradation, allowing miR-7 to accumulate, lowering MYMX production and suppressing myotube formation. These results highlight a mechanism whereby lncRNA OIP5-AS1-mediated miR-7 decay promotes myotube formation by stimulating a myogenic fusion program.
INTRODUCTION
Over the past two decades, thousands of mammalian long noncoding RNAs (lncRNAs), spanning >200 nucleotides, have been identified (1,2). Some of them have been associated with diseases such as cancer, neurodegeneration and muscle wasting; others have been found to participate in specific developmental processes such as adipogenesis, neurogenesis and myogenesis (3–5). Functional characterization of many lncRNAs has revealed that they control gene expression programs at different levels, including chromatin remodeling, transcription, mRNA transport, stability and translation, as well as protein localization, function and decay (1,2,6–8).
Myogenesis is a tightly regulated process responsible for muscle differentiation during development and adult muscle regeneration upon injury. Myogenesis begins with the activation of satellite cells (muscle stem cells) into myoblasts and progresses through the fusion of myoblasts into long multinucleated myotubes to generate contractile myofibers (9–11). Myogenesis and muscle homeostasis are impaired with aging and diseases such as cancer, leading to sarcopenia and cachexia. Several regulatory lncRNAs have been implicated in myogenesis through their interactions with different molecular partners (12,13). For example, linc-YY1 interacts with protein YY1 to remove repressive Polycomb complexes from the promoters of target genes, lncMyoD regulates myoblast differentiation by suppressing IMP2-mediated translation, and lnc-31 promotes ROCK1 translation by YB-1 through binding both Rock1 mRNA and YB-1 protein (14–16). In other examples, lincMD1 acts as a competing endogenous RNA (ceRNA) that controls myogenesis by sequestering the microRNAs (miRNAs) miR-135 and miR-133a, and lnc-mg promotes myogenesis and prevents muscle atrophy by binding and neutralizing miR-125b (17,18). In fact, some abundant lncRNAs have been established as ceRNAs that bind specific miRNAs and suppress their impact on target mRNAs encoding myogenic factors (15,16,19). However, whether myogenic lncRNAs may also regulate miRNA functions through other mechanisms is largely unexplored.
Recently, we found that the levels of OIP5-AS1, a lncRNA abundant in muscle and relatively conserved, increased during myogenesis and promoted human myogenic differentiation (20). In neural tissues of developing zebrafish, Oip5-as1 was identified and initially named Cyrano after the morphological abnormalities of fish bearing a mutant form of this lncRNA (21); in mouse brain, Oip5-as1 was found to bind to miR-7 in conserved regions of the lncRNA (22). Interestingly, while skeletal muscle aging is exacerbated by impaired myogenic regeneration, lower levels of miR-7 were found in skeletal muscle of elite athletes relative to age-matched sedentary controls (23), and high levels of miR-7 were found in skeletal muscle from old mice and deer (24,25). Here, we tested the hypothesis that OIP5-AS1 and miR-7 might be linked functionally in human myogenesis. We discovered that OIP5-AS1, rising in abundance during myogenesis, was capable of binding and reducing miR-7 stability by target-directed miRNA degradation (TDMD) (22,26–32) during myogenesis. In turn, the reduction in miR-7 levels enabled a rise in the production of myomixer (MYMX) through increased stabilization and translation of MYMX mRNA. It was recently reported that the fusogenic protein MYMX was a master regulator of the fusion of myoblasts into multinucleated myotubes (33–35). Interestingly, a target site blocker (TSB) that interfered with the binding of miR-7 to OIP5-AS1 prevented the decline in miR-7 levels and inhibited myotube formation, as MYMX expression was suppressed. We propose that in regenerating skeletal muscle, the elevation in OIP5-AS1 levels reduces miR-7 levels via TDMD, in turn contributing to a rise in MYMX levels and increased myotube formation.
MATERIALS AND METHODS
Cell culture and myogenic differentiation
Immortalized human AB1167 and AB678 myoblasts were developed and cultured as described (20,36). Briefly, human myoblasts were cultured in growth medium (equal volume mixture of Ham’s F10 medium supplemented with 20% fetal bovine serum and PromoCell Skeletal Muscle Cell Growth Medium) and were induced to differentiate by growth to high density and replacement of the growth medium with differentiation medium (DMEM supplemented with 2% horse serum). For silencing experiments, using a final concentration of 50 nM siRNA and Lipofectamine RNAiMAX (Thermo Fisher Scientific), control small interfering RNA (Ctrl siRNA) or siRNAs directed at OIP5-AS1, ZSWIM8 mRNA or MYMX mRNA were transfected 24 h before induction of differentiation. For miRNA overexpression and inhibition experiments, using a final concentration of 50 nM miRNA mimics or antagomiR and Lipofectamine RNAiMAX, control miRNA (Ctrl miRNA), miR-7 mimic or miR-7 antagomiR was transfected 24 h before inducing differentiation. In experiments to overexpress MYMX, 1 μg MYMX-Flag plasmid (Origene) was transfected using Lipofectamine 2000 or 3000 (Thermo Fisher Scientific) and differentiation was induced 24 h later.
Creatine kinase activity
Creatine kinase (CK) activity was determined in cell lysates by using the EnzyChrom Creatine Kinase Assay Kit (BioAssay Systems) following the manufacturer’s protocol. Briefly, cell lysates (1 or 2 μg) were incubated with 10 μl substrate solution, 100 μl assay buffer and 1 μl enzyme mix at 37°C for 20 min; reactions were read 20 and 40 min later at 340 nm. CK activity was calculated by the equation  , and expressed as ‘units per μg of total protein’ or ‘fold change’.
Reverse transcription followed by real-time quantitative PCR analysis
Total RNA from cultured cells was isolated using the Direct-zol™ RNA MiniPrep Kit (Zymo Research), which includes a digestion step using DNase I. For cDNA synthesis, reverse transcription (RT) was performed for RNA prepared in TRIzol using Maxima Reverse Transcriptase (Thermo Fisher Scientific) following the manufacturer’s protocol. Quantitative PCR (qPCR) analysis of RNAs was performed according to the manufacturer’s instructions for KAPA SYBR FAST ABI Prism qPCR Kit (KAPA Biosystems) with RNA-specific primers (Supplementary Table S1). RT-qPCR reactions were performed on QuantStudio 5 Real-Time PCR System (Thermo Fisher Scientific) with a cycle setup of 2 min at 95°C and 40 cycles of 5 s at 95°C plus 20 s at 60°C; the fold change in abundance was calculated as described previously (20). In qPCR amplification reactions, control ‘RT minus’ (‘RT−’) reactions were routinely included. RT-qPCR analysis of miRNAs was carried out using the MiR-X miRNA first-strand synthesis kit (Takara Bio) and quantified using the small RNA U6 as internal control.
RNA copy number calculations
RNA copy number was carefully calculated using three different methods: (i) by comparison between endogenous RNA and external DNA of known abundance (‘standard curve method’); (ii) by comparison with an endogenous transcript of known copy number by RT-qPCR analysis (‘relative Ct method’); and (iii) by droplet digital PCR analysis (‘ddPCR method’). For the standard curve method, an external DNA pool (four different DNAs) of known concentration was spiked into the sample, amplified by qPCR and used to generate a standard curve, as described (37). The Ct values of OIP5-AS1, MYMX mRNA, GAPDH mRNA and miR-7 were interpolated from the curve to calculate copy number. A separate standard curve was prepared using miR-7; the copy number per cell of miR-7 calculated against this standard curve agreed with the copy number estimated against the ectopic spiked-in DNA. For the relative Ct method, Ct values of OIP5-AS1, MYMX mRNA and miR-7 were compared to the relative Ct values of a transcript of known abundance, GAPDH mRNA (estimated to be present at ∼1300 copies per AB678 cell and nucleus-equivalent, as determined from the standard curve method). For the ddPCR method, analysis was performed as described (38). Briefly, total RNA (1 μg) was reverse-transcribed and droplets were generated using EvaGreen Supermix (Bio-Rad) on the QX200™ AutoDG™ Droplet Digital™ PCR System (Bio-Rad Laboratories). The PCR reaction contained 1 μl of 1:25 diluted cDNA and 100 nM primers. The PCR amplification setup was as follows: 5 min at 95°C, 30 s at 95°C followed by 60 s at 60°C for 40 cycles, 5 min at 4°C, 5 min at 90°C and then held at 4°C. The absolute copy numbers were assessed using the QX200 Droplet Digital PCR System and calculated as described (39,40); miRNAs are too short for accurate ddPCR measurement in this instrument.
Pulldown of miRNA targets by biotinylated miRNA
MicroRNA pulldown analysis was carried out as previously described (41). Biotinylated miR-7 was transfected into myoblasts and 6 h later myoblasts were changed to differentiation medium (DMEM supplemented with 2% horse serum) and cultured for an additional 16 h. The cells were collected and lysed by incubation with lysis buffer [20 mM Tris–HCl (pH 7), 100 mM KCl, 5 mM MgCl2, 25 mM EDTA, 0.3% NP-40] for 20 min. Cytoplasmic lysates were further incubated with streptavidin magnetic beads (Dynabeads M-280, Life Technologies) for 4 h. Pulldown samples were washed with lysis buffer four times and RNAs in the pulldown were isolated using the Direct-zol™ RNA MiniPrep Kit (Zymo Research), which includes a digestion step using DNase I.
Western blot analysis
Total protein lysates were prepared in RIPA buffer containing protease inhibitors. Proteins were size-separated by SDS-PAGE and transferred onto nitrocellulose membrane (Life Technologies). For western blot analysis, primary antibodies were employed that recognized MYH/MHC (B-5) and HSP90 (F-8) (Santa Cruz Biotechnology), MEF2C (D80C1) (Cell Signaling Technology) and MYMX (AF4580) (R&D Systems). After incubation with the appropriate secondary antibodies, protein signals were developed using chemiluminescence.Bands on western blots were quantified by densitometry using ImageJ, and were typically represented as the percent signal of the strongest band if some bands were undetectable.
RNA-seq analysis
Single-end sequencing was performed on an Illumina HiSeq 2500 instrument (GSE181258), and paired-end sequencing was performed on a Novaseq 6000 instrument (GSE202752). Both RNA-seq datasets are available at GSE202793. The FASTQ files were extracted using bcl2fastq v2.20.0.422, trimmed for adapter sequences using Cutadapt v1.18 and aligned to human genome hg19 Ensembl v82 using STAR software v2.4.0j. FeatureCounts was used to create gene counts from six samples. The DESeq2 package version 1.26.0 (42) in R (version 3.6.3) was used to carry out the differential expression analysis. Statistical testing was performed using the Wald test and those transcripts with Benjamini–Hochberg adjusted P-values <0.05 and absolute log2 fold change >1 were considered to be differentially expressed. The Gene Set Enrichment Analysis (GSEA) of differentially expressed genes was carried out using clusterProfiler v4.2.2 (43).
Immunocytochemistry and confocal imaging
Cells were fixed in a solution of 4% paraformaldehyde in 1x phosphate-buffered saline (PBS, pH 7.4) for 20 min, washed with PBS and incubated for 5 min in a solution of 0.2% Triton X-100 and 5% normal goat serum in 1x PBS. Fixed cells were then incubated in the same solution containing primary antibody at 4°C for 20 h, washed with PBS and incubated for 2 h at 25°C in PBS containing FITC or rhodamine-conjugated secondary antibody. An antibody recognizing MYH/MHC (B-5, Santa Cruz Biotechnology) was used to detect MYH by immunofluorescence; staining with DAPI was used to identify nuclei.
For fusion assays, cells were labeled by constitutive expression of enhanced green fluorescent protein (EGFP) or red fluorescent protein mCherry using lentivirus infection. After further transfection with Ctrl miR or miR-7 mimic, the cells were fixed and counterstained with DAPI. The images were acquired by epifluorescence and/or confocal microscopy. For confocal images, all the images were acquired using an Olympus Multiphoton Laser Scanning Microscope with a 60× (NA, 1.42) objective. All images were acquired using identical confocal system parameters in triple scanning mode for simultaneous detection of EGFP (488 nm excitation, 510 nm emission), mCherry (545 nm excitation, 590 nm emission) and DAPI (405 nm excitation, 460 nm emission).
Cloning and luciferase assay
Briefly, the 3′ untranslated region (UTR) of MYMX mRNA was amplified using specific primers (acgtctcgagggccacaagtcctggcagcag and acgtgcggccgctgaaagaattcaaatcaaata) and the resulting product (3′WT) was inserted into the psiCHECK2 plasmid downstream of the Renilla open reading frame. Oligomers gaggcaagatttgaatccagactAATccTGCgactcaggacctaccttaaaata and tattttaaggtaggtcctgagtcGCAggATTagtctggattcaaatcttgcctc were used to create the mutant MYMX 3′UTR (3′mut). For reporter assays, psiCHECK2-MYMX(3′WT) and psiCHECK2-MYMX(3′mut) were transfected using Lipofectamine 2000 or 3000 (Thermo Fisher Scientific); 24 h later, cells were induced to differentiate, and lysed 16 h later. Activities from reporter Renilla luciferase (RL) and firefly luciferase (FL) were analyzed using a dual-luciferase assay kit (Promega) following the manufacturer’s protocol. The levels of RL mRNA and FL mRNA were measured by RT-qPCR analysis.
Target site blockers
Custom-designed TSBs with phosphorothioate backbone modifications from Exiqon (miRCURY LNA microRNA Target Site Blockers, from Qiagen) were used to selectively impede the interaction between OIP5-AS1 and miR-7 (OIP5-AS1:miR-7 TSB) and between OIP5-AS1 and MEF2C mRNA (OIP5-AS1:MEF2C TSB); Ctrl TSB was included in control reactions. TSB sequences were designed with a large arm that covers the complementary binding sites between OIP5-AS1 and miR-7, and a short arm outside the binding sites to ensure target specificity; the sequences are proprietary from Qiagen. AB678 cells were transfected with 50 nM TSB to block the interaction between OIP5-AS1 and miR-7 or with scrambled controls; 24 h later, the cells were induced to differentiate by culture to high density and replacement of the growth medium with differentiation medium (DMEM supplemented with 2% horse serum).
Cross-linking RIP assay
For immunoprecipitation of cross-linked endogenous ribonucleoprotein (RNP) complexes (CL-RIP analysis), human myoblasts were fixed in 0.1% formaldehyde for 10 min at room temperature and quenched using 0.125 M glycine for 10 min at room temperature, washed with cold PBS and incubated in lysis buffer [50 mM Tris, 150 mM KCl, 0.1% SDS, 1% Triton X-100, 5 mM EDTA, 0.5% sodium deoxycholate, and 0.5 mM DTT, containing protease inhibitors (Roche) and RNase inhibitor (Thermo Fisher)] and sonicated for 15 min. After centrifugation for 15 min at 13 000 rpm at 4°C, the supernatant was precleared with Protein G Sepharose beads (GE Healthcare) for 30 min at 4°C. The precleared lysates were then incubated with antibodies that recognized HuR or control IgG (Santa Cruz Biotechnology) for 4 h at 4°C, and further incubated with protein G for 2 h at 4°C. RNP complexes on the beads were further washed with lysis buffer and incubated with 100 mM NaCl, 10 mM Tris–HCl, 1 mM EDTA, 0.5% SDS and 0.5 mg/ml Proteinase K (15 min at 55°C) to remove proteins. The RNA was isolated using the Direct-zol™ RNA MiniPrep Kit (Zymo Research), which includes a digestion step using DNase I, and further studied by RT-qPCR analysis.
Polysome analysis
Polysome analysis was performed as previously described (44). Briefly, cells were treated with cycloheximide (Sigma; 100 μg/ml) for 10 min and lysed in polysome extraction buffer [PEB; 20 mM Tris–HCl (pH 7.5), 100 mM NaCl, 5 mM MgCl2 and 0.5% NP-40]. After the lysate was separated through 10–50% sucrose gradients, 12 fractions were collected for further analysis. The distribution of mRNAs was quantified by RT-qPCR analysis and plotted as a percentage of the specific mRNA in each fraction relative to the total amount of that mRNA in the gradient.
Pulldown of endogenous OIP5-AS1 by biotinylated antisense oligomers
Pulldown assays using antisense oligomers (ASOs) were performed as previously described (20). Briefly, human myoblast lysates were prepared using PEB containing protease inhibitors (Roche) and RNase inhibitor (Thermo Fisher). The lysates were incubated with 100 pmol of biotin-labeled DNA oligomers complementary to OIP5-AS1 for 2 h at 4°C. Biotinylated ASOs are listed in Supplementary Table S2. RNA complexes were washed with NT2 buffer [50 mM Tris–HCl (pH 7.5), 150 mM NaCl, 1 mM MgCl2 and 0.05% NP-40] and isolated with Dynabeads MyOne Streptavidin C1 beads (Thermo Fisher).
Statistical analysis
The results are represented as the means ± standard error of the mean (SEM). Statistical comparisons of the results were evaluated using Student’s t-test. A P-value of <0.05 was considered statistically significant and indicated in the figures as *P < 0.05, **P < 0.01 and ***P < 0.001.
RESULTS
OIP5-AS1 enhances miR-7 loss during myogenesis
With increasing evidence that lncRNA expression and function are specific to particular tissues, developmental processes and species, we investigated human myogenesis by employing human AB678 myoblasts (20,36), instead of the traditional myogenesis model that employs mouse C2C12 myoblasts. Briefly, AB678 cells were cultured to confluence in growth medium, and subsequently switched to media with 2% horse serum to induce myogenic differentiation; as myoblasts fused, multinucleated myotubes began to appear by day 2, and increased in size and number by days 3 and 4, as determined by monitoring the myotube marker myosin heavy chain (MYH) using fluorescence microscopy (Figure 1A). Western blot analysis confirmed the time-dependent expression of early (MYOG) and late (MYH) myogenic markers (Figure 1B).
Figure 1.

OIP5-AS1 binds and directs miR-7 degradation during myogenesis. (A) Fluorescent micrographs of MYH signals (red) to monitor the progression of human AB678 myoblasts from an undifferentiated state (day 0), when MYH is undetectable, to a state of full differentiation into myotubes (day 4), when MYH fluorescence is robust. Staining with DAPI (blue) was used to identify nuclei. (B) At the times indicated in differentiating AB678 cultures, the levels of myogenic proteins were assessed by western blot analysis. Bands were quantified by densitometry and the relative intensities are shown. (C) Complementarity between OIP5-AS1 and miR-7. At the times indicated in differentiating AB678 cultures, the relative levels of OIP5-AS1 (D), miR-7 (miR-7-5p) (E), miR-7-3p (F) and precursor (pre)-miR-7 (G) were quantified by RT-qPCR analysis. (H) Biotinylated Ctrl and miR-7 were transfected into AB678 cells; 24 h after adding differentiation medium, RNA complexes were pulled down using streptavidin beads (see the ‘Materials and Methods’ section) and the presence of OIP5-AS1 in the pulldown material was assessed by RT-qPCR analysis and normalized to the levels of GAPDH mRNA. (I) AB678 myoblasts were transfected with either Ctrl miR or miR-7 mimic; 24 h later, they were placed in differentiation medium for an additional 24 h, whereupon the levels of OIP5-AS1 were measured by RT-qPCR analysis. (J) AB678 myoblasts were transfected with Ctrl siRNA or OIP5-AS1-directed siRNA; 24 h later, they were placed in differentiation medium and were collected at the times shown after the induction of differentiation. The levels of miR-7 (left), miR-7-3p (middle) and pre-miR-7 (right) were all measured by RT-qPCR analysis. (K) AB678 myoblasts were transfected with Ctrl siRNA or ZSWIM8-directed siRNA; 24 h later, they were placed in differentiation medium and were collected 24 h after inducing differentiation. The levels of miR-7 (left), miR-7-3p (middle) and pre-miR-7 (right) were measured by RT-qPCR analysis. Data in panels (B) and (D)–(K) display the means ± SEM from three or more biological replicates. Significance was established using Student’s t-test. *P < 0.05; **P < 0.01; ***P < 0.001. Other data are representative of three or more biological replicates.
We recently reported that the abundant and relatively conserved lncRNA OIP5-AS1 was capable of promoting human myogenesis (20). Interestingly, mouse Oip5-as1 and human OIP5-AS1 share substantial sequence conservation, including the region where Oip5-as1 binds miR-7 (21,22). As shown (Figure 1C), miR-7 and OIP5-AS1 shared sequence complementarity at both the 5′ and 3′ ends of the seed region, with only two internal nucleotides not pairing. This extensive sequence pairing is characteristic of TDMD (26), a process whereby the miRNA is degraded; this outcome is in sharp contrast to the better established target RNA decay induced by miRNA binding. Several instances of TDMD have been reported (26–28), but they are not directly implicated in developmental processes. Given that OIP5-AS1 promotes human myogenesis (20) and considering the links of miR-7 to muscle aging and disease (23–25), we studied whether OIP5-AS1 and miR-7 were functionally associated as regulators of human myogenesis.
We first examined the relative expression patterns of OIP5-AS1 and miR-7 during human myogenesis by collecting total RNA at the times shown after inducing differentiation and performing RT followed by qPCR analysis of the levels of miR-7-5p and OIP5-AS1. Interestingly, OIP5-AS1 was upregulated early during myogenesis, and further increased at late stages of differentiation (Figure 1D), while miR-7 displayed the opposite expression profile, decreasing early and further declining later in myogenesis (Figure 1E). In addition, we carefully assessed OIP5-AS1 copy numbers per cell in proliferating myoblasts and in nucleus-equivalent in differentiated cultures by using three methods: by comparison to a standard curve prepared using a pool of external DNAs, by comparison with an endogenous transcript of known copy number and by droplet digital PCR analysis (see the ‘Materials and Methods’ section). Using all three methods, the number of OIP5-AS1 molecules per cell increased from ∼25–40 copies per myoblast to ∼79–126 copies per nucleus-equivalent in myotubes, with slight variation depending on the quantification method used (Supplementary Figure S1A; see the ‘Materials and Methods’ section), while the number of miR-7 copies, assessed using the standard curve method and the relative Ct method, declined from ∼70–84 copies per myoblast to ∼14–17 copies per nucleus-equivalent in myotubes (Figure 1E and Supplementary Figure S1A).
To begin to examine whether the loss of miR-7 (miR-7-5p) might be due to TDMD, we assessed the expression patterns of miR-7-3p (the passenger strand) and pre-miR-7 during human myogenesis. The findings that neither RNA changed significantly during myogenesis suggested that the decrease in miR-7 during myogenesis was not caused by reduced miRNA synthesis or maturation, and instead supported TDMD as the mechanism responsible for the myogenesis-related loss of miR-7 (Figure 1F and G). Further evidence supporting the physical interaction between miR-7 and OIP5-AS1 in human myoblasts was gained by transfecting a biotinylated miR-7 into human myoblasts and inducing differentiation for 12 h, whereupon biotinylated miR-7 was pulled down using streptavidin beads, and RNA was isolated from the beads and OIP5-AS1 was measured by RT-qPCR analysis. Biotinylated miR-7 was capable of pulling down ∼8-fold more OIP5-AS1 than a biotinylated control miRNA (Figure 1H), supporting the notion that miR-7 interacts with OIP5-AS1 during myogenesis. Moreover, unlike the typical degradation of a target RNA following binding of an miRNA, overexpressing miR-7 by transfecting an miRNA mimic did not affect OIP5-AS1 levels (Figure 1I).
Additional support for TDMD of miR-7 by OIP5-AS1 was obtained by silencing OIP5-AS1, an intervention that prevented the reduction of miR-7 during myogenesis, in the absence of changes in miR-7-3p or pre-miR-7 expression levels (Figure 1J). Two recent screens identified the E3 ubiquitin ligase ZSWIM8 as a key mediator of TDMD (45,46), as it proteolysis of argonaute (AGO), in turn exposing the miRNA for degradation. We thus examined whether silencing ZSWIM8 disrupted the OIP5-AS1-directed TDMD and prevented miR-7 degradation. As shown in Figure 1K, transfection of two different siRNAs that robustly silenced ZSWIM8 mRNA (Supplementary Figure S1B) led to increased miR-7 levels in both proliferating and differentiated myoblasts, while it did not change the levels of miR-7-3p or pre-miR-7. Taken together, these findings suggest that during myogenesis, the rise in OIP5-AS1 specifically contributed to the loss of miR-7 via TDMD.
miR-7 attenuates myogenesis in human myoblasts
To investigate mechanistically the coordinated actions of miR-7 and OIP5-AS1 in myogenesis, we first studied the effects of silencing OIP5-AS1. As shown in Figure 2A and B, Supplementary Figure S1C and reported earlier (20), silencing OIP5-AS1 in AB678 myoblasts largely reduced the formation of myotubes and the expression of myogenic markers, particularly the late differentiation marker MYH. In a similar manner, overexpressing miR-7 attenuated human myoblast differentiation and reduced myotube formation by 72 h of myogenesis, even at concentrations as low as 1 nM (Supplementary Figure S1D); conversely, antagonizing miR-7 dramatically promoted the formation of myotubes by 72 h into myogenesis (Figure 2C and Supplementary Figure S1E). Quantification of the myotubes formed revealed that overexpressing miR-7 reduced the fusion index from ∼40% to ∼20% after 72 h of differentiation, and that the average number of nuclei per myotube declined from 12 to 2.5. On the other hand, antagonizing miR-7 elevated the average number of nuclei per myotube from 12 to 30 and also increased the fusion index from ∼40% to ∼80% (Figure 2C). The expression levels of myogenic markers confirmed this trend: overexpressing miR-7 decreased the expression levels of myogenic markers MEF2C and MYH at 48 and 72 h of differentiation, while antagonizing miR-7 increased MYOG and MEF2C levels by 24 h and accelerated MYH production (Figure 2D). Similar patterns were observed when measuring a different myogenic differentiation marker, CK activity: by 48 h of differentiation, overexpressing miR-7 significantly reduced CK activity compared with control groups, while antagonizing miR-7 elevated CK activity (Figure 2E).
Figure 2.

Silencing OIP5-AS1 attenuates myogenesis and inhibiting miR-7 promotes myogenesis. (A) AB678 myoblasts were transfected with Ctrl siRNA or OIP5-AS1-directed siRNA; 24 h later, they were placed in differentiation medium for 72 h, whereupon differentiation was monitored by assessing MYH levels (green) by immunofluorescence (left), and the fusion index and number of nuclei per myotube were quantified (right) after assessing five separate fields per experiment. (B) AB678 myoblasts were transfected with Ctrl siRNA or OIP5-AS1-directed siRNA; they were then placed in differentiation medium, and collected at the times shown after the induction of differentiation. The levels of MYOG, MYH and loading control HSP90 were assessed by western blot analysis. (C) AB678 myoblasts were transfected with Ctrl miR, miR-7 mimic or miR-7 antagomiR; they were then placed in differentiation medium for 72 h, and differentiation was monitored by assessing MYH levels (red) by immunofluorescence (left), and the fusion index and number of nuclei per myotube were quantified (right) after assessing five separate fields per experiment. (D) AB678 myoblasts were transfected with Ctrl miR, miR-7 mimic or miR-7 antagomiR; as described in panel (B), the levels of MYOG, MYH, MEF2C and loading control HSP90 were assessed by western blot analysis. (E) Cells were processed as described in panel (C), and the levels of CK activity were measured enzymatically (see the ‘Materials and Methods’ section). Data in all panels represent the means ± SEM from three or more biological replicates. Significance was established using Student’s t-test. *P < 0.05; **P < 0.01; ***P < 0.001. In panels (B) and (D), bands were quantified by densitometry and the relative intensities are indicated.
To further study whether the promotion of human skeletal myogenic differentiation by OIP5-AS1 was linked to the reduction of miR-7 by OIP5-AS1-triggered TDMD, we designed a rescue experiment. We silenced OIP5-AS1, which increased miR-7 levels and reduced myogenesis and MYH levels (Figures 1 and 2), while at the same we antagonized miR-7. As shown in Figure 3A, miR-7 antagomiR partially restored myogenesis relative to Ctrl antagomiR as measured by the increased levels of MYH by 48 h of differentiation, and it almost fully rescued MYH production by 72 h. Similar effects were observed by monitoring myotube formation and CK activity (Figure 3B–D). Quantification of myotubes revealed that antagonizing miR-7 partially restored the myogenesis that was impaired by silencing OIP5-AS1, with the fusion index increasing from ∼20% to ∼80% after 72 h of differentiation, and the average number of nuclei per myotube rising from 3.5 to 8.6 (Figure 3C). Collectively, these results support the notion that OIP5-AS1 reduces miR-7 levels by TDMD, in turn enhancing myogenesis.
Figure 3.

Antagonization of miR-7 rescues the anti-myogenic effect of silencing OIP5-AS1. (A) AB678 myoblasts were transfected with Ctrl siRNA or OIP5-AS1-directed siRNA together with Ctrl antagomiR or miR-7 antagomiR; they were then placed in differentiation medium, and collected at the times shown after the induction of differentiation. Differentiation was monitored by assessing MYH levels and loading control HSP90 by using western blot analysis. Bands were quantified by densitometry and the relative intensities are indicated. As described in panel (A), after differentiating for 72 h, myogenic progression was monitored by immunofluorescence assessment of MYH levels (B), by quantifying numbers of nuclei per myotube and fusion indices (five separate fields per experiment) (C), and by measuring the levels of CK activity (D). Data in panels (A), (C) and (D) are the means ± SEM from three or more biological replicates. Significance was established using Student’s t-test. *P < 0.05; **P < 0.01; ***P < 0.001. In panel (A), bands were quantified by densitometry and the relative intensities are indicated.
Expression of the fusogenic protein MYMX increases with myogenesis and is suppressed by miR-7
To gain insight into the mechanism whereby miR-7 attenuates human myogenesis, we performed RNA-seq analysis (GSE202793) to identify differentially abundant RNAs in differentiated relative to undifferentiated AB678 cultures, and compared them to predicted miR-7 target mRNAs. Only one transcript, MYMX mRNA, was shared by these two groups (Figure 4A and Supplementary Figure S2A). We previously reported that MEF2C mRNA is regulated by OIP5-AS1 during myogenesis (20), and the MEF2C 5′UTR has a putative miR-7 binding site, so we examined whether MYMX and MEF2C mRNAs are miR-7 targets. Human myoblasts were transfected with biotinylated miR-7 and induced to differentiate; however, only MYMX mRNA was pulled down by biotinylated miR-7 (Figure 4B).
Figure 4.
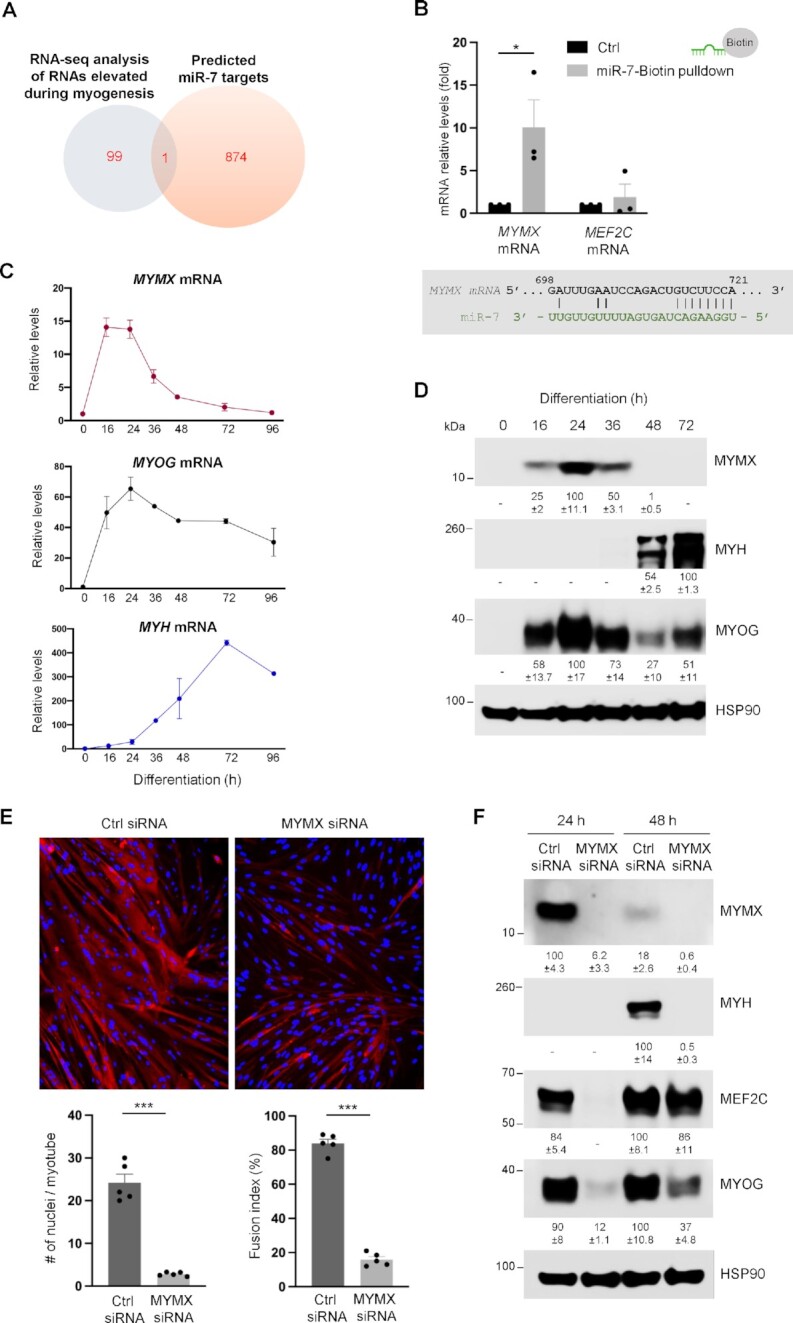
MYMX is a novel target of miR-7. (A) Venn diagram of RBPs from the top 100 upregulated RNAs in myogenesis by RNA-seq analysis (see the ‘Materials and Methods’ section) (gray), and the 875 predicted mRNA targets of miR-7 (orange); one mRNA was found in the intersection, MYMX mRNA. (B) AB678 myoblasts were transfected with biotinylated Ctrl miR or biotinylated miR-7; 6 h later, they were placed in differentiation medium for 12 h, harvested and RNA complexes were pulled down using streptavidin beads (see the ‘Materials and Methods’ section). The presence of potential miR-7 target mRNAs in the pulldown material was assessed by RT-qPCR analysis. The levels of RNAs tested in the pulldown were normalized to the levels of GAPDH mRNA. At the times indicated in differentiating AB678 cultures, the relative levels of MYMX mRNA and myogenic mRNAs were detected by RT-qPCR analysis (C), and the levels of MYMX and myogenic proteins were assessed by western blot analysis (D). (E) AB678 myoblasts were transfected with Ctrl siRNA or MYMX-directed siRNA; 24 h later, they were placed in differentiation medium for 72 h, and differentiation was monitored by assessing MYH levels by immunofluorescence (top), and the numbers of nuclei per myotube and fusion indices were quantified after assessing five separate fields per experiment (bottom). (F) As described in panel (E), the levels of MYMX and myogenic proteins were assessed by western blot analysis. Data in panels (B) and (D)–(F) represent the means ± SEM from three or more independent experiments. Significance was established using Student’s t-test. *P < 0.05; **P < 0.01; ***P < 0.001. Other data are representative of three or more biological replicates. In panels (D) and (F), bands were quantified by densitometry and the relative intensities are indicated.
An essential step in myogenesis is the formation of myotubes, whereby mononuclear myocytes fuse to form multinucleated myotubes. MYMX is a micropeptide that promotes myocyte fusion to form myotubes during muscle regeneration in mice (33,34,47–51). We thus examined the expression pattern and functional role of MYMX in human myogenesis. Similar to the early differentiation marker MYOG mRNA, MYMX mRNA was highly expressed early in myogenesis (by 16–24 h of differentiation), but unlike MYOG mRNA, MYMX mRNA declined markedly by 36 h of myogenic differentiation, and the expression pattern of MYMX protein showed a trend similar to that of MYMX mRNA (Figure 4C and D). This narrow time of expression supports the notion that MYMX production is tightly regulated during myogenesis, and it was reflected in copy number estimations (assessed by standard curve and relative Ct methods), ranging from 8 copies per proliferating myoblast to ∼111–137 copies per cell at peak times of expression, ∼24 h into the differentiation program (Supplementary Figure S2B). In addition, similar to what was reported in mouse (33), silencing MYMX strongly reduced myotube formation in human myoblasts, but did not affect cell viability or proliferation (Figure 4E, top, and Supplementary Figure S2C–E); quantification of myotubes revealed that by 72 h of differentiation, silencing MYMX reduced the fusion index from ∼80% to ∼15% and lowered the average number of nuclei per myotube from ∼25 to ∼3 (Figure 4E, bottom). Furthermore, silencing MYMX reduced the expression levels of myogenic markers (Figure 4F).
The production of fusogenic protein MYMX is repressed by miR-7
MYMX is a newly discovered protein and thus its regulation is largely unexplored, although MYOD and MYOG were reported to activate Mymx transcription (33). The findings that miR-7 was able to bind to MYMX mRNA and the presence of a predicted binding site in the 3′UTR of the MYMX mRNA (Figure 4A) strongly suggested that miR-7 might regulate MYMX mRNA post-transcriptionally. We examined this hypothesis by transfecting the miR-7 mimic at the start of differentiation; as shown (Figure 5A), ectopic overexpression of miR-7 reduced MYMX mRNA to ∼40–50% of the levels in control cells (Ctrl miR) at every time point. Similarly, overexpressing miR-7 strongly lowered the expression levels of MYMX, while antagonizing miR-7 moderately increased MYMX expression levels at early time points in differentiation (Figure 5B). These results suggest that miR-7 is able to bind MYMX mRNA and reduces MYMX abundance.
Figure 5.

miR-7 post-transcriptionally suppresses the stability and translation of MYMX mRNA. (A) AB678 myoblasts were transfected with Ctrl miR or miR-7 mimic; 24 h later, they were placed in differentiation medium, and collected at the times shown after the induction of differentiation. The levels of MYMX mRNA were measured by RT-qPCR analysis. (B) AB678 myoblasts were transfected with Ctrl miR, miR-7 mimic as described in panel (A) or miR-7 antagomiR, and MYMX protein levels were assessed by western blot analysis. (C) Schematic of the psiCHECK2 dual-luciferase system, which contains RL coding region fused to the WT MYMX 3′UTR [psiCHECK2-MYMX(3′WT)] or the MYMX 3′UTR bearing a mutation in the miR-7 binding site [psiCHECK2-MYMX(3′mut)]. FL activity, expressed from the same vector, was measured as an internal control. (D, E) Twelve hours after co-transfecting myoblasts with the parent reporter (psiCHECK2) or test reporter psiCHECK2-MYMX(3′WT) with either Ctrl miR or miR-7 into AB678 myoblasts and inducing differentiation, RL/FL activity was calculated. Twenty-four hours after co-transfecting the plasmids psiCHECK2-MYMX(3′WT) and psiCHECK2-MYMX(3′mut), AB678 myoblasts were induced to differentiate for 24 h, and the relative RL/FL ratios were determined. (F) Twenty-four hours after co-transfecting psiCHECK2 or test reporter psiCHECK2-MYMX(3′WT) and control or OIP5-AS1-directed siRNA, AB678 myoblasts were induced to differentiate for 24 h, and the relative RL/FL ratios were determined. (G) Twenty-four hours after transfecting Ctrl miR-7 or miR-7 mimic, AB678 myoblasts were placed in differentiation medium for an additional 24 h; cells were then treated with actinomycin D, and the relative levels of MYMX mRNA (left) and a control stable transcript, GAPDH mRNA (right), were assessed by RT-qPCR analysis and normalized to 18S rRNA levels, also quantified by RT-qPCR analysis. mRNA half-lives (t1/2) were calculated as the times required to reach 50% of the initial abundance of the mRNA at time 0 before adding actinomycin D. (H) Twenty-four hours after transfecting Ctrl miR or miR-7 mimic, AB678 myoblasts were placed in differentiation medium for an additional 24 h, and then harvested. Cytoplasmic extracts were fractionated by centrifugation through sucrose density gradients, RNA was isolated from equal volumes of each fraction and the abundance of MYMX and ACTB mRNAs was quantified by RT-qPCR analysis and represented as a percentage of the total mRNA on the gradient. AB678 myoblasts were co-transfected with Ctrl miR or miR-7 mimic and with either a control empty vector (EV) plasmid or a plasmid expressing myc-tagged MYMX; 24 h later, AB678 myoblasts were induced to differentiate and 48 h after that the levels of MYMX, MYMX-myc, and HSP90 were determined by western blot analysis (I), differentiation was monitored by assessing MYH immunofluorescence (J) and the fusion index and the number of nuclei per myotube were quantified; five fields were assessed per experiment (K). Data in panels (A), (B), (D)–(G), (I) and (K) represent the means ± SEM from at least three independent experiments. Significance was established using Student’s t-test. *P < 0.05; **P < 0.01; ***P < 0.001. Other data are representative of three or more biological replicates.
To test whether miR-7 reduced MYMX levels by eliciting repression through the 3′UTR of MYMX mRNA, luciferase constructs derived from psiCHECK2 were prepared in which the RL coding region was linked to the wild-type (WT) MYMX 3′UTR or a mutant (mut) MYMX 3′UTR in which the miR-7 site was ablated (Figure 5C). psiCHECK2 also encodes the FL protein, which serves to normalize the luciferase results and control for transfection efficiency (Figure 5C). Twelve hours after co-transfecting AB678 myoblasts with the parent reporter (psiCHECK2) or test reporter psiCHECK2-MYMX(3′WT) with either Ctrl miR or miR-7 and inducing differentiation, miR-7 was found to significantly lower luciferase activity (RL/FL) from psiCHECK2-MYMX(3′WT), bearing the miR-7 site, but not from the control vector, psiCHECK2 (Figure 5D). Ablation of the miR-7 site (‘3′mut’) elevated basal luciferase activity from psiCHECK2-MYMX(3′mut) relative to psiCHECK2-MYMX(3′WT) (Figure 5E and Supplementary Figure S3A). Notably, silencing OIP5-AS1 also lowered luciferase activity (RL/FL) of MYMX 3′UTR (Figure 5F and Supplementary Figure S3B), while it did not affect RL/FL activity from the parent reporter (psiCHECK2). These findings support a role for miR-7 in lowering MYMX abundance through the MYMX 3′UTR, and further implicate OIP5-AS1 in promoting MYMX production by reducing miR-7 levels.
To further investigate how miR-7 reduces MYMX expression through the MYMX 3′UTR, we first tested whether miR-7 regulates MYMX mRNA stability. The half-life of MYMX mRNA was determined by blocking de novo transcription using the inhibitor of RNA polymerase II actinomycin D, and measuring the time required for MYMX mRNA to reach one-half the abundance measured at time 0 (t1/2). MYMX mRNA levels declined markedly faster in AB678 cells in which miR-7 was ectopically overexpressed (t1/2 ∼ 2 h) than in control cells (t1/2 > 3 h) (Figure 5G). In control experiments, a stable transcript, GAPDH mRNA (encoding the housekeeping protein GAPDH), showed comparable stability whether miR-7 was overexpressed or not (Figure 5G). As miRNAs may also reduce translation, 8 h into the differentiation program we monitored the distribution of MYMX mRNA in polysome gradients prepared from control and miR-7 overexpressing AB678 cells. As shown (Supplementary Figure S3C), global polysome profiles were similar between miR-7 overexpressing and control cells. However, the distribution of MYMX mRNA along the gradient, as determined by RT-qPCR analysis, shifted leftward when miR-7 was overexpressed, from high molecular weight polysomes to low molecular weight polysomes, specifically from fractions 6–9 to fractions 5–8 (blue shaded region), with an increase in non-polysome-associated fraction 2 (orange shaded region) (Figure 5H). This pattern of MYMX mRNA distribution is consistent with a role for miR-7 in repressing the formation of larger polysomes on MYMX mRNA and reducing MYMX translation (Figure 5H, left). ACTB mRNA (encoding the protein β-Actin/ACTB), included as a control, displayed comparable patterns in the Ctrl miRNA and the miR-7 groups (Figure 5H, right). Further analysis of reporter RL mRNA and FL mRNA showed that the presence of miR-7 on reporter RL mRNA moderately reduced RL mRNA levels expressed from the WT reporter (Supplementary Figure S3D–F), although the relative effects on RL protein activity (Figure 5D–F) were more pronounced than the effects on RL mRNA levels. Thus, the reporter analysis supported a dual role for miR-7 in reducing MYMX mRNA stability and translation. In sum, these findings indicate that miR-7 lowers MYMX expression during myogenesis by destabilizing and reducing the translation of MYMX mRNA.
To further study whether the miR-7-elicited reduction of myogenesis was mediated by the decreased production of MYMX, we performed another rescue experiment. A construct was prepared to express myc-tagged MYMX from a vector that only contained the coding sequence of MYMX mRNA and therefore lacked miR-7 binding sites. After transfecting AB678 myoblasts, exogenous MYMX-myc and endogenous MYMX proteins were detected by western blot analysis (Figure 5I). As shown, overexpressing miR-7 reduced the levels of endogenous MYMX but not MYMX-myc (Figure 5I); importantly, however, overexpression of MYMX-myc partially restored myogenesis as determined by the rise in myotubes (Figure 5J) and by measuring both the fusion index and the average number of nuclei per myotube (Figure 5K). Together, these results indicate that miR-7 post-transcriptionally reduces MYMX expression by destabilizing MYMX mRNA and by inhibiting MYMX translation, in turn suppressing myogenesis.
OIP5-AS1 lowers miR-7 levels by TDMD, in turn enhancing MYMX levels and myogenesis
Given the robust influences of OIP5-AS1 on miR-7 levels and miR-7 expression on MYMX production (Figures 4 and 5), we further investigated whether miR-7 levels were controlled by OIP5-AS1 through TDMD. To that end, we first established dual-label co-culture experiments using AB678 cells. Through lentiviral delivery of fluorescent proteins, we created two individual AB678 myoblast lines, one expressing EGFP and the other expressing mCherry (AB678-EGFP and AB678-mCherry, respectively; Figure 6A); we monitored myoblast fusion by evaluating the merging of these two fluorescent signals. We overexpressed miR-7 or miR control in AB678-EGFP cells and further co-cultured them with AB678-mCherry cells. Compared to miR control, miR-7 overexpression in AB678-EGFP cells largely reduced syncytial myotube formation (Figure 6B; unmerged fluorescence shown in Supplementary Figure S4A). In addition, silencing OIP5-AS1 in AB678-EGFP reduced the formation of syncytial myotubes, while control AB678-EGFP cells formed mixed-color syncytial myotubes with AB678-mCherry cells (Figure 6C; unmerged in Supplementary Figure S4B); similar results of the syncytial myotubes formed were assessed by measuring heterologous fusion index (Figure 6D and E). These results support the notion that OIP5-AS1 contributes to human myotube formation at least in part by eliciting miR-7 TDMD, and thereby derepressing the production of fusogenic protein MYMX.
Figure 6.

TDMD of miR-7 by OIP5-AS1 affects myoblast fusion. (A) Schematic of fusion assays. AB678 cells were labeled by expression of enhanced green fluorescent protein (EGFP) or red fluorescent protein mCherry following lentivirus infection. Further silencing of OIP5-AS1 or overexpression of miR-7 or corresponding controls was carried out on EGFP-labeled AB678 cells. Equal numbers of EGFP-labeled or mCherry-labeled AB678 cells were then mixed and placed in differentiation medium for 72 h. (B) As described in panel (A), EGFP-labeled AB678 cells were transfected with Ctrl miR (left) or miR-7 mimic (right) and further mixed with mCherry-labeled AB678. The fusion ability was monitored by representative confocal images, homologous fusion (EGFP+ only or mCherry+ only) and heterologous syncytia (both EGFP+ and mCherry+). (C) As described in panel (A), EGFP-labeled AB678 cells were transfected with Ctrl siRNA (left) or OIP5-AS1-directed siRNA (right) and further mixed with mCherry-labeled AB678. The fusion ability was monitored by representative confocal images of homologous fusion (EGFP+ only or mCherry+ only) and heterologous syncytia (both EGFP+ and mCherry+). (D, E) Heterologous fusion indices were quantified for panels (B) and (C) after assessing five separate fields per experiment. Scale bar: 100 μm. Data in panels (D) and (E) represent the means ± SEM from at least three independent experiments. Significance was established using Student’s t-test. ***P < 0.001.
To date, most instances of TDMD-mediated regulation of miRNAs involved artificial RNAs instead of endogenous RNAs (26,52,53), with few exceptions (22,30,54). To study whether OIP5-AS1 might reduce miR-7 by TDMD, we designed a small oligonucleotide TSB that interfered with the endogenous TDMD machinery by binding OIP5-AS1 at the site of interaction with miR-7, effectively preventing miR-7 from binding OIP5-AS1. We hypothesized that if miR-7 is reduced by TDMD, the TSB might prevent the loss of miR-7. As shown in Figure 7A, transfection of the ‘OIP5-AS1:miR-7’ TSB preserved higher miR-7 levels during differentiation, while miR-7 levels declined in the Ctrl TSB group (left); in contrast, neither TSB transfection affected the levels of miR-7-3p (passenger-strand miRNA) or pre-miR-7 during myogenesis, as determined by RT-qPCR analysis (middle, right). In agreement with the TSB design, OIP5-AS1:miR-7 TSB did not affect OIP5-AS1 levels (Figure 7B). These results supported the notion that the TSB was able to block OIP5-AS1-directed miR-7 degradation. Therefore, we next investigated whether the TSB was able to affect human myogenesis by controlling miR-7 degradation. In keeping with the proposed model, AB678 myoblasts treated with the OIP5-AS1:miR-7 TSB displayed reduced myogenesis, as assessed by myotube formation and quantification of fusion indices and number of nuclei per myotube, relative to AB678 myoblasts treated with Ctrl TSB (Figure 7C and D, and Supplementary Figure S5A). Moreover, the abundance of MYMX mRNA as well as MYMX and MYH proteins declined markedly in the presence of OIP5-AS1:miR-7 TSB (Figure 7E and F). To further determine whether the OIP5-AS1:miR-7 TSB preserved the levels and repressive influence of miR-7 upon the MYMX 3′UTR, we studied luciferase activity from the reporter bearing WT MYMX 3′UTR or a mutant MYMX 3′UTR in which the miR-7 site was ablated (from Figure 5C). As shown, luciferase activity from psiCHECK2-MYMX(3′WT) was lower in AB678 cells that received OIP5-AS1:miR-7 TSB than in cells that received Ctrl TSB following 12 h of differentiation, while luciferase activity from psiCHECK2-MYMX(3′mut) was overall higher and was unaffected by OIP5-AS1:miR-7 TSB (Figure 7G).
Figure 7.

TSB of OIP5-AS1:miR-7 attenuates myotube formation by inhibiting OIP5-AS1-directed miR-7 degradation. (A) AB678 myoblasts were transfected with TSB (Ctrl TSB or OIP5-AS1:miR-7 TSB); 24 h after transfection, AB678 myoblasts were induced to differentiate, and were collected at the indicated times. The levels of miR-7 (left), miR-7-3p (middle) and pre-miR-7 (right) were measured by RT-qPCR analysis. (B) In cells prepared as described in panel (A), the levels of OIP5-AS1 were measured by RT-qPCR analysis. (C) AB678 myoblasts were transfected with Ctrl TSB or OIP5-AS1:miR-7 TSB; 24 h later, they were placed in differentiation medium for 72 h, and differentiation was monitored by assessing MYH levels by immunofluorescence, and the fusion indices and numbers of nuclei per myotube (D) were quantified after assessing five separate fields per experiment. (E) In cells prepared as described in panel (A), the levels of MYMX mRNA were measured by RT-qPCR analysis. (F) AB678 myoblasts were transfected with Ctrl TSB or OIP5-AS1:miR-7 TSB; 24 h later, they were placed in differentiation medium, and collected at the times shown after the induction of differentiation. The levels of MYMX, MYH and loading control HSP90 were assessed by western blot analysis. Bands were quantified by densitometry and the relative intensities are indicated. (G) Twenty-four hours after co-transfecting the plasmids bearing wild-type or mutant MYMX 3′UTR with Ctrl TSB or OIP5-AS1:miR-7 TSB, AB678 myoblasts were induced to differentiate for 24 h, whereupon RL/FL ratios were determined. As described in Figure 6, EGFP-labeled AB678 cells were transfected with Ctrl TSB (left) or OIP5-AS1:miR-7 TSB (right) and further mixed with mCherry-labeled AB678. The fusion ability was monitored by representative confocal images (H) showing homologous fusion (EGFP+ or mCherry+) and heterologous syncytia (both EGFP+ and mCherry+), and the heterologous fusion index (I) was quantified after assessing five separate fields per experiment. AB678 myoblasts were transfected with Ctrl TSB or OIP5-AS1:miR-7 TSB along with either Ctrl antagomiR or miR-7 antagomiR; they were then placed in differentiation medium for 72 h, and the progression of differentiation was monitored by assessing MYH levels by immunofluorescence (J), and by measuring fusion indices and numbers of nuclei per myotube (K) in five separate fields per experiment. (L) Expression levels of 37 myogenesis-associated mRNAs that are predicted targets of miR-7, are significantly downregulated after introducing OIP5-AS1:miR-7 TSB (by 0, 24 or 48 h of differentiation) and are upregulated during myogenesis for 24 h (see also Supplementary Figure S6). Significance was established using Padj < 0.05, and log2FC > 1 (Prolif: proliferating; Diff: differentiated). (M) GSEA of differentially expressed genes in OIP5-AS1:miR-7 TSB treated cells. GO annotations based on cellular components; top 10 gene sets were established using normalized enrichment score. (N) AB678 myoblasts were transfected with Ctrl TSB or OIP5-AS1:MEF2C TSB; 24 h later, they were placed in differentiation medium for 24 h, and the binding of HuR to MEF2C mRNA was assessed by cross-linking RIP analysis; data were normalized to the levels of GAPDH mRNA in each IP sample and represented as the enrichment of each mRNA in HuR IP samples relative to the levels of the mRNA in IgG IP samples. AB678 myoblasts were transfected with Ctrl TSB, OIP5-AS1:miR-7 TSB, OIP5-AS1:MEF2C TSB (50 nM each) or with a cocktail of OIP5-AS1:miR-7 TSB (25 nM) plus OIP5-AS1:MEF2C TSB (25 nM); 24 h later, they were placed in differentiation medium for 72 h, and differentiation was monitored by assessing MYH levels by immunofluorescence (O), and by measuring the fusion indices and the numbers of nuclei per myotube (P) in five separate fields per experiment. Data in panels (A), (B), (D)–(G), (I), (K), (N) and (P) represent the means ± SEM from at least three independent experiments. Significance was established using Student’s t-test. **P < 0.01; ***P < 0.001. Other data are representative of three or more biological replicates.
To further study the impact of OIP5-AS1:miR-7 TSB on myocyte fusion, we employed the cell system described in Figure 6; AB678-EGFP cells were transfected with OIP5-AS1:miR-7 TSB and co-cultured with AB678-mCherry cells. In the presence of OIP5-AS1:miR-7 TSB, AB678-EGFP cells severely lost their fusion ability, as determined by monitoring syncytial myotube formation and quantifying heterologous fusion index (Figure 7H and I, and Supplementary Figure S5B). Thus, we propose that TSBs could have an anti-myogenic influence on myotube formation.
Impaired myogenesis by OIP5-AS1:miR-7 TSB is rescued by antagonizing miR-7
We performed additional experiments to investigate in depth whether OIP5-AS1:miR-7 TSB attenuates myogenesis by increasing miR-7 availability. AB678 myoblasts were transfected with Ctrl TSB or OIP5-AS1:miR-7 TSB along with either Ctrl antagomiR or miR-7 antagomiR; they were then induced to differentiate and myotube formation was assessed by monitoring MYH immunofluorescence. As shown in Figure 7J (and quantified in Figure 7K), the suppression of myotube formation elicited by the OIP5-AS1:miR-7 TSB was rescued by transfecting the miR-7 antagomiR, which partly restored myogenesis. These results support the notion that OIP5-AS1:miR-7 TSB reduced myotube formation at least in part by specifically increasing miR-7 levels, and not by indirectly affecting myogenesis.
To comprehensively study how OIP5-AS1:miR-7 TSB influenced myogenic gene expression programs, AB678 cells were transfected with Ctrl TSB or OIP5-AS1:miR-7 TSB, and RNA-seq analysis was performed using proliferating (0 h) and differentiating (24 and 48 h) cultures. We focused our analysis on the 875 mRNAs that were identified as being miR-7 predicted targets (condition 1) after database analysis (miRDB), and further analyzed the expression of these mRNAs during myogenesis (condition 2) and in the presence of OIP5-AS1:miR-7 TSB (condition 3) at 0, 24 or 48 h. At the intersection of these three conditions, we found a total of 37 mRNAs that were predicted to be repressed by miR-7, elevated during myogenesis and reduced by the presence of OIP5-AS1:miR-7 TSB (Figure 7L); importantly, MYMX mRNA was among the top genes that adhered to these criteria (Figure 7L and Supplementary Figure S6). GSEA of differentially expressed genes revealed that the top gene clusters showing decline were related to muscle regeneration and myogenesis, affecting the ATP synthase complex, the mitochondrial respiratory chain, the muscle myosin complex and the sarcoplasmic reticulum membrane (Figure 7M). These findings strengthen the notion that OIP5-AS1:miR-7 TSB restored the miR-7 expression and reduced the levels of myogenesis-associated miR-7 predicted targets; among them, MYMX mRNA, encoding a fusogenic protein, was a top miR-7-regulated transcript, as found earlier (Figure 4).
We previously reported that lncRNA OIP5-AS1 can regulate MEF2C expression levels by forming a partial hybrid with MEF2C mRNA (20). As it did not appear that miR-7 binds MEF2C mRNA (Figure 5B), we investigated whether OIP5-AS1 might regulate myogenesis via two independent mechanisms working in parallel. To experimentally test whether OIP5-AS1 affects miR-7 levels (and consequently MYMX mRNA) on one hand and MEF2C levels (by recruitment of HuR) on the other hand, we designed an additional TSB (OIP5-AS1:MEF2C TSB), which can specifically interfere with the interaction between MEF2C mRNA and OIP5-AS1 at the segment where the two RNAs bind (20). Compared with transfection of control TSB, transfection of OIP5-AS1:MEF2C TSB in human myoblasts significantly reduced the binding of OIP5-AS1 to MEF2C mRNA, as determined by OIP5-AS1-directed ASO pulldown followed by RT-qPCR analysis (Supplementary Figure S7A). In agreement with this finding, transfection of OIP5-AS1:MEF2C TSB also prevented the binding of HuR to the MEF2C mRNA (Figure 7N), in turn reducing MEF2C mRNA levels (Supplementary Figure S7B). These results supported the notion that the OIP5-AS1:MEF2C TSB was able to block OIP5-AS1-mediated stabilization of MEF2C mRNA. We further compared the effect of transfecting individually OIP5-AS1:miR-7 TSB or OIP5-AS1:MEF2C TSB or transfected them together. Individual transfections of OIP5-AS1:miR-7 TSB (50 nM) and OIP5-AS1:MEF2C TSB (50 nM) attenuated myogenesis, but co-transfection of both OIP5-AS1:miR-7 and OIP5-AS1:MEF2C TSB (at 25 nM each) had a much more robust effect reducing myogenesis than either TSB alone, as determined by measuring MYH expression and monitoring myotube formation (Figure 7O and P, and Supplementary Figure S7C). These results strongly support the notion that OIP5-AS1 has dual roles in myogenic gene expression program, one as a scaffold lncRNA by binding to long MEF2C mRNA to recruit stabilizing RBP HuR, as reported previously (20), and another as a platform to bind miR-7 and trigger TDMD, in turn promoting myogenesis.
Together, our findings support a model whereby a rise in lncRNA OIP5-AS1 levels during myogenesis reduced miR-7 via TDMD, in turn enhancing stability and translation of MYMX mRNA, increasing the levels of fusogenic protein MYMX and promoting myotube formation (Figure 8).
Figure 8.
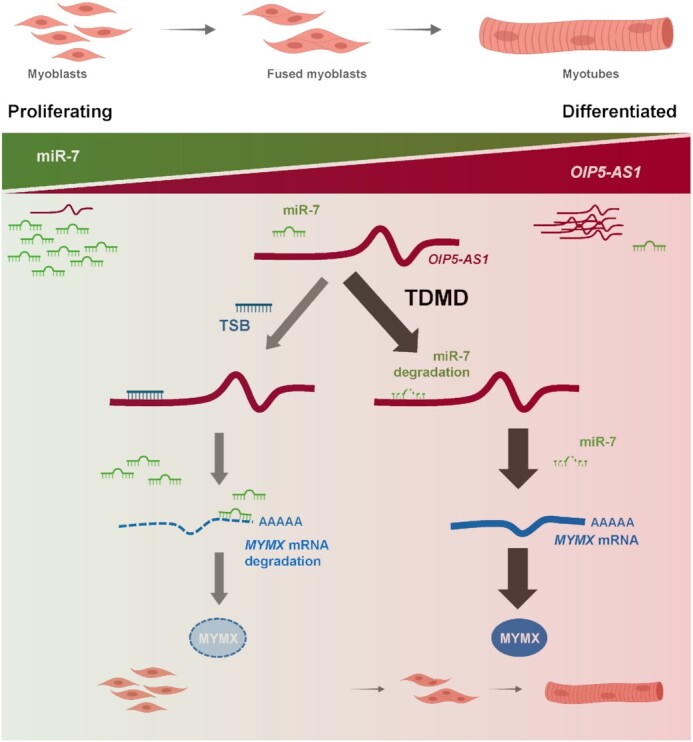
Model. In proliferating (undifferentiated) myoblasts, lncRNA OIP5-AS1 levels are low, while miRNA miR-7 levels are high. As myogenic differentiation progresses, OIP5-AS1 levels rise, and through its extensively complementarity with miR-7, it induces miR-7 degradation via TDMD (right arm). The low levels of miR-7 in differentiated myoblasts then permit the rise in expression of the miR-7 target MYMX mRNA, which encodes the fusogenic protein MYMX and further promotes myotube fusion. Use of a TSB that masks the site of miR-7 binding on OIP5-AS1 (left arm) prevents miR-7 decay, in turn keeping MYMX mRNA unstable and repressing myogenesis. In sum, through a TDMD mechanism, OIP5-AS1 promotes fusogenic protein MYMX expression and enhances myotube formation.
DISCUSSION
Muscle development and regeneration are complex and tightly orchestrated processes that involve profound changes in gene expression programs. An essential step in myogenesis, myotube formation requires the fusion of myoblasts to form a multinucleated myofiber, the functional unit of skeletal muscle. Although many molecular factors controlling myogenesis have been described, little is known about the gene expression programs specifically driving myoblast fusion. Here, we present evidence that OIP5-AS1, a lncRNA abundant in muscle, is elevated early during myogenesis and its association with miR-7 leads to TDMD-dependent reduction of miR-7 levels during myogenesis. The ensuing loss of miR-7 derepresses MYMX production and promotes myogenesis. The effects of miR-7 were linked to its interaction with the MYMX mRNA, which encodes a small protein, MYMX, that promotes myoblast fusion. A key piece of evidence in this regulatory paradigm was obtained by using a TSB directed at the miR-7 interacting site in OIP5-AS1, which repressed TDMD, permitted miR-7 to increase, reduced MYMX production and attenuated myotube fusion.
TDMD implicated in modulating myogenesis
Most miRNAs are believed to be relatively stable, but TDMD was recently identified as a novel mechanism for select miRNA degradation. Several miRNAs have been proposed to be regulated by TDMD, but few have implicated TDMD in specific biological processes. Most reported studies on TDMD were conducted in the brain, as shown for the degradation of miR-132 and miR-124 by artificial constructs in primary neuronal cells (54) and by neuronal RNAs NREP and OIP5-AS1, which direct the degradation of miR-29 and miR-7, respectively, and thereby affect neural activity (22,27,54). To our knowledge, this study represents the first instance of TDMD implicated in human myogenesis. We found that OIP5-AS1, which is specifically elevated in skeletal muscle, reduced miR-7 expression upon myogenic differentiation, and we further discovered that expression of the muscle-specific fusogenic protein MYMX was regulated by this myogenic TDMD. In short, TDMD involving these two noncoding RNAs might directly influence muscle development as well as adult muscle regeneration.
By global CRISPR/Cas9 screening, a general mechanism of TDMD was recently suggested whereby the ubiquitin ligase ZSWIM8 controlled miRNA degradation by inducing the proteolysis of loaded Argonaute (AGO) (44,45). In agreement with this mechanism, we found that silencing interventions directed at the ZSWIM8 mRNA led to a rise in miR-7 levels (Figure 1K and Supplementary Figure S1B). However, OIP5-AS1 is a long lncRNA, with some isoforms spanning >8 kb, and thus it can serve as a platform for binding of many RNA-binding proteins (RBPs), including AGO2 (55). Accordingly, the interaction of OIP5-AS1 with myogenic RBPs such as HuR, IGF2BP2 and KHSRP [POSTAR database (20,55,56)] could influence the binding of AGO/miR-7 with OIP5-AS1 by direct competition or by changing regional RNA conformation in ways that expose or hide miRNA-binding sites, consequently promoting or suppressing TDMD. Further work is warranted to clarify whether RBPs known to interact with OIP5-AS1 and influence myogenesis, such as HuR, might affect TDMD.
Role of miR-7 in MYMX expression during myogenesis
The abundance of miR-7 positively correlates with muscle aging and negatively correlates with muscle health in mice and humans (23–25). Here, we found that miR-7 levels decreased during myogenesis, and discovered that this reduction was at least partly due to OIP5-AS1-directed degradation (Figures 1 and 7). Overexpression of miR-7 suppressed human myotube formation and myogenesis (Figure 2), and the miR-7 antagomiR strongly promoted myotube formation (Figure 2). In light of growing evidence that miRNAs and antagomiRs can be used therapeutically, further examining whether antagonizing miR-7 can regulate muscle regeneration and muscle aging is warranted. We sought to study this question in mice using the site blocker (OIP5-AS1:miR-7 TSB), but unfortunately, the miR-7 site is not conserved on the mouse Mymx mRNA and thus the mouse is not a good model for the effect of this TSB. Systematic analysis of miRNA target sites revealed that nonconserved sites of miRNAs are several times more abundant than conserved sites, although both reduce mRNA stability and translation (57,58). Other relevant studies document the fact that nonconserved sites of human- and primate-specific miRNAs have important roles in developmental and disease processes (59); for example, repression of MeCP2 levels by miRNA miR-483-5p occurred specifically in fetal brain from humans but not mice (60). Additionally, 3′UTRs from orthologous genes increase in miRNA target sites from invertebrates to humans; in this regard, Cacchiarelli et al. proposed that human 3′UTRs may acquire evolutionary advantage via specific miRNA target sites (61). Although mouse and human myogeneses are highly conserved, the expression of some myogenic factors varies between humans and mice (62,63), suggesting the existence of evolutionary mechanisms such as selective regulation of MYMX expression by miR-7 to fine-tune myogenesis in humans but not in mice. Interestingly, however, miR-7 overexpression was recently found to be beneficial in myoblasts from myotonic dystrophy (DM) patients by repressing autophagy (64), suggesting a distinct function of miR-7 in DM. In this paradigm, the OIP5-AS1:miR-7 TSB might recapitulate the beneficial effects observed by increasing miR-7 levels.
Although MYMX has been found to be a key regulator of the fusion of myoblasts into multinucleated myotubes, little is known about the molecular mechanisms that regulate MYMX levels. Previous reports have shown that MYOD and MYOG may induce expression of MYMX transcriptionally (31,65). During myogenic differentiation, MYMX is elevated early and decreases rapidly when MYH levels increase (Figure 4). Interestingly, the putative transcriptional regulator MYOG remains elevated at later time points (Figure 4), indicating that the drop in MYMX production likely occurs via post-transcriptional mechanisms. Here, we identified miR-7 as a repressor of MYMX production, as it suppresses MYMX mRNA stability and translation, adding one more dimension of control of MYMX biosynthesis and reduction (Figure 5). Whether RBPs and possibly post-translational events (i.e. MYMX protein stability) also contribute to the regulation of MYMX levels awaits future analysis.
Application of TSB in therapeutic paradigms
We found that a small oligonucleotide TSB (OIP5-AS1:miR-7 TSB) interfered with the binding of miR-7 to OIP5-AS1 and hence prevented miR-7 degradation, while another TSB (OIP5-AS1:MEF2C TSB) interfered with the interaction between two long RNAs, OIP5-AS1 and MEF2C mRNA (Figure 7). These observations align with a similar approach reported recently using small ASOs to block RNA–RNA interactions (66) and suggest that TSBs could be used more broadly to study lncRNA interactions with other RNAs and RBPs.
Unlike strategies to silence a target gene, TSBs only interfere with the interaction of two specific RNAs, and therefore they are expected to be less likely to cause the unwanted side effects seen after antagonizing an miRNA or treating with an siRNA, while still having the advantages of being small oligonucleotides with therapeutic capacity (66–68). ASOs, a family of molecules that includes TSBs, are intensely investigated for therapeutic use (69,70), including ASOs for muscle-related diseases such as Duchenne muscular dystrophy (71,72). The specific modifications on TSBs have been reported to reduce off-target effects (70,73,74).
Beyond myogenesis, both OIP5-AS1 and miR-7 have been reported to regulate tumorigenesis with pro- and anticancer influence (75,76). For instance, in glioma, OIP5-AS1 is pro-oncogenic (77,78) and miR-7 acts as a tumor suppressor (79–81). Whether these RNAs are implicated in TDMD in glioma and the TSB directed at OIP5-AS1:miR-7 can be exploited therapeutically deserve future study.
In summary, we present a new paradigm whereby a lncRNA, OIP5-AS1, helps to orchestrate a complex biological process by associating with an miRNA, miR-7, enhancing its degradation and thus derepressing production of a protein that promotes myoblast fusion, MYMX. This proof-of-principle study highlights the potential usefulness of small oligonucleotides (TSB) to interfere selectively with RNA–RNA interactions for therapeutic benefit.
DATA AVAILABILITY
The RNA-seq data were deposited in GEO (GSE202793).
Supplementary Material
ACKNOWLEDGEMENTS
We thank V. Raz (Leiden University Medical Centre, The Netherlands) and V. Mouly (INSERM, France) for the human myoblasts. We appreciate the help from E. Lehrmann (National Institute on Aging Intramural Research Program, National Institutes of Health) with data deposition in GEO.
Author contributions: J.-H.Y., M.-W.C. and M.G. conceived the study; J.-H.Y., M.-W.C., D.T., K.A. and M.G. designed experiments; J.-H.Y., M.-W.C., D.T., X.Y., J.L.M., R.M., A.C., E.I., P.R.P. and Y.P. performed and analyzed experiments; K.M.-M., S.D. and K.A. contributed intellectually and provided technical support; J.-H.Y., J.L.M., S.D. and M.G. wrote the manuscript.
Contributor Information
Jen-Hao Yang, Laboratory of Genetics and Genomics, National Institute on Aging Intramural Research Program, National Institutes of Health, 251 Bayview Blvd, Baltimore, MD 21224, USA.
Ming-Wen Chang, Laboratory of Genetics and Genomics, National Institute on Aging Intramural Research Program, National Institutes of Health, 251 Bayview Blvd, Baltimore, MD 21224, USA.
Dimitrios Tsitsipatis, Laboratory of Genetics and Genomics, National Institute on Aging Intramural Research Program, National Institutes of Health, 251 Bayview Blvd, Baltimore, MD 21224, USA.
Xiaoling Yang, Laboratory of Genetics and Genomics, National Institute on Aging Intramural Research Program, National Institutes of Health, 251 Bayview Blvd, Baltimore, MD 21224, USA.
Jennifer L Martindale, Laboratory of Genetics and Genomics, National Institute on Aging Intramural Research Program, National Institutes of Health, 251 Bayview Blvd, Baltimore, MD 21224, USA.
Rachel Munk, Laboratory of Genetics and Genomics, National Institute on Aging Intramural Research Program, National Institutes of Health, 251 Bayview Blvd, Baltimore, MD 21224, USA.
Aiwu Cheng, Laboratory of Genetics and Genomics, National Institute on Aging Intramural Research Program, National Institutes of Health, 251 Bayview Blvd, Baltimore, MD 21224, USA.
Elizabeth Izydore, Laboratory of Genetics and Genomics, National Institute on Aging Intramural Research Program, National Institutes of Health, 251 Bayview Blvd, Baltimore, MD 21224, USA.
Poonam R Pandey, Laboratory of Genetics and Genomics, National Institute on Aging Intramural Research Program, National Institutes of Health, 251 Bayview Blvd, Baltimore, MD 21224, USA.
Yulan Piao, Laboratory of Genetics and Genomics, National Institute on Aging Intramural Research Program, National Institutes of Health, 251 Bayview Blvd, Baltimore, MD 21224, USA.
Krystyna Mazan-Mamczarz, Laboratory of Genetics and Genomics, National Institute on Aging Intramural Research Program, National Institutes of Health, 251 Bayview Blvd, Baltimore, MD 21224, USA.
Supriyo De, Laboratory of Genetics and Genomics, National Institute on Aging Intramural Research Program, National Institutes of Health, 251 Bayview Blvd, Baltimore, MD 21224, USA.
Kotb Abdelmohsen, Laboratory of Genetics and Genomics, National Institute on Aging Intramural Research Program, National Institutes of Health, 251 Bayview Blvd, Baltimore, MD 21224, USA.
Myriam Gorospe, Laboratory of Genetics and Genomics, National Institute on Aging Intramural Research Program, National Institutes of Health, 251 Bayview Blvd, Baltimore, MD 21224, USA.
SUPPLEMENTARY DATA
Supplementary Data are available at NAR Online.
FUNDING
National Institutes of Health [Z01-AG000394-13]. Funding for open access charge: National Institutes of Health.
Conflict of interest statement. None declared.
REFERENCES
- 1. Herman A.B., Tsitsipatis D., Gorospe M.. Integrated LncRNA Function Upon Genomic and Epigenomic Regulation. Mol. Cell. 2022; 82:2252–2266. [DOI] [PMC free article] [PubMed] [Google Scholar]
- 2. Rinn J.L., Chang H.Y.. Long noncoding RNAs: molecular modalities to organismal functions. Annu. Rev. Biochem. 2020; 89:283–308. [DOI] [PubMed] [Google Scholar]
- 3. Schmitt A.M., Chang H.Y.. Long noncoding RNAs in cancer pathways. Cancer Cell. 2016; 29:452–463. [DOI] [PMC free article] [PubMed] [Google Scholar]
- 4. Riva P., Ratti A., Venturin M.. The long non-coding RNAs in neurodegenerative diseases: novel mechanisms of pathogenesis. Curr. Alzheimer Res. 2016; 13:1219–1231. [DOI] [PubMed] [Google Scholar]
- 5. Zhang Z.K., Li J., Guan D., Liang C., Zhuo Z., Liu J., Lu A., Zhang G., Zhang B.T.. A newly identified lncRNA MAR1 acts as a miR-487b sponge to promote skeletal muscle differentiation and regeneration. J. Cachexia Sarcopenia Muscle. 2018; 9:613–626. [DOI] [PMC free article] [PubMed] [Google Scholar]
- 6. Kopp F., Mendell J.T.. Functional classification and experimental dissection of long noncoding RNAs. Cell. 2018; 172:393–407. [DOI] [PMC free article] [PubMed] [Google Scholar]
- 7. Ransohoff J.D., Wei Y., Khavari P.A.. The functions and unique features of long intergenic non-coding RNA. Nat. Rev. Mol. Cell Biol. 2018; 19:143–157. [DOI] [PMC free article] [PubMed] [Google Scholar]
- 8. Statello L., Guo C.J., Chen L.L., Huarte M.. Gene regulation by long non-coding RNAs and its biological functions. Nat. Rev. Mol. Cell Biol. 2021; 22:96–118. [DOI] [PMC free article] [PubMed] [Google Scholar]
- 9. Bentzinger C.F., Wang Y.X., Rudnicki M.A.. Building muscle: molecular regulation of myogenesis. Cold Spring Harb. Perspect. Biol. 2012; 4:a008342. [DOI] [PMC free article] [PubMed] [Google Scholar]
- 10. Bryson-Richardson R.J., Currie P.D.. The genetics of vertebrate myogenesis. Nat. Rev. Genet. 2008; 9:632–646. [DOI] [PubMed] [Google Scholar]
- 11. Chal J., Pourquie O.. Making muscle: skeletal myogenesis in vivo and in vitro. Development. 2017; 144:2104–2122. [DOI] [PubMed] [Google Scholar]
- 12. Ballarino M., Morlando M., Fatica A., Bozzoni I.. Non-coding RNAs in muscle differentiation and musculoskeletal disease. J. Clin. Invest. 2016; 126:2021–2030. [DOI] [PMC free article] [PubMed] [Google Scholar]
- 13. Luo H., Lv W., Tong Q., Jin J., Xu Z., Zuo B.. Functional non-coding RNA during embryonic myogenesis and postnatal muscle development and disease. Front. Cell Dev. Biol. 2021; 9:628339. [DOI] [PMC free article] [PubMed] [Google Scholar]
- 14. Dimartino D., Colantoni A., Ballarino M., Martone J., Mariani D., Danner J., Bruckmann A., Meister G., Morlando M., Bozzoni I.. The long non-coding RNA lnc-31 interacts with Rock1 mRNA and mediates its YB-1-dependent translation. Cell Rep. 2018; 23:733–740. [DOI] [PMC free article] [PubMed] [Google Scholar]
- 15. Gong C., Li Z., Ramanujan K., Clay I., Zhang Y., Lemire-Brachat S., Glass D.J.. A long non-coding RNA, LncMyoD, regulates skeletal muscle differentiation by blocking IMP2-mediated mRNA translation. Dev. Cell. 2015; 34:181–191. [DOI] [PubMed] [Google Scholar]
- 16. Zhou L., Sun K., Zhao Y., Zhang S., Wang X., Li Y., Lu L., Chen X., Chen F., Bao X.et al.. Linc-YY1 promotes myogenic differentiation and muscle regeneration through an interaction with the transcription factor YY1. Nat. Commun. 2015; 6:10026. [DOI] [PubMed] [Google Scholar]
- 17. Cesana M., Cacchiarelli D., Legnini I., Santini T., Sthandier O., Chinappi M., Tramontano A., Bozzoni I.. A long noncoding RNA controls muscle differentiation by functioning as a competing endogenous RNA. Cell. 2011; 147:358–369. [DOI] [PMC free article] [PubMed] [Google Scholar]
- 18. Zhu M., Liu J., Xiao J., Yang L., Cai M., Shen H., Chen X., Ma Y., Hu S., Wang Z.et al.. Lnc-mg is a long non-coding RNA that promotes myogenesis. Nat. Commun. 2017; 8:14718. [DOI] [PMC free article] [PubMed] [Google Scholar]
- 19. Dey B.K., Pfeifer K., Dutta A.. The H19 long noncoding RNA gives rise to microRNAs miR-675-3p and miR-675-5p to promote skeletal muscle differentiation and regeneration. Genes Dev. 2014; 28:491–501. [DOI] [PMC free article] [PubMed] [Google Scholar]
- 20. Yang J.H., Chang M.W., Pandey P.R., Tsitsipatis D., Yang X., Martindale J.L., Munk R., De S., Abdelmohsen K., Gorospe M.. Interaction of OIP5-AS1 with MEF2C mRNA promotes myogenic gene expression. Nucleic Acids Res. 2020; 48:12943–12956. [DOI] [PMC free article] [PubMed] [Google Scholar]
- 21. Ulitsky I., Shkumatava A., Jan C.H., Sive H., Bartel D.P.. Conserved function of lincRNAs in vertebrate embryonic development despite rapid sequence evolution. Cell. 2011; 147:1537–1550. [DOI] [PMC free article] [PubMed] [Google Scholar]
- 22. Kleaveland B., Shi C.Y., Stefano J., Bartel D.P.. A network of noncoding regulatory RNAs acts in the mammalian brain. Cell. 2018; 174:350–362. [DOI] [PMC free article] [PubMed] [Google Scholar]
- 23. Koltai E., Bori Z., Osvath P., Ihasz F., Peter S., Toth G., Degens H., Rittweger J., Boldogh I., Radak Z.. Master athletes have higher miR-7, SIRT3 and SOD2 expression in skeletal muscle than age-matched sedentary controls. Redox Biol. 2018; 19:46–51. [DOI] [PMC free article] [PubMed] [Google Scholar]
- 24. Hamrick M.W., Herberg S., Arounleut P., He H.Z., Shiver A., Qi R.Q., Zhou L., Isales C.M., Mi Q.S.. The adipokine leptin increases skeletal muscle mass and significantly alters skeletal muscle miRNA expression profile in aged mice. Biochem. Biophys. Res. Commun. 2010; 400:379–383. [DOI] [PMC free article] [PubMed] [Google Scholar]
- 25. Jia B., Liu Y., Li Q., Zhang J., Ge C., Wang G., Chen G., Liu D., Yang F.. Altered miRNA and mRNA expression in sika deer skeletal muscle with age. Genes. 2020; 11:172. [DOI] [PMC free article] [PubMed] [Google Scholar]
- 26. Ameres S.L., Horwich M.D., Hung J.H., Xu J., Ghildiyal M., Weng Z., Zamore P.D.. Target RNA-directed trimming and tailing of small silencing RNAs. Science. 2010; 328:1534–1539. [DOI] [PMC free article] [PubMed] [Google Scholar]
- 27. Bitetti A., Mallory A.C., Golini E., Carrieri C., Carreno Gutierrez H., Perlas E., Perez-Rico Y.A., Tocchini-Valentini G.P., Enright A.J., Norton W.H.J.et al.. MicroRNA degradation by a conserved target RNA regulates animal behavior. Nat. Struct. Mol. Biol. 2018; 25:244–251. [DOI] [PubMed] [Google Scholar]
- 28. Franco-Zorrilla J.M., Valli A., Todesco M., Mateos I., Puga M.I., Rubio-Somoza I., Leyva A., Weigel D., Garcia J.A., Paz-Ares J.. Target mimicry provides a new mechanism for regulation of microRNA activity. Nat. Genet. 2007; 39:1033–1037. [DOI] [PubMed] [Google Scholar]
- 29. Ghini F., Rubolino C., Climent M., Simeone I., Marzi M.J., Nicassio F.. Endogenous transcripts control miRNA levels and activity in mammalian cells by target-directed miRNA degradation. Nat. Commun. 2018; 9:3119. [DOI] [PMC free article] [PubMed] [Google Scholar]
- 30. Ulitsky I. Interactions between short and long noncoding RNAs. FEBS Lett. 2018; 592:2874–2883. [DOI] [PubMed] [Google Scholar]
- 31. Li L., Sheng P., Li T., Fields C.J., Hiers N.M., Wang Y., Li J., Guardia C.M., Licht J.D., Xie M.. Widespread microRNA degradation elements in target mRNAs can assist the encoded proteins. Genes Dev. 2021; 35:1595–1609. [DOI] [PMC free article] [PubMed] [Google Scholar]
- 32. Simeone I., Rubolino C., Noviello T.M.R., Farinello D., Cerulo L., Marzi M.J., Nicassio F.. Prediction and pan-cancer analysis of mammalian transcripts involved in target directed miRNA degradation. Nucleic Acids Res. 2022; 50:2019–2035. [DOI] [PMC free article] [PubMed] [Google Scholar]
- 33. Bi P., Ramirez-Martinez A., Li H., Cannavino J., McAnally J.R., Shelton J.M., Sanchez-Ortiz E., Bassel-Duby R., Olson E.N.. Control of muscle formation by the fusogenic micropeptide myomixer. Science. 2017; 356:323–327. [DOI] [PMC free article] [PubMed] [Google Scholar]
- 34. Shi J., Bi P., Pei J., Li H., Grishin N.V., Bassel-Duby R., Chen E.H., Olson E.N.. Requirement of the fusogenic micropeptide myomixer for muscle formation in zebrafish. Proc. Natl Acad. Sci. U.S.A. 2017; 114:11950–11955. [DOI] [PMC free article] [PubMed] [Google Scholar]
- 35. Zhang Q., Vashisht A.A., O’Rourke J., Corbel S.Y., Moran R., Romero A., Miraglia L., Zhang J., Durrant E., Schmedt C.et al.. The microprotein Minion controls cell fusion and muscle formation. Nat. Commun. 2017; 8:15664. [DOI] [PMC free article] [PubMed] [Google Scholar]
- 36. Thorley M., Duguez S., Mazza E.M.C., Valsoni S., Bigot A., Mamchaoui K., Harmon B., Voit T., Mouly V., Duddy W.. Skeletal muscle characteristics are preserved in hTERT/cdk4 human myogenic cell lines. Skelet. Muscle. 2016; 6:43. [DOI] [PMC free article] [PubMed] [Google Scholar]
- 37. Kanno J., Aisaki K., Igarashi K., Nakatsu N., Ono A., Kodama Y., Nagao T.. ‘Per cell’ normalization method for mRNA measurement by quantitative PCR and microarrays. BMC Genomics. 2006; 7:64. [DOI] [PMC free article] [PubMed] [Google Scholar]
- 38. Tsitsipatis D., Grammatikakis I., Driscoll R.K., Yang X., Abdelmohsen K., Harris S.C., Yang J.H., Herman A.B., Chang M.W., Munk R.et al.. AUF1 ligand circPCNX reduces cell proliferation by competing with p21 mRNA to increase p21 production. Nucleic Acids Res. 2021; 49:1631–1646. [DOI] [PMC free article] [PubMed] [Google Scholar]
- 39. Wojciechowska M., Sobczak K., Kozlowski P., Sedehizadeh S., Wojtkowiak-Szlachcic A., Czubak K., Markus R., Lusakowska A., Kaminska A., Brook J.D.. Quantitative methods to monitor RNA biomarkers in myotonic dystrophy. Sci. Rep. 2018; 8:5885. [DOI] [PMC free article] [PubMed] [Google Scholar]
- 40. Dodd D.W., Gagnon K.T., Corey D.R.. Digital quantitation of potential therapeutic target RNAs. Nucleic Acid Ther. 2013; 23:188–194. [DOI] [PMC free article] [PubMed] [Google Scholar]
- 41. Tan S.M., Lieberman J.. Capture and identification of miRNA targets by biotin pulldown and RNA-seq. Methods Mol. Biol. 2016; 1358:211–228. [DOI] [PubMed] [Google Scholar]
- 42. Love M.I., Huber W., Anders S.. Moderated estimation of fold change and dispersion for RNA-seq data with DESeq2. Genome Biol. 2014; 15:550. [DOI] [PMC free article] [PubMed] [Google Scholar]
- 43. Yu G., Wang L.-G., Han Y., He Q.Y.. clusterProfiler: an R package for comparing biological themes among gene clusters. OMICS. 2012; 16:284–287. [DOI] [PMC free article] [PubMed] [Google Scholar]
- 44. Idda M.L., Lodde V., McClusky W.G., Martindale J.L., Yang X., Munk R., Steri M., Orru V., Mulas A., Cucca F.et al.. Cooperative translational control of polymorphic BAFF by NF90 and miR-15a. Nucleic Acids Res. 2018; 46:12040–12051. [DOI] [PMC free article] [PubMed] [Google Scholar]
- 45. Han J., LaVigne C.A., Jones B.T., Zhang H., Gillett F., Mendell J.T.. A ubiquitin ligase mediates target-directed microRNA decay independently of tailing and trimming. Science. 2020; 370:eabc9546. [DOI] [PMC free article] [PubMed] [Google Scholar]
- 46. Shi C.Y., Kingston E.R., Kleaveland B., Lin D.H., Stubna M.W., Bartel D.P.. The ZSWIM8 ubiquitin ligase mediates target-directed microRNA degradation. Science. 2020; 370:eabc935. [DOI] [PMC free article] [PubMed] [Google Scholar]
- 47. Bi P., McAnally J.R., Shelton J.M., Sanchez-Ortiz E., Bassel-Duby R., Olson E.N.. Fusogenic micropeptide Myomixer is essential for satellite cell fusion and muscle regeneration. Proc. Natl Acad. Sci. U.S.A. 2018; 115:3864–3869. [DOI] [PMC free article] [PubMed] [Google Scholar]
- 48. Chen B., You W., Shan T.. Myomaker, and Myomixer–Myomerger–Minion modulate the efficiency of skeletal muscle development with melatonin supplementation through Wnt/beta-catenin pathway. Exp. Cell Res. 2019; 385:111705. [DOI] [PubMed] [Google Scholar]
- 49. Chen B., You W., Wang Y., Shan T.. The regulatory role of Myomaker and Myomixer–Myomerger–Minion in muscle development and regeneration. Cell. Mol. Life Sci. 2020; 77:1551–1569. [DOI] [PMC free article] [PubMed] [Google Scholar]
- 50. Petrany M.J., Millay D.P.. Cell fusion: merging membranes and making muscle. Trends Cell Biol. 2019; 29:964–973. [DOI] [PMC free article] [PubMed] [Google Scholar]
- 51. Zhang H., Wen J., Bigot A., Chen J., Shang R., Mouly V., Bi P.. Human myotube formation is determined by MyoD–Myomixer/Myomaker axis. Sci. Adv. 2020; 6:eabc4062. [DOI] [PMC free article] [PubMed] [Google Scholar]
- 52. de la Mata M., Gaidatzis D., Vitanescu M., Stadler M.B., Wentzel C., Scheiffele P., Filipowicz W., Grosshans H.. Potent degradation of neuronal miRNAs induced by highly complementary targets. EMBO Rep. 2015; 16:500–511. [DOI] [PMC free article] [PubMed] [Google Scholar]
- 53. Xie J., Ameres S.L., Friedline R., Hung J.H., Zhang Y., Xie Q., Zhong L., Su Q., He R., Li M.et al.. Long-term, efficient inhibition of microRNA function in mice using rAAV vectors. Nat. Methods. 2012; 9:403–409. [DOI] [PMC free article] [PubMed] [Google Scholar]
- 54. Kim C.K., Pak T.R.. miRNA degradation in the mammalian brain. Am. J. Physiol. Cell Physiol. 2020; 319:C624–C629. [DOI] [PMC free article] [PubMed] [Google Scholar]
- 55. Kim J., Abdelmohsen K., Yang X., De S., Grammatikakis I., Noh J.H., Gorospe M.. LncRNA OIP5-AS1/cyrano sponges RNA-binding protein HuR. Nucleic Acids Res. 2016; 44:2378–2392. [DOI] [PMC free article] [PubMed] [Google Scholar]
- 56. Zhu Y., Xu G., Yang Y.T., Xu Z., Chen X., Shi B., Xie D., Lu Z.J., Wang P.. POSTAR2: deciphering the post-transcriptional regulatory logics. Nucleic Acids Res. 2019; 47:D203–D211. [DOI] [PMC free article] [PubMed] [Google Scholar]
- 57. Farh K.K., Grimson A., Jan C., Lewis B.P., Johnston W.K., Lim L.P., Burge C.B., Bartel D.P.. The widespread impact of mammalian microRNAs on mRNA repression and evolution. Science. 2005; 310:1817–1821. [DOI] [PubMed] [Google Scholar]
- 58. Selbach M., Schwanhäusser B., Thierfelder N., Fang Z., Khanin R., Rajewsky N.. Widespread changes in protein synthesis induced by microRNAs. Nature. 2008; 455:58–63. [DOI] [PubMed] [Google Scholar]
- 59. Prodromidou K., Matsas R.. Species-specific miRNAs in human brain development and disease. Front. Cell. Neurosci. 2019; 13:559. [DOI] [PMC free article] [PubMed] [Google Scholar]
- 60. Han K., Gennarino V.A., Lee Y., Pang K., Hashimoto-Torii K., Choufani S., Raju C.S., Oldham M.C., Weksberg R., Rakic P.et al.. Human-specific regulation of MeCP2 levels in fetal brains by microRNA miR-483-5p. Genes Dev. 2013; 27:485–490. [DOI] [PMC free article] [PubMed] [Google Scholar]
- 61. Cacchiarelli D., Santoni D., Bozzoni I.. MicroRNAs as prime players in a combinatorial view of evolution. RNA Biol. 2008; 5:120–122. [DOI] [PubMed] [Google Scholar]
- 62. Mierzejewski B., Archacka K., Grabowska I., Florkowska A., Ciemerych M.A., Brzoska E.. Human and mouse skeletal muscle stem and progenitor cells in health and disease. Semin. Cell Dev. Biol. 2020; 104:93–104. [DOI] [PubMed] [Google Scholar]
- 63. Boldrin L., Muntoni F., Morgan J.E.. Are human and mouse satellite cells really the same?. J. Histochem. Cytochem. 2010; 58:941–55. [DOI] [PMC free article] [PubMed] [Google Scholar]
- 64. Sabater-Arcis M., Bargiela A., Furling D., Artero R.. miR-7 restores phenotypes in myotonic dystrophy muscle cells by repressing hyperactivated autophagy. Mol. Ther. Nucleic Acids. 2020; 19:278–292. [DOI] [PMC free article] [PubMed] [Google Scholar]
- 65. Quinn M.E., Goh Q., Kurosaka M., Gamage D.G., Petrany M.J., Prasad V., Millay D.P.. Myomerger induces fusion of non-fusogenic cells and is required for skeletal muscle development. Nat. Commun. 2017; 8:15665. [DOI] [PMC free article] [PubMed] [Google Scholar]
- 66. Lippi G., Fernandes C.C., Ewell L.A., John D., Romoli B., Curia G., Taylor S.R., Frady E.P., Jensen A.B., Liu J.C.et al.. MicroRNA-101 regulates multiple developmental programs to constrain excitation in adult neural networks. Neuron. 2016; 92:1337–1351. [DOI] [PMC free article] [PubMed] [Google Scholar]
- 67. Natarelli L., Geissler C., Csaba G., Wei Y., Zhu M., di Francesco A., Hartmann P., Zimmer R., Schober A.. miR-103 promotes endothelial maladaptation by targeting lncWDR59. Nat. Commun. 2018; 9:2645. [DOI] [PMC free article] [PubMed] [Google Scholar]
- 68. Rossi F., Beltran M., Damizia M., Grelloni C., Colantoni A., Setti A., Di Timoteo G., Dattilo D., Centrón-Broco A., Nicoletti C.et al.. Circular RNA ZNF609/CKAP5 mRNA interaction regulates microtubule dynamics and tumorigenicity. Mol. Cell. 2022; 82:75–89. [DOI] [PMC free article] [PubMed] [Google Scholar]
- 69. Crooke S.T., Baker B.F., Crooke R.M., Liang X.H.. Antisense technology: an overview and prospectus. Nat. Rev. Drug Discov. 2021; 20:427–453. [DOI] [PubMed] [Google Scholar]
- 70. Puttaraju M., Jackson M., Klein S., Shilo A., Bennett C.F., Gordon L., Rigo F., Misteli T.. Systematic screening identifies therapeutic antisense oligonucleotides for Hutchinson–Gilford progeria syndrome. Nat. Med. 2021; 27:526–535. [DOI] [PMC free article] [PubMed] [Google Scholar]
- 71. Cirak S., Arechavala-Gomeza V., Guglieri M., Feng L., Torelli S., Anthony K., Abbs S., Garralda M.E., Bourke J., Wells D.J.et al.. Exon skipping and dystrophin restoration in patients with Duchenne muscular dystrophy after systemic phosphorodiamidate morpholino oligomer treatment: an open-label, phase 2, dose-escalation study. Lancet. 2011; 378:595–605. [DOI] [PMC free article] [PubMed] [Google Scholar]
- 72. Clemens P.R., Rao V.K., Connolly A.M., Harper A.D., Mah J.K., Smith E.C., McDonald C.M., Zaidman C.M., Morgenroth L.P., Osaki H.et al.. Safety, tolerability, and efficacy of viltolarsen in boys with Duchenne muscular dystrophy amenable to exon 53 skipping: a phase 2 randomized clinical trial. JAMA Neurol. 2020; 77:982–991. [DOI] [PMC free article] [PubMed] [Google Scholar]
- 73. Scharner J., Ma W.K., Zhang Q., Lin K.T., Rigo F., Bennett C.F., Krainer A.R.. Hybridization-mediated off-target effects of splice-switching antisense oligonucleotides. Nucleic Acids Res. 2020; 48:802–816. [DOI] [PMC free article] [PubMed] [Google Scholar]
- 74. Erdos M.R., Cabral W.A., Tavarez U.L., Cao K., Gvozdenovic-Jeremic J., Narisu N., Zerfas P.M., Crumley S., Boku Y., Hanson G.et al.. A targeted antisense therapeutic approach for Hutchinson–Gilford progeria syndrome. Nat. Med. 2021; 27:536–545. [DOI] [PMC free article] [PubMed] [Google Scholar]
- 75. Li Y., Han X., Feng H., Han J.. Long noncoding RNA OIP5-AS1 in cancer. Clin. Chim. Acta. 2019; 499:75–80. [DOI] [PubMed] [Google Scholar]
- 76. Zhao J., Tao Y., Zhou Y., Qin N., Chen C., Tian D., Xu L.. MicroRNA-7: a promising new target in cancer therapy. Cancer Cell Int. 2015; 15:103. [DOI] [PMC free article] [PubMed] [Google Scholar]
- 77. Liu X., Zheng J., Xue Y., Yu H., Gong W., Wang P., Li Z., Liu Y.. PIWIL3/OIP5-AS1/miR-367-3p/CEBPA feedback loop regulates the biological behavior of glioma cells. Theranostics. 2018; 8:1084–1105. [DOI] [PMC free article] [PubMed] [Google Scholar]
- 78. Sun W.L., Kang T., Wang Y.Y., Sun J.P., Li C., Liu H.J., Yang Y., Jiao B.H.. Long noncoding RNA OIP5-AS1 targets Wnt-7b to affect glioma progression via modulation of miR-410. Biosci. Rep. 2019; 39:BSR20180395. [DOI] [PMC free article] [PubMed] [Google Scholar]
- 79. Kefas B., Godlewski J., Comeau L., Li Y., Abounader R., Hawkinson M., Lee J., Fine H., Chiocca E.A., Lawler S.et al.. microRNA-7 inhibits the epidermal growth factor receptor and the Akt pathway and is down-regulated in glioblastoma. Cancer Res. 2008; 68:3566–3572. [DOI] [PubMed] [Google Scholar]
- 80. Pan C.M., Chan K.H., Chen C.H., Jan C.I., Liu M.C., Lin C.M., Cho D.Y., Tsai W.C., Chu Y.T., Cheng C.H.et al.. MicroRNA-7 targets T-box 2 to inhibit epithelial-mesenchymal transition and invasiveness in glioblastoma multiforme. Cancer Lett. 2020; 493:133–142. [DOI] [PubMed] [Google Scholar]
- 81. Wang H., Feng J., Ao F., Tang Y., Xu P., Wang M., Huang M.. Tumor-derived exosomal microRNA-7-5p enhanced by verbascoside inhibits biological behaviors of glioblastoma in vitro and in vivo. Mol. Ther. Oncolytics. 2021; 20:569–582. [DOI] [PMC free article] [PubMed] [Google Scholar]
Associated Data
This section collects any data citations, data availability statements, or supplementary materials included in this article.
Supplementary Materials
Data Availability Statement
The RNA-seq data were deposited in GEO (GSE202793).