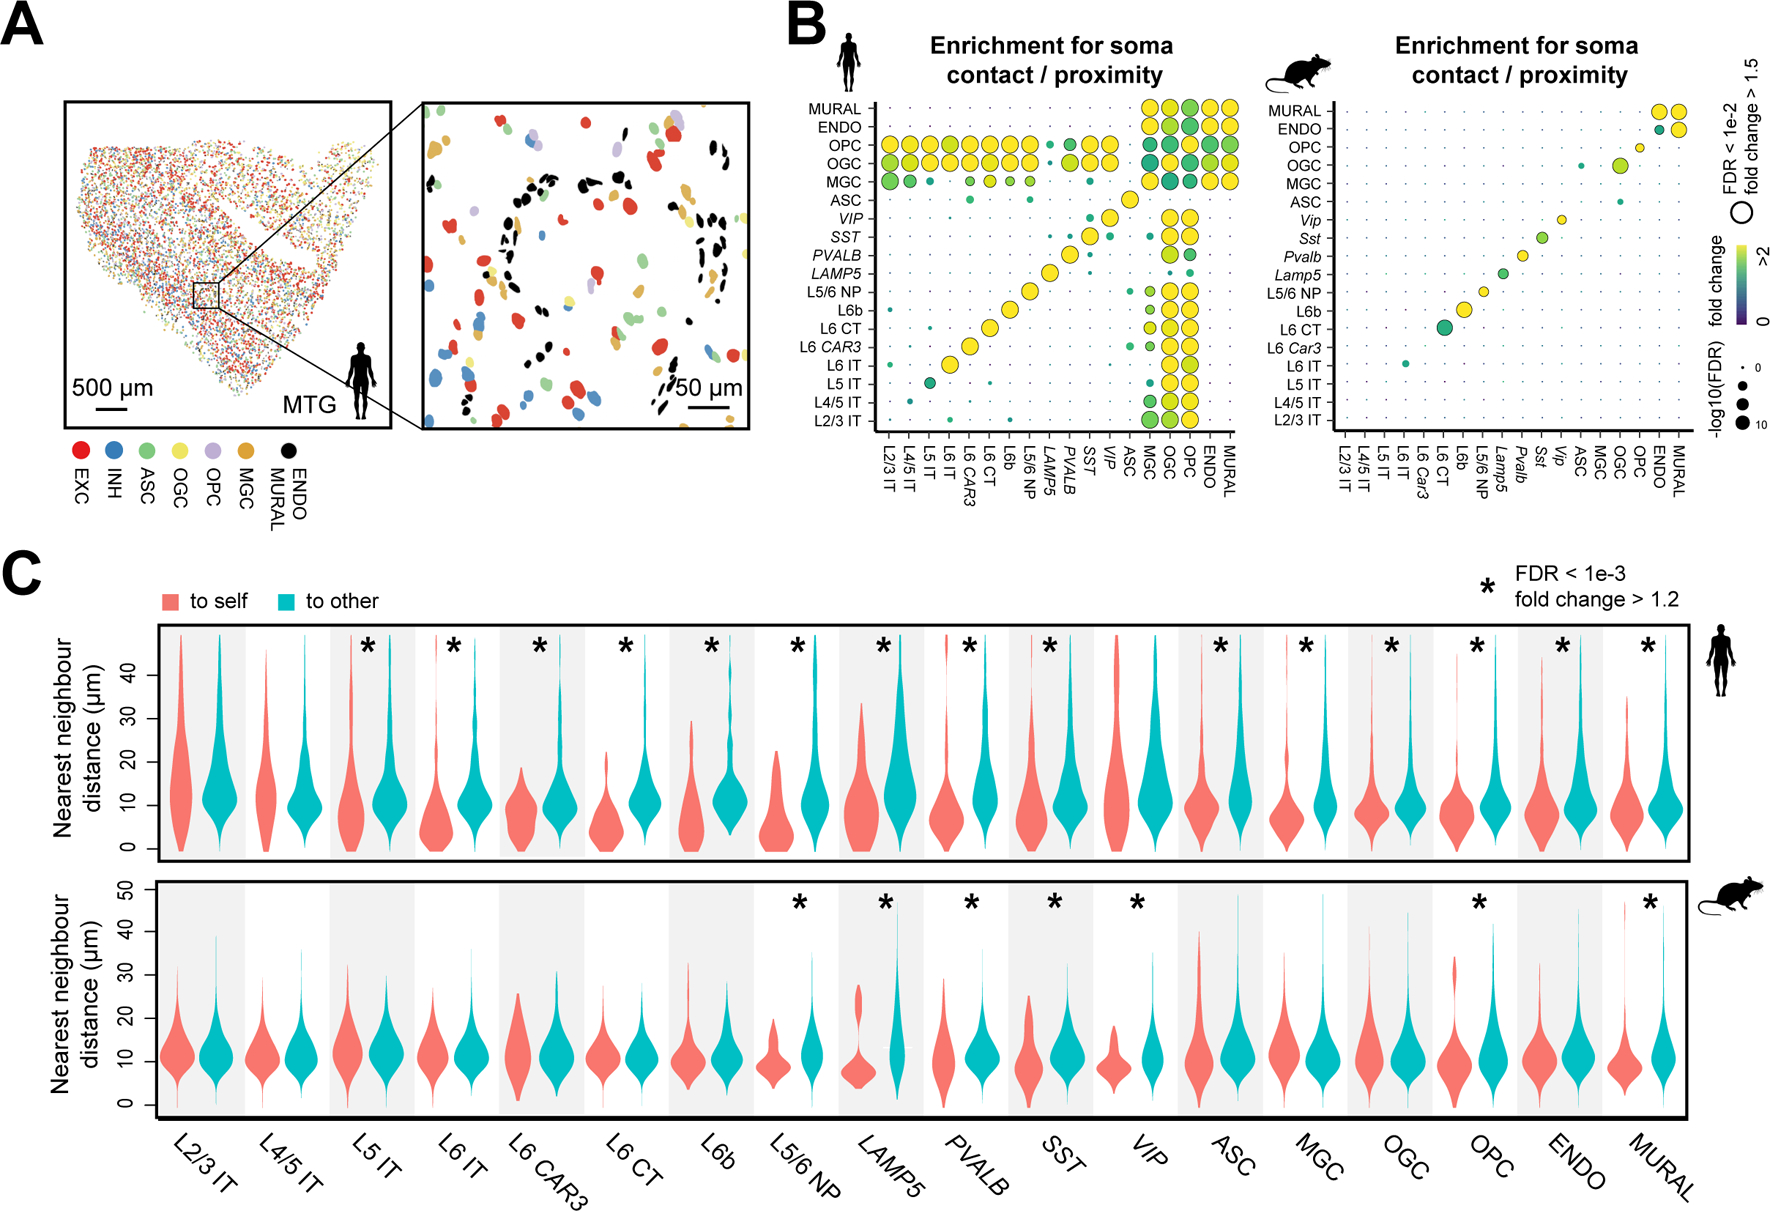
Fig. 4. Cell-type-specific cell-cell interactions in the human and mouse cortex.

. (A) Spatial map of excitatory neurons, inhibitory neurons, and six major subclasses of non-neuronal cells in a human MTG slice (left) and a zoomed-in image of the boxed region (right). Colored shapes are cell nuclei segmentations. (B) Enrichment map of pairwise soma contact or proximity for subclasses of cells in human (left) and mouse (right) cortex. The color of the dots indicates the fold change between the observed frequency of soma contact or proximity and the average expected frequency from the spatial permutations that disrupt the spatial relationship between neighboring cells (fig. S13). The size of the dots indicates the significance level of the enrichment. FDR: P-value determined with upper-tailed Z-test and adjusted to FDR by the BH procedure. (C) Distributions of the nearest-neighbor distances from cells in individual subclasses to cells in the same subclass (“to self”, red) or other subclasses (“to other”, blue) in human (top) and mouse (bottom) cortex. FDR: P-value determined with the Wilcoxon rank-sum one-sided test and adjusted to FDR by the BH procedure.
