Abstract
Semaglutide is a glucagon‐like‐peptide‐1 (GLP‐1) analogue marketed for once‐weekly subcutaneous administration for type 2 diabetes mellitus. Like other long‐acting GLP‐1 analogues, semaglutide reduces gastric emptying and, potentially, alters the rate of absorption of orally co‐administered drugs. The objective of the current analysis was to evaluate the effects on the gastric emptying rate caused by semaglutide on pharmacokinetic model parameters of paracetamol and atorvastatin in healthy subjects. Non‐linear mixed effect modeling was used to estimate population pharmacokinetic model parameters of paracetamol and atorvastatin after single doses with or without semaglutide. The absorption rate (ka) of paracetamol decreased by 53% when co‐administered with semaglutide. For atorvastatin, ka and transit compartment rate (ktr) decreased by 72% and 91%, respectively. Thus, gastric emptying, measured as T50, i.e., drug disappearance from the absorption compartments, showed an additional 5‐min delay for paracetamol and a 67‐min delay for atorvastatin when co‐administered with semaglutide. Semaglutide affected pharmacokinetic model parameters of paracetamol and atorvastatin, and minor quantitative differences in gastric emptying between placebo vs. semaglutide administration were observed. However, these effects of semaglutide were considered not to be of clinical relevance.
Keywords: acetaminophen, atorvastatin, drug interactions, gastric emptying, GLP‐1, humans, models biological, pharmacokinetics
Quantification of Gastric Emptying via Population Pharmacokinetic Modeling.

Abbreviations
- AUC
area under the concentration‐time curve
- bsv
between subject variability
- GER
gastric emptying rate
- GLP‐1
glucagon like peptide‐1
- OFV
objective function value
- PK
pharmacokinetic
- PML
phoenix modeling language
- RSE
residual standard error
- RUV
residual unexplained variability
- T2D
type 2 diabetes mellitus
- VPC
visual predictive check
1. INTRODUCTION
It is estimated that, globally, approximately 6% of adults suffer from type 2 diabetes mellitus (T2D). 1 Type 2 diabetes is a metabolic disease characterized by chronic high blood glucose levels, leading to insulin resistance and impaired insulin secretion. Due to lack of insulin sensitivity, conservative insulin therapy is not effective/efficient. Alternative treatments for blood glucose management and promotion of other features such as satiety and weight loss are required. 2 Patients with T2D are at high risk of developing cardiovascular diseases and other comorbidities, 3 necessitating multiple drug usage by T2D patients which increases the risk of drug–drug interactions. 4
Glucagon‐like‐peptide 1 (GLP‐1) is an incretin gut hormone responsible for endocrine regulation of gastric emptying rate (GER). 5 , 6 , 7 GLP‐1 has an insulinotropic effect and works in a glucose‐dependent manner with an increased effect during elevated blood glucose, and therefore plays a crucial role in the regulation of post‐prandial blood glucose and promotion of satiety by inducing a delayed effect on GER. 4 , 8 It has been established that GLP‐1 promotes a delay in gastric emptying time via transmission of cholinergic and peptidergic inhibitory signals in the parasympathetic nervous system. 9 In addition to its GER‐reducing actions, GLP‐1 supresses glucagon secretion. 10 These properties of native GLP‐1 make GLP‐1 analogues a suitable therapeutic alternative for the treatment of T2D, and the development of drug candidates possessing the same properties as native GLP‐1 is highly relevant. 4 , 8
Semaglutide is a GLP‐1 analogue with similar physiological properties as native GLP‐1 and is marketed as Ozempic® for once weekly subcutaneous administration. Semaglutide is 94% structurally homologous to native human GLP‐1. Three molecular modifications contribute to the extended half‐life of one week. 8 Due to the reducing effect on GER of semaglutide, the absorption properties and/or disposition of concomitant oral drugs could be altered/affected. For highly water‐soluble drugs GER plays a particularly important role, since dissolution in the stomach is not a rate limiting step of drug absorption. 11 Furthermore, a hypothesis suggests that delayed gastric emptying gives medications with low solubility additional time to dissolve in the stomach, suggesting that disposition of low solubility drugs could be altered for when co‐administered with semaglutide. 4 Hence, investigation of GER and its effect on pharmacokinetic (PK) parameters is warranted for drugs co‐administered with semaglutide. 4
An example of a well‐known highly soluble drug is paracetamol. Paracetamol is classified in the biopharmaceutical classification system (BCS) as a BCS class I drug, possessing high solubility and high permeability. In addition, paracetamol is poorly absorbed in the stomach, but rapidly absorbed in the proximal intestine. Paracetamol per se does not affect gastric motility and it is well tolerated with limited side effects. 12 Given the permeability properties and high solubility of paracetamol, GER becomes the rate limiting step for systemic absorption. 13 These characteristics qualify paracetamol as a pharmacological marker for quantification of GER, also known as the paracetamol absorption tests. 14 , 15
Another example of a well‐known BCS class I drugs is metformin (biguanide). 16 However, metformin could not meet the requirements as a pharmacological marker for GER as it may confound the quantification of GER by increasing endogenous GLP‐1. 16 Also, it may induce duodenum‐gastric reflux after oral administration and provide nausea. 17
In 2018, Hjerpsted et al. 8 performed the paracetamol absorption test to assess the reducing effect on GER of semaglutide. A non‐compartmental analysis (NCA) was performed for calculation of the Cmax, tmax, and area under the concentration‐time curve (AUC) for paracetamol. Based on the paracetamol absorption test, it was concluded that gastric emptying during the first hour was 27% lower with semaglutide, compared with placebo [AUC0‐1h]. Furthermore, no significant alteration in the area under the concentration‐time curve measured for 5 h [AUC0‐5h] was observed between paracetamol administered alone or with semaglutide. Finally, there were no relevant clinical concerns when oral paracetamol was co‐administered with semaglutide. However, no attempt was made to describe the effect of delayed gastric emptying on primary oral PK model parameters such as absorption rate constant (ka), and GER was not quantified.
Atorvastatin is classified as a BCS II drug with high permeability but low solubility. 18 As semaglutide may alter the disposition of co‐administered low solubility drugs, atorvastatin was selected for this analysis due to its BCS classification, which is different from that of paracetamol. Moreover, atorvastatin a substrate for cytochrome P450 (CYP) 3A4, is present in the intestines and the liver. 18 However, cytochrome P450 enzymes and transporters are not expected to be inhibited or induced by semaglutide, but a delay in GER by semaglutide may affect the drug safety profile of atorvastatin, as the time of maximum plasma concentration of atorvastatin is known to be affected by (other) GLP‐1 analogues. 19 The complex metabolic pattern of atorvastatin could potentially be affected when the GER is delayed. After oral administration, atorvastatin undergoes complete metabolization to two different metabolites, ortho‐hydroxy‐atorvastatin and para‐hydroxy‐atorvastatin, mediated by CYP3A4. The parent compound and its metabolites are in equilibrium with corresponding inactive lactone forms mediated in the liver in 1:1 ratio. 20 In vitro studies have suggested that lactone formation also happens spontaneously at low pH values (<pH2). 20 Therefore, reduced GER might lead to prolonged retention of atorvastatin during dissolution in the stomach causing increased lactone formation and altered absorption of atorvastatin. 20 Furthermore, since atorvastatin minimizes the risk of developing atherosclerotic cardiovascular diseases in patients with T2D it is likely to be co‐administered with semaglutide. 18
Therefore, it is relevant to investigate if the safety profile of atorvastatin is affected by delayed GER caused by semaglutide. Haunser et al. 4 investigated this and the effect of semaglutide on the overall exposure, Cmax and tmax, of atorvastatin obtained by non‐compartment analysis. None of these analyses of paracetamol or atorvastatin exposure investigated the effect of delayed GER on primary oral PK model parameters such as absorption rate constant (ka), and GER was not quantified. 4 , 8
The objective of the current analysis was to quantify the effects of delayed gastric emptying caused by semaglutide on absorption parameters of paracetamol and atorvastatin, and to quantify the gastric emptying rate. For this analysis, population PK modeling was performed using data on file. 4 , 8
2. MATERIAL AND METHODS
The trial design of the study containing paracetamol (NCT02079870) data has previously been reported in Hjerpsted et al. 8 The study was conducted in compliance with the International Conference on Harmonisation Good Clinical Practice guidelines 21 and the Declaration of Helsinki. 22 In brief, the study was a single center, randomized, multiple‐dose, double‐blind two period, placebo‐controlled, cross‐over trial.
The trial consisted of two 12 weeks crossover treatment periods, separated by a wash‐out period of five to seven weeks. Eligible subjects were randomized 1:1 to one of the following treatment sequences: semaglutide‐placebo or placebo‐semaglutide and then dose escalated with once weekly subcutaneous administration of semaglutide to steady state. Semaglutide was administered subcutaneously once weekly in escalating doses of 0.25 mg (4 weeks), 0.5 mg (4 weeks) and 1.0 mg (4 weeks, to steady state). When steady state was obtained at the end of each 12‐week treatment period subjects were given 1500 mg paracetamol solubilized in yoghurt. Plasma concentration samples were collected pre‐dose and at 0.25, 0.5, 0.75, 1, 1.5, 2, 3, 4 and 5 h after administration of paracetamol. All paracetamol pre‐dose samples were below the lower limit of quantification (LLOQ). These samples were excluded from the analysis.
Thirty healthy obese male and female subjects with body mass index between 30 and 45 kg/m2 and mean weight, 102.3 kg, (81.5–103.5 kg) were enrolled. Two subjects withdrew from the study after the first trial period resulting in a total of 29 subjects receiving paracetamol combination with placebo and 27 subjects received paracetamol combination with semaglutide. For further reading, see Hjerpsted et al. 8
The design of the atorvastatin study, with and without semaglutide (NCT02243098), has previously been reported in Hausner et al. 4 The study was similarly conducted in compliance with the International Conference on Harmonisation Good Clinical Practice guidelines and 21 the Declaration of Helsinki. 22 In brief, the study contained two open‐label, one‐sequence crossover, single center clinical pharmacology study, studies 1 and 2. Study 2 investigated once‐weekly subcutaneous semaglutides effect on the pharmacokinetics of atorvastatin and digoxin. 4 Both drugs were investigated in each trial period separated by a seven‐day wash‐out period. Semaglutide was administered subcutaneously once weekly in escalating doses of 0.25 mg (4 weeks), 0.5 mg (4 weeks) and 1.0 mg (4 weeks, to steady state). Dosing was continued for an additional two weeks to ensure that drug–drug interactions were assessed at semaglutide steady state, resulting in a total trial duration of 14 weeks. For the current analysis, only atorvastatin was considered. A dosage of 40 mg atovastatin was administered orally before initiating dose escalation of semaglutide, and at the end of week 13.
Thirty‐one healthy males and females with a body mass index 20.0–30.0 kg/m2 and 18–55 years of age were enrolled in this study. Five subjects withdrew during the study, so in total, 31 subjects received atorvastatin without semaglutide, and 26 subjects received atorvastatin in combination with semaglutide. Plasma concentration samples were collected pre‐dose and at 0.5, 1, 2, 3, 4, 6, 8, 10, 12, 18,24, 36, 48, and 72 h after administration of atorvastatin. Plasma concentration values for atorvastatin at pre‐dose, and 72 h were all below LLOQ and excluded from the analysis. For further reading, see Hausner et al. 4
2.1. General population pharmacokinetic model development
Non‐linear mixed effect population PK modeling was performed for both studies. Models were developed in Phoenix NLME 8.1 (Certara USA, Inc., NJ 08540 USA) using the First Order Conditional Estimation ‐ Extended Least Squares method (FOCE‐ELS). Raw data from the studies were extracted and modified using R‐ version 3.6.1 (https://cran.r‐project.org/). The model building process was performed stepwise as follows: (i) the structural population model; (ii) the statistical submodel; (iii) the covariate model; and (iv) internal validation. The different models were discriminated by the likelihood ratio test using the objective function value (OFV; i.e., –2*log likelihood), where a decrease in OFV of 3.84 points (p <.05 based on a χ2 distribution) was considered statistically significant, between nested models with one additional degree of freedom. Between subject variability (BSV) was assumed to be independent, and an exponential error model of eta was used (assuming eta was log‐normally distributed with a mean of zero and a variance of omega2). Variance was explored and included by an omega block if applicable. For the unexplained variability (RUV), a proportional, additive and a combined error model were tested. In addition, the relative standard errors (RSE), the condition number and the η‐shrinkage of the random effects were assessed during model evaluation. These should be as low as possible but preferably not exceed 60%, 1000 and 25% respectively. 23
2.2. Covariate model development
The tested covariates were body weight, age, sex and treatment with semaglutide. Graphic visualization was performed screening individual post hoc estimated model parameters vs covariates. Potential covariates were introduced into the base model one at a time using a stepwise forward inclusion method until OFV did not improve (e.g. decrease in OFV ≥ 3.84 was considered statistically significant, p < .05 between nested models with one additional degree of freedom). A backward elimination process should have been performed with a drop of OFV ≥ 6.64 corresponding to a significance level of p <.001, but no backward elimination was performed due to few covariates identified and tested during the forward inclusion. Continuous potential covariates were tested using a linear equation (Equation 1).
Categorical potential covariates coded as index variables that had values of 0 or 1 and were tested using Equation (2).
| (1) |
| (2) |
Non‐categorical potential covariates were tested using Equations (3)–(5).
| (3) |
| (4) |
| (5) |
2.3. Model validation
The final population PK model was validated with statistical and graphical tests, e.g. residual analysis and goodness‐of‐fit plots. For internal model validation, a bootstrap resampling method was conducted using 1000 replicates to test the stability of the model. Accuracy of the model was evaluated with visual predictive checks (VPC). For the VPC, a set of 200 simulated datasets were created to compare the observed concentration with the distribution of simulated concentrations.
2.4. Calculation of gastric emptying
The gastric emptying (GE) was calculated as the time to reach 50% of drug disappearance from the absorption compartments (T50). For paracetamol this was estimated as follows (Equation 6):
| (6) |
For atorvastatin, the T50 was derived from summarizing the mean of the disappearance curves of the transit and absorption compartments.
2.5. Nomenclature of targets and ligands
Key protein targets and ligands in this article are hyperlinked to corresponding entries in http://www.guidetopharmacology.org, the common portal for data from the IUPHAR/BPS Guide to PHARMACOLOGY, 24 and are permanently archived in the Concise Guide to PHARMACOLOGY 2019/20. 25
3. RESULTS
3.1. Base models development
The dataset used for model development included 503 paracetamol blood samples from 29 adult obese subjects. The characteristics of the subjects are shown in Table 1. The paracetamol data was best described by a two‐compartment distribution model see Figure 1. Interindividual variability on all parameters except for Cl2/F significantly improved the model, whereas models tested with inter‐occasion variability did not converge. To describe the absorption delay, a lag time absorption model, transit absorption model, Erlang type absorption, and Stirling approximation were investigated. 26
TABLE 1.
Mean demographic data available for modelling, range is given in parenthesis
| Paracetamol study | Atorvastatin study | |
|---|---|---|
| Number of samples | 503 | 713 |
| Number of subjects | 29 | 31 |
| Gender (Male/Female) | 20/9 | 15/16 |
| Age (years) | 42 (21–65) | 45 (25–55) |
| Bodyweight (kg) a | 102 (81.5–121) | 75.4 (53.6–102) |
| BMI (kg/m2) b | 33.2 (30.5–42.8) | 25.2 (20.4–29.8) |
Body weight at baseline.
BMI at baseline.
FIGURE 1.
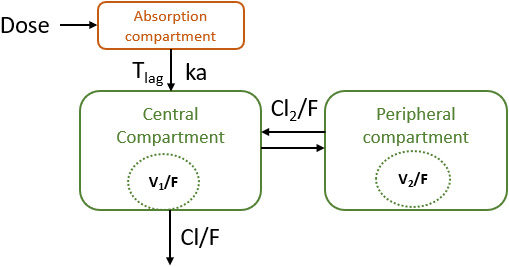
Structure of the final paracetamol model in healthy obese subjects following oral 1500 mg paracetamol administration. Tlag =lag time, ka: first order absorption rate constant. rate constant. Cl/F: clearance of paracetamol. Cl2/F: intercompartmental clearance. V1/f: central volume of distribution. V2/F: peripheral volume of distribution
Addition of a lag time to a two‐compartment model with first order absorption for paracetamol caused a drop in OFV of more than 200 points. Different hard coded transit compartment models with an optimum OFV for four transit compartment and three for Erlang transit compartments resulted in an increased ΔOFV of 6.29 and 56.95 compared to the lag time model. Thus, a lag time absorption model with first order oral absorption was selected as the base model for paracetamol.
For atorvastatin, the population PK‐model was based on 713 samples from 31 healthy adult subjects. The characteristics of the subjects are shown in Table 1. By analogy with paracetamol modeling atorvastatin data was best described by a two‐compartment model with first order absorption see Figure 2. Interindividual variability on all parameters except for Cl2/F significantly improved the model, whereas models tested with inter‐occasion variability did not converge. Similar absorptions models describing delayed absorption were tested.
FIGURE 2.
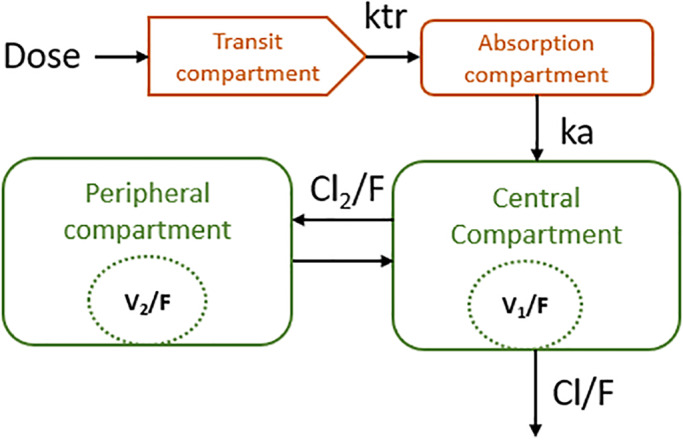
Structure of the final atorvastatin model in healthy subjects following oral 40 mg atorvastatin administration. ktr =transit compartment rate constant, ka: first order absorption rate constant, Cl/F: clearance of paracetamol. Cl2/F: intercompartmental clearance. V1/f: central volume of distribution. V2/F: peripheral volume of distribution
A lag time absorption model improved OFV significantly (ΔOFV = −71.24), whereas an absorption model with one transit compartment resulted in a 60.54‐point drop in OFV. However, the lag time model had a condition number above 1.5 ꞏ 104, suggesting model ill‐conditioning. For comparison, the transit compartment model had a condition number slightly above 1000. Transit compartment models with ka were tested with one to three transit compartments. Erlang transit compartment models without ka were also tested with one to three transit compartments. The model with one transit compartment lowered OFV the most (ΔOFV = −60.53) compared to the two‐compartment model with no first order absorption. However, the absorption model with one transit compartment and ka therefore provided the best description of the absorption phase for atorvastatin.
3.2. Covariate models development
For paracetamol, the systematic covariate analysis identified that the apparent volume of distribution V1/F was dependent on bodyweight as the most significant covariate (ΔOFV = −17.5). In addition, treatment (placebo vs. semaglutide co‐administration) was recognized as a covariate (ΔOFV = −5.20) for ka allometric scaling of the distribution parameters improved the OFV significantly (ΔOFV = −31), but the model did not converge. The model with V1/F dependent on bodyweight was estimated with a high precision (low RSEs) and was therefore preferred over the allometrically scaled model.
The covariate effect equation for paracetamol ka and V1/F was implemented in Phoenix modeling language (PML) as follows:
where tvka was the population estimate of ka. The term dKadplacebo1 (kacovariate in Table 2) was the parameter estimate for the fractional reduction of tvka, when semaglutide was co‐administered (equivalent to Placebo==1) in PML, when a placebo column in the data set was 1 for semaglutide co‐administration and 0 without semaglutide co‐administration.
TABLE 2.
Population pharmacokinetic parameter estimate from the final of paracetamol model
| Population parameters (θ) (Units) | Estimates | RSE % [Shrinkage%] | Bootstrap mean [95%CI] |
|---|---|---|---|
| ka (h−1) (Placebo) | 9.4 | 12.1 | 11.8 [6.2–27.8] |
| Θkacovariate | 0.525 | 20.0 | 0.534 [0.298–0.745] |
| V1/F (L) | 48.5 | 11.7 | 50.8 [28.6–83.3] |
| ΘV1/Fcovariate | 0.0312 | 12.8 | 0.0312 [0.0178–0.0456] |
| Cl/F (L/h) | 25.9 | 2.49 | 25.9 [24.1–27.7] |
| V2/F (L) | 55.4 | 6.95 | 53.6 [24.4–70.5] |
| Cl2/F (L/h) | 199 | 9.43 | 196 [83.2–271] |
| Tlag (h) | 0.16 | 7.40 | 0.17 [0.11–0.20] |
| Between subject variablity (ω2) | |||
| ω2 Ka | 0.514 | 35.3 [15] | 0.586 [0.212–1.31] |
| ω2 V1/F | 0.270 | 33.2 [16] | 0.280 [0.0672–0.713] |
| ω2 Cl/f | 0.0606 | 27.4 [5.7] | 0.0626 [0.033–0.111] |
| ω2 V2/F | 0.0703 | 26.8 [28] | 0.0936 [0.0187–0.32] |
| ω2 Tlag | 0.0586 | 34.7 [34] | 0.0467 [0.00783–0.187] |
| Residual unexplained variability (Ceps) | 0.094 | 10.5[20] | 0.0934 [0.0731–0.114] |
Abbreviations: Ceps, σ2 ; CI, Confidence Interval; Cl/F, oral clearance; Cl2 /F, intercompartmental clearance; ka, absorption rate constant; RSE %, Relative Standard Error; Tlag , lag time; V1 /F, central volume of distribution; V2 /F, peripheral volume of distribution.
For paracetamol, the V1/F dependency on body weight (BW) was coded in PML as follows:
The fixed parameter estimates of coefficients dKadplacebo1 an ( in Table 2) from were 0.525 and 0.0312, respectively. Thus, ka decreased with 53% from 9.4 h−1 to 4.4 h−1 when paracetamol was co‐administered with semaglutide. Concomitant administration with semaglutide reduced BSV from 0.66 to 0.51 in terms of variance (Omega2) for ka. For the apparent volume of distribution V1/F, the parameter coefficient showed that when body weight increased with one kg, V1/F increased with 3%. Bodyweight accounted for 34.4% of the BSV on V1/F. Finally, RUV was best described by a proportional error model as either an additive or a combined error model significantly improved the OFV. The final parameter estimates for the paracetamol population PK model are shown in Table 2.
For the atorvastatin model, allometric scaling 27 with body weight on the parameters V1/F, Cl/F, V2/F, and Cl2/F significantly improved model (ΔOFV = −22.42). Additionally, the best model to describe atorvastatin data was achieved with inclusion of the absorption parameters ka and transit compartment rate constant (ktr) dependent on semaglutide co‐administration (ΔOFV = −25.90 compared to allometric scale model). Covariates effects affecting atorvastatin ka and ktr were implemented in a similar way to ka for paracetamol in PML. For the disposition parameters, PML implementation of covariate body weight (BW) relation was as exemplified for oral clearance:
Example of volume of distribution:
The fixed parameter estimates of coefficients dKadplacebo and dKtrdplacebo were 0.829 and 0.791, respectively. Thus, when atorvastatin was co‐administered with semaglutide, the ka decreased with 83% from 5.72 h−1 to 0.986 h−1, and the transit compartment parameter ktr decreased with 79% from 7.28 h−1 to 1.52 h−1. Furthermore, the effect semaglutide caused a reduction in the BSV from 3.29 and 3.19 to 2.03 and 1.82 in terms of variance (Omega2) for ka and ktr, respectively. For atorvastatin, an additive or a combined error model did not significantly improve the OFV; therefore, RUV was best described by a proportional error model. The final parameter estimates for the atorvastatin population PK model are shown in Table 3.
TABLE 3.
Population pharmacokinetic parameter estimate from the final of atorvastatin model
| Population parameters (θ) (Units) | Estimates | RSE % [Shrinkage%] | Bootstrap mean [95%CI] |
|---|---|---|---|
| ka (h−1) (Placebo) | 5.72 | 23.5 | 6.56 [3.29–12.1] |
| Θkacovariate | 0.829 | 8.6 | 0.821 [0.649–0.925] |
| ktr (h−1) (Placebo) | 7.28 | 22.2 | 10.4 [4.48–44.0] |
| Θktrcovariate | 0.791 | 10.6 | 0.820 [0.629–0.972] |
| V1/F (L) a | 1843 | 13.3 | 1709 [1253–2224] |
| Cl/F (L/h) a | 620 | 5.86 | 617 [551–691] |
| V2/F(L) a | 4184 | 8.67 | 4229 [3573–4918] |
|
Cl2/F (L/h) a |
873 | 15.4 | 890 [668–1122] |
| Between subject variability (ω2) | |||
| ω2 Ka | 2.03 | 17.6 [31] | 2.21 [1.41–3.32] |
| ω2 Ktr | 1.82 | 35.8 [46] | 1.82 [0.390–3.17] |
| ω2 V1/F | 0.625 | 23.3 [21] | 0.517 [0.218–0.822] |
| ω2 Cl/f | 0.151 | 22.4 [2.7] | 0.140 [0.079–0.211] |
| ω2 V2/F | 0.111 | 22.1 [19] | 0.110 [0.0655–0.172] |
| Residual unexplained variability (Ceps) | 0.322 | 4.67 [13] | 0.322 [0.292–0.353] |
Abbreviations: Ceps, σ2 ; CI, Confidence Interval; Cl/F, oral clearance; Cl2 /F, intercompartmental clearance; ka, absorption rate constant; ktr, transit compartment rate constant; RSE, Relative Standard Error; V1 /F, central volume of distribution; V2 /F, peripheral volume of distribution.
For an individual of 75 kg.
3.3. Model evaluations
For both models, all parameters could be estimated with good precision (RSE < 30% Tables 2 and 3) and generally, shrinkage was below 25% except for the parameters Tlag (34%) in the paracetamol model and ka (31%) and ktr (46%) in the atorvastatin model. However, removal of BSV on Tlag for paracetamol and on ka and ktr for the atorvastatin model increased the OFV and the models did not converge. Therefore, BSV on these parameters remained in the models (Tables 2 and 3). The LRT revealed a significant drop of ΔOFV from base model to final model, 17.9 for paracetamol and 25.9 for atorvastatin. For both final models, diagnostic plot indicated correlations between the BSV of Cl/F and V1/F. This was tested and although there was a significant drop in OFV, the models did not converge so BSV correlation was not included in the final models. Furthermore, the basic goodness of fit plots was all acceptable (See Figures 3 and 4).
FIGURE 3.
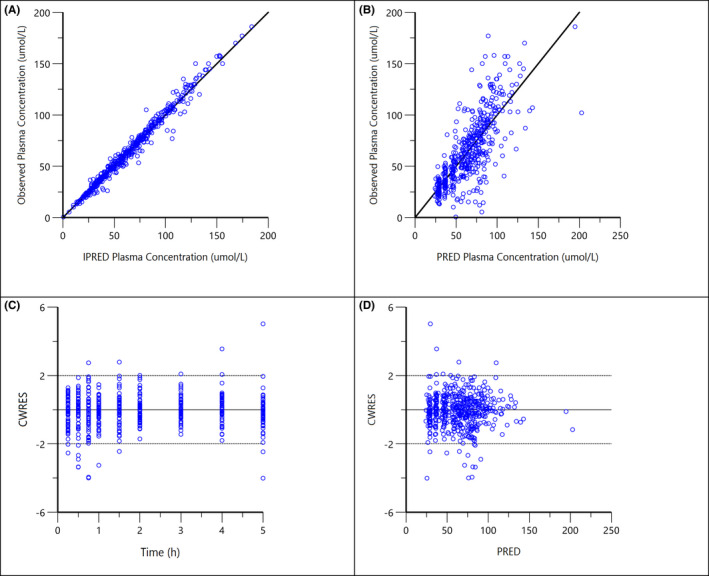
Diagnostic plots for the final population PK model of paracetamol: (A) observed concentrations vs. individual predicted concentrations (IPRED); (B) observed concentrations vs. population predicted concentrations (PRED); (C) conditional weighted residuals (CWRES) vs. time after dose; (D) CWRES vs. population predicted concentrations (PRED)
FIGURE 4.
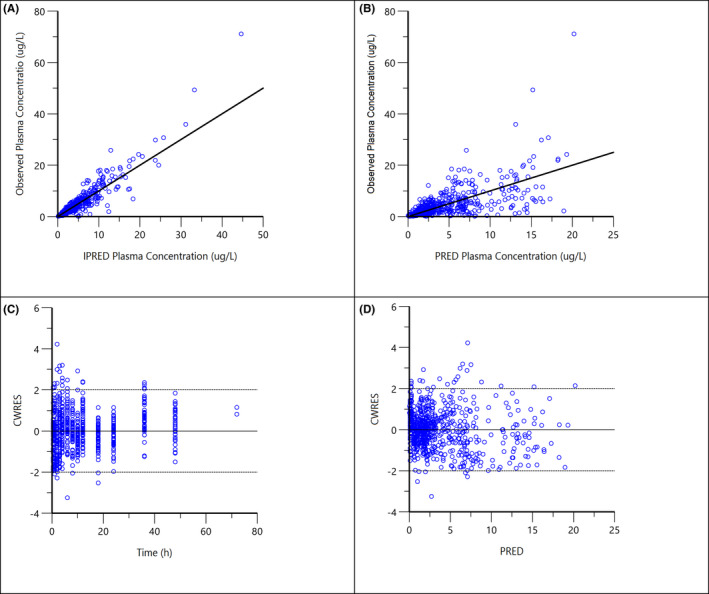
Diagnostic plots for the final population PK model of atorvastatin: (A) observed concentrations vs. individual predicted concentrations (IPRED); (B) observed concentrations vs. population predicted concentrations (PRED); (C) conditional weighted residuals (CWRES) vs. time after dose; (D) CWRES vs. population predicted concentrations (PRED)
The VPC plot, depicted in Figures 5 and 6, indicates an overall good predictive performance of the paracetamol and atorvastatin models. Figure 5 shows a small bias occurring in the time points <2.0 h after sampling, influencing the predictive performance. This was caused by a single subject with an unexplainably low exposure. A sensitivity analysis without the low exposure subject showed no impact on population mean parameters and all subjects remained in the analysis to truly represent the variability of the population.
FIGURE 5.
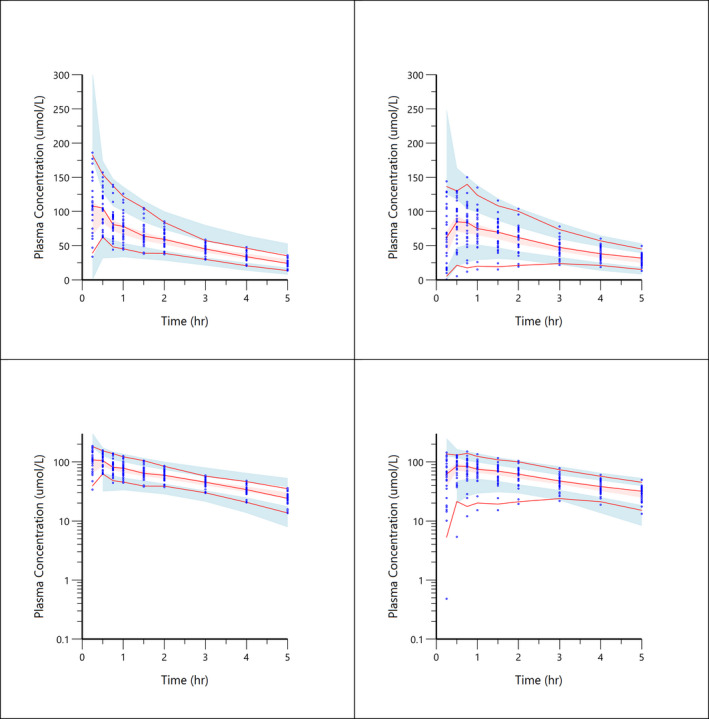
Visual predictive check plots for paracetamol concentration‐time data. Top left shows paracetamol combined with placebo. Top right shows paracetamol co‐administration with semaglutide. Low left shows paracetamol combined with placebo on a log scale. Lower right shows paracetamol co‐administration with semaglutide on a log scale. Solid red line represents the 5th, median and 95th quantiles of the observed data; shaded areas represent the 95% prediction intervals for corresponding simulated data
FIGURE 6.
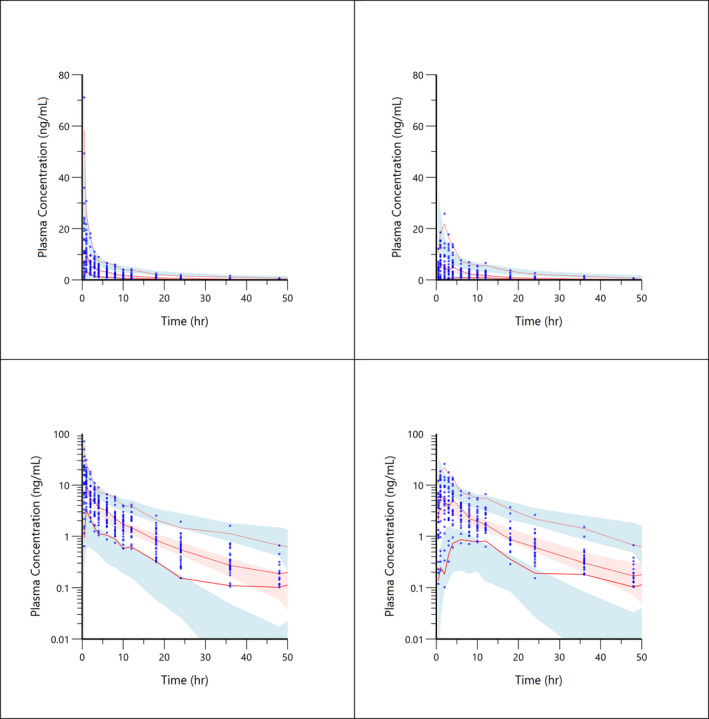
Visual predictive check plots for atorvastatin concentration‐time data. Top left shows atorvastatin combined with placebo. Top right shows atorvastatin co‐administration with semaglutide. Low left shows atorvastatin combined with placebo on a log scale. Lower right shows atorvastatin co‐administration with semaglutide on a log scale. Solid red line represents the 5th, median and 95th quantiles of the observed data; shaded areas represent the 95% prediction intervals for corresponding simulated data
Furthermore, bootstrap values for both models confirmed the model stability (Tables 2 and 3).
3.4. Gastric emptying rate
After administration of paracetamol alone, the mean T50 was estimated to 0.23 h (14 min), whereas the mean T50 was 0.31 h (19 min) when administered together with semaglutide. This results in a mean difference in drug absorption delay of 5 min when comparing placebo vs. semaglutide co‐administration. Figure 7 illustrates the effect of semaglutide on the mean percent gastric retention (GR[t]) when plotted against time. Here, GR[t] are derived from the model‐based ka‐value assuming that GER can be assessed as the rate of paracetamol absorption. 15
FIGURE 7.
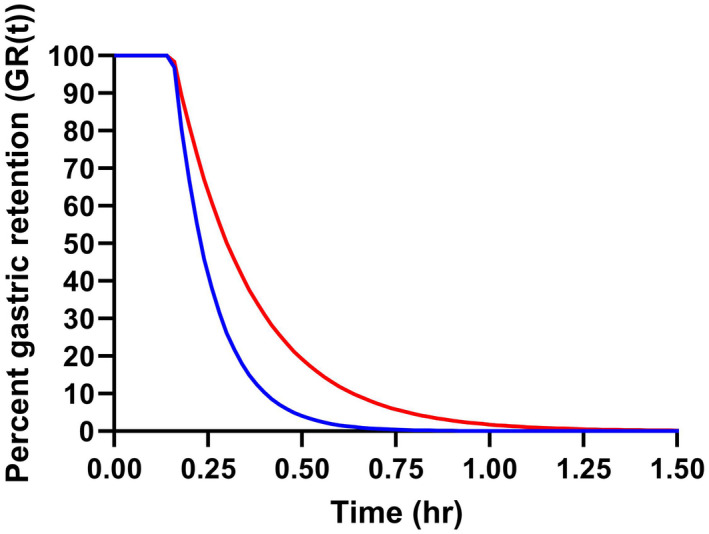
Percent gastric retention (GR[t]) versus time. The curves were generated by the mean population parameter estimates of paracetamol assuming that the drug disappearance from the absorption compartments can be assessed as the rate of paracetamol absorption. The solid blue and red line represent gastric retention of paracetamol administered with placebo (T50 = 0.23 h) or semaglutide (T50 = 0.31 h), respectively
Like paracetamol, the mean GR[t] for atorvastatin can be derived from the model‐based typical values of ktr and ka as shown in Figure 8. When atorvastatin was administered without semaglutide, the T50 estimate was 16 min, and a mean value of 83 min for T50 was estimated for atorvastatin when administered with semaglutide. This results in a mean difference of 67 min in drug absorption delay when comparing placebo vs. semaglutide co‐administration.
FIGURE 8.
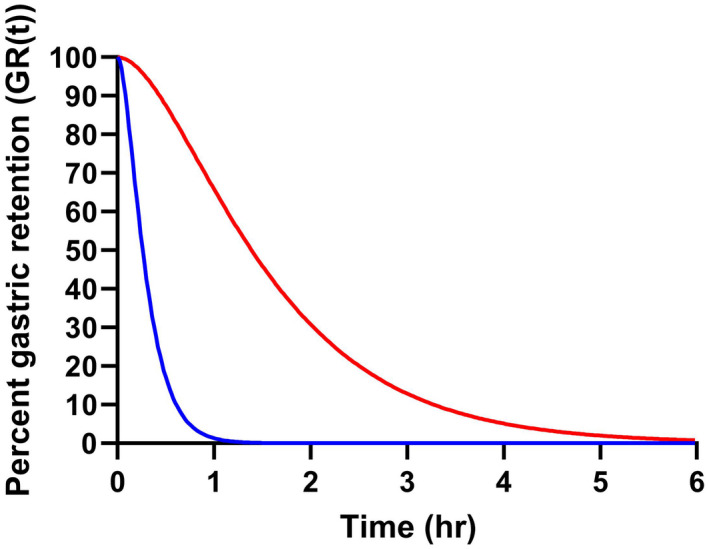
Percent gastric retention (GR[t]) versus time. The curves were generated by the mean population parameter estimates of atorvastatin assuming that the drug disappearance from the absorption compartments can be assessed as the rate of passing the transit (ktr) and absorption (ka) of atorvastatin. The solid blue and red line represent gastric retention of atorvastatin administered with placebo (T50 = 0.22 h) or semaglutide (T50 = 1.38 h), respectively
4. DISCUSSION
This analysis aimed to investigate if decreasing effect on the GER caused by long‐acting GLP‐1 analogue, could alter the rate of absorption of orally co‐administered drugs, such as paracetamol and atorvastatin. Using population PK models, this analysis quantified GER by estimating the mean gastric retention time [GR(t)] from the model absorption parameters.
The two‐compartment model identified for paracetamol in this analysis is in line with models obtained from previous analysis when adjusted for body weight differences. 28 , 29 In young adults with a body weight range of 62–84 kg, a two‐compartment model with first order absorption was described for immediate release tablets where V1/F = 30.7 L and V2/F = 19.9 L. 28 Correlation between body weight and the apparent volume of distribution V1/F of paracetamol have previously been reported. 28 The ka of 4.33 h−1 for immediate release tablets found by Jiang et al., 28 was close to the current finding where paracetamol was blended in yoghurt. Following dosing with 80 mg/kg paracetamol, the oral clearance of 11.1 L/h for a young adult weighing 70 kg was reported by Jiang et al. 28 This was close to the present CL/F of 25.9 L/h considering the, on average, lower dose of 15 mg/kg used in the current analysis. Further, intravenous CL of 17 L/h from population PK analysis in elderly people have also been reported. 29 However, our estimate of intercompartmental clearance Cl2/F was 199 L/h compared to 22.2 L/kg previously described. 28
The effect of semaglutide on the mean percent gastric retention (GR[t]) plotted against time can be depicted as seen in Figure 7, where GR[t] are derived from the model base ka’s assuming that GER can be assessed as the rate of paracetamol absorption. 15 Calculation of the time it takes before 50% of the gastric content has been emptied (T50) demonstrates that paracetamol with placebo administration has a mean T50 of 0.23 h (14 min) and paracetamol in concomitant administration with semaglutide has a mean T50 of 0.31 h (19 min). That gives a difference of five min absorption delay of T50 when comparing placebo vs. semaglutide co‐administration, suggesting that effect from delayed GER by semaglutide on paracetamol absorption rate is not clinically relevant. These findings of only a five minutes absorption delay on paracetamol treatment vs placebo treatment at semaglutide steady state seem to comply with the suggested tachyphylaxis from other studies arising from GLP‐1 analogues with a diminish effect on GER over time. 9 , 29 , 30 , 31 It has been suggested that the signs of tachyphylaxis develops from desensitised GLP‐1 receptors. 9
Based on the study design of current study conclusion cannot be drawn on semaglutides effect on absorption parameter ka, Cmax and GER when semaglutide exposure is shorter than 13 weeks of treatment. That would need further investigation with a study design that allows more frequent pharmacokinetic measurement during semaglutide dose escalation. To our knowledge no studies on long‐acting GLP‐1 analogues have evaluated the effect on GER during the dose escalation phase. The GER inhibiting effect has only been investagated during dose ecsalation on short acting GLP‐1 analogues. 32 , 33
The final model for atorvastatin identified an effect of semaglutide on the absorption parameter ka and the transit compartment parameter ktr. The absorption parameter ka decreased with 72% from 4.8 h‐1 to 1.3 h‐1 when atorvastatin was co‐administered with semaglutide. Additionally, the transit compartment parameter ktr decreased with 91% from 7.0 h‐1 to 1.3 h‐1.
Mean population PK parameter estimates in this current model was close to estimates found in previous analysis. A population PK model developed by Narwal et al. 34 found that atorvastatin was best described by a 2‐compartment distribution with the dominant lactone metabolite accounting for all the elimination. In the present model the lactone metabolite was not included but assuming that the lactone conversion was 1:1 then it is comparable with previous findings. 34 The latter investigation reported the following mean population model parameters: ka of 3.5 h‐1, V1/F of 3250 L, V2/F of 2170 L, Cl/F of 504 L/h and Cl2/F of 1880 L/h, respectively. These values are close to the values estimated in the current study where ka = 5.7 h‐1, ktr = 7.3 h‐1, V1/F = 1843 L, V2/F = 4184 L, Cl/F = 620 L/h and Cl2/F = 873 L/h, respectively, where the clearance and volume are estimates for a 75 kg individual.
The fact that model fit of atorvastatin was improved with the usage of size adjusted allometric scaling of clearance and volume parameters, complies with allometric scaling being a useful tool to adjust dosage between different sizes. 27 In our population PK analyse some parameters were estimated with uncertainty such as ka and ktr were we found with slightly elevated shrinkage values of 31.2% and 46.0%, respectively. The high η‐shrinkage values are probably caused by sparse plasma sample schedule during the absorption phase similar to that of paracetamol that makes it difficult to estimate BSV. 35 Therefore, covariate effects on these parameters should be interpreted with caution. 35 , 36 Yet a reduction of BSV for both absorption parameters ka and ktr was observed with introduction of covariates. The relative reduction of BSV justifies the maintenance of covariates in the final model.
As for paracetamol GR[t] for atorvastatin can derived from the model based typical values of ktr and ka as shown in Figure 8, where difference at T50 was a 70 min absorption delay when comparing placebo vs. semaglutide co‐administration. Atorvastatin is a BCS Class II with high permeability, low solubility, 37 thus, it was expected that semaglutide might cause a more pronounced effect on absorption parameters and GER compared to a BCS Class I compound such as Paracetamol. For the latter gastric emptying can be assumed to be the rate‐limiting step for intestinal absorption without delay the of the dissolution process. 38
In contrast to our finding, the underlying physiological reason for semaglutide not affecting the absorption of atorvastatin as initially assumed, could be the metabolization pathway. According to Morse et al., 20 a spontaneous formation of the inactive lactone metabolites occurs in the stomach at low pH. The spontaneous formation of the lactone metabolites increases the lactone formation which contributes to a lower Cmax and shorter tmax of atorvastatin. Because the lactone metabolites are unstable at plasma pH of 7.4, they will convert back to atorvastatin when reaching the systemic circulation and overall exposure will remain the same independent of reduced GE. 20 Other studies have found an altered absorption for atorvastatin with decreased GER and conclude that the changed absorption has no clinical relevance, since the total exposure was not changed. 4 , 20 , 30
Opposite to paracetamol, atorvastatin is often a life‐long treatment which means that the plasma concentrations are stable. 18 Furthermore, the US National Lipid Association concluded that for only every 15th million statin prescription the adverse events are very harmful and overweighs the clinical benefits. The most frequent adverse event is myalgia and is mainly observed with the highest dose regimen of 80 mg daily. 39 Based on the well‐established safety profile and the constant overall exposure of atorvastatin given with or without GLP‐1 analogues, the current analysis suggests that the effect on the absorption by co‐administration with semaglutide does not require changes to the current recommended treatment regimen or indicate new considerations regarding dose regimen.
Even though all parameters in the model could be estimated with a good precision (RSE <30% Table 2 and Table 3), and that bootstrap results confirmed the model stability, some model uncertainties have been revealed due to study limitations. The results of the current modeling face some shortcomings in the applied sampling schedule, especially in the initial phase making estimation absorption parameter and BSV difficult. Therefore, covariate effects should be interpreted with caution. 35 , 36 However, model diagnostics justify the maintenance of covariates in the final model. Future studies with optimized sampling schedules are warranted.
5. CONCLUSION
In conclusion, alteration of primary oral absorption model parameters were observed for both paracetamol and atorvastatin when co‐administered with semaglutide. Quantification of GER was obtained. Both data set can best be described by a 2‐comparment model.
Treatment with semaglutide was found as a significant covariate in the paracetamol model and ka decrease by 53% when co‐administered with semaglutide at steady state. Body weight contributed to the paracetamol V1/F variability, causing it to increase by 3% in a linear manner when bodyweight increased with 1 kg. The ka and ktr for atorvastatin decreased by 83% and 79%, respectively, when atorvastatin was co‐administered with semaglutide. Allometric scaling of disposition parameters with body weight significantly improved the atorvastatin model.
Gastric emptying rate showed an additional 5‐min delay for paracetamol and a 67‐min delay for atorvastatin when administered together with semaglutide. None of the covariate effects identified were considered to be of clinical relevance and no new safety issues with regards to drug–drug interaction were raised. This suggests that atorvastatin and paracetamol are well tolerated when co‐administered with semaglutide.
DISCLOSURE
Emilie Langeskov has nothing to disclose. Kim Kristensen is an employee and owner of shares of Novo Nordisk A/S that produces semaglutide for the treatment of type 2 diabetes.
AUTHOR CONTRIBUTION
EL performed and interpreted the analysis. KK was involved in the interpretation of the analysis. EL and KK wrote, reviewed and approved the final manuscript.
ACKNOWLEDGEMENTS
Novo Nordisk A/S is acknowledged for providing access to the data on file present here. Doctors Joakim Isendahl, Lisbeth Vestergaard Jacobsen, Margit Staum Kaltoft, Desirée Thielke, and Mads Bjelke are thanked for their excellent review and discussion of the final manuscript.
Langeskov EK, Kristensen K. Population pharmacokinetic of paracetamol and atorvastatin with co‐administration of semaglutide. Pharmacol Res Perspect. 2022;10:e00962. doi: 10.1002/prp2.962
DATA AVAILABILITY STATEMENT
Data sharing not applicable as no new datasets were generated. The original studies is registered at ClinicalTrials.gov with identifier NCT02079870 and NCT02243098.
REFERENCE
- 1. Khan MAB, Hashim MJ, King JK, Govender RD, Mustafa H, Al KJ. Epidemiology of type 2 diabetes ‐ global burden of disease and forecasted trends. J Epidemiol Glob Health. 2020;10(1):107‐111. [DOI] [PMC free article] [PubMed] [Google Scholar]
- 2. Pfeiffer AF, Klein HH. The treatment of type 2 diabetes. Dtsch Arztebl Int. 2014;111(5):69‐81. [DOI] [PMC free article] [PubMed] [Google Scholar]
- 3. Inzucchi SE, Bergenstal RM, Buse JB, et al. Management of hyperglycaemia in type 2 diabetes, 2015: a patient‐centred approach. Update to a position statement of the American Diabetes Association and the European Association for the Study of Diabetes. Diabetologia. 2015;58(3):429‐442. [DOI] [PubMed] [Google Scholar]
- 4. Hausner H, Derving Karsbøl J, Holst AG, et al. Effect of semaglutide on the pharmacokinetics of metformin, warfarin, atorvastatin and digoxin in healthy subjects. Clin Pharmacokinet. 2017;56(11):1391‐1401. [DOI] [PMC free article] [PubMed] [Google Scholar]
- 5. Miholic J, Orskov C, Holst JJ, Kotzerke J, Meyer HJ. Emptying of the gastric substitute, glucagon‐like peptide‐1 (GLP‐1), and reactive hypoglycemia after total gastrectomy. Dig Dis Sci. 1991;36(10):1361‐1370. [DOI] [PubMed] [Google Scholar]
- 6. Wettergren A, Schjoldager B, Mortensen PE, Myhre J, Christiansen J, Holst JJ. Truncated GLP‐1 (proglucagon 78–107‐amide) inhibits gastric and pancreatic functions in man. Dig Dis Sci. 1993;38(4):665‐673. [DOI] [PubMed] [Google Scholar]
- 7. Schirra J, Katschinski M, Weidmann C, et al. Gastric emptying and release of incretin hormones after glucose ingestion in humans. J Clin Invest. 1996;97(1):92‐103. [DOI] [PMC free article] [PubMed] [Google Scholar]
- 8. Hjerpsted JB, Flint A, Brooks A, Axelsen MB, Kvist T, Blundell J. Semaglutide improves postprandial glucose and lipid metabolism, and delays first‐hour gastric emptying in subjects with obesity. Diabetes Obes Metab. 2018;20(3):610‐619. [DOI] [PMC free article] [PubMed] [Google Scholar]
- 9. Parker VER, Robertson D, Wang T, et al. Efficacy, safety, and mechanistic insights of cotadutide, a dual receptor glucagon‐like peptide‐1 and glucagon agonist. J Clin Endocrinol Metab. 2020;105(3):803‐820. [DOI] [PubMed] [Google Scholar]
- 10. Hellstrom PM, Gryback P, Jacobsson H. The physiology of gastric emptying. Best Pract Res Clin Anaesthesiol. 2006;20(3):397‐407. [DOI] [PubMed] [Google Scholar]
- 11. Suenderhauf C, Tuffin G, Lorentsen H, Grimm HP, Flament C, Parrott N. Pharmacokinetics of paracetamol in Gottingen minipigs: in vivo studies and modeling to elucidate physiological determinants of absorption. Pharm Res. 2014;31(10):2696‐2707. [DOI] [PubMed] [Google Scholar]
- 12. Sanaka M, Nakada K. Paracetamol absorption test with Wagner‐Nelson analysis for safe and accurate measurements of gastric emptying in women. Methods Find Exp Clin Pharmacol. 2008;30(10):753‐756. [DOI] [PubMed] [Google Scholar]
- 13. Rubbens J, Mols R, Brouwers J, Augustijns P. Exploring gastric drug absorption in fasted and fed state rats. Int J Pharm. 2018;548(1):636‐641. [DOI] [PubMed] [Google Scholar]
- 14. Medhus AW, Lofthus CM, Bredesen J, Husebye E. Gastric emptying: the validity of the paracetamol absorption test adjusted for individual pharmacokinetics. Neurogastroenterol Motil. 2001;13(3):179‐185. [DOI] [PubMed] [Google Scholar]
- 15. Bartholomé R, Salden B, Vrolijk MF, et al. Paracetamol as a post prandial marker for gastric emptying, a food‐drug interaction on absorption. PLoS One. 2015;10(9):e0136618. [DOI] [PMC free article] [PubMed] [Google Scholar]
- 16. McCreight LJ, Bailey CJ, Pearson ER. Metformin and the gastrointestinal tract. Diabetologia. 2016;59(3):426‐435. [DOI] [PMC free article] [PubMed] [Google Scholar]
- 17. Vidon N, Chaussade S, Noel M, Franchisseur C, Huchet B, Bernier JJ. Metformin in the digestive tract. Diabetes Res Clin Pract. 1988;4(3):223‐229. [DOI] [PubMed] [Google Scholar]
- 18. Lennernas H. Clinical pharmacokinetics of atorvastatin. Clin Pharmacokinet. 2003;42(13):1141‐1160. [DOI] [PubMed] [Google Scholar]
- 19. Malm‐Erjefalt M, Ekblom M, Vouis J, Zdravkovic M, Lennernas H. Effect on the gastrointestinal absorption of drugs from different classes in the biopharmaceutics classification system, when treating with liraglutide. Mol Pharm. 2015;12(11):4166‐4173. [DOI] [PubMed] [Google Scholar]
- 20. Morse BL, Alberts JJ, Posada MM, et al. Physiologically‐based pharmacokinetic modeling of atorvastatin incorporating delayed gastric emptying and acid‐to‐lactone conversion. CPT Pharmacometrics Syst Pharmacol. 2019. [DOI] [PMC free article] [PubMed] [Google Scholar]
- 21. European Agency for the Evaluation of Medicinal Products . International Conference on Harmonisation‐World Health Organization. Guideline for Good Clinical Practice [EMEA Web site]. ICH Harmonised Tripartite Guideline. Good Clinical Practice, 2017. Accessed September 17, 2021. https://www.ema.europa.eu/en/documents/scientific‐guideline/ich‐e‐6‐r2‐guideline‐good‐clinical‐practice‐step‐5_en.pdf
- 22. World Medical Association . Declaration of Helsinki. Ethical Principles for Medical Research Involving Human Subjects. 52nd WMA General Assembly, Edinburgh, Scotland, October 2000. Last amended with Note of Clarification on Paragraph 29 by the WMA General Assembly, Washington 2002; and Note of Clarification on Paragraph 30 by the WMA General assembly, Tokyo, 2004. Accessed September 17, 2021. https://www.wma.net/wp‐content/uploads/2016/11/DoH‐Oct2013‐JAMA.pdf
- 23. Nguyen THT, Mouksassi M‐S, Holford N, et al. Model evaluation of continuous data pharmacometric models: metrics and graphics. CPT Pharmacometrics Syst Pharmacol. 2017;6(2):87‐109. [DOI] [PMC free article] [PubMed] [Google Scholar]
- 24. Harding SD, Sharmanm JL, Faccenda E, et al. The IUPHAR/BPS guide to PHARMACOLOGY in 2019: updates and expansion to encompass the new guide to IMMUNOPHARMACOLOGY. Nucleic Acids Res. 2018;46:D1091‐D1106. [DOI] [PMC free article] [PubMed] [Google Scholar]
- 25. Alexander SP, Fabbro D, Kelly E, et al. The concise guide to pharmacology 2021/22: enzymes. Br J Pharmacol. 2021;178(Suppl 1):S313‐S411. [DOI] [PubMed] [Google Scholar]
- 26. Savic RM, Jonker DM, Kerbusch T, Karlsson MO. Implementation of a transit compartment model for describing drug absorption in pharmacokinetic studies. J Pharmacokinet Pharmacodyn. 2007;34(5):711‐726. [DOI] [PubMed] [Google Scholar]
- 27. Holford NH. A size standard for pharmacokinetics. Clin Pharmacokinet. 1996;30(5):329‐332. [DOI] [PubMed] [Google Scholar]
- 28. Jiang S, Madrasi K, Samant T, et al. Population pharmacokinetic modeling of acetaminophen protein adducts in adults and children. J Clin Pharmacol. 2020;60(5):595‐604. [DOI] [PMC free article] [PubMed] [Google Scholar]
- 29. Mian P, Esdonk MJ, Olkkola KT, et al. Population pharmacokinetic modelling of intravenous paracetamol in fit older people displays extensive unexplained variability. Br J Clin Pharmacol. 2019;85(1):126‐135. [DOI] [PMC free article] [PubMed] [Google Scholar]
- 30. de la Pena A, Cui X, Geiser J, Loghin C. No dose adjustment is recommended for digoxin, warfarin, atorvastatin or a combination oral contraceptive when coadministered with dulaglutide. Clin Pharmacokinet. 2017;56(11):1415‐1427. [DOI] [PubMed] [Google Scholar]
- 31. Urva S, Coskun T, Loghin C, et al. The novel dual glucose‐dependent insulinotropic polypeptide and glucagon‐like peptide‐1 (GLP‐1) receptor agonist tirzepatide transiently delays gastric emptying similarly to selective long‐acting GLP‐1 receptor agonists. Diabetes Obes Metab. 2020;22(10):1886‐1891. [DOI] [PMC free article] [PubMed] [Google Scholar]
- 32. van Can J, Sloth B, Jensen CB, Flint A, Blaak EE, Saris WH. Effects of the once‐daily GLP‐1 analog liraglutide on gastric emptying, glycemic parameters, appetite and energy metabolism in obese, non‐diabetic adults. Int J Obes (Lond). 2014;38(6):784‐793. [DOI] [PMC free article] [PubMed] [Google Scholar]
- 33. Kapitza C, Bode B, Ingwersen SH, Jacobsen LV, Poulsen P. Preserved pharmacokinetic exposure and distinct glycemic effects of insulin degludec and liraglutide in IDegLira, a fixed‐ratio combination therapy. J Clin Pharmacol. 2015;55(12):1369‐1377. [DOI] [PubMed] [Google Scholar]
- 34. Narwal R, Akhlaghi F, Asberg A, Hermann M, Rosenbaum SE. Development of a population pharmacokinetic model for atorvastatin acid and its lactone metabolite. Clin Pharmacokinet. 2010;49(10):693‐702. [DOI] [PubMed] [Google Scholar]
- 35. Yin Y‐M, Cui F‐D, Kim JS, et al. Preparation, characterization and in vitro intestinal absorption of a dry emulsion formulation containing atorvastatin calcium. Drug Deliv. 2009;16(1):30‐36. [DOI] [PubMed] [Google Scholar]
- 36. Van Den Abeele J, Rubbens J, Brouwers J, Augustijns P. The dynamic gastric environment and its impact on drug and formulation behaviour. Eur J Pharm Sci. 2017;96:207‐231. [DOI] [PubMed] [Google Scholar]
- 37. Arca M. Atorvastatin: a safety and tolerability profile. Drugs. 2007;67(Suppl 1):63‐69. [DOI] [PubMed] [Google Scholar]
- 38. Mould DR, Upton RN. Basic concepts in population modeling, simulation, and model‐based drug development. CPT Pharmacometrics Syst Pharmacol. 2012;1:e6. [DOI] [PMC free article] [PubMed] [Google Scholar]
- 39. Byon W, Smith MK, Chan P, et al. Establishing best practices and guidance in population modeling: an experience with an internal population pharmacokinetic analysis guidance. CPT Pharmacometrics Syst Pharmacol. 2013;2:e51. [DOI] [PMC free article] [PubMed] [Google Scholar]
Associated Data
This section collects any data citations, data availability statements, or supplementary materials included in this article.
Data Availability Statement
Data sharing not applicable as no new datasets were generated. The original studies is registered at ClinicalTrials.gov with identifier NCT02079870 and NCT02243098.


