

Abstract
Subway carriages are enclosed for extended periods of time, with a high density of passengers. Providing a safe, healthy, and comfortable cabin environment is a great challenge, particularly during the COVID-19 pandemic. An increase in ventilation rate can potentially reduce infection probability, which may result in worsening environmental quality (e.g., thermal comfort) and larger energy consumption. Thus, exploring the trade-off among infection risk, environmental quality (with regard to ventilation, thermal comfort, and air quality), and energy consumption is important to optimize ventilation systems for carriages. The effect of different supply air parameters (e.g., velocity and temperature) and ventilation modes of mixing ventilation (MV) & Supply air from the Floor and Return air from the Ceiling (SFRC) was studied. The questionnaires were analyzed to explore passenger dissatisfaction with the carriage environment using a MV system. Simulations were performed to predict the velocity, temperature, and CO2 concentration fields. In addition, the comprehensive benefit was evaluated by analytic hierarchy process (AHP), based on infection probability from the revisited Wells–Riley equation, Air Diffusion Performance Index (ADPI), Predicted Mean Vote (PMV), Pollutant Removal Effectiveness (PRE) and energy consumption estimated by cooling load (Lcool). Compared with MV, the optimized SFRC provided softer draft sensation and decreased CO2 concentration by 42%. The SFRC achieved better comprehensive benefits, with an infection risk reduced to 0.4%, ADPI of 80%, PMV approaching zero, PRE up to 16, and energy efficiency increased by 30%. This work contributes to the optimal design of subway carriage ventilation systems in the post-epidemic era.
Keywords: Subway carriage, Infection risk, Ventilation, Thermal comfort, Air quality, Energy efficiency
1. Introduction
Underground rail networks play an important role in public transportation [1]. Given the considerable growth in urban construction demands and commuters, the number and mileage of subway metros have been increasing [2]. At the end of 2020, 38 cities in China had metro lines with a total length of 6,281 km [3]. The subway runs underground for extended periods of time, leading to carriages in a confined state with a high density and mobility of passengers [4]. With the emergency of the coronavirus disease 2019 (COVID-19) pandemic, the main challenges in providing a safe, comfortable and energy-efficient subway carriage environment are investigated to mitigate infection transmission, control the environment, and reduce energy consumption [5]. Thus, exploring the trade-off among the infection risk, environment, and energy efficiency of subway train systems is important.
The control of ventilation systems in subway carriages can reduce the infection probability of passengers at different levels, including supply air parameters (e.g., velocity and temperature) and ventilation modes. At present, mixing ventilation (MV) of Supply air from the Ceiling and Return air from the Ceiling is usually utilized in subway carriages and set with constant supply air parameters [4]. However, in relatively closed and crowded cabins, conventional MV systems are less effective in providing a safe and healthy environment [6]. Moreno et al. modelled the probability of infection in subway trains under different scenarios, which indicated that forced ventilation with a larger ventilation rate greatly reduced the risk [7]. By optimizing the ventilation mode, Liu et al. found that the infection risk when using displacement ventilation (DV) was 15% lower than that when using the traditional MV system in cabins [8]. Hence, the control strategy for ventilation systems could mitigate the transmission of infection diseases in subway carriages.
Ventilation systems for subway trains primarily control the environment, including draft sensation, thermal comfort, and air quality [9,10]. These factors are related to the supply air parameters, namely, velocity and temperature. EI-Salamony et al. evaluated the impact of inlet velocity on the spread of pollutants in subway passenger compartments, which indicated that increasing the inlet airflow rate considerably improved air quality [11]. Suárez et al. investigated passenger comfort percentages could increase with supply air temperature in a railway vehicle under summer operating conditions [12]. However, the control of ventilation systems, such as a large increase in supply air velocity, may deteriorate the cabin environment (e.g., draft sensation and thermal comfort) and increase ventilation energy consumption. The unreasonable design of supply air parameters potentially leads to the inefficiency or ineffectiveness of subway carriage ventilation systems. In addressing this issue, updating ventilation modes can be performed to regulate the environment. For example, the DV system has been validated by Luo et al. [13] and Liu et al. [14], to improve ventilation performance and thermal comfort in enclosed spaces while mitigating the transmission of pollutants. Nevertheless, few studies have been conducted on the application of this type of ventilation system for environmental control of subway cabins. Thus, simultaneous with reducing the infection risk, controlling supply air parameters of ventilation systems is necessary and the optimization of different ventilation modes must be combined to obtain a safe, healthy and comfortable subway carriage environment.
Studies have reported that ventilation system control can provide energy-saving potential by optimizing supply air parameters (e.g., lowering velocity or temperature) and ventilation modes [[15], [16], [17]]. However, the reduction of energy consumption for ventilation systems is premised on the safety, health, and comfort demands of passengers [3,10]. The pursuit of energy efficiency at the expense of infection risk and environmental benefits may lead to a lack of reasonableness in ventilation design, particularly in the post-epidemic era. Thus, exploring the coordination among the control of infection transmission, environmental improvement, and energy saving for subway ventilation systems has been a major challenge [18]. Numerous investigations have focused on subway platforms and tunnel ventilation systems [19,20]. Few studies have been conducted on the integrated benefits of infection risk, environment, and energy efficiency in subway cabins. Thus, developing a comprehensive benefit assessment model applicable to ventilation systems of subway carriage is important to improve safety, comfort, and energy-saving performance.
This study aimed to evaluate the comprehensive benefits of (ventilation, thermal and pollutant) environments, infection risk, and cooling load (for energy consumption) in subway carriages based on the effects of different ventilation systems. Fig. 1 shows a flowchart of this study. A questionnaire method was utilized to analyze the levels of draft sensation, thermal comfort, and air quality satisfaction of passengers in subway carriages using the traditional MV system. Different supply air parameters (velocity and temperature) and ventilation modes of MV and Supply air from the Floor and Return air from the Ceiling (SFRC) were considered for the optimal ventilation system design. Simulations were performed to predict the distribution of velocity, temperature and pollutant concentration under the influence of different ventilation systems. A comprehensive benefit assessment method was proposed on the basis of quantitative analysis of air distribution performance, thermal comfort, pollutant removal efficiency, infection probability and energy consumption (estimated by cooling load) to determine the optimal ventilation system. This work was performed in accordance with the guidelines of the subway train ventilation design for urban railway systems during the normalization phase of the epidemic.
Fig. 1.

General framework of this study.
2. Materials and methods
In this work, questionnaire survey, experiment and numerical simulation were used. A questionnaire survey was conducted to analyze the ventilation environment, passenger thermal comfort and air quality satisfaction under the traditional MV system in subway carriages. Experimental measurements were conducted to verify the feasibility of the simulation model. Numerical simulation method was used to investigate the effects of different ventilation modes and supply air parameters on the distribution of velocity, temperature and CO2 concentration in the carriage. In addition, various evaluation models were utilized to quantify the comprehensive performance of environmental parameters (i.e., air distribution, thermal comfort and pollutant removal efficiency), infection probability and cooling load (for energy consumption).
2.1. Investigated subway carriage
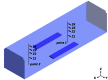
Subway Line 1 of the Suzhou Metro was investigated, with a total of 24 underground stations. The train of Line 1 was formed in four carriages, of which the internal size was 30 m (length) × 2.5 m (width) × 2.2 m (height). Fig. 2 shows a schematic diagram of metro routes (from http://www.sz-mtr.com/service/guide/map/index_en.html) and the carriage for subway Line 1. The one-third part of carriage was mainly considered in this work, with the size of approximately 10 m (X) × 2.5 m (Y) × 2.2 m (Z). Two rows of seats were arranged symmetrically on both sides of the one-third carriage.
Fig. 2.

Schematic diagram of (a) metro routes and (b) carriage for subway Line 1 in Suzhou.
This carriage utilized the MV mode of Supply air from the Ceiling and Return air from the Ceiling. The supply air volume (SAVin) of a carriage was designed, ranging from about 1.9 to 3.8 m3/s with 20% outdoor air volume (OAV). The OAV was defined in accordance with the minimum ventilation rate of 12 m3/h for a passenger, and the capacity rate of passengers was between 115 and 230 for this type of carriage [21]. The SAVin for one-third carriage was calculated to be 0.64–1.28 m3/s. When using air conditioning during summer, the SAVin and supply air temperature for the traditional MV system were generally set to 1.28 m3/s and 18 °C. Supply air temperature of 19 °C and 20 °C were further considered in this work. Considerable information regarding the inlets, outlets and supply air parameters of the MV system is provided in Section 2.4. The effect of different SAVin and supply air temperatures on the subway carriage environment is analyzed in Section 3. Besides, the SAVin and supply air temperature were not measured and verified in the actual carriage, which is discussed in Section 4.
2.2. Questionnaire survey
A total of 421 passengers in this one-third carriage of subway Line 1 were randomly selected for questionnaire survey in summer (on July 15, 2016). The traditional MV system was utilized in this partial carriage with the SAVin and supply air temperature of 1.28 m3/s and 18 °C, respectively. Table 1 displays the main content of the questionnaire for Subway Line 1. The complete sample questionnaire is presented in Appendix A. The main content of the questionnaire consisted of the passenger number, draft sensation, thermal comfort and passenger satisfaction with the thermal environment and air quality in the carriage. A total of 410 valid questionnaires were obtained.
Table 1.
Main content of the questionnaire.

The carriage environment was surveyed to identify potential problems in draft sensation, thermal comfort and air quality (related to CO2 concentration) induced by the traditional MV system (Section 3). The ventilation mode of Supply air from the Floor and Return air from the Ceiling (SFRC), including SFRC-1 (with an outlet) and SFRC-2 (with two outlets) was developed, to improve the overall environmental quality in the subway carriage. Different supply air parameters, namely, velocity and temperature were also considered for SFRC. Detailed information (size and number of inlets and outlets, set of inlet velocity and temperature) of SFRC-1 and SFRC-2 systems are presented in Section 2.4.
2.3. Experimental setup
An experiment was performed to validate the simulation model for velocity and temperature in the carriage using the MV system (where the questionnaire surveys were conducted). Measurement instruments included a velocity meter (TSI 9515, range of 0–20 m/s and resolution of 0.01 m/s) and an indoor air quality meter (TSI 7525, range of 0–60 °C and resolution of 0.1 °C). The airflow velocity and temperature of two lines (with different heights of Z = 1.1, 1.7, 1.9 and 2.1 m) at two points (point 1: X = 3.1 m, Y = 1.25 m; point 2: X = 7.8 m, Y = 1.25 m) were recorded for an hour (from 8:00 a.m. to 9:00 a.m. on 15 July 2016), as shown in Table 2 . In the experiment, the SAVin and supply air temperature for one-third carriage were set the same as 1.28 m3/s and 18 °C. Air infiltration and heat loss of the carriage were neglected. During the measurement, some passengers were staying in the carriage, whose the movement may influence the validation of experiment and simulation. Time-averaged values of the measured parameters were used to validate the simulation results. The background (inlet) CO2 concentration in the subway carriage was also measured using TSI 7525 (range of 0–5000 ppm and resolution of 1 ppm), which was further used in simulation cases.
Table 2.
Setup of the experimental measurement in the carriage.
| Location of measurement point |
Height of measurement point |
 |
| Point 1: | Z1 = 1.1 m | |
| X = 3.1 m, Y = 1.25 m | Z2 = 1.7 m | |
| Point 2: | Z3 = 1.9 m | |
| X = 7.8 m, Y = 1.25 m |
Z4 = 2.1 m |
|
| Measurement instruments |
Measurement period |
|
| Velocity meter (TSI 9515) | 8:00 a.m.-9:00 a.m. on 15 July with a measurement interval of 5 min | |
| Indoor air quality meter (TSI 7525) |
2.4. Numerical simulation
The performance of ventilation modes (MV and SFRC) under various ventilation parameters was analyzed through simulation. Computational fluid dynamics (CFD) was used to simulate the velocity, temperature and CO2 concentration fields in the carriage [22]. Steady-state numerical simulation was performed by solving the Reynolds averaged Navier-Stokes (RANS) with the Re-Normalization Group (RNG) k-ε model [23]. Simulations were performed using ANSYS FLUENT 16.0. The general forms of momentum, temperature and pollutant transport equations were as follows.
| (1) |
where, is the solving variable (velocity, temperature and CO2 concentration); is the density; is the average velocity; is the diffusion coefficient; and is the source term for momentum, energy and pollutant transport equations.
The geometry and mesh of different ventilation modes (MV, SFRC-1 and SFRC-2) in a one-third subway carriage are illustrated in Fig. 3 . Hexahedral grids were used in the simulations. The size of this partial carriage is 10 m (X) × 2.5 m (Y) × 2.2 m (Z). The information (i.e., size and number) of the inlets and outlets and the mesh grid number for the three ventilation modes are illustrated in Table 3 . For the current Reynolds number (104), we verified that the grid was stretched near the wall with the first grid point 2 × 10⁻³ m from the wall to remain below y+ = 2, such that the near wall region is sufficiently resolved to justify the use of RNG k-ε model with the enhanced wall function. Grid independence analysis was also conducted among the coarse grids (744,536 cells), medium grids (1,524,094 cells) and fine grids (3,246,182 cells) based on a traditional MV system (setting SAVin and inlet temperature to 1.28 m3/s 18 °C, respectively). The result showed that the simulation case using medium grids (1,524,094 cells) was sufficiently solved, with less than 6% difference in velocity for the validation line (X = 5 m, Y = 1.25 m, Z = 0–2.2 m) when compared with that using fine grids (3,246,182 cells). The results of grid independence analysis are shown in Section 3 and Appendix B. The mesh setup of medium grids for simulation cases of MV was used in the cases of SFRC-1 and SFRC-2.
Fig. 3.

Geometry and corresponding mesh of different ventilation modes of (a) MV, (b) SFRC-1 and (c) SFRC-2 in one-third subway carriage.
Table 3.
Information (size and number) of inlets and outlets and mesh grid number for different ventilation modes.
| Ventilation modes | Inlet size (m) | Inlet number | Outlet size (m) | Outlet number | Mesh grids |
|---|---|---|---|---|---|
| MV | 0.5 × 0.1 | 16 | 0.5 × 0.1 | 4 | 1,524,094 cells |
| SFRC-1 | 1.0 × 0.2 | 16 | 1.0 × 0.1 | 1 | 1,503,333 cells |
| SFRC-2 | 1.0 × 0.2 | 16 | 1.0 × 0.2 | 2 | 1,569,522 cells |
In the one-third carriage for subway Line 1, three different values of SAVin (0.64, 0.96 and 1.28 m3/s) and three different inlet temperatures (18 °C, 19 °C and 20 °C) were considered. The inlet velocity for MV (with magnitudes of 0.8, 1.2 and 1.6 m/s), SFRC-1 (with magnitudes of 0.2, 0.3 and 0.4 m/s) and SFRC-2 (with magnitudes of 0.2, 0.3 and 0.4 m/s) was separately calculated. Table 4 displays the boundary conditions for simulation cases. The inlets were set as velocity-inlet with uniform velocity profile, and the outlets were defined as outflow. The inlet CO2 concentration was measured as 450 ppm. The front and rear boundaries were set to symmetry boundary condition. Carriage enclosure, including the top, lateral and floor walls was defined as a non-slip wall and the third type of convective heat exchange was considered. The basis for the heat transfer coefficient and thermal conductivity can be found in Ref. [6]. The free stream temperature was set to 34 °C. Heat loss by air infiltration, heat dissipation through the walls, and latent heat loss by moisture evaporation and steam infiltration were not considered in the simulation. The Boussinesq approximation was used for density variation. The values of the convergence criteria were defined as 10−5. Second-order schemes were used for momentum, turbulent kinetic energy and turbulent dissipation rate, and the SIMPLE algorithm was used for pressure solving.
Table 4.
Boundary conditions of simulation cases.
| Boundary | Type | Conditions |
|---|---|---|
| Inlet | Velocity-inlet | Uniform velocity profile (with inlet CO2 concentration of 450 ppm) |
| Outlet | Outflow | |
| Front and rear | Symmetry | |
| Top | Wall | Non-slip wall, heat transfer coefficient of 16 W/(m2•K), thermal conductivity of 0.11 W/(m·K), wall thickness of 25 mm |
| Lateral | Wall | Non-slip wall, heat transfer coefficient of 16 W/(m2•K), thermal conductivity of 0.44 W/(m·K), wall thickness of 100 mm |
| Floor | Wall | Non-slip wall, heat transfer coefficient of 16 W/(m2•K), thermal conductivity of 0.11 W/(m·K), wall thickness of 25 mm |
Heat source terms, including heat dissipation of passenger sensible heat and equipment, and CO2 sources for passengers were used in the subway carriage. These sources were defined using User-Defined Function (UDF). The passenger number was defined as 35 (based on the answer to the passenger number in Table 1, and the results are presented in Section 3), of which 14 passengers were sitting on the seats and 21 passengers were uniformly standing in the one-third carriage. Table 5 illustrates the locations of passengers (as sources) in the partial carriage. The size of the heat source for sitting and standing passengers was respectively 0.2 m (X) × 0.2 m (Y) × 1.1 m (Z) and 0.2 m (X) × 0.2 m (Y) × 1.7 m (Z). The size of the CO2 source was 0.2 m (X) × 0.2 m (Y) × 0.2 m (Z), and the height of the CO2 source for sitting and standing passengers are respectively 1.1 m and 1.7 m. The sensible heat emitted by each passenger was defined as 47 W, and the heat source density of the non-passenger zone (with equipment) was set to 154 W/m3 [6]. The intensity of the CO2 source was determined as 5 × 10⁻⁶ kg/s [24]. Table 6 provides an overview of simulation cases.
Table 5.
Locations of passengers (as heat and CO2 sources) in the one-third carriage.
| Source type | Passenger status | Horizontal locations of passengers (black × ) | Coordinates (Z)/m |
|---|---|---|---|
| Heat source for passengers | Standing | 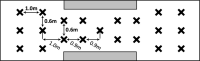 |
(0–1.7) |
| Sitting |
 |
(0–1.1) |
|
| CO2 source for passengers | Standing | Same as the heat source for standing passengers | (1.6–1.8) |
| Sitting | Same as the heat source for sitting passengers | (1.0–1.2) |
Table 6.
Overview of simulation cases.
| Case No. | Ventilation modes | Inlet velocity (m/s) | Inlet temperature (oC) | Notes |
|---|---|---|---|---|
| 1 | MV | 1.6 | 18 | Medium grids |
| 2 | MV | 1.6 | 18 | Coarse grids |
| 3 | MV | 1.6 | 18 | Fine grids |
| 4–5 | MV | 1.6 | 19, 20 | Same as case 1 |
| 6–11 | MV | 1.2, 0.8 | 18, 19, 20 | Same as case 1 |
| 12–20 | SFRC-1 | 0.4, 0.3, 0.2 | 18, 19, 20 | |
| 21–29 | SFRC-2 | 0.4, 0.3, 0.2 | 18, 19, 20 |
2.5. Evaluation models
Air distributions under different ventilation modes, supply air velocities and temperatures had a major effect on the infection risk and performance of different environmental parameters such as thermal comfort, air quality and energy efficiency [25]. Evaluation models of the Air Diffusion Performance Index (ADPI), Predicted Mean Vote (PMV), Pollutant Removal Effectiveness (PRE), infection probability (P) and cooling load (Lcool) for energy consumption were used to comprehensively assess the subway carriage environment.
The ADPI model was used to evaluate the level of draft sensation of ventilation systems, which can be assessed by the percentage of points meeting the acceptable requirements of Effective Draft Temperature (EDT) and velocity over the total number of points in the occupied regions [26]. The EDT during summer when using air conditioning can be defined as follows [27]:
| (2) |
where, EDT(i) (oC) is the effective draft temperature at point of i; T i (oC) is the air temperature at point of i; T a (oC) is the average air temperature in the occupied region; and V i (m/s) is the air velocity at point of i. The acceptable range of EDT is between −1.7 °C and 1.1 °C and the velocity is less than or equal to 0.35 m/s in summer [28]. The ventilation performance was generally accepted when the ADPI value was greater than or equal to 80% [29].
The PMV model was used to represent the level of thermal comfort of occupants (passengers in this work), consisting of seven levels of thermal sensation from “hot” to “cold” (ranging from +3 to −3). The PMV was calculated using the average velocity and average air temperature in the occupied regions through multiple regressions based on ASHRAE 55–2020 [30].
| (3) |
where, V a (m/s) denotes the average air velocity in the occupied region. The recommended PMV ranging from −0.5 to +0.5 was defined in accordance with ASHRAE 55–2020 [30], which was considered to be an acceptable thermal environment for the general comfort of passengers.
The PRE indicates the capability of the ventilation system to remove indoor pollutants from an occupied region. The PRE can be expressed as follows [31]:
| (4) |
where, C out (ppm) is the pollutant concentration in the outlet air; C a (ppm) is the average pollutant concentration in the occupied region; and C in (ppm) is the pollutant concentration in the inlet air. In this work, C a was represented as the CO2 concentration at the breathing level (i.e., Z = 1.1 m for sitting passengers and Z = 1.7 m for standing passengers). When C a and C in were infinitely close, this indicator can be increased to show better pollutant removal performance.
The overall infection probability (P, %) of airborne transmission (e.g., COVID-19) can be estimated by a revisited Wells–Riley equation using continuous average CO2 concentration in the room [32]. In general Wells–Riley equation, if the quantum generation rate (q, h−1), breathing rate (p, m3/h), number of infectors (I) and people in the space (n) remain constant, then the average quantum concentration in the space () is equal to the concentration of quanta in the exhaled breath of infectors (q/p) multiplied by the average volume fraction of air in the space exhaled by infectors (), as shown below.
| (5) |
| (6) |
Then, the value of P can be calculated as follows.
| (7) |
where, C e (ppm) is the concentration of CO2 added to the exhaled breath during breathing; and t (h) is the exposure time. The C e value was defined as 38,000 ppm at low levels of oxygen consumption by passengers in the carriage [32]. The estimated q value of COVID-19 was set to 48 h−1 [33]. The values of I, t and n were respectively defined as 1, 1 and 35, and any passenger can be an infector in the carriage. Eq. (7) was not related to the infector location and the effect of infector location in the carriage should be considered in future work.
The energy consumption of different ventilation systems was approximately estimated by the cooling load (Lcool, kW·h) which was calculated by multiplying the subway running time (t r, h) and the time-averaged cooling load, i.e., the sum of the heat transfer load (Q t, kW) through the carriage walls (i.e., Top, Lateral and Floor), sensible heat dissipation load emitted by passengers (Q p, kW) and equipment (Q e, kW), and load by introducing outdoor air (Q a, kW). The latent heat in subway cabins was not considered in this work. Lcool can be calculated as follows:
| (8) |
| (9) |
| (10) |
where, K j (W/m2·K) is the external surface heat transfer coefficient for the wall j (Top, Lateral and Floor); A j (m2) is the area of wall j; T out (oC) is the temperature outside the carriage; T ins (oC) is the temperature inside the carriage; h out (kJ/kg) is the air enthalpy outside the carriage; and h in (kJ/kg) is the air enthalpy inside the carriage. The value of T out was determined as 34.4 °C (i.e., outdoor design temperature for subway lines in Suzhou) based on Ref. [34]. The t r for subway Line 1 in Suzhou was set as 17 h per day.
In this study, five evaluation models were used to assess the performance of ventilation systems under different ventilation modes and supply air parameters. A potential ranking was observed among the evaluation results obtained from different models. Notably, the priority of different assessment models (or indicators) can be determined by specific tasks of ventilation systems, such as mitigation of infection diseases, which should be prioritized during the normalization of the epidemic. A comprehensive benefit assessment model must be developed for subway carriage ventilation systems by integrating these evaluation models based on their priority rankings (corresponding to weightings). The analytic hierarchy process (AHP) was further used to prioritize and assign important weightings for the comprehensive benefit assessment model (Section 4) [35].
3. Results
In this section, the questionnaire results are presented to explore the environmental issues regarding draft sensation, thermal comfort and air quality in the current subway carriage. The validation results of the experiment and simulation were analyzed. Next, the simulation results of velocity, temperature and CO2 concentration distribution were compared with those of different supply air parameters (velocity and temperature) and three ventilation modes (i.e., MV, SFRC-1 and SFRC-2). Based on several evaluation indicators, ventilation performance, thermal comfort, pollutant removal efficiency, infection risk and cooling load (for energy consumption) were quantitatively evaluated under the effects of different ventilation systems.
3.1. Analysis of questionnaire survey
Using the traditional MV system with SAVin of 1.28 m3/s and supply air temperature of 18 °C, the percentage for a range of passenger numbers and the subjective assessment of the carriage environment are illustrated in Fig. 4 . As shown in Fig. 4 (a), the percentage of passengers in the range of “25–34” and “≥35” were respectively 38.3% and 29.5% in the one-third part of carriages. This result was primarily attributed to the fact that the questionnaire survey was performed during rush hour in the morning, and passengers were densely distributed in the carriage. A critical value of 35 was taken as the constant number of passengers in the simulation model of the partial carriage.
Fig. 4.

(a) Percentage for a range of passenger number and the subjective assessment of carriage environment: (b) draft sensation, (c) thermal comfort, (d) satisfaction of thermal environment, (e) satisfaction of air quality.
Fig. 4 (b) shows a comparison of draft sensation for different ranges of passenger numbers. When the number of passengers in the carriage was less than 25, the draft sensation was mostly voted as “comfortable”. As the passenger density increased, the draft sensation was enhanced. This result was attributed to the fact that when the subway carriage was crowded, most passengers cannot select a satisfactory standing region, which is potentially influenced by the supply airflow. Therefore, reducing the inlet velocity should be further considered to improve the draft sensation of passengers.
The thermal comfort evaluation of passengers is presented in Fig. 4 (c and d). When the number of passengers was 0–24, more passengers felt “slightly cool” and “cool”. This result was related to the lower supply air temperature (18 °C) in the carriage. The increase of passenger number led to a higher percentage of passengers feeling “cool” and “unsatisfied”, which indicated the deterioration of overall thermal environment. This result was attributed to the fact that passengers may be immovable when the carriage was crowded, and most passengers were located in the area where the cold draft sensation was stronger. A few passengers voted on “slightly warm” and “warm”, potentially because of the weak draft sensation and ineffective cooling effect in particular locations. Based on the overall thermal environment, it is not recommended to increase the supply air velocity or decrease the temperature.
Fig. 4 (e) shows the passengers' satisfaction with the air quality of the carriage. The dissatisfaction rate with air quality increased remarkably when the number of passengers gradually increased. Although the ventilation system provided a higher inlet velocity, the pollutant concentration (such as CO2) cannot be effectively diminished. In addition to controlling the supply air parameters (e.g., velocity), the optimal design of the ventilation mode is necessary.
3.2. Validation of experiment and simulation
In this section, we analyzed the results of mesh gird independence and the validation results of the experiment and simulation. Fig. 5 (a) shows the comparisons of air velocity among coarse, medium and fine grids at validation line 1 (X = 5.0 m, Y = 1.25 m, Z = 0–2.2 m). The grid independence results at validation line 2 (X = 2.5 m, Y = 1.25 m, Z = 0–2.2 m), at validation line 3 (X = 7.5 m, Y = 1.25 m, Z = 0–2.2 m) and at the plane of X = 3.5 m were shown in Appendix B. The velocity profile trends between medium and fine grids were in agreement with the maximum difference below 6%. This result indicated that the medium grids were sufficiently resolved in the simulation.
Fig. 5.

Results of (a) mesh gird independence and validations of experiment and simulation: (b) velocity, (c) temperature.
Fig. 5 (b) and (c) show comparisons of the velocity and temperature between the experiment and simulation. Validation points 1 and 2 were located at different positions on the central axis of the carriage. The experiment and simulation showed consistent results on the distribution of velocity and temperature in the Z-direction. The maximum differences in airflow velocity and temperature were calculated as 23.8% and 3.6%, respectively. In the experiment, the passengers may potentially move in the subway cabin, which influenced the validation difference between the experiment and simulation (assuming that passengers were motionless in the simulation), especially with regard to velocity. The measured temperature data at point 2 were larger than the simulated values, which may be influenced by the thermal plume of standing passengers.
3.3. Influence of supply air parameters on subway carriage environment
Considering that the subjective evaluation of passengers for the overall environment was generally unsatisfactory in subway carriages using traditional MV systems (Section 3.1), the influence of different supply air parameters on the subway carriage environment was discussed on the basis of the simulation results. Fig. 6 shows the distribution of the velocity at the plane of X = 3.5 m in the subway carriage with different supply air velocities and temperatures. As the inlet velocity decreased, the overall velocity tended to decrease. When the inlet velocity was 0.8 m/s, the jet speed at the supply air inlet was significantly reduced, which greatly weakened the draft sensation in areas where the passengers were located. The increase in supply air temperature had a slight effect on the velocity distribution, and the average velocity remained almost unchanged.
Fig. 6.

Distribution of air velocity at the plane of X = 3.5 m under different supply air parameters (Vin for inlet velocity and Tin for inlet temperature) in the subway carriage using MV system.
Fig. 7 presents the results of the temperature distribution at the plane of X = 3.5 m in the subway carriage with different supply air parameters. When the inlet temperature was slightly lower and the inlet velocity was larger, cold air was delivered directly to the activity region of passengers, which may result in “slightly cool” and “cold” thermal sensation. Further increasing the supply air temperature from 18 °C to 20 °C and reducing the supply air velocity from 1.6 to 0.8 m/s, the temperature distribution in the subway carriage appeared to be more uniform and the average temperature could be markedly increased by approximately 5 °C.
Fig. 7.

Distribution of temperature at the plane of X = 3.5 m under different supply air parameters (Vin for inlet velocity and Tin for inlet temperature) in the subway carriage using MV system.
The distribution of the CO2 concentration at the plane of X = 3.5 m in the subway carriage with different supply air parameters is illustrated in Fig. 8 . The CO2 concentration was primarily affected by the supply air velocity. The decrease in indoor velocity led to a considerable increase in the CO2 level and deterioration of air quality in the carriage. When the inlet velocity was 0.8 m/s, the average CO2 concentration in the passenger occupied region reached more than 1000 ppm. The influence of the supply air temperature on CO2 concentration was regarded as relatively minor.
Fig. 8.

CO2 concentration at the plane of X = 3.5 m under different supply air parameters (Vin for inlet velocity and Tin for inlet temperature) in the subway carriage using MV system.
Optimizing the supply air parameters for the traditional MV system cannot simultaneously achieve ventilation, thermal comfort and air quality at an effective level. Thus, developing different ventilation systems (e.g. SFRC) and discussing the combined effects of ventilation modes and supply air parameters (e.g., velocity and temperature) on the subway carriage environment are necessary.
3.4. Influence of ventilation modes on subway carriage environment
In this section, two ventilation modes, SFRC-1 and SFRC-2, with various supply air parameters were investigated to improve the overall environmental performance. The velocity distribution at the plane of X = 3.5 m for the SFRC-1 system with different supply air parameters is shown in Fig. 9 . The velocity distribution results for the SFRC-2 system are shown in Fig. C1 in Appendix C. Compared with MV, the SFRC sent air from the bottom area of the seats to the middle area of the carriage. The passengers’ legs were more susceptible to the supply air when the inlet velocity was 0.4 m/s. However, the average airflow velocity in the passenger occupied area was relatively lower, potentially providing a softer draft sensation. As the inlet velocity decreased to 0.2 m/s, the velocity field around the passengers became more uniform, with an average velocity of less than 0.1 m/s. The SFRC-2 reduced the average velocity by 28% in the area below 1.7 m, as compared with SFRC-1. In addition, the SFRC-2 provided a relatively stable air distribution for passengers sitting on both sides of the carriage.
Fig. 9.

Distribution of air velocity at the plane of X = 3.5 m under different supply air parameters (Vin for inlet velocity and Tin for inlet temperature) in the subway carriage using SFRC-1 system.
The temperature distribution results for the SFRC-1 system with different supply air parameters are shown in Fig. 10 . The temperature distribution for the SFRC-2 system is presented in Appendix C. The SFRC systems caused an evident stratification effect of temperature in the carriage. The temperature distribution for SFRC-1 and SFRC-2 was almost the same. Under low supply air temperature (e.g., 18 °C and 19 °C) and large supply air velocity (e.g., 0.4 m/s), a “cool or cold” region with an average temperature of 18 °C was generated, particularly in the region surrounding the legs of passengers. This phenomenon can affect the local thermal sensation of passengers or the thermal environmental quality. The average temperature in the occupied area for SFRC could reach 2 °C, which was lower than that for MV. When the supply air temperature reached 20 °C, the average temperature below Z = 1.7 m could be largely enhanced by approximately 3 °C compared with that when the supply air temperature was 18 °C. The reduction in supply air velocity increased air temperature in the region above Z = 1.1 m, which is the area around the upper body of standing passengers.
Fig. 10.

Distribution of temperature at the plane of X = 3.5 m under different supply air parameters (Vin for inlet velocity and Tin for inlet temperature) in the subway carriage using SFRC-1 system.
Fig. 11 shows the distribution of CO2 concentration at the plane of X = 3.5 m of the SFRC-1 system with different supply air parameters. The CO2 distribution results for the SFRC-2 system are shown in Fig. C3 in Appendix C. Compared with MV, SFRC systems can maintain a concentrated area of CO2 above the breathing plane of standing passengers. This result indicated that this ventilation mode can effectively inhibit the sufficient mixing of CO2 with air in the passenger active area, which can improve air quality. The exhaled CO2 by sitting passengers followed the rising airflow to the upper area, which had a less harmful effect on standing passengers. The SFRC-2 was more effective in reducing the average CO2 concentration by approximately 16% and 42% when compared with SFRC-1 and MV. The influence of the supply air velocity on the CO2 concentration was more significant than that of temperature.
Fig. 11.

CO2 concentration at the plane of X = 3.5 m under different supply air parameters (Vin for inlet velocity and Tin for inlet temperature) in the subway carriage using SFRC-1 system.
Therefore, SFRC appeared more effective than MV in improving the air quality in the carriage. Regarding the ventilation environment for the SFRC, the draft sensation was potentially softer for passengers because of the low velocity. The average temperature in the occupied region was lower than that for MV, thereby affecting the thermal environmental quality. Thus, quantitatively assessing the environmental quality using evaluation models (such as ADPI, PMV and PRE) and infection probability (considering the regular prevention of epidemic) and Lcool (for energy consumption) is necessary to explore the application potential of different ventilation systems for subway carriage.
3.5. Analysis of evaluation models for different ventilation systems
In this section, we used five quantitative evaluation models to discuss the impact of different ventilation systems (with different ventilation modes and supply air parameters) on the environmental performance (ventilation, thermal comfort and air quality), infection risk of passengers and cooling load (for energy consumption) of different ventilation systems. The ADPI values of the different ventilation modes (MV and SFRC) with different supply air parameters are shown in Fig. 12 . The ADPI values for the SFRC systems were higher than those for the MV system. The ADPI for MV and SFRC-1 did not reach the comfort criterion of 80%. The SFRC-2 showed relatively better ventilation performance in four scenarios reaching an ADPI of 80%. The maximum value of 83% was obtained when SAVin was 0.96 m3/s and supply air temperature was 20 °C.
Fig. 12.

ADPI values of different ventilation modes (MV, SFRC-1 and SFRC-2) with different supply air parameters (SAVin for supply air volume and Tin for inlet temperature) in the subway carriage.
Fig. 13 illustrates the PMV results for different ventilation modes (MV and SFRC) with various supply air parameters. The carriage environment was generally “cool” and “cold” when using the MV system, with an average PMV of less than −2 in the passenger occupied region. SFRC improved the thermal environment of the carriage to a certain degree. Moreover, as the supply air temperature increased and the supply air velocity decreased, the thermal comfort evaluation in the occupied region was presented as “slightly warm” and “warm”. When the inlet temperature was greater than 18 °C and the inlet velocity was larger than 0.2 m/s, the SFRC-2 system allowed the PMV to be in the recommended range of −0.5 to 0.5 (indicated by black slant lines in Fig. 13). This result showed that optimizing the design of the ventilation mode and supply air parameters can improve the thermal comfort in the carriage.
Fig. 13.

PMV values of different ventilation modes (MV, SFRC-1 and SFRC-2) with different supply air parameters (Vin for inlet velocity and Tin for inlet temperature) in the subway carriage (recommended PMV range of −0.5 to +0.5 is indicated by black slant lines).
Fig. 14 (a) shows the PRE results for different ventilation modes (MV and SFRC) with various supply air parameters. The PRE value decreased with the decrease of the supply air velocity, which correlated with the distribution of the CO2 concentration in the carriage. Compared with the SFRC-1 and MV systems, SFRC-2 had better removal capability, with a maximum PRE value of approximately 16. The difference in the PRE between the SFRC-1 and SFRC-2 systems decreased with the decrease of the supply air velocity. The PRE value of the MV system was close to 1, indicating that sufficient CO2 mixing was achieved in the carriage. However, this ventilation mode was not conducive to the effective removal of CO2 from the occupied area.
Fig. 14.

(a) Pollutant Removal Effectiveness (PRE) values and (b) infection probability (P) of different ventilation modes (MV, SFRC-1 and SFRC-2) with different supply air parameters (SAVin for supply air volume and Tin for inlet temperature) in the subway carriage.
Fig. 14 (b) demonstrates the calculation results for infection probability (P). The infection risk for the MV system was all greater than 3%, which evidently increased with the decrease of the supply air velocity. The SFRC-1 could reduce the infection probability by at least 2%. The SFRC-2 system showed favorable behavior in the mitigation of airborne transmission, attaining an infection risk below 0.4%. Therefore, the SFRC-2 system is recommended for improving the air quality in the occupied area of the carriage and reducing the infection probability of passengers when combined with optimized supply air parameters.
The values of Lcool per day (for a one-third subway carriage) under different ventilation systems are presented in Fig. 15 . The variation in Lcool resulted from the supply air velocity and the temperature difference between the inside and outside of the cabin. By modifying the supply air parameters for MV, the energy efficiency based on Lcool can be remarkably improved by about 65%. Under the same SAVin set for ventilation systems, the Lcool of SFRC-1 and SFRC-2 increased by about 10% and 12% respectively, compared with that of MV. This result was primarily attributed to the fact that the average temperature inside the carriage when using the MV system was larger than that when using the SFRC, resulting in a lower heat transfer load through the walls (considering that the outside temperature was larger than the inside temperature). However, as SAVin decreased, the energy efficiency of SFRC increased compared with the traditional MV with SAVin of 1.28 m3/h.
Fig. 15.

Cooling load (Lcool) per day of different ventilation systems with different ventilation modes (MV, SFRC-1 and SFRC-2) and different supply air parameters (SAVin for supply air volume and Tin for inlet temperature) in the subway carriage.
With regard to ventilation performance, thermal comfort, air quality and infection probability, SFRC-2 exhibited a better performance than MV and SFRC-1. Although the Lcool for SFRC-2 decreased with the decrease of the supply air velocity, the energy efficiency was slightly inferior to that of MV and SFRC-1 under the same supply air parameters. A comprehensive evaluation model incorporating the indicators of environmental quality and energy saving using a weighting method is important, for assessing the integrated benefits of infection risk, environmental control and energy saving for different ventilation systems.
4. Discussion and recommendation
In this study, we discussed and evaluated the performance of infectious disease mitigation, environmental control of ventilation, thermal comfort, air quality, and energy efficiency under the effect of different ventilation systems (considering different ventilation modes and supply air parameters). Compared with MV, SFRC-2 can optimize the ventilation and thermal environment and decrease the pollutant concentration and infection risk of passengers. However, the Lcool of SFRC-2 slightly increased. Therefore, the combined benefits of infection risk, environment and energy consumption based on Lcool should be analyzed for different ventilation systems. Furthermore, this study aimed to improve energy efficiency in the premise of great environmental and infection transmission control. In this section, we used the AHP method to assign weighs to indicators, namely, ADPI, PMV, PRE, P and Lcool, and proposed an integrated assessment model by coupling these evaluation models. Comprehensive benefit analysis of ventilation systems was performed to recommend the optimal ventilation mode and regulation range of the supply air parameters for subway carriage. The limitations of this study and future work were also discussed.
4.1. Comprehensive benefit evaluation of different ventilation systems
In order to prioritize the evaluation indicators, AHP was adopted to distinguish more important indices from the less important ones, and assign the weightings that represented the relative importance [35]. The five-stage AHP was proposed by Saaty based on the following steps [36]: (1) identifying the analysis objective, (2) establishing a hierarchical structure model (from the overall objective through the sub-objectives to the sub-indicators), (3) constructing pair-wise comparison matrices, (4) conducting a consistency test, and (5) estimating the weights of the sub-indicators. The relative importance of the sub-indicators was rated on a nine-point scale, which indicated that the level of relative importance, including equal, moderate, strong, very strong, and extreme level, was represented by 1, 3, 5, 7, and 9, respectively [36].
In this work, the analysis aimed to determine the comprehensive benefits of the environment and energy consumption (estimated by cooling load) of the subway carriage. The sub-objectives include three ventilation modes and different supply air parameters. The sub-indicators consisted of the inverse of ADPI (indicated by ADPI−1), absolute value of PMV (indicated by |PMV|), inverse of PRE (indicated by PRE−1), infection probability (P) and cooling load (Lcool). ADPI−1 and PRE−1 were defined due to that the values of ADPI and PRE were negatively correlated with Lcool. Wong et al. [37] evaluated the sub-indicators of “user comfort” (including PMV, air quality and ventilation) and “total energy consumption” for air conditioning systems in a hierarchical ranking method by collecting questionnaires from experts. The results showed that “user comfort” was given higher priority than “total energy consumption”. With regard to “user comfort”, “air quality” was prioritized over “PMV” and “ventilation”. The ranking of “PMV” and “ventilation” was considered equivalent. With the regular control of pandemic, we determined the priority of infection probability as the highest level. A 5 × 5 pair-wise comparison matrix for relative importance was designed, as shown in Table 7 .
Table 7.
Pair-wise comparison matrix among sub-indicators for relative importance.
| Sub-indicator | ADPI−1 | |PMV| | PRE−1 | P | Lcool |
|---|---|---|---|---|---|
| ADPI−1 | 1 | 1 | 1/3 | 1/5 | 3 |
| |PMV| | 1 | 1 | 1/3 | 1/5 | 3 |
| PRE−1 | 3 | 3 | 1 | 1/3 | 5 |
| P | 5 | 5 | 3 | 1 | 7 |
| Lcool | 1/3 | 1/3 | 1/5 | 1/7 | 1 |
Note: Data in the pair-wise comparison matrix represent the results of comparing row indicators relative to column indicators.
The consistency test is a basic feature of the AHP, which aims to eliminate possible inconsistencies in evaluation weightings by computing the level of consistency of the comparison matrix. The consistency ratio (CR) was used to prove the inconsistency of the indicators in pair-wise comparison. Saaty has set an acceptable CR value of 0.10 for a 5 × 5 matrix [36]. If the CR value was lower than the acceptable value, then the weightings were regarded as valid and consistent. The CR value based on that shown in Table 7 was calculated as 0.025, which met the requirement of the consistency test. The priority weightings of each sub-indicator were determined. The equation of comprehensive benefit evaluation for the carriage ventilation system was derived on the basis of the following dimensionless form of the sub-indicators.
| (11) |
where, E CB is the quantitative result of the comprehensive benefit evaluation; and , , , and are respectively the weightings of dimensionless sub-indicators for ADPI−1*, |PMV|*, PRE−1*, P* and Lcool*, which are calculated as 0.10, 0.10, 0.25, 0.50 and 0.05 in this work. Through substituting the values of the sub-indicators corresponding to the sub-objectives (various ventilation modes and supply air parameters) into Eq. (11), the quantitative results of the comprehensive benefit evaluation for the subway carriage using different ventilation systems were obtained, as shown in Table 8 . The optimal ventilation mode and setting values of the supply air parameters were obtained on the basis of the minimum E CB.
Table 8.
Relative quantitative results of comprehensive benefit evaluation for different ventilation systems.
| Ventilation modes | Inlet velocity (m/s) | Inlet temperature (oC) |
||
|---|---|---|---|---|
| 18 | 19 | 20 | ||
| MV | 1.6 | 0.760 | 0.729 | 0.696 |
| 1.2 | 0.809 | 0.775 | 0.751 | |
| 0.8 | 0.942 | 0.894 | 0.851 | |
| SFRC-1 | 0.4 | 0.244 | 0.225 | 0.211 |
| 0.3 | 0.231 | 0.215 | 0.204 | |
| 0.2 | 0.243 | 0.250 | 0.249 | |
| SFRC-2 | 0.4 | 0.074 | 0.059 | 0.037 |
| 0.3 | 0.067 | 0.049 | 0.034* | |
| 0.2 | 0.080 | 0.071 | 0.076 | |
Note: Values in boldface are maximal for corresponding ventilation systems; values marked with an asterisk are maximal among three ventilation systems.
As shown in Table 8, the optimal ventilation mode and supply air parameters were determined on the basis of the quantitative values of the comprehensive benefit evaluation for the ventilation systems in the carriage. The optimal parameter conditions for the MV were evaluated as a supply air temperature of 20 °C and a velocity of 1.6 m/s. The setting value of the supply air temperature was increased by 2 °C compared with the traditional MV system at 18 °C. The recommended optimal supply air parameters for the SFRC systems were 20 °C and 0.3 m/s. Among these ventilation systems, SFRC-2 provided the best comprehensive benefit with regard to infection risk, environment and energy consumption based on Lcool. The energy efficiency of SFRC-2 with the optimal supply air parameters could also be increased by about 29.7% when compared with the traditional MV system. Combined with the optimal settings of the supply air parameters, the redesign of the SFRC-2 ventilation mode in the cabin could effectively ensure a safe, healthy and comfortable environment for passengers in the post-epidemic era and simultaneously increase the energy use efficiency.
4.2. Limitations and future work
In this study, the experimental measurement of supply air parameters (SAVin and temperature) was not performed. It is a limitation to use the values from the design guidance, which should be confirmed in the future work. The simulations were performed under a one-third subway carriage, using the UDF model, in which passengers were regarded as to heat and CO2 sources. In future work, the full-size actual subway carriage environment should be investigated by considering different numbers of realistic passenger models and passenger movements. Another recommendation for future research is that more types (e.g., humidity factor) and ranges of supply air parameters must be explored. The comprehensive effect of more detailed supply air conditions and boundary conditions (such as heat loss, air infiltration, lateral flow between carriages, etc.) on the overall environmental quality, passenger comfort and distribution of more pollutants (particulate matter, viral microorganisms and volatile organic compounds) should be analyzed [38]. Furthermore, the impact of different locations and number of passengers (infectors) on the environmental performance and infection risk should be investigated. The individual infection probability based on the exposure time and respiratory parameter should be considered. In addition, the two SFRC ventilation systems developed in this work were at the theoretical design and analysis stage. Thus, the feasibility of implementing an optimized ventilation system in the real carriage should be validated, with the challenge of promoting the engineering application. The real-time energy consumption and running mode (time) of ventilation systems should be considered to better investigate the energy efficiency or coefficient of performance (COP).
5. Conclusions
This study aimed to investigate the effects of different ventilation systems (with various ventilation modes and supply air parameters) on environmental parameters (i.e., ventilation, thermal comfort and air quality), infection risk and cooling load (for energy consumption) in subway carriage. In this work, using a questionnaire survey method, the environmental situation (draft sensation, thermal comfort and satisfaction of air quality) in the carriage was analyzed using the traditional MV system. Different supply air parameters (considering three values of SAVin and three supply air temperatures) and ventilation modes (SFRC) were developed. Numerical simulations were performed to predict the distribution of velocity, temperature and CO2 concentration. Quantitative evaluation models were utilized to analyze the ventilation performance, thermal comfort, pollutant removal efficiency, infection risk, and cooling load. Moreover, a comprehensive benefit evaluation method was proposed for the optimal ventilation mode and recommended values of the supply air parameters. The following conclusions were drawn.
-
(1)
Based on the questionnaires, the environmental quality in the subway carriage using traditional MV system (with supply air velocity of 1.6 m/s and temperature of 18 °C) decreased with the increase of passenger number, including enhanced draft sensation, deterioration of thermal environment (i.e., feeling “cooler”), and increase in air quality dissatisfaction.
-
(2)
The optimization of the supply air parameters for MV can improve the carriage environment to a certain level. The draft sensation was softer for passengers and the average temperature was increased by 5 °C to improve the thermal environment. However, the air quality was poor since the CO2 concentration remained above 1000 ppm in the passenger occupied region.
-
(3)
The SFRC-2 could provide a softer draft sensation for passengers and remarkably decrease the average CO2 concentration by 42% when compared with MV. The SFRC-2 was evaluated, and it showed better performance than MV and SFRC-1, with ADPI of 80%, PMV approaching zero, PRE up to 16, and infection risk reduced to less than 0.4%.
-
(4)
The SFRC-2 had the optimal integrated benefits with supply air velocity and temperature recommended as 0.3 m/s and 20 °C. The energy efficiency of SFRC-2 was increased by about 29.7% as compared with traditional MV. The optimized design of ventilation systems can assist ensuring the safety, health and comfort of passengers and improve energy saving performance.
CRediT authorship contribution statement
Chen Ren: Writing – review & editing, Writing – original draft, Validation, Methodology. Haofu Chen: Writing – original draft, Methodology. Junqi Wang: Writing – review & editing, Software. Zhuangbo Feng: Writing – review & editing. Shi-Jie Cao: Writing – review & editing, Supervision.
Declaration of competing interest
The authors declare that they have no known competing financial interests or personal relationships that could have appeared to influence the work reported in this paper.
Acknowledgments
The authors would like to acknowledge the supports from the National Natural Science Foundation of China (Grant No. 52178069), and the Postgraduate Research & Practice Innovation Program of Jiangsu Province (No. KYCX21_0112).
Nomenclature
- ADPI
Air Diffusion Performance Index (%)
- ADPI−1
Inverse of ADPI
- ADPI−1*
Dimensionless form of ADPI−1
- AHP
Analytic hierarchy process
- Aj
Area of the wall j of Top, Lateral and Floor (m2)
- CFD
Computational fluid dynamics
- COP
Coefficient of performance
- CR
Consistency ratio
- Cout
Pollutant concentration in the outlet air (ppm)
- Ca
Average pollutant concentration in the occupied region (ppm)
- Cin
Pollutant concentration in the inlet air (ppm)
- Ce
CO2 concentration added to exhaled breath during breathing (ppm)
- D
Number of disease cases
- DV
Displacement ventilation
- EDT
Effective Draft Temperature (oC)
- EDT(i)
Effective draft temperature at point of i (oC)
- ECB
Relative quantitative result of comprehensive benefit evaluation
Average fraction of indoor air that is exhaled breath
- hout
Air enthalpy outside the carriage (kJ/kg)
- hin
Air enthalpy inside the carriage (kJ/kg)
- I
Number of infectors
- Kj
External surface heat transfer coefficient for the wall j of Top, Lateral and Floor (W/m2·K)
- km
kilometer
- Lcool
Cooling load (kW·h)
- Lcool*
Dimensionless form of Lcool
- MV
Mixing ventilation mode of Supply air from the Ceiling and Return air from the Ceiling
Average quantum concentration in the space
- n
Total passenger number in the space
- PMV
Predicted Mean Vote
- |PMV|
Absolute value of PMV
- |PMV|*
Dimensionless form of |PMV|
- PRE
Pollutant Removal Effectiveness
- PRE−1
Inverse of PRE
- PRE−1*
Dimensionless form of PRE−1
- P
Infection probability (%)
- P*
Dimensionless form of P
- p
Breathing rate (m3/h)
- q
Quantum generation rate by an infected passenger (h−1)
- Qt
Heat transfer load through the carriage walls (kW)
- Qp
Sensible heat dissipation load emitted by passenger (kW)
- Qe
Sensible heat dissipation load emitted by equipment (kW)
- Qa
Supply air load (kW)
- RANS
Reynolds averaged Navier-Stokes
- RNG
Re-Normalization Group
- SFRC
Ventilation mode of Supply air from the Floor and Return air from the Ceiling
- SFRC-1
Ventilation mode of Supply air from the Floor and Return air from the Ceiling (one outlet)
- SFRC-2
Ventilation mode of Supply air from the Floor and Return air from the Ceiling (two outlets)
- SAVin
Supply air volume (m3/s)
- S
Number of susceptible
Source term for momentum, energy and pollutant transport equations
- Ti
Air temperature at point of i (oC)
- Ta
Average air temperature in the occupied region (oC)
- Tout
Temperature outside the carriage (oC)
- Tins
Temperature inside the carriage (oC)
- t
Exposure time (h)
- tr
Subway running time (h)
Average velocity
- UFAD
Under floor air distribution system
- UDF
User-Defined Function
- Vi
Air velocity at point of i (m/s)
- Va
Average air velocity in the occupied region (m/s)
Weightings for ADPI−1*
Weightings for |PMV|*
Weightings for PRE−1*
Weightings for P*
Weightings for Lcool*
Solving variable for velocity, temperature and CO2 concentration
Density
Diffusion coefficient
Appendix A. Sample questionnaire
Table A1.
Sample questionnaire for subway Line 1 in Suzhou.

Appendix B. Grid independence analysis
Fig. B1 shows the comparisons of air velocity among coarse, medium and fine grids at validation line 1 (X = 5.0 m, Y = 1.25 m, Z = 0–2.2 m), at validation line 2 (X = 2.5 m, Y = 1.25 m, Z = 0–2.2 m) and at validation line 3 (X = 7.5 m, Y = 1.25 m, Z = 0–2.2 m). Fig. B2 displays the distribution of velocity at the plane of X = 3.5 m among coarse, medium and fine grids, under the constant supply air parameters in the subway carriage using MV system. The analysis results proved that the velocity distributions between medium and fine grids were in agreement.
Fig. B1.

Results of mesh gird independence for velocity at different validation lines 1, 2 and 3.
Fig. B2.

Distribution of air velocity at the plane of X = 3.5 m among coarse, medium and fine grids under the constant supply air parameters (Vin for inlet velocity and Tin for inlet temperature) in the subway carriage using MV system.
Appendix C. Impact of ventilation mode of SFRC-2 on velocity, temperature and CO2 concentration in the subway carriage
Fig. C1 shows the velocity distributions at the plane of X = 3.5 m for the SFRC-2 system with different supply air parameters. SFRC-2 sent air from the bottom area of the seats to the middle area of the cabin. Passengers’ legs were more susceptible to supply air when the inlet velocity was 0.4 m/s. The SFRC-2 reduced the average velocity by about 28% in the area below 1.7 m, when compared with that of SFRC-1. SFRC-2 provided a relatively stable air distribution for passengers sitting on both sides of the carriage.
Fig. C1.

Distribution of air velocity at the plane of X = 3.5 m under different supply air parameters (Vin for inlet velocity and Tin for inlet temperature) in the subway carriage using SFRC-2 system.
Fig. C2 shows the temperature distribution results of the SFRC-2 system with different supply air parameters. The SFRC-2 system caused a more evident stratification effect of temperature in the carriage. Temperature distributions for the SFRC-2 system were almost similar to those of the SFRC-1 system. As the supply air temperature reached 20 °C, the average temperature below Z = 1.7 m could be largely enhanced by 3 °C as compared with that when the supply air temperature reached 18 °C.
Fig. C2.

Distribution of temperature at the plane of X = 3.5 m under different supply air parameters (Vin for inlet velocity and Tin for inlet temperature) in the subway carriage using SFRC-2 system.
Fig. C3 indicates the distribution of CO2 concentration at the plane of X = 3.5 m of the SFRC-2 system with different supply air parameters. Compared with MV, SFRC-2 can maintain a concentrated area of CO2 above the breathing plane of standing passengers. The SFRC-2 was more effective in decreasing the average CO2 concentration by approximately 16% and 42% when compared with the SFRC-1 and MV systems.
Fig. C3.

CO2 concentration at the plane of X = 3.5 m under different supply air parameters (Vin for inlet velocity and Tin for inlet temperature) in the subway carriage using SFRC-2 system.
Data availability
Data will be made available on request.
References
- 1.Taecharungroj V. An analysis of tripadvisor reviews of 127 urban rail transit networks worldwide. Travel Behav. Soc. 2022;26:193–205. [Google Scholar]
- 2.El Hamshary O., Abouhamad M., Marzouk M. Integrated maintenance planning approach to optimize budget allocation for subway operating systems. Tunn. Undergr. Space Technol. 2022;121 [Google Scholar]
- 3.Yin H., Yang C.Y., Yi L.Z., Yu J.Y., Wu Y.F., Deng Y.J., Tang Z.H. Ventilation and air conditioning system of deep-buried subway station in sub-tropical climates: energy-saving strategies. Appl. Therm. Eng. 2020;178 [Google Scholar]
- 4.Mao Y.H., Ma J.L., Wang S.X., Liang J.D., Liang J.Z. A stratum ventilation system for pollutants and an improved prediction model for infection in subway cars. Atmos. Pollut. Res. 2022;13 [Google Scholar]
- 5.Peng Y.L., Gao Z., Ding W.W., Zhang J.S., Li X.Z., Xu J.F., Wei Y.L. Application of computational fluid dynamics in subway environment without fire and smoke-Literature review. Build. Environ. 2021;206 [Google Scholar]
- 6.Chang Z.Y., Yi K., Liu W.W. A new ventilation mode of air conditioning in subway vehicles and its air distribution performance. Energy Built Environ. 2021;2:94–104. [Google Scholar]
- 7.Moreno T., Pinto R.M., Bosch A., Moreno N., Alastuey A., Minguillon M.C., Anfruns-Estrada E., Guix S., Fuentes C., Buonanno G., Stabile L., Morawska L., Querol X. Tracing surface and airborne SARS-CoV-2 RNA inside public buses and subway trains. Environ. Int. 2021;147 doi: 10.1016/j.envint.2020.106326. [DOI] [PMC free article] [PubMed] [Google Scholar]
- 8.Liu M.X., Liu J.J., Cao Q., Li X.Y., Liu S.M., Ji S.C., Shen X., Long Z.W., Chen Q.Y. Evaluation of different air distribution systems in a commercial airliner cabin in terms of comfort and COVID-19 infection risk. Build. Environ. 2022;208 doi: 10.1016/j.buildenv.2021.108590. [DOI] [PMC free article] [PubMed] [Google Scholar]
- 9.Xu B., Hao J.L. Air quality inside subway metro indoor environment worldwide: a review. Environ. Int. 2017;107:33–46. doi: 10.1016/j.envint.2017.06.016. [DOI] [PubMed] [Google Scholar]
- 10.Pan S., Liu Y.Q., Xie L., Wang X.R., Yuan Y.P., Jia X.Y. A thermal comfort field study on subway passengers during air-conditioning season in Beijing. Sustain. Cities Soc. 2020;61 [Google Scholar]
- 11.El-Salamony M., Moharam A., Guaily A., Boraey M.A. Air change rate effects on the airborne diseases spreading in Underground Metro wagons. Environ. Sci. Pollut. Res. 2021;28:31895–31907. doi: 10.1007/s11356-021-13036-z. [DOI] [PMC free article] [PubMed] [Google Scholar]
- 12.Suarez C., Iranzo A., Salva J.A., Tapia E., Barea G., Guerra J. Parametric investigation using computational fluid dynamics of the HVAC air distribution in a railway vehicle for representative weather and operating conditions. Energies. 2017;10:1074. [Google Scholar]
- 13.Luo X.L., Huang X.Y., Feng Z.B., Li J., Gu Z.L. Influence of air inlet/outlet arrangement of displacement ventilation on local environment control for unearthed relics within site museum. Energy Build. 2021;246 [Google Scholar]
- 14.Liu M.X., Chang D., Liu J.J., Ji S.C., Lin C.H., Wei D., Long Z.W., Zhang T.F., Shen X., Cao Q., Li X.Y., Zeng X.J., Li H.Y. Experimental investigation of air distribution in an airliner cabin mockup with displacement ventilation. Build. Environ. 2021;191 [Google Scholar]
- 15.Loy-Benitez J., Li Q., Nam K., Nguyen H.T., Kim M., Park D., Yoo C. Multi-objective optimization of a time-delay compensated ventilation control system in a subway facility - a harmony search strategy. Build. Environ. 2021;190 [Google Scholar]
- 16.Wang J.Q., Huang J.J., Feng Z.B., Cao S.J., Haghighat F. Occupant-density-detection based energy efficient ventilation system: prevention of infection transmission. Energy Build. 2021;240 doi: 10.1016/j.enbuild.2021.110883. [DOI] [PMC free article] [PubMed] [Google Scholar]
- 17.Tariq S., Loy-Benitez J., Nam K., Heo S., Yoo C. Energy-efficient time-delay compensated ventilation control system for sustainable subway air quality management under various outdoor conditions. Build. Environ. 2020;174 [Google Scholar]
- 18.Li G.Q., Meng X., Zhang X.W., Zhang L., Du C.Q., Li N., Yu W., Xiong J., Zhang S.X., Li B.Z. An innovative ventilation system using piston wind for the thermal environment in Shanghai subway station. J. Build. Eng. 2020;32 [Google Scholar]
- 19.Loy-Benitez J., Li Q., Ifaei P., Nam K., Heo S., Yoo C. A dynamic gain-scheduled ventilation control system for a subway station based on outdoor air quality conditions. Build. Environ. 2018;144:159–170. [Google Scholar]
- 20.Wen Y.M., Leng J.W., Yu F., Yu C.W. Integrated design for underground space environment control of subway stations with atriums using piston ventilation. Indoor Built Environ. 2020;29:1300–1315. [Google Scholar]
- 21.GB 50157-2013 . Ministry of Housing and Urban-Rural Development of the People's Republic of China; 2014. Code for Design of Metro. [Google Scholar]
- 22.Camelli F.E., Byrne G., Lohner R. Modeling subway air flow using CFD. Tunn. Undergr. Space Technol. 2014;43:20–31. [Google Scholar]
- 23.Ren C., Feng Z.B., Cen D.D., Cao S.J. Study on the subway environment induced by moving train using Gaussian distributed momentum source theory method. Indoor Built Environ. 2019;28:1083–1091. [Google Scholar]
- 24.Chow W.K. Ventilation of enclosed train compartments in Hong Kong. Appl. Energy. 2002;71:161–170. [Google Scholar]
- 25.Seuntjens O., Belmans B., Buyle M., Audenaert A. A critical review on the adaptability of ventilation systems: current problems, solutions and opportunities. Build. Environ. 2022;212 [Google Scholar]
- 26.Gao J., Wang H.C., Wu X.Z., Wang F.H., Tian Z. Indoor air distribution in a room with underfloor air distribution and chilled ceiling: effect of ceiling surface temperature and supply air velocity. Indoor Built Environ. 2020;29:151–162. [Google Scholar]
- 27.Ren C., Cao S.J., Haghighat F. A practical approach for preventing dispersion of infection disease in naturally ventilated room. J. Build. Eng. 2022;48 [Google Scholar]
- 28.Liu S.C., Clark J., Novoselac A. Air diffusion performance index (ADPI) of overhead-air-distribution at low cooling loads. Energy Build. 2017;134:271–284. [Google Scholar]
- 29.Wang X., Liu T.Q., Lee W.L. Using revised ADPIs to identify an optimum positioning for installation of reversible room air-conditioners in bedroom for maximum thermal comfort. Build. Environ. 2021;188 [Google Scholar]
- 30.ASHRAE Standard 55-2020 . American Society of Heating, Refrigerating and Air-conditioning Engineers; 2021. Thermal Environmental Conditions for Human Occupancy. [Google Scholar]
- 31.Peng P., Pomianowski M., Zhang C., Guo R., Jensen R.L., Jonsson K.T., Gong G.C. Experimental investigation on the ventilation performance of diffuse ceiling ventilation in heating conditions. Build. Environ. 2021;205 [Google Scholar]
- 32.Rudnick S.N., Milton D.K. Risk of indoor airborne infection transmission estimated from carbon dioxide concentration. Indoor Air. 2003;13:237–245. doi: 10.1034/j.1600-0668.2003.00189.x. [DOI] [PubMed] [Google Scholar]
- 33.Dai H., Zhao B. Association of the infection probability of COVID-19 with ventilation rates in confined spaces. Build. Simulat. 2020;13:1321–1327. doi: 10.1007/s12273-020-0703-5. [DOI] [PMC free article] [PubMed] [Google Scholar]
- 34.Liu M.Z., Zhu C.G., Zhang H., Zheng W.D., You S.J., Campana P.E., Yan J.Y. The environment and energy consumption of a subway tunnel by the influence of piston wind. Appl. Energy. 2019;246:11–23. [Google Scholar]
- 35.Figueiredo K., Pierott R., Hammad A.W.A., Haddad A. Sustainable material choice for construction projects: a Life Cycle Sustainability Assessment framework based on BIM and Fuzzy-AHP. Build. Environ. 2021;196 [Google Scholar]
- 36.Saaty T.L. McGraw-Hill; US: 1980. The Analytic Hierarchy Process: Planning, Priority Setting, Resource Allocation. [Google Scholar]
- 37.Wong J.K.W., Li H. Application of the analytic hierarchy process (AHP) in multi-criteria analysis of the selection of intelligent building systems. Build. Environ. 2008;43:108–125. [Google Scholar]
- 38.Cao S.J., Kong X.R., Li L.Y., Zhang W.R., Ye Z.P., Deng Y.L. An investigation of the PM2.5 and NO2 concentrations and their human health impacts in the metro subway system of Suzhou, China. Environ. Sci.: Process. Impacts. 2017;19:666–675. doi: 10.1039/c6em00655h. [DOI] [PubMed] [Google Scholar]
Associated Data
This section collects any data citations, data availability statements, or supplementary materials included in this article.
Data Availability Statement
Data will be made available on request.