Abstract
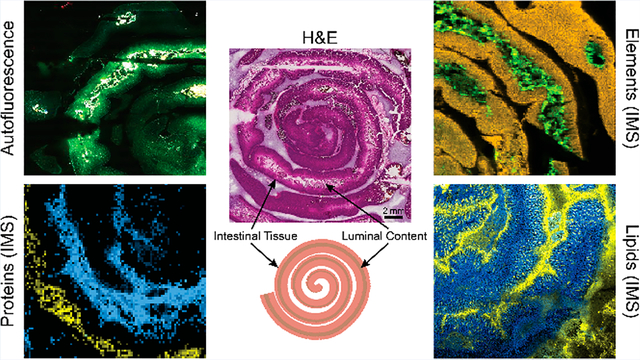
The gastrointestinal tract, including luminal content, harbors a complex mixture of microorganisms, host dietary content, and immune factors. Existing imaging approaches remove luminal content and only visualize small regions of the GI tract. Here, we demonstrate a workflow for multimodal imaging using matrix-assisted laser desorption/ionization imaging mass spectrometry, autofluorescence, and bright field microscopy for mapping intestinal tissue and luminal content. Results comparing tissue and luminal content in control murine tissue show both unique molecular and elemental distributions and abundances using multimodal protein, lipid, and elemental imaging. For instance, lipid PC(42:1) is 2× higher intensity in luminal content than tissue, while PC(32:0) is 80× higher intensity in tissue. Additionally, some ions such as the protein at m/z 3443 and the element manganese are only detected in luminal content, while the protein at m/z 8564 was only detected in tissue and phosphorus had 2× higher abundance in tissue. These data highlight the robust molecular information that can be gained from the gastrointestinal tract with the inclusion of luminal content.
Keywords: MALDI IMS, gastrointestinal tract
Graphical Abstract

INTRODUCTION
Within the United States, over 62 million people are diagnosed with a digestive disease annually.1 The human gastrointestinal (GI) tract is the largest interface between the host, gut microbiota, and environmental factors within the body and plays a major role in human health and disease.2 All of the regions of the small intestine—duodenum, jejunum, and ileum—as well as the large intestine, have unique functions and molecular characteristics, owing in part to the dramatically different bacterial burden in proximal and distal regions of the small intestine.3 In addition, the gastrointestinal tract includes luminal content that contains healthy gut microbiota, dietary constituents such as ingested fats, as well as pathogenic bacteria such as Clostridioides difficile.4,5 Previous spatial analyses of the GI tract have focused on histological analysis, which does not offer novel molecular information unless paired with other modalities. Matrix-assisted laser desorption/ionization (MALDI) imaging mass spectrometry (IMS)6 has been employed to provide spatially associated molecular information in mammalian GI tissue.7–10 These studies do not encompass the entirety of the GI tract, since either an incomplete portion of the tissue is probed or the luminal content is removed. One effective approach for sample preparation of this organ when preparing tissue for cryosectioning is the use of a “Swiss roll” architecture in which intestinal tissue is rolled into a spiral pattern.11,12 This approach enables imaging of more intestinal tissue (~16 cm of total 33 cm in length) and allows comparisons between additional regions of the GI tract. Unfortunately, traditional Swiss roll protocols remove luminal content.12 Feces have a high fat and water composition, which leads to difficulties with slide retention during sample preparation protocols, such as aqueous tissue washes, for MALDI IMS.13 In this report, we present a modified sample preparation workflow for multimodal imaging of the murine small intestine, which includes the luminal content, to measure the full molecular complexity of the gut using IMS, autofluorescence microscopy, and bright field microscopy.
EXPERIMENTAL SECTION
Additional instrument and sample preparation information is included in Supplemental Tables 1 and 2.
Sample Preparation.
Murine small intestines were rolled into a spiral shape, without being cut, termed a modified Swiss roll, and embedded in 2.6% carboxymethylcellulose (CMC) in water. Tissue and CMC were snap frozen over liquid nitrogen at −80 °C, cryosectioned at 10 μm thickness using a CM3050 S cryostat (Leica Biosystems, Wetzlar, Germany), and thawmounted onto 1% poly l-lysine coated ITO slides (Delta Technologies, Loveland, CO) for lipid and protein imaging or vinyl slides for elemental imaging (VWR, Radnor, PA). Autofluorescence microscopy images were acquired using EGFP, DAPI, and DsRed filters on a Zeiss AxioScan Z1 slide scanner (Carl Zeiss Microscopy GmbH, Oberkochen, Germany) prior to matrix application.
Polylysine Slide Coatings.
Poly-l-lysine solution was prepared with a 1:10 ratio of polylysine/distilled water. Slides were then fully covered in solution for 10 min and then dried in a 60 °C oven for 1 h.
MALDI FT-ICR Imaging MS of Proteins.
Samples for protein analysis were washed using graded ethanol washes and Carnoy’s Fluid (6 ethanol/3 chloroform/1 acetic acid) to remove salts and lipids (70% EtOH, 100% EtOH, Carnoy’s Fluid, 100% EtOH, H2O, 100% EtOH). Samples were sprayed with 2′,6′-dihydroxyacetophenone (DHA). Following matrix application, high-mass-resolution IMS of intact intestinal samples was performed using a Solarix 15T MALDI FT-ICR mass spectrometer (Bruker Daltonics, Billerica, MA). Data and box plots were visualized using SCiLS Lab 2020 (Bruker Daltonics, Billerica, MA).
LA-ICP Imaging MS of Trace Elements.
Trace element imaging was performed as previously described.14 Samples were ablated using an LSX-213 laser ablation system (Teledyne CETAC, Omaha, NE) and analyzed using a coupled Element 2 high-resolution sector field ICP-MS (Thermo Fisher Scientific, Waltham, MA) operated in medium-resolution mode. Helium gas was used to assist in transport of ablated sample particles from the ablation chamber to the ICP-MS. The resulting data were converted into vender-neutral imzML format and visualized using SCiLS Lab 2020.
MALDI timsTOF Imaging MS of Lipids.
Samples for lipid analysis were washed with ammonium formate and distilled H2O prior to matrix application. 1,5-Diaminonapthalene (DAN) matrix was sublimated onto the tissue. IMS was performed using a timsTOF Pro equipped with a dual ESI/MALDI and operated in qTOF mode with TIMS deactivated (Bruker Daltonics, Billerica, MA).15 All tentative lipid identifications were made based on mass accuracy using the LIPIDMAPS database (lipidmaps.org) with a 5 ppm mass tolerance.
RESULTS AND DISCUSSION
Imaging of Proximal and Distal Regions of Small Intestine with Intact Luminal Content.
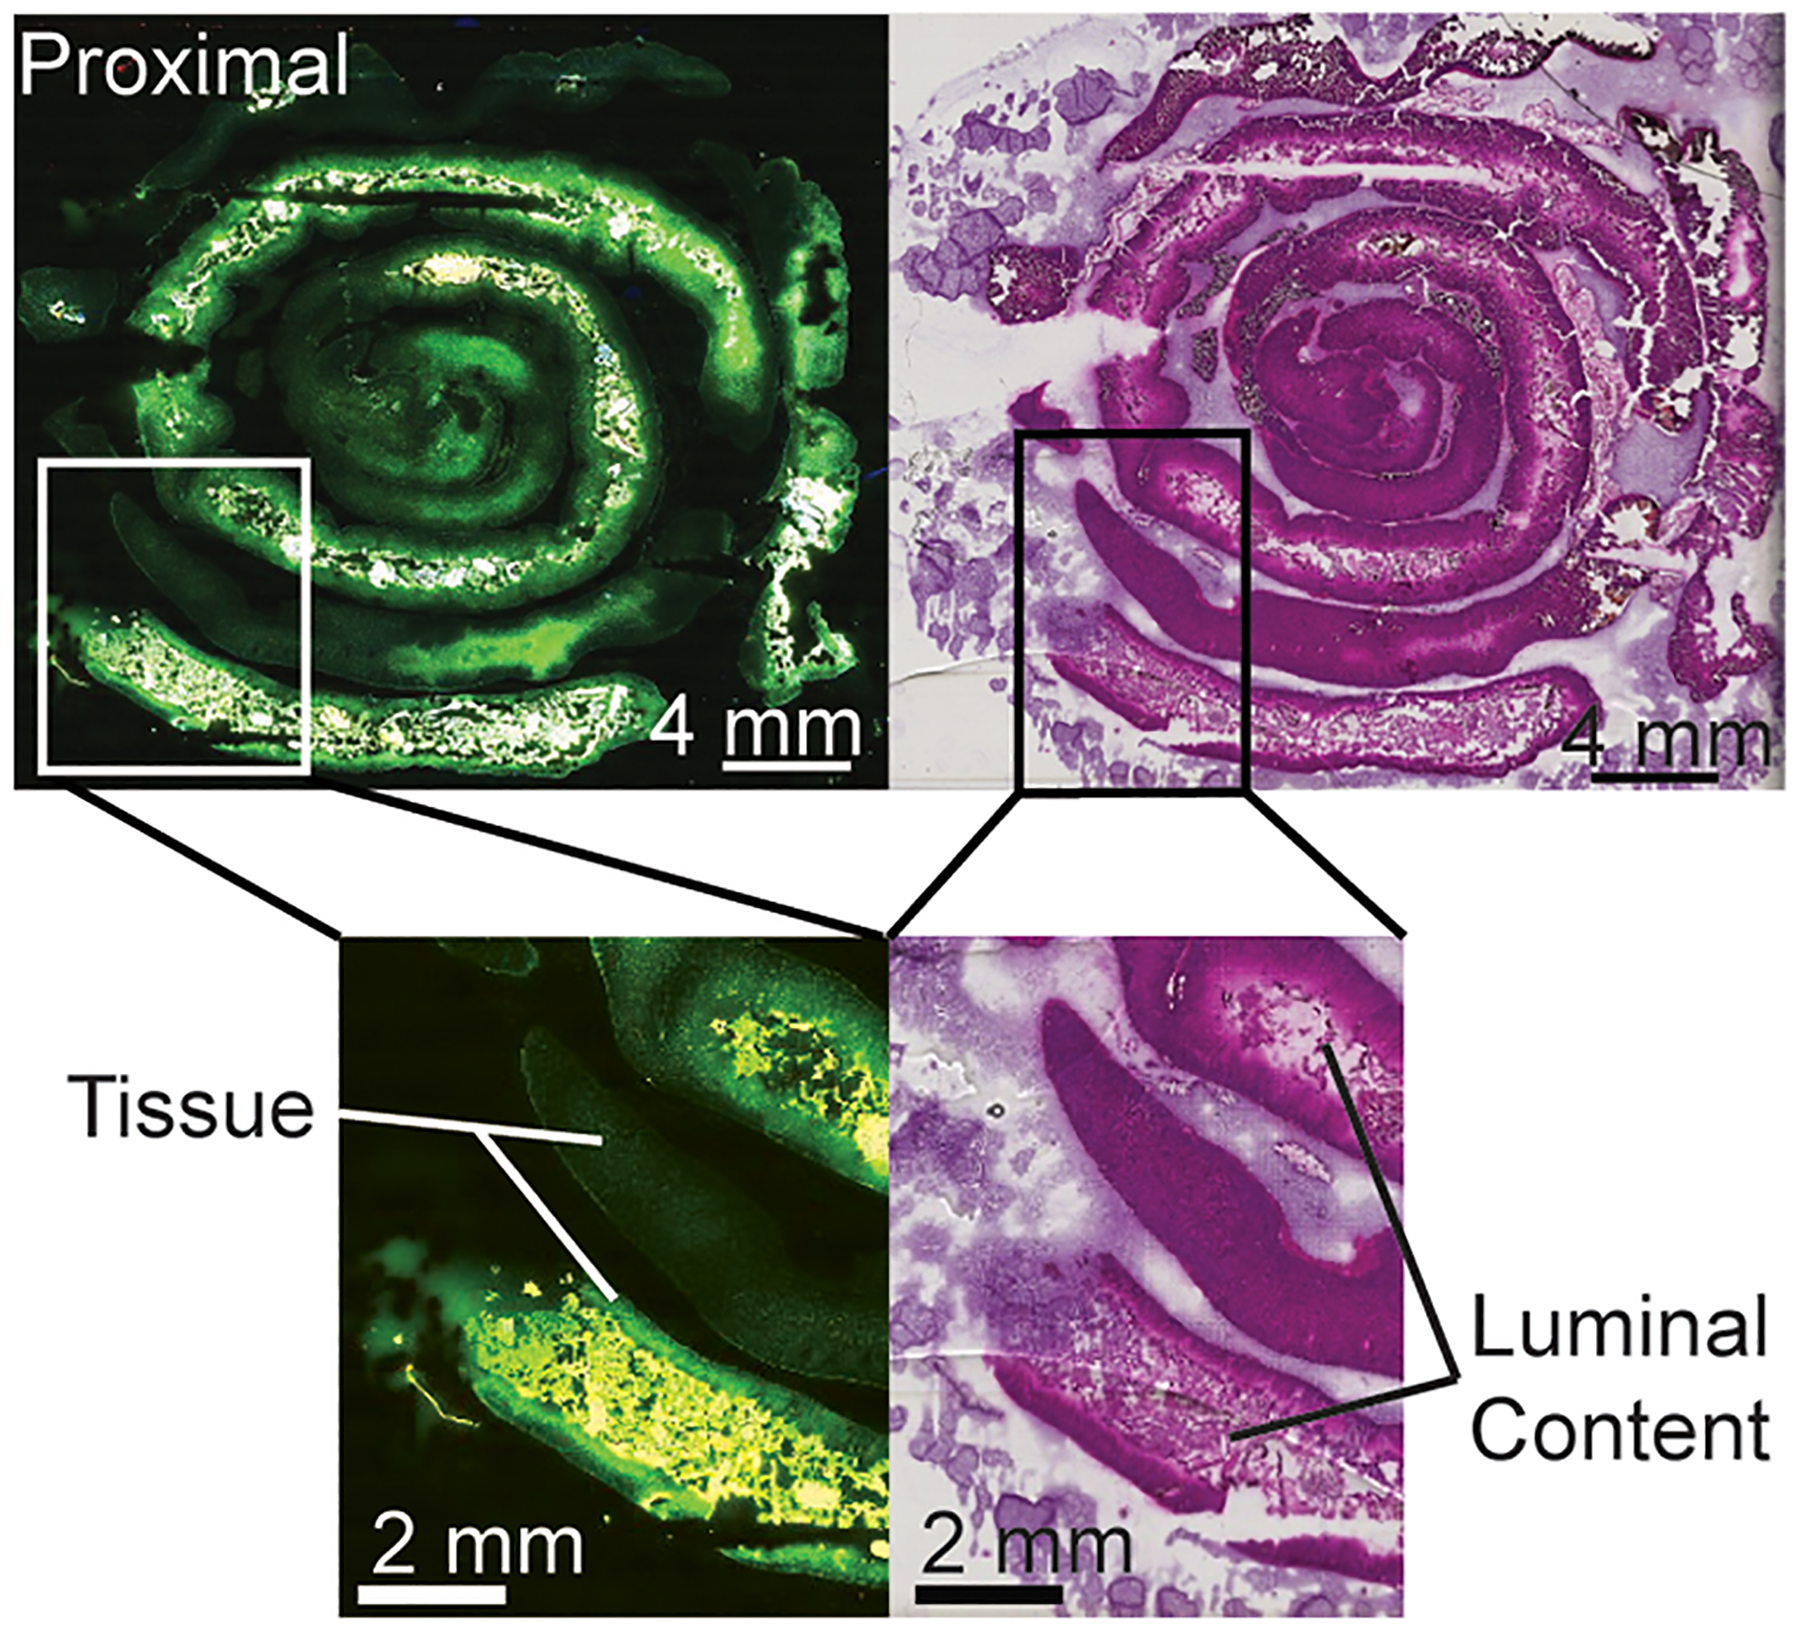
Regions of the GI tract can have dramatically different molecular makeups due in part to the higher microbial burden in the distal small intestine.3 Microbiota contribute greatly to the molecular diversity within the mouse GI tract, including unique metabolites and interactions with dietary fats. The length of the GI tract prevents analysis of the entire tissue on one slide. The small intestine of a mouse is approximately 33 cm long.16 The modified Swiss roll conformation, as shown in Figure 1, allows for half (~16 cm) of this organ to be imaged at once with only one tissue section.
Figure 1.

Autofluorescence and hematoxylin and eosin stains of a proximal small intestine sample with intact luminal content in a modified Swiss roll conformation.
Luminal content adds additional sample preparation considerations for IMS analysis. For example, with washing protocols there is loss of luminal content and/or poor tissue retention with glass and ITO-coated slides. To address this sample loss, a polylysine coating was applied to indium tin oxide (ITO) coated slides.17 ITO slides, with and without a polylysine coating, and glass microscope slides were compared for tissue and luminal content retention following two different washing protocols (Figure S1). For lipid imaging, retention was tested after an aqueous ammonium formate (AF) wash to remove salts that lead to adduct formation (Figure S1a). For imaging proteins, retention was tested following a Carnoy wash, consisting of graded ethanol washes and Carnoy’s fluid to remove lipids (Figure S1b).18 Using glass slides tissue dropout was observed, luminal content was removed with an ammonium formate wash, and luminal content was also lost during a Carnoy wash. An ITO surface alone did not provide enough adherence to maintain luminal content during both washes. Overall, poly l-lysine coating improved tissue adherence and luminal content when implementing an ammonium formate wash and to a lesser degree with a Carnoy wash. These data suggest that utilizing a polylysine coating when working with intestinal tissue increases the spatial integrity of the sample.
Tissue and Luminal Content in the Gastrointestinal Tract Show Unique Multimodal Molecular Profiles.
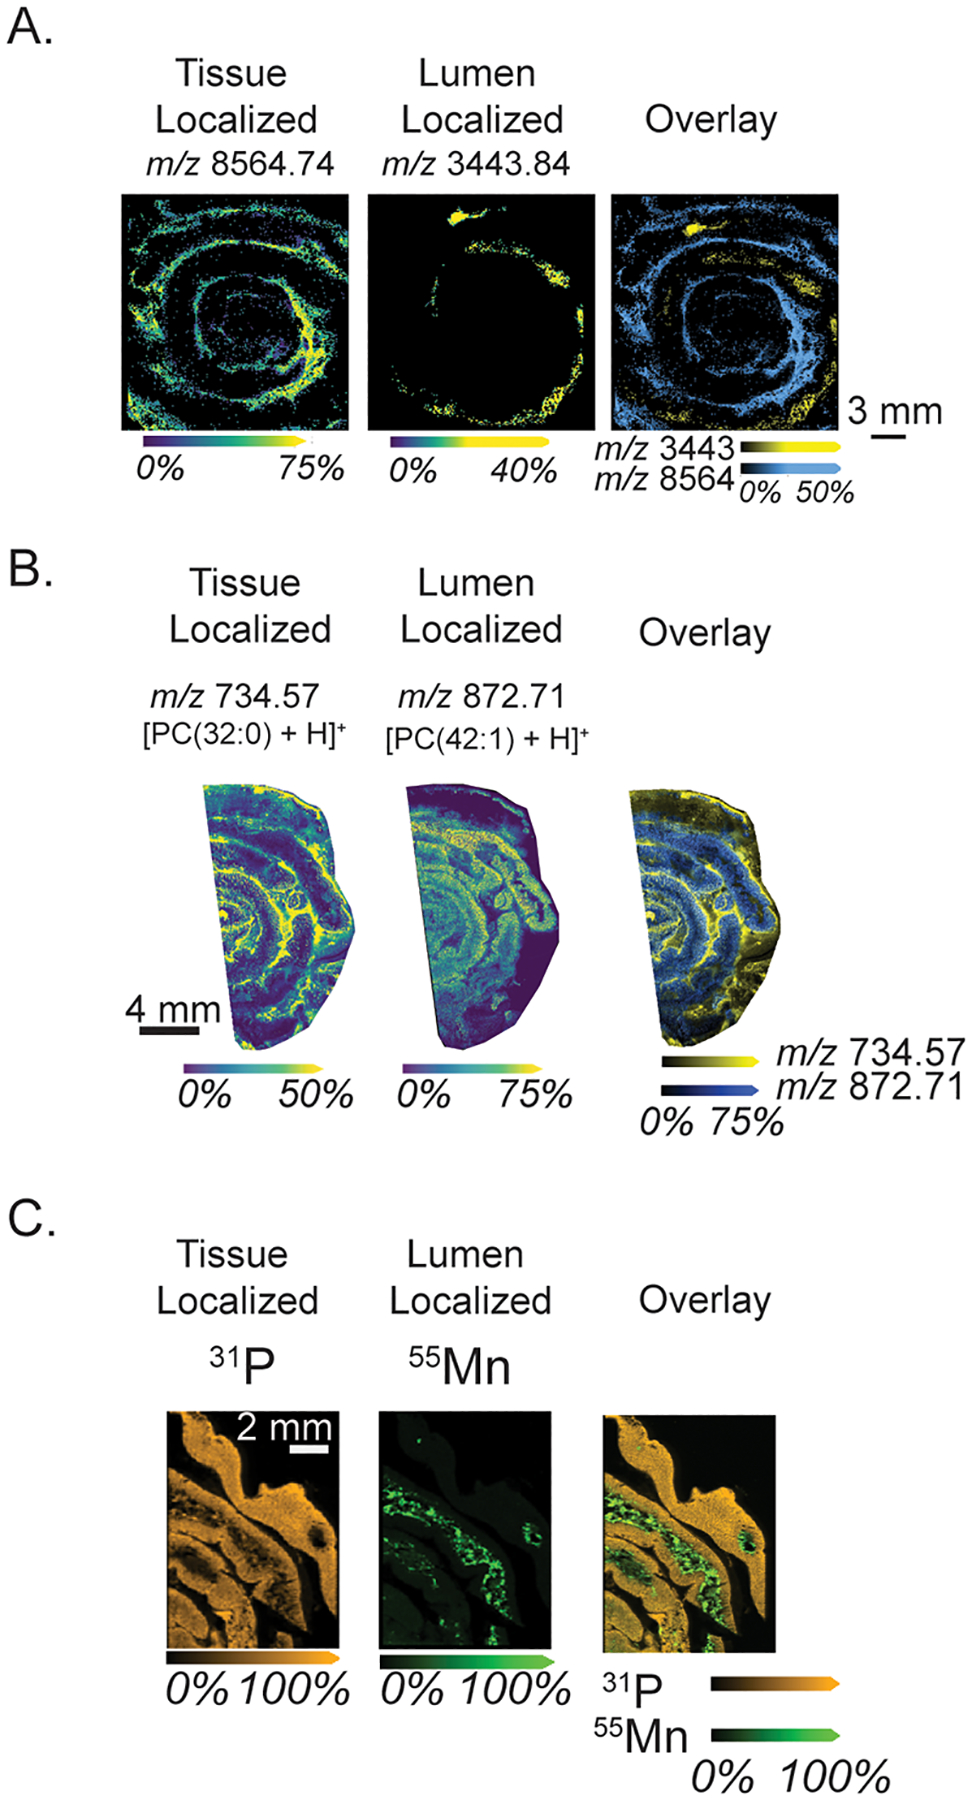
To fully elucidate the molecular differences between gut tissue and luminal content, several IMS modalities were applied to proximal small intestinal tissues. Using the polylysine coating, and respective washing methodologies (summarized in Figure S2), unique distributions of proteins, lipids, and elements were identified, which alludes to the molecular complexity of the gut microenvironment. Autofluorescence images of these tissues are shown in Figure S3. Figure 2a shows proteins that localize either exclusively to the tissue or to luminal content, highlighting the unique molecular profile of the luminal content and its distinction from tissue-only samples. Figure 2b shows tentatively identified phosphatidylcholines with distinct localization patterns, despite being from the same lipid class, suggesting a difference between host lipids and diet-derived fecal lipids. For instance, tentatively identified PC(32:0) is approximately 80× higher intensity in tissue compared to luminal content, while PC(42:1) is approximately 2.5× higher intensity in luminal content (Figure S4). This method informs analysis of the gastrointestinal tract using morphological cues provided by complementary microscopy to enable pixel-to-pixel comparisons of molecular intensity, for instance, between lipids that were observed to be specific to lumen and tissue regions of the sample. Figure 2c shows elemental imaging contrasting dietary metals in the feces (manganese) and elements within the tissue (phosphorus, 2× higher intensity in tissue). Average intensities per region for each represented ion are shown in Figure S4. These multimodal IMS images highlight the reproducibility of polylysine coating for tissue retention as well as the value in studying luminal content alongside intestinal tissue as a unique microenvironment.
Figure 2.

Multimodal IMS shows unique molecular profiles between tissue and luminal content regions. (A) Protein imaging shows a tissue-specific localized protein, a luminal content-specific protein, and overlaid proteins (image selection window: values ±31 mDa). (B) Lipid imaging shows tissue and lumen associated localizations, tentatively identified as [PC(32:0) + H]+ (2.99 ppm error) and [PC(42:1) + H]+ (0.80 ppm error) (image selection window: values ±22 mDa). (C) Elemental imaging using LA-ICP IMS shows unique elemental distributions between tissue-specific (P) and lumen-specific (Mn) elements and an overlaid image (image selection window: values ±58 mDa).
Overall, this workflow to collect and analyze multimodal imaging mass spectrometry data from intestinal tissue with luminal content offers a more comprehensive insight into the gastrointestinal tract through improved molecular/elemental coverage and luminal content retention. This application can be applied to further our understanding of various digestive diseases and how the complex dynamic of the GI tract may change from the internal and external factors that act upon it.
Supplementary Material
ACKNOWLEDGMENTS
We gratefully acknowledge lab members for review of this manuscript and Dr. William Perry for his assistance with elemental imaging. This work was supported by the National Institute of Allergy and Infectious Diseases Grant Nos. R01AI45992 and R01AI145992 (to E.P.S. and J.M.S.). The prototype MALDI timsTOF MS was developed as part of the National Science Foundation Major Research Instrument Program (CBET-1828299 awarded to J.M.S. and R.M.C.), and the Bruker 15T solariX FT-ICR MS in the Mass Spectrometry Research Center at Vanderbilt University was acquired through the NIH Shared Instrumentation Grant Program (Grant No. 1S10OD012359 awarded to R.M.C.). A.G.W. was supported by a fellowship from the Helen Hay Whitney Foundation. C.J.G. is supported by a National Institute of Allergy and Infectious Diseases training grant (1T32AI112541-01A1).
Footnotes
Supporting Information
The Supporting Information is available free of charge at https://pubs.acs.org/doi/10.1021/jasms.1c00360.
Additional experimental details and methods, including autofluorescence images of main text figure tissue, washing experiments, a sample preparation workflow, and box plots for intensity differences for ions shown in Figure 2 (PDF)
Complete contact information is available at: https://pubs.acs.org/10.1021/jasms.1c00360
The authors declare no competing financial interest.
Contributor Information
Emma R. Guiberson, Mass Spectrometry Research Center, Vanderbilt University, Nashville, Tennessee 37203, United States; Department of Chemistry, Vanderbilt University, Nashville, Tennessee 37203, United States.
Christopher J. Good, Mass Spectrometry Research Center, Vanderbilt University, Nashville, Tennessee 37203, United States; Department of Chemistry, Vanderbilt University, Nashville, Tennessee 37203, United States
Aaron G. Wexler, Vanderbilt Institute for Infection, Immunology, and Inflammation, Vanderbilt University Medical Center, Nashville, Tennessee 37203, United States; Department of Pathology, Microbiology, and Immunology, Vanderbilt University Medical Center, Nashville, Tennessee 37203, United States.
Eric P. Skaar, Vanderbilt Institute for Infection, Immunology, and Inflammation, Vanderbilt University Medical Center, Nashville, Tennessee 37203, United States; Department of Pathology, Microbiology, and Immunology, Vanderbilt University Medical Center, Nashville, Tennessee 37203, United States
Jeffrey M. Spraggins, Mass Spectrometry Research Center, Vanderbilt University, Nashville, Tennessee 37203, United States; Department of Chemistry, Department of Biochemistry, and Department of Cell and Developmental Biology, Vanderbilt University, Nashville, Tennessee 37203, United States.
Richard M. Caprioli, Department of Chemistry, Department of Biochemistry, and Department of Pharmacology, Vanderbilt University, Nashville, Tennessee 37203, United States; Department of Medicine, Vanderbilt University, Nashville, Tennessee 37203g, United States
REFERENCES
- (1).Peery AF; Crockett SD; Murphy CC; Lund JL; Dellon ES; Williams JL; Jensen ET; Shaheen NJ; Barritt AS; Lieber SR; et al. Burden and Cost of Gastrointestinal, Liver, and Pancreatic Diseases in the United States: Update 2018. Gastroenterology 2019, 156 (1), 254–272. [DOI] [PMC free article] [PubMed] [Google Scholar]
- (2).Thursby E; Juge N Introduction to the Human Gut Microbiota. Biochem. J 2017, 474 (11), 1823–1836. [DOI] [PMC free article] [PubMed] [Google Scholar]
- (3).Hillman ET; Lu H; Yao T; Nakatsu CH Microbial Ecology along the Gastrointestinal Tract. Microbes Environ. 2017, 32(4), 300–313. [DOI] [PMC free article] [PubMed] [Google Scholar]
- (4).Rineh A; Kelso MJ; Vatansever F; Tegos GP; Hamblin MR Clostridium Difficile Infection: Molecular Pathogenesis and Novel Therapeutics. Expert Rev. Anti Infect Ther 2014, 12 (1), 131–150. [DOI] [PMC free article] [PubMed] [Google Scholar]
- (5).Li Z; Quan G; Jiang X; Yang Y; Ding X; Zhang D; Wang X; Hardwidge PR; Ren W; Zhu G Effects of Metabolites Derived from Gut Microbiota and Hosts on Pathogens. Front. Cell. Infect. Microbiol 2018, DOI: 10.3389/fcimb.2018.00314. [DOI] [PMC free article] [PubMed] [Google Scholar]
- (6).Caprioli RM; Farmer TB; Gile J Molecular Imaging of Biological Samples: Localization of Peptides and Proteins Using MALDI-TOF MS. Anal. Chem 1997, 69 (23), 4751–4760. [DOI] [PubMed] [Google Scholar]
- (7).Kaya I; Jennische E; Lange S; Malmberg P Analytical Methods Dual Polarity MALDI Imaging Mass Spectrometry on the Same Pixel Points Reveals Spatial Lipid Localizations at High-Spatial Resolutions in Rat Small Intestine †. Anal. Methods 2018, 10, 2428–2435. [DOI] [PMC free article] [PubMed] [Google Scholar]
- (8).Genangeli M; Heijens AMM; Rustichelli A; Schuit ND; Micioni Di Bonaventura MV; Cifani C; Vittori S; Siegel TP; Heeren RMA MALDI-Mass Spectrometry Imaging to Investigate Lipid and Bile Acid Modifications Caused by Lentil Extract Used as a Potential Hypocholesterolemic Treatment. J. Am. Soc. Mass Spectrom 2019, 30, 2041. [DOI] [PMC free article] [PubMed] [Google Scholar]
- (9).Carter CL; Hankey KG; Booth C; Tudor GL; Parker GA; Jones JW; Farese AM; MacVittie TJ; Kane MA Characterizing the Natural History of Acute Radiation Syndrome of the Gastrointestinal Tract: Combining High Mass and Spatial Resolution Using MALDI-FTICR-MSI Claire. Health Phys. 2019, 116 (4), 454–472. [DOI] [PMC free article] [PubMed] [Google Scholar]
- (10).Wexler AG; Guiberson ER; Beavers WN; Caprioli RM; Spraggins JM; Skaar EP Clostridioides Difficile Infection Induces a Rapid Influx of Bile Acids into the Gut during Colonization of the Host. Cell Reports 2021, 36 (10), 109683. [DOI] [PMC free article] [PubMed] [Google Scholar]
- (11).Bialkowska AB; Ghaleb AM; Nandan MO; Yang VW Improved Swiss-Rolling Technique for Intestinal Tissue Preparation for Immunohistochemical and Immunofluorescent Analyses. J. Vis. Exp 2016, 2016 (113), 1–8. [DOI] [PMC free article] [PubMed] [Google Scholar]
- (12).Pereira e Silva A; Lourenco AL; Marmello BO; Bitteti M; Teixeira GAPB Comparison of Two Techniques for a Comprehensive Gut Histopathological Analysis: Swiss Roll versus Intestine Strips. Exp. Mol. Pathol 2019, 111 (July), 104302. [DOI] [PubMed] [Google Scholar]
- (13).Jensen R; Buffangeix D; Covi G Measuring Water Content of Feces by the Karl Fischer Method. Clin. Chem 1976, 22 (8), 1351–1354. [PubMed] [Google Scholar]
- (14).Becker JS; Zoriy M; Matusch A; Wu B; Salber D; Palm C; Becker JS Bioimaging of Metals by Laser Ablation Inductively Coupled Plasma Mass Spectrometry (LA-ICP-MS). Mass Spectrom. Rev 2010, 29 (1), 156–175. [DOI] [PubMed] [Google Scholar]
- (15).Spraggins JM; Djambazova KV; Rivera ES; Migas LG; Neumann EK; Fuetterer A; Suetering J; Goedecke N; Ly A; Plas R Van De High-Performance Molecular Imaging with MALDI Trapped Ion- Mobility Time-of-Flight (TimsTOF) Mass Spectrometry. Anal. Chem 2019, 91, 14552. [DOI] [PMC free article] [PubMed] [Google Scholar]
- (16).Hugenholtz F; de Vos WM Mouse Models for Human Intestinal Microbiota Research: A Critical Evaluation. Cell. Mol. Life Sci 2018, 75 (1), 149–160. [DOI] [PMC free article] [PubMed] [Google Scholar]
- (17).Mazia D; Schatten G; Sale W Adhesion of Cells to Surfaces Coated with Polylysine. J. Cell Biol 1975, 66, 198–200. [DOI] [PMC free article] [PubMed] [Google Scholar]
- (18).Yang J; Caprioli RM Matrix Sublimation/Recrystallization for Imaging Proteins by Mass Spectrometry at High Spatial Resolution. Anal. Chem 2011, 83 (14), 5728–5734. [DOI] [PMC free article] [PubMed] [Google Scholar]
Associated Data
This section collects any data citations, data availability statements, or supplementary materials included in this article.


