

Abstract
Introduction
A few copy number variations (CNVs) have been reported for Alzheimer's disease (AD). However, there is a lack of a systematic investigation of CNVs in AD based on whole genome sequencing (WGS) data.
Methods
We used four methods to identify consensus CNVs from the WGS data of 1,411 individuals and further investigated their functional roles in AD using the matched transcriptomic and clinicopathological data.
Results
We identified 3,012 rare AD‐specific CNVs whose residing genes are enriched for cellular glucuronidation and neuron projection pathways. Genes whose mRNA expressions are significantly correlated with common CNVs are involved in major histocompatibility complex class II receptor activity. Integration of CNVs, gene expression, and clinical and pathological traits further pinpoints a key CNV that potentially regulates immune response in AD.
Discussion
We identify CNVs as potential genetic regulators of immune response in AD. The identified CNVs and their downstream gene networks reveal novel pathways and targets for AD.
Keywords: Alzheimer's disease, copy number variation, correlation network, immune response, late‐onset Alzheimer's disease, multi‐omics integration, regulation of response to external stimulus, whole genomic sequencing
1. BACKGROUND
Alzheimer's disease (AD) is a neurodegenerative disease affecting more than 50 million people worldwide. 1 By 2050, the worldwide frequency of AD is predicted to be 1 in 85 individuals older than 65. 2 The heritability of early‐onset familial AD (EOAD) is estimated to be as high as 79%, based on a large twin study. 3 However, relative to late‐onset “sporadic” AD, EOAD is relatively rare (≤5%). 4 , 5 Three genes (i.e., APP, PSEN1, and PSEN2) have been found to have autosomal dominant mutations fully penetrant for EOAD. The genetic mechanisms underlying AD, especially late‐onset AD (LOAD), remain largely unclear, although previous genome‐wide association studies (GWAS) have identified 42 risk factor loci for LOAD. 6 , 7 , 8 Compared to single nucleotide polymorphisms (SNPs; ≈1%), 9 copy number variations (CNVs) affect a much larger fraction of the genome (≈10%). 9 , 10 , 11 In normal diploid human cells, genomic regions comprise two homologous parental sequence copies. However, there are long fragment deletions or duplications in some genomic regions, which deviate from the typical sequence copy number of two for the region. Such deletions and tandem duplications are collectively known as CNVs, 12 ranging in length from 50 bp to several Mb. 12 , 13 CNVs play a significant role in many neurological diseases such as Parkinson's disease (PD), 14 , 15 schizophrenia, 16 mental retardation, 2 and AD. 2 , 17 , 18 , 19 , 20 However, these studies have been limited to array comparative genomic hybridization (a‐CGH), targeted polymerase chain reaction (PCR), or SNP array approaches. 2 PCR‐based methods, such as quantitative PCR(qPCR), only cover a limited number of targeted regions. Even though a‐CGH analysis can cover the entire genome, its resolution is low (≈5–10 kb). 2 SNP array‐based analysis can cover the entire genome but is underpowered to detect rare CNVs 10 and also has a low resolution for pinpointing breakpoints (≈2–10 kb). 2
In this study, we first comprehensively identified CNVs from the paired‐end short read (2 × 150 bp)–based whole‐genome sequencing (WGS) data generated from post mortem brain tissues of 1411 North American White individuals across two cohorts from the Accelerating Medicines Partnership–Alzheimer's Disease (AMP‐AD) consortium, 21 including the Mount Sinai/JJ Peters VA Medical Center Brain Bank (MSBB) AD cohort, 22 and the Religious Orders Study/Memory and Aging Project (ROSMAP) cohort 23 using four complementary CNV calling approaches (i.e., CNVnator, 24 Pindel, 25 MetaSV, 26 and Delly2 27 ). Within each cohort, individual‐level calling results from the four approaches were integrated into a set of population‐level CNVs. Furthermore, only consensus CNVs detected by three or more approaches in each cohort were used for afterward analysis to exclude software bias. Comparing 701 LOAD cases with 710 non‐AD cases, we identified 3,012 rare AD‐specific CNVs genome‐wide. The AD‐specific CNVs were only observed in AD cases. Sixty‐four AD‐specific CNVs were conserved across two cohorts. The AD‐specific CNVs are enriched in transcriptional regions for biological processes such as cellular glucuronidation, neuron projection, and multicellular organismal signaling, a novel finding not found in AD GWAS. By further integrating clinical, pathophysiological, and transcriptomic data, we found that common CNVs affect the transcription levels of genes involved in major histocompatibility complex (MHC) class II receptor activity across different brain regions, supporting previous reports of the increased immune response in AD. 28 Three CNVs (i.e., mCNV233, mCNV236, and mCNV11665) are significantly negatively correlated with the Braak score in the dorsolateral prefrontal cortex (DLPFC) region. CNV‐Gene‐Trait correlation networks integrating matched multi‐omics and clinicopathological data first pinpoint one novel CNV, a key regulator for immune response (DEL6619.MSBB/mCNV21544.ROSMAP), and further provide many novel gene targets that connect CNVs with clinical and pathological traits of AD. All consensus CNVs of the two cohorts have been uploaded to the AD Knowledge Portal (http://doi.org/10.7303/syn26254632), and the University of California Santa Cruz (UCSC) genome browser track (http://genome.ucsc.edu/s/c6ming2/AMPAD.CNVs).
Identification of AD‐specific CNVs provides a new perspective of AD's genetic risk factors. Moreover, the association of CNVs with matched clinical, pathological, and transcriptomic data sheds light on disease mechanisms. To our knowledge, this is the first genomic CNV study of LOAD by integrating WGS data with clinical, pathologic, transcriptomic data. The AD‐associated CNVs and the underlying gene targets deepen our understanding of the genetic mechanisms underlying AD.
2. RESULTS
2.1. Identification of consensus CNVs in the AMP‐AD cohorts
After excluding the duplications, contaminated samples, and outliers, the MSBB 22 and ROSMAP 23 cohorts contain 341 and 1129 samples, respectively. To exclude bias from demographic history, we focused on North American White samples in the analysis. There were 1411 samples left in total (MSBB: 284 samples, ROSMAP: 1127 samples; Methods 3.1, Tables S1‐S3 in supporting information). By integrating results from four different and complementary CNV calling approaches (CNVnator, 24 Pindel, 25 Delly2, 27 and MetaSV 26 ), we generated a set of CNVs for each cohort (Figure 1 and Figure 2, Table 1, Figure S1 in supporting information, Tables S4‐S6 in supporting information, and Methods 3.4). The robustness of these CNVs was further evaluated by the consensus among the four CNV calling approaches (Table S4). Consensus Class I includes the CNVs identified by only one calling method, and Consensus Class II consists of the CNVs determined by only two methods, while Consensus Class III contains the CNVs identified by three or more methods. We focused on the CNVs in the Consensus Class III in the subsequent analyses to exclude method bias. The Consensus Class III includes 7150 and 9902 CNVs in the MSBB and ROSMAP cohorts, respectively (Table 1, Figure 2A, and Tables S4‐S6). Two CNVs with a reciprocal overlap (RO) of 50% or greater in their genomic locations are considered to have significant overlap and are treated as the same CNV. The median individual CNV counts of the two cohorts are similar (i.e., 987 CNVs per individual in the MSBB, and 1052 in the ROSMAP cohort). The two cohorts share 3687 CNVs based on the RO threshold of 50% (Figure 2B and Table S7 in supporting information). To estimate our CNV calling pipeline's replication rate, we randomly picked four samples (i.e., three AD cases and one NL control) from the MSBB cohort, sequenced the corresponding genomes twice, and compared the CNV calling results from two batches. Our CNV calling pipeline's replication rate ranged from 97.30% to 98.63% (Table S8 in supporting information). We further compared our consensus CNV sets to four public CNV datasets based on large populations (i.e., Decipher, 29 DGV, 30 the 1000 Genome project, 31 and GnomAD 32 ). More than half of our CNVs were validated in the four public CNV datasets (Table S9 in supporting information). The overlaps between our consensus CNV sets and these public CNV datasets were generally greater than the overlaps between the public datasets. For example, the overlaps of the MSBB and ROSMAP CNV datasets and the GnomAD CNV dataset were approximately 74% and 59%, respectively, whereas the overlaps between GnomAD and DECIPHER, 1KGP, and DGV were approximately 39%, 51%, and 31%, respectively. The consensus CNV sets of the two cohorts were uploaded to the UCSC genome browser track, which can be viewed through the link: http://genome.ucsc.edu/s/c6ming2/AMPAD.CNVs. The full CNV matrixes of the two cohorts and scripts used to generate CNVs can be downloaded from the AD Knowledge Portal (http://doi.org/10.7303/syn26254632).
FIGURE 1.
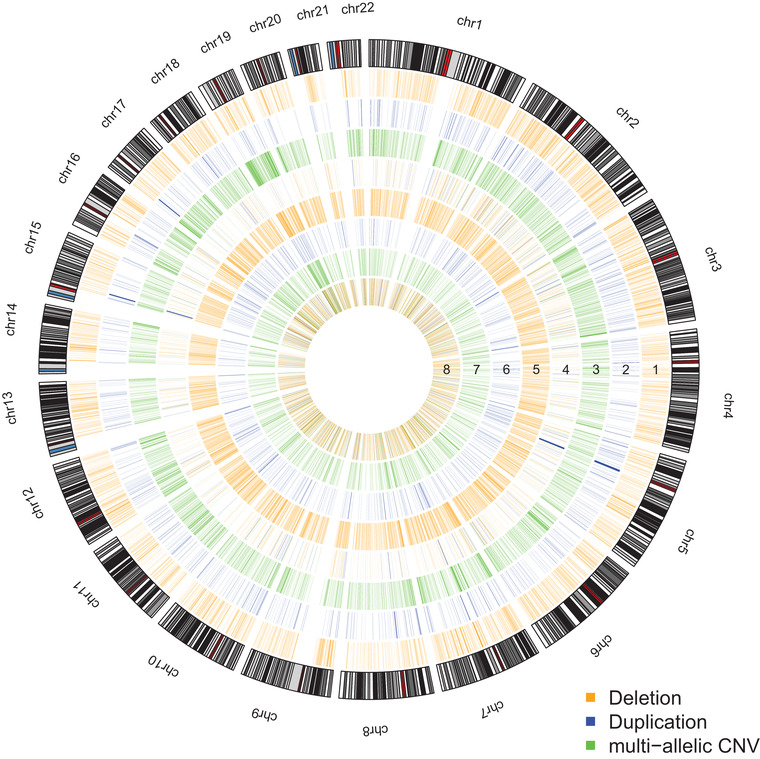
Genomic copy number variation (CNV) distribution in the two cohorts (MSBB and ROSMAP). Track 0: Human genome cytoband. Track 1: Deletions in ROSMAP. Track 2: Duplications in the ROSMAP. Track 3: multi‐allelic CNVs in ROSMAP. Track 4: Alzheimer's disease (AD)‐specific CNVs in the ROSMAP. Track 5: Deletions in MSBB. Track 6: Duplications in MSBB. Track 7: multi‐allelic CNVs in MSBB. Track 8: AD‐specific CNVs in MSBB. Orange and blue lines represent deletion and duplication, respectively. Green lines represent multi‐allelic CNVs
FIGURE 2.
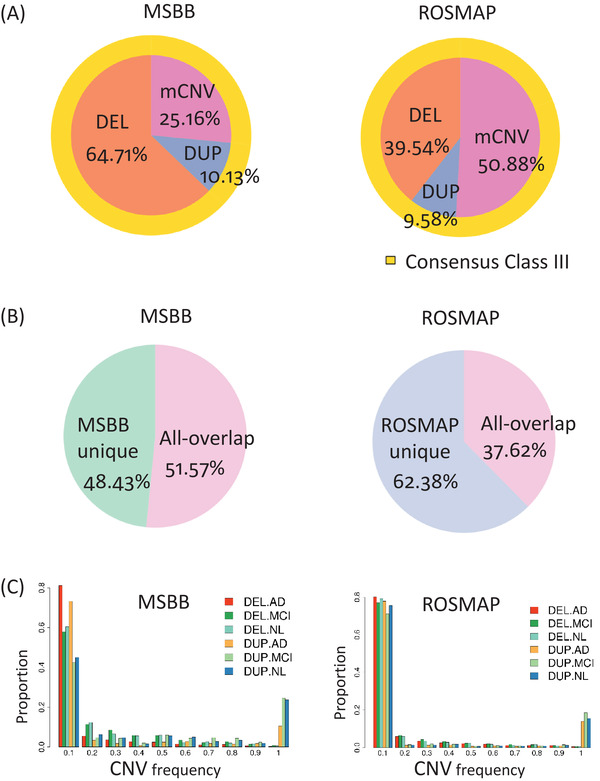
Overall features of the copy number variations (CNVs) identified in MSBB and ROSMAP, including composition of CNV types, site frequency spectrum (SFS). (A) Pie chart of the CNV composition in each cohort. The exact numbers can be found in Table 1. (B) CNV sharing pattern across the two cohorts. The exact numbers can be found in Table S7. The CNV proportion in each category is based on the boundary of each cohort separately. The overlapping criteria is defined as the reciprocal overlap ratio larger than 0.5. (C) SFS of deletions and duplications in the MSBB and ROSMAP cohorts
TABLE 1.
Summary of detected consensus autosomal CNVs from MSBB and ROSMAP
| CNV type | Calling Quality | MSBB | ROSMAP |
|---|---|---|---|
| Bi‐allelic deletions | Consensus class III | 4627 | 3915 |
| Bi‐allelic duplications | Consensus class III | 724 | 949 |
| Multi‐allelic CNVs | Consensus class III | 1799 | 5038 |
| Total CNVs | 7150 | 9902 | |
Note: Consensus class is defined by the supported software number. The consensus class III represents CNVs detected by three or more software programs. The numbers of Consensus class I and consensus Class II are reported in Table S4.
Abbreviations: CNV, copy number variation; MSBB, JJ Peters VA Medical Center Brain Bank; ROSMAP, Religious Orders Study/Memory and Aging Project.
HIGHLIGHTS
We systematically identified 3012 rare Alzheimer's disease (AD)‐specific copy number variations (CNVs) based on the whole genome sequencing data from 1411 individuals in two cohorts.
AD‐specific CNVs have distinct molecular functions compared to the normal control‐specific CNVs.
CNV‐correlated gene expressions are involved in major histocompatibility complex class II receptor activity and interferon‐gamma mediated signaling.
CNV‐correlated gene networks pinpoint a novel CNV as a key regulator for the immune response pathway in AD.
RESEARCH IN CONTEXT
Systematic review: A few rare copy number variations (CNVs) have been implicated in Alzheimer's disease (AD), but there is no systematic study of CNVs in AD based on whole genome sequencing (WGS) data.
Interpretation: We analyzed the WGS data of 1411 North American White individuals from two AD cohorts and identified 3012 rare AD‐specific CNVs. Rare AD‐specific CNVs were involved in cellular glucuronidation and neuron projection. We further revealed the functional contexts of the identified CNVs by integration with matched transcriptomic, clinical, and pathological data.
Future directions: The functional impact of the above‐identified AD‐specific CNVs and common CNV‐correlated RNAs need to be experimentally validated in future studies. Another important direction to pursue is whether somatic CNV mutation rates differ across brain regions or at disease states.
2.2. Distinct molecular functions of AD‐ and mild cognitive impairment–specific CNVs
We further categorized all samples of the MSBB and ROSMAP cohorts into three clinical diagnostic groups (i.e., the AD group, the mild cognitive impairment (MCI) group, and the normal control (NL) group) based on the disease severity measurement Clinical Dementia Rating (CDR). In the MSBB cohort, 22 there are 224 AD samples with CDR > 0.5, 27 MCI samples with CDR = 0.5, and 33 NL samples without cognitive impairment (CDR = 0). The ROSMAP cohort 23 includes 477 AD samples, 285 MCI samples, and 365 NL samples. In total, there are 701 LOAD, 312 MCI, and 398 NL samples (Tables S1‐S2). In the subsequent analyses, we focused on studying the effect of CNVs in the clinical diagnostic AD group.
Each CNV was assigned to a clinical diagnostic group to which the respective sample belonged (Figure 3A). Group‐specific CNVs are defined as CNVs that are only observed in one specific group but not in any other group (Figure 3B). For example, the AD‐specific CNVs are CNVs only observed in the AD cases in the two cohorts under study but not in the NL and MCI cases. If the frequency of a CNV in the AD group is greater than 0 and its frequency in the non‐AD groups (i.e., the MCI and NL groups) is zero, this CNV is called an AD‐specific CNV. Similarly, the MCI‐specific CNVs are only observed in the MCI cases, while the NL‐specific CNVs are only observed in the NL cases (Figure 3B). By excluding the CNVs detected in any of the 710 non‐AD cases (i.e., the 312 MCI cases and 398 NL), we identified 3012 unique AD‐specific CNVs in the 701 AD cases from the MSBB and ROSMAP cohorts (MSBB: 2185, ROSMAP: 891; Figure 3C, Table S10 in supporting information). Among these AD‐specific CNVs, 64 were conserved in the two cohorts (Figure 3C, Figure 4E, and Table S10). The AD‐specific CNVs were observed at low population frequencies ( in , in , Figure 3D). There was no significant difference in the total CNV length or the total CNV count per individual between the AD, MCI, and NL groups in MSBB or ROSMAP, based on the Quasi‐Poisson regression model (QPRM; Methods 3.5, and Table S11 in supporting information). In MSBB, the mean number (17.19) of the AD‐specific CNVs per AD case is significantly higher than that (6.7) of the MCI‐specific CNVs per MCI case (QPRM Padj =) and that (6.64) of the NL‐specific CNVs per NL case (QPRM Padj =; Table S12 and Figure S2 in supporting information). A similar trend was observed in ROSMAP. In QPRM, the clinical diagnostic group is the main predictor variable, the response variable is “the total CNV count” or “the total CNV length” or “the group‐specific CNV count” per individual, while sex and age of death are co‐variants (Methods 3.5).
FIGURE 3.
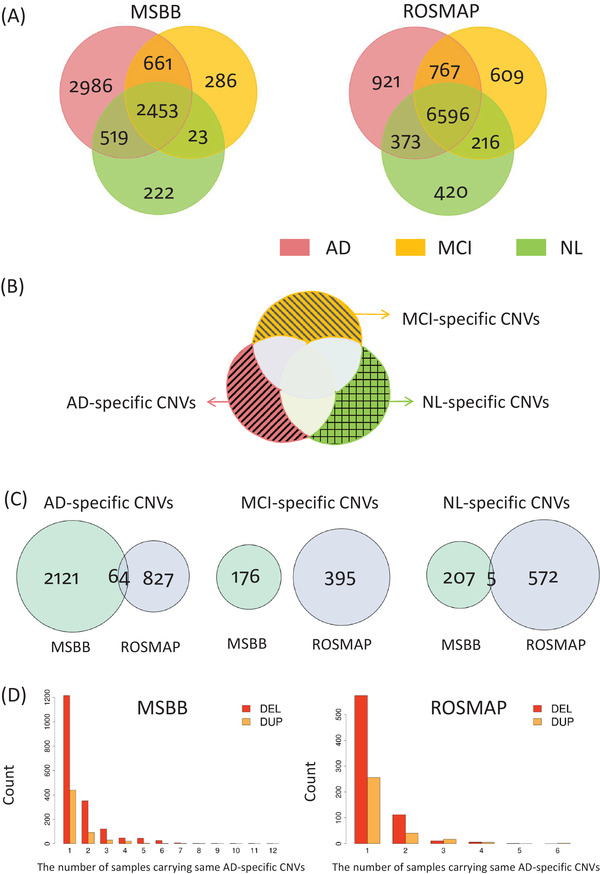
Comparison of the copy number variation (CNV) sets in three clinical diagnostic groups (normal (NL), mild cognitive impairment (MCI), and AD) in MSBB and ROSMAP. (A) Intersection of the CNV sets in three different diagnostic groups in each cohort. The numbers are defined by comparing different diagnostic groups in the same cohort. (B) Illustration of the concept of group‐specific CNVs. The pink, orange, and green shadow regions represent the AD‐specific, MCI‐specific, and NL‐specific CNV sets. All the samples in the two cohorts are considered here. (C) Intersection of the diagnostic group‐specific CNV sets in MSBB and ROSMAP. The numbers are based on the cross‐cohort comparison. (D) Site frequency spectrum of AD‐specific deletions and duplications. DEL and DUP represent deletion and duplication, respectively
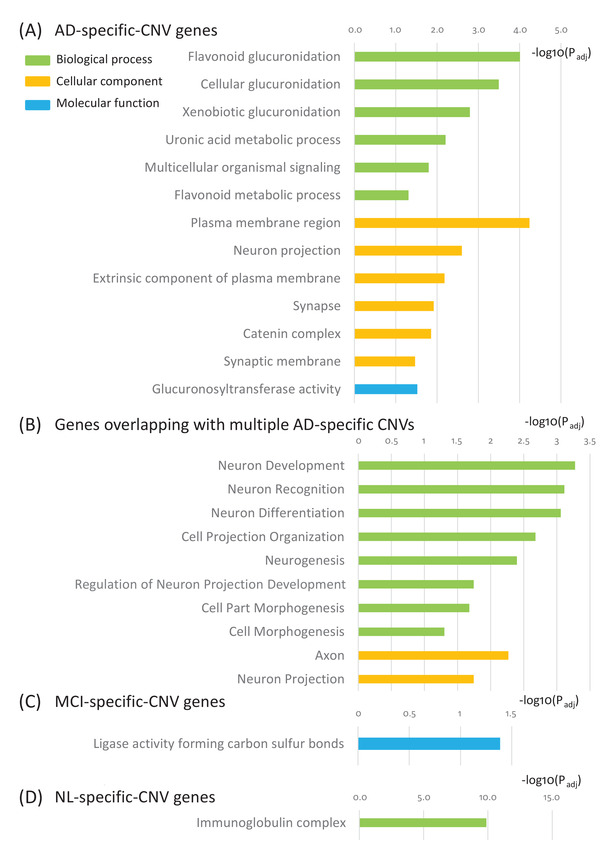
FIGURE 4.
Functional analysis of Alzheimer's disease (AD)‐, mild cognitive impairment (MCI)‐, and normal (NL)‐specific copy number variation (CNV) genes. CNV genes are the genes whose genomic locations overlap with a given CNV. (A) AD‐specific CNV genes are enriched for cellular glucuronidation, neuron projection, uronic acid metabolic process, extrinsic component of plasma membrane, synapse, catenin complex, and multicellular organismal signaling. (B) Genes whose genomic locations overlap with multiple AD‐specific CNVs are enriched for neuron development, neuron recognition, neuron differentiation, cell projection organization, neurogenesis, axon, and neuron projection. (C) MCI‐specific CNV genes are enriched for ligase activity forming carbon‐sulfur bonds. (D) NL‐specific CNV genes are enriched for immunoglobulin complex. (E) Circos plot of the 64 conserved AD‐specific CNVs in JJ Peters VA Medical Center Brain Bank and Religious Orders Study/Memory and Aging Project. The outer track 1 represents the genomic locations of the 64 conserved AD‐specific CNVs, while the outer track 2 represents the genes whose genomic locations overlap these 64 CNVs. The inner track 1 represents the genomic location of the APP duplication region. (F) The 29 AD‐specific CNVs encompassing the APP duplication region illustrated in the University of California Santa Cruz genome browser track. The light blue shade represents the location of the APP gene
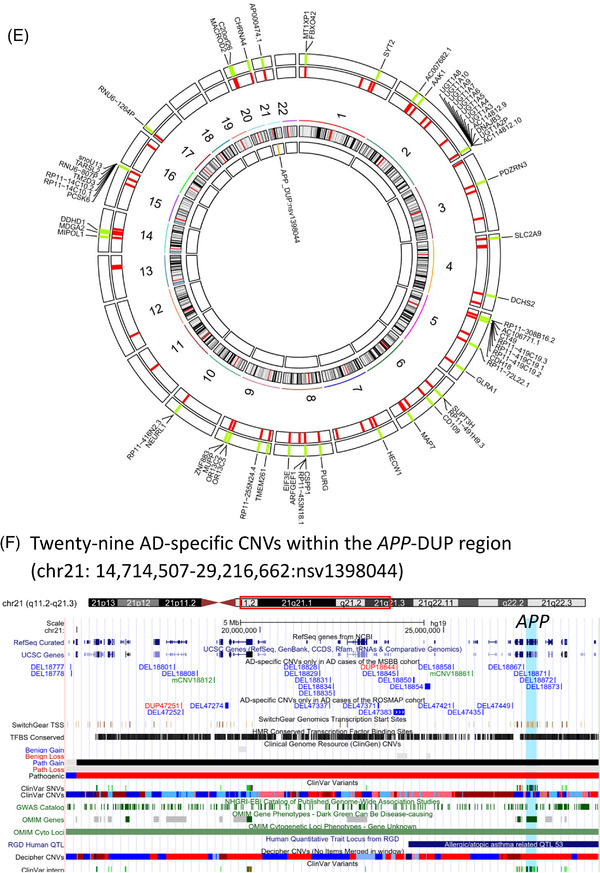
One of the 64 AD‐specific CNVs conserved across the two cohorts resides within the duplication region encompassing the APP gene (chr21:14,714,507‐29,216,662: nsv1398044; Figure 4E). The other 63 conserved AD‐specific CNVs have not been associated with AD and thus are novel (Figure 4E, and Table S13 in supporting information). Interestingly, the majority of these conserved AD‐specific CNVs (61 out of 64) are reported in other published CNV datasets, which are based on large populations without mental or neuropathological trait records (i.e., Decipher, 29 DGV, 30 the 1000 Genome project, 31 and GnomAD 32 ; Table S13). Their frequency is much higher in the AD group than the general population with European ancestry based on the GnomAD database (Table S13).
Genes whose transcriptional regions reside in the genomic regions of AD‐specific CNVs are defined as AD‐CNV genes in the subsequent analyses (Figure S3 in supporting information). The AD‐CNV genes are significantly enriched for important biological processes such as cellular glucuronidation, neuron projection, uronic acid metabolic process, extrinsic component of plasma membrane, synapse, catenin complex, and multicellular organismal signaling (Figure 4A, Table 2, Figure S3, and Table S14 in supporting information). Furthermore, the genes overlapping with multiple AD‐specific CNVs are enriched in many neuron‐related pathways such as neuron development, neuron recognition, neuron differentiation, cell projection organization, neurogenesis, axon, and neuron projection (Figure 4B, Table 2, Figure S3, and Table S14). The genes residing in the genomic regions of the MCI‐specific CNVs (termed MCI‐CNV genes) are associated with ligase activity forming carbon‐sulfur bonds (Figure 4C, Table 2, Table S14). In contrast, the genes residing in the genomic regions of the NL‐specific CNVs (termed NL‐CNV genes) are enriched for immunoglobulin complex (Figure 4D, Table 2, Table S14). These results reveal distinct molecular functions of AD‐ and MCI‐specific CNVs compared to the NL‐specific ones.
TABLE 2.
Pathways enriched in the group‐specific CNV genes
| Group | GO term | FET_P a | Padj | Fold enrichment b |
|---|---|---|---|---|
| AD‐CNV genes | Plasma Membrane Region | 1.85E‐09 | 5.80E‐05 | 1.67 |
| Flavonoid Glucuronidation | 3.13E‐09 | 9.80E‐05 | 13.39 | |
| Cellular Glucuronidation | 1.02E‐08 | 3.20E‐04 | 8.29 | |
| Xenobiotic Glucuronidation | 5.08E‐08 | 1.60E‐03 | 10.96 | |
| Neuron Projection | 8.00E‐08 | 2.50E‐03 | 1.56 | |
| Uronic Acid Metabolic Process | 1.98E‐07 | 6.20E‐03 | 6.63 | |
| Extrinsic Component of Plasma Membrane | 2.12E‐07 | 6.60E‐03 | 2.76 | |
| Synapse | 3.78E‐07 | 1.20E‐02 | 1.54 | |
| Catenin Complex | 4.51E‐07 | 1.40E‐02 | 5.65 | |
| Multicellular Organismal Signaling | 5.27E‐07 | 1.60E‐02 | 2.52 | |
| Glucuronosyltransferase Activity | 9.67E‐07 | 3.00E‐02 | 5.32 | |
| Synaptic Membrane | 1.09E‐06 | 3.40E‐02 | 2.05 | |
| Flavonoid Metabolic Process | 1.56E‐06 | 4.90E‐02 | 8.04 | |
| Genes overlapping with multiple AD‐specific CNVs | Neuron Development | 5.06E‐08 | 5.30E‐04 | 3.17 |
| Neuron Recognition | 7.36E‐08 | 7.70E‐04 | 19.09 | |
| Neuron Differentiation | 8.38E‐08 | 8.70E‐04 | 2.87 | |
| Cell Projection Organization | 1.98E‐07 | 2.10E‐03 | 2.64 | |
| Neurogenesis | 3.85E‐07 | 4.00E‐03 | 2.57 | |
| Axon | 5.18E‐07 | 5.40E‐03 | 3.85 | |
| Neuron Projection | 1.75E‐06 | 1.80E‐02 | 2.66 | |
| Regulation Of Neuron Projection Development | 1.77E‐06 | 1.80E‐02 | 4.40 | |
| Cell Part Morphogenesis | 2.05E‐06 | 2.10E‐02 | 3.51 | |
| Cell Morphogenesis | 4.76E‐06 | 5.00E‐02 | 2.87 | |
| MCI‐CNV genes | Ligase Activity Forming Carbon Sulfur Bonds | 1.31E‐06 | 4.10E‐02 | 12.40 |
| NL‐CNV genes | Immunoglobulin Complex | 4.14E‐15 | 1.30E‐10 | 8.45 |
Fisher's exact test (FET) P value.
The details of enriched genes can be found in Table S14.
Abbreviations: AD. Alzheimer's disease; CNV, copy number variation; GO, Gene Ontology; MCI, mild cognitive impairment.
2.3. Replication of previously identified AD‐associated CNVs
Two AD‐specific CNVs were reported in previous studies 33 (Table S15 in supporting information), and 29 AD‐specific CNVs were found to be within the duplication region encompassing the APP gene (chr21:14,714,507‐29,216,662:nsv1398044) 17 , 18 , 34 (Figure 4F, Table S16 in supporting information).
Previous studies 2 , 29 , 33 , 35 , 36 , 37 , 38 , 39 , 40 , 41 , 42 , 43 have identified 31 CNVs possibly associated with AD (Table S15). Among these 31 CNVs, 20 are from AD cases and 2 shared by AD and MCI cases, while the rest showed differences in frequency between the AD and NL groups based on GWAS studies (Table S15). Two of the 20 known AD‐specific CNVs significantly overlap our AD‐specific CNVs, under an RO threshold ≥ 50% (Table S15). For the two overlapping AD‐specific CNVs, EVC2/EVC/CRMP1‐DUP is replicated in our study (DUP14974.ROSMAP), but KANK1/DMRT1‐DEL, a previously identified deletion, is duplicated in our study (DUP28866.ROSMAP). A previously identified AD‐specific CNV, HAS1/FPR1/FPR2/FPR3‐DUP was detected not only in the AD cases but also in the MCI and NL cases in our study. DOPEY2‐DUP, one of the two previously identified CNVs shared by AD and MCI, was also observed in AD, MCI, and NL cases in our current study. Moreover, HAS1/FPR1/FPR2/FPR3‐DUP and DOPEY2‐DUP were observed in healthy controls curated in the DGV database, 30 suggesting that they are not AD/MCI‐specific (Table S15). In summary, several AD‐associated CNVs were replicated in our study.
Duplication of APP has been identified as a causal factor for early‐onset familial Alzheimer's disease (FAD). 17 , 18 We found 29 AD‐specific CNVs within the APP duplication region (chr21:14,714,507‐29,216,662: nsv1398044; Figure 4F and Table S16). Among the 29 AD‐specific CNVs within this APP duplication region (Figure 4F), one is conserved in two cohorts (chr21:25,258,373‐25,263,454, DEL18858.MSBB/DEL47421.ROSMAP; Figure 4E; Table S13).
2.4. Distinct impact of CNVs on gene transcription in AD and MCI compared to NL
To further interrogate the effect of CNVs on transcription in AD brains, we performed Kendall's b correlation analysis 44 of all CNVs and the transcriptomic data of the AD group from five different brain regions in the MSBB and ROSMAP cohorts (MSBB: the frontal pole [BM‐10], the superior temporal gyrus [BM‐22), the parahippocampal gyrus [BM‐36], and the inferior frontal gyrus [BM‐44]; ROSMAP: the DLPFC; Methods 3.6; the demographic information of samples can be found in Table S2). At a false discovery rate (FDR) of 5%, CNVs were significantly correlated with 95, 80, 66, and 79 genes in the BM‐10 , BM‐36 , and BM‐44 regions, respectively (Table 3 and Table S17 in supporting information). In the ROSMAP cohort, 104 genes in the DLPFC were significantly correlated with 136 CNVs (Table 3 and Table S17). Above gene‐correlated CNVs are common CNVs with population frequency higher than 3%.
TABLE 3.
Summary of the CNV‐gene pairs with significant correlation in AD cases in five different brain regions
| Brain region | Sample size of the AD group a | Significantly correlated CNV‐gene expression pairs b | CNVs | Genes | lncRNA c |
|---|---|---|---|---|---|
| BM‐10 (MSBB) | 151 | 190 | 157 | 95 | 18 |
| BM‐22 (MSBB) | 141 | 148 | 124 | 80 | 14 |
| BM‐36 (MSBB) | 119 | 125 | 100 | 66 | 10 |
| BM‐44 (MSBB) | 126 | 141 | 114 | 79 | 14 |
| DLPFC (ROSMAP) | 301 | 293 | 136 | 104 | 19 |
This column shows the number of AD cases with matched whole genome sequencing data and transcriptomic data in each cohort.
The significant threshold is 0.05 after FDR correction of all CNV‐gene expression correlation tests for each brain region.
lncRNA information comes from the Lncipedia database (version 5.2). 57
Abbreviations: AD. Alzheimer's disease; CNV, copy number variation; DLPFC, dorsolateral prefrontal cortex; MSBB, JJ Peters VA Medical Center Brain Bank; ROSMAP, Religious Orders Study/Memory and Aging Project.
The five CNV‐correlated gene sets significantly overlap based on the Super Exact Test 45 (Figure S4 in supporting information). This suggests that the effect of the AD‐related CNVs on gene expression is not sporadic, that is, these CNVs tend to affect a specific set of genes in different brain regions of AD patients. Notably, in the MSBB cohort, there were 95 CNV‐gene pairs with significant correlations across the four brain regions, where the respective correlation coefficients are very consistent (Table S18 in supporting information). These four region‐consistent CNV‐gene significant pairs take up about 45.02% of all CNV‐gene pairs in the MSBB cohort. This evidence suggests that most CNVs have consistent regulatory effects on gene expression across different brain regions.
For the AD cases, the gene sets significantly correlated with the identified CNVs in all five brain regions are enriched for the immune response associated MHC class II receptor activity based on Fisher's exact test 46 using the Molecular Signatures Database (MSigDB) v7.4 47 , 48 (Figure 5A, Table S19 in supporting information and Methods 3.6). The CNV‐correlated genes in the BM‐10, BM‐36, and BM‐44 regions are also enriched for response to interferon‐gamma. Moreover, the enrichment signal of the DLPFC region contains glutathione transferase activity, and the enrichment signal of the BM‐10 region contains homophilic cell adhesion via plasma membrane adhesion molecules (Figure 5A, Table S19, and Methods 3.6). As the MCI group in ROSMAP has a sufficiently large number of samples, we performed the same CNV‐gene correlation analysis and found that the genes correlated with the CNVs in the MCI samples fall into the same MHC class II receptor activity pathway as those in the AD group. However, the genes correlated with the CNVs in the NL samples in ROSMAP are associated with regulation of transporter activity (Figure 5B, Table 4). Increased immune response in AD has been reported in many studies, 28 , 49 , 50 , 51 , 52 , 53 and gene expression of several HLA genes was found to be associated with AD risk variants. 54 , 55 These results not only confirm the previous findings about the involvement of immune response in AD but also pinpoint novel CNVs as potential upstream regulators. 56
FIGURE 5.
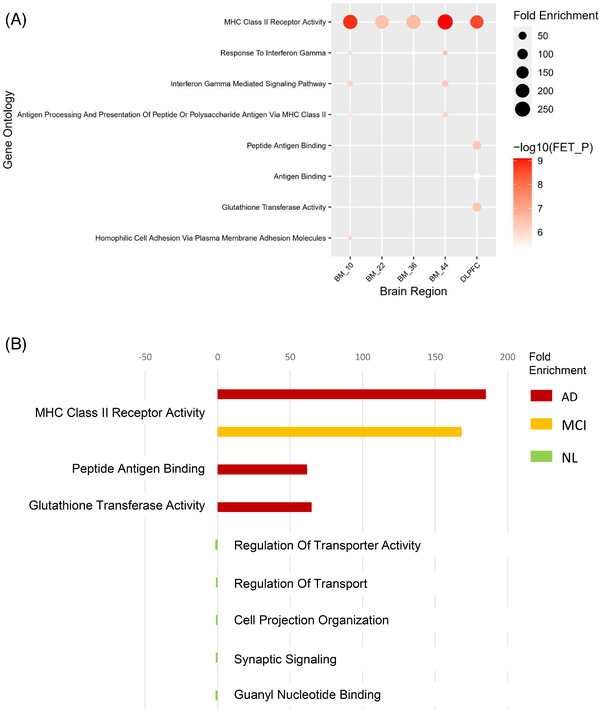
Functional analysis of copy number variation (CNV)‐correlated genes. (A) Pathways enriched in the CNV‐correlated genes in five different brain regions of AD cases. (B) Pathways enriched in the CNV‐correlated genes in the Alzheimer's disease (AD), mild cognitive impairment (MCI), and normal (NL) groups in the Religious Orders Study/Memory and Aging Project
TABLE 4.
Pathways enriched in the CNV‐correlated genes in the AD, MCI, and NL groups in ROSMAP
| Group | Brain region | GO Term | FET_P a | Padj | Fold enrichment |
|---|---|---|---|---|---|
| AD | DLPFC | MHC Class II Receptor Activity | 2.71E‐09 | 7.50E‐05 | 185.06 |
| AD | DLPFC | Glutathione Transferase Activity | 3.64E‐07 | 1.00E‐02 | 64.77 |
| AD | DLPFC | Peptide Antigen Binding | 4.49E‐07 | 1.20E‐02 | 61.69 |
| MCI | DLPFC | MHC Class II Receptor Activity | 5.24E‐07 | 1.40E‐02 | 168.23 |
| NL | DLPFC | Regulation Of Transporter Activity | 4.38E‐07 | 1.20E‐02 | 1.62 |
| NL | DLPFC | Regulation Of Transport | 5.36E‐07 | 1.50E‐02 | 1.23 |
| NL | DLPFC | Cell Projection Organization | 5.69E‐07 | 1.60E‐02 | 1.23 |
| NL | DLPFC | Synaptic Signaling | 1.23E‐06 | 3.40E‐02 | 1.35 |
| NL | DLPFC | Guanyl Nucleotide Binding | 1.76E‐06 | 4.90E‐02 | 1.49 |
Fisher's exact test (FET) P‐value.
Abbreviations: AD. Alzheimer's disease; CNV, copy number variation; DLPFC, dorsolateral prefrontal cortex; GO, Gene Ontology; MCI, mild cognitive impairment; MHC, major histocompatibility complex; MSBB, JJ Peters VA Medical Center Brain Bank; NL, normal; ROSMAP, Religious Orders Study/Memory and Aging Project.
Among the CNV‐correlated genes, at least 15.15% are long non‐coding RNAs (lncRNAs), based on the Lncipedia database (version 5.2) 57 (Table 3).
Among these CNV‐correlated genes, 23 genes were differentially expressed between different diagnostic groups in specific brain regions (Tables S20‐S21 and Figure S5A in supporting information, and Methods 3.7). Furthermore, 44 CNV‐correlated genes are significantly correlated with various AD pathological traits (i.e., CDR score, Plaque Mean, Consortium to Establish a Registry for Alzheimer's Disease [CERAD] score, Braak stage score, physician's overall cognitive diagnostic category at time of death [cogdx], and clinical diagnosis of cognitive status at last valid level [dcfdx_lv]) after genome‐wide FDR correction (Table S22 and Figure S5B in supporting information). The CNV‐correlated HLA genes such as HLA‐DRB5, HLA‐DQB1, and HLA‐DQB2 are not only differentially expressed between AD and NL but also correlated with AD‐related traits. The union of the two gene sets (i.e., the genes differentially expressed between different diagnostic groups and the genes significantly correlated with varying traits of AD) is defined as AD‐related genes (Figure S6 in supporting information). These CNV‐correlated genes in AD are associated with MHC class II receptor activity and antigen processing and presentation (Table S23 in supporting information). These findings reveal CNVs as potential genetic regulators of AD‐related genes.
Three known AD‐risk genes (HLA‐DRB1, HLA‐DRB5, and KANSL1) identified from AD GWAS 6 , 8 , 58 and a microglial phagocytic modulator gene SIRPB1. 59 are significantly correlated with some CNVs in the AD cases (Table S24 in supporting information). Especially, the correlation between HLA‐DRB5 expression and two CNVs (i.e., DEL6593 and mCNV6614) are very consistent across all five brain regions (Figure 6A‐6K and Table S25 in supporting information). HLA‐DRB5 encodes one of the MHC class II beta chain proteins. Its encoding protein presents extracellular peptides in antigen‐presenting cells and plays an important role in the immune system. 60 HLA‐DRB5 is upregulated in the severe AD group (Plaque Mean > 12) in the BM‐36 region compared to normal controls in MSBB (Plaque Mean = 0; Fold change = 1.50, Padj = 0.031; Figure 6L). Furthermore, its expression level is positively correlated with neuritic plaque level defined by CERAD score after genome‐wide FDR correction (correlation coefficient = 0.19, Padj = 0.032) (Figure 6M). CERAD score is a semi‐quantitative measure of neuritic plaques in AD brains. 61 The correlations among CNVs (i.e., DEL6593 and mCNV6614), HLA‐DRB5, and AD traits (i.e., Plaque Mean and CERAD score), illustrate how common CNVs affect AD pathological traits by regulating the expression of AD‐related genes, mainly immune response–related genes.
FIGURE 6.
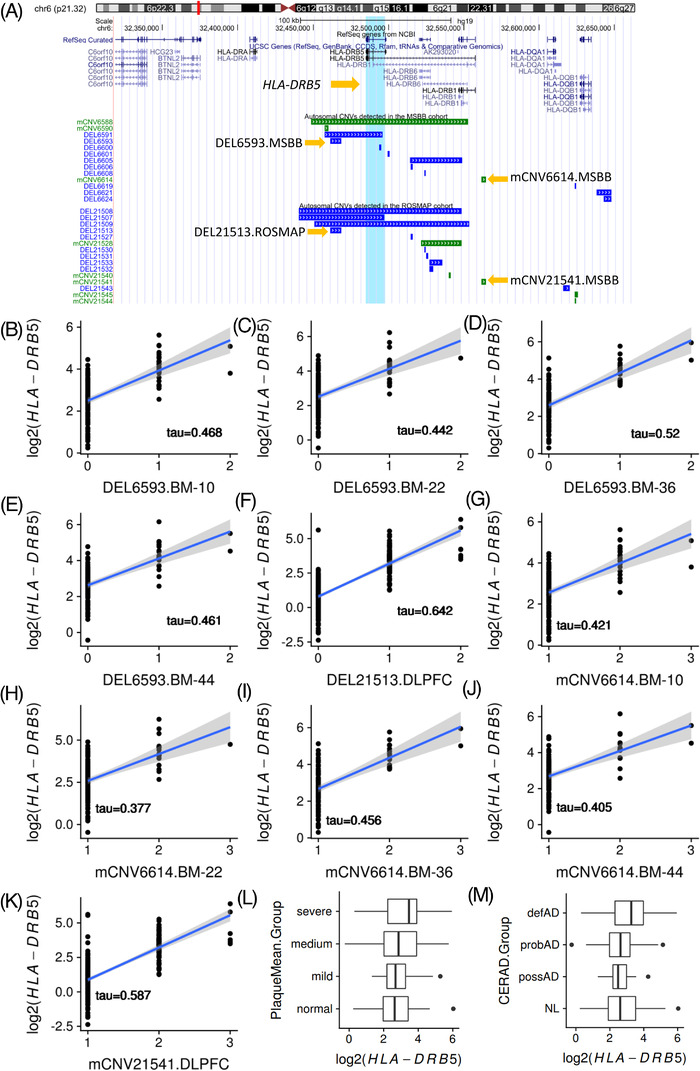
Correlation analysis of two copy number variations (CNVs; i.e., DEL6593 and mCNV6614), HLA‐DRB5 gene expression, and Alzheimer's disease (AD) traits. (A) Illustration of the genomic location of the two CNVs, that is, DEL6593 and mCNV6614 in JJ Peters VA Medical Center Brain Bank (MSBB). The counterpart of DEL6593 is DEL21513 in Religious Orders Study/Memory and Aging Project (ROSMAP). The counterpart of mCNV6614 is mCNV21541 in ROSMAP. The light blue shade represents the location of the HLA‐DRB5 gene. (B‐F) Correlation between copy number dosage of the sequence in the DEL6593 locus and the expression level of HLA‐DRB5 in different brain regions. (G‐K) Correlation between copy number dosage of the sequence in the mCNV6614 locus and the expression level of HLA‐DRB5 in different brain regions. x = 0 means the individuals carry homologous deletions in this locus, while x = 1 means the individuals carry heterozygous deletion. x = 2 means the individuals have two copies of the sequence, suggesting no deletion. x = 3 means the individuals carry three copies of the sequence, which is heterozygous duplication. (L) Differential expression of HLA‐DRB5 based on the Plaque Mean group in the BM‐36 region. (M) The expression of HLA‐DRB5 is positively correlated with the Consortium to Establish a Registry for Alzheimer's Disease score in the BM‐36 region
2.5. CNV‐gene‐trait correlation network in AD cases
To explore how CNVs affect clinical and pathological traits of the AD cases at different omics levels, we constructed CNV‐gene‐trait correlation networks by integrating CNVs, gene expression, and clinical and pathological traits in MSBB (Figure 7A) and ROSMAP (Figure 7B) (Methods 3.8 and Table S26‐S27 in supporting information). Functional analysis of CNV‐centered subnetworks reveals that one novel CNV (DEL6619.MSBB) is responsible for immune response–related pathways (Table S28 in supporting information). Moreover, this finding was further replicated in ROSMAP (i.e., mCNV21544.ROSMAP; Figure 7B and Tables S28‐S29 in supporting information). The other nine CNV‐centered subnetworks in the DLPFC region in ROSMAP are also enriched for immune response and glutathione transferase activity (Table S28).
FIGURE 7.
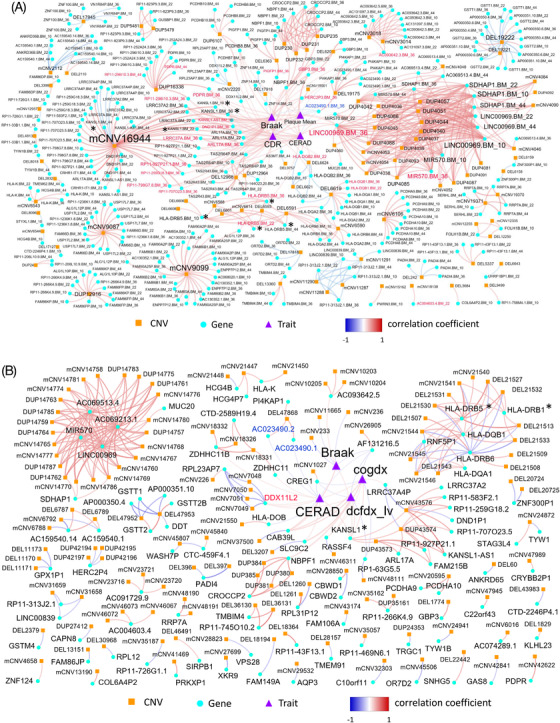
Integrative network analysis of matched copy number variation (CNV), gene expression, and trait data in the JJ Peters VA Medical Center Brain Bank (MSBB) and the Religious Orders Study/Memory and Aging Project (ROSMAP). A network comprised of CNV‐gene, CNV‐trait, and gene‐trait pairs with significant correlations is constructed from each cohort and is termed as a CNV‐gene‐trait correlation network. All CNVs discovered in the two cohorts are considered while constructing the network, including Alzheimer's disease (AD)‐specific CNVs and non‐AD‐specific CNVs. (A) CNV‐gene‐trait correlation network from MSBB. B, CNV‐gene‐trait correlation network from ROSMAP. In both network plots, the orange square, light‐blue circle, and purple triage shape of a node represent CNV, gene, and trait, respectively. The intensity of edge color is proportional to correlation coefficient, while red and blue colors represent positive and negative correlations, respectively. Blue and red labels represent down‐ and upregulated genes, respectively. Known AD genome‐wide association study genes are marked with a star symbol. The detailed correlation matrix is shown in Tables S26‐S27.
In the DLPFC region, three CNVs (mCNV233, mCNV236, and mCNV11665) are significantly correlated with the Braak score (Figure 7B, and Table S30 in supporting information). As the Braak score reflects the severity and distribution of neurofibrillary tangles, these CNVs may contribute to neurofibrillary tangle aggregation, though the predicted regulatory relationships need further experimental validation. Interestingly, the integrative analysis further identified several lncRNAs that are correlated with AD traits. For example, KANSL1‐AS1 is correlated with the Braak score in the BM‐36 region (Figure 7A). AC023490.1 is correlated with the CERAD score in both BM‐36 and DLPFC regions (Figure 7B). These results indicate the potential role of lncRNAs in the pathogenesis of LOAD. Most of these target genes in the CNV‐gene‐trait correlation networks are novel.
The CNV‐gene‐trait correlation network analysis suggests CNVs as upstream genetic regulators of RNA expression underlying clinical and pathological traits of AD patients, especially through immune response.
3. DISCUSSION
To systematically identify CNVs in LOAD and study their functional impact, we integrated the matched WGS, RNA‐seq, clinical, and pathological data in two large multi‐omics studies of LOAD (MSBB and ROSMAP). We identified CNVs across the entire genome from the WGS data of 1,411 subjects. Of the 13,327 CNVs identified, 3,012 occur only in the 701 LOAD cases but not in any of the 710 non‐AD cases and thus they are specific to AD. The genes residing on these rare AD‐specific CNVs are enriched in a broad range of biological processes, including cellular glucuronidation, neuron projection, uronic acid metabolic process, extrinsic component of plasma membrane, synapse, catenin complex, and multicellular organismal signaling. Meanwhile, the MCI‐specific CNVs were also identified, and their corresponding genes were enriched for ligase activity forming carbon‐sulfur bond genes. A host of common CNVs were also identified and their corresponding genes are involved in activating the immune response in multiple brain regions. To understand the functional impact of these CNVs in AD, CNV‐gene‐trait correlation networks were constructed by integrating CNVs with matched gene expression, and clinical and pathological data. Gene expression associated with one key CNV conserved in MSBB and ROSMAP (DEL6619.MSBB/mCNV21544.ROSMAP) are enriched for immune response. These findings highlight novel genetic factors that potentially regulate immune‐related pathways in LOAD. To our knowledge, this is the first genome‐wide CNV study focused on LOAD using large‐scale matched multi‐omics data. We have provided these LOAD‐related CNV tracks through the UCSC genome browser (http://genome.ucsc.edu/s/c6ming2/AMPAD.CNVs).
Of the 3,012 AD‐specific CNVs, two (EVC2/EVC/CRMP1‐DUP and KANK1/DMRT1‐DEL) were reported in the previous studies 33 and 64 are conserved across MSBB and ROSMAP. Most previously reported AD‐specific CNVs 2 , 29 , 33 , 35 , 36 , 37 , 38 , 39 , 40 , 41 , 42 , 43 are much longer than our AD‐specific CNVs. The difference in length may be explained by differences in the CNV detection techniques. Compared to the methods based on a‐CGH and microarray, WGS‐based CNV detection methods have a much higher resolution, offering an opportunity to detect smaller, rare CNVs.
Previous studies showed that there was no difference in individual CNV burden between AD and NL subjects. 38 This is supported by our data showing no significant difference in total CNV count or CNV length per individual between AD and NL. However, in our study, we separated the AD‐specific CNVs from the common CNVs that were shared by different clinical diagnostic groups. Given the higher resolution provided by the WGS data, we observed the mean number of the AD‐specific CNVs per AD case was higher than that of the MCI‐specific CNVs per MCI case and that of the NL‐specific CNVs per NL case. We further observed that AD‐specific CNVs were enriched in regulatory regions of genes that are in turn associated with important biological functions, such as cellular glucuronidation, neuron projection, and multicellular organismal signaling. Genes overlapping with multiple AD‐specific CNVs are enriched in specific neuron‐related pathways, for example, neuron development, neuron recognition, and neuron differentiation. These findings implicate the functional importance of AD‐specific CNVs in LOAD. We hypothesize that both rare AD‐specific CNVs and common CNVs play important roles in modulating critical biological processes underlying AD pathogenesis and progression. Just as with common single nucleotide variations associated with diseases like AD, our data support that while the pathological effect of any single CNV may be small, the accumulation of many CNVs with modest effect sizes may lead to the profound disease pathology. For CNVs associated with AD, this hypothesis is further supported by our observation that there is an excess of AD‐specific CNVs around the APP gene. Further experiments are needed to validate this hypothesis.
Of the 64 AD‐specific CNVs conserved across MSBB and ROSMAP, an interesting CNV is the AD‐specific deletion (chr7:43,379,821‐43,384,071: DEL7695.MSBB: DEL24401.ROSMAP) around the gene HECW1. This CNV is in the intron and CTCF motif regions of HECW1. HECW1 has important functions in the central nervous system, including SMAD signaling and ubiquitin‐proteasome‐dependent proteolysis. HECW1 was predicted to be involved in several biological processes, such as neuron cell–cell adhesion, vocalization behavior, and short‐term neuronal synaptic plasticity regulation, based on the ARCHS database. 62 A previous GWAS 63 showed that HECW1 was associated with the rate of cognitive decline in AD. Further experiments are needed to validate the regulatory effect of this AD‐specific deletion on HECW1 in LOAD.
Although our CNV analyses have led to a number of novel genetic and functional genomic findings, this study has several limitations. First, our results indicate a difference in the ratio of cohort‐specific CNVs. The ratio of ROSMAP‐unique CNVs is higher than the ratio of MSBB‐unique (62.38% vs. 48.43%). Despite the larger number of samples in ROSMAP (1127 samples in ROSMAP vs. 284 in MSBB), the cohort‐specific CNV proportions in MSBB and ROSMAP are relatively close. Differences in the proportions could result from different sample sizes as larger sample size increases the sampling power to identify rare CNVs. Second, it is underpowered to detect the association between rare AD‐specific CNVs and gene expression. Much bigger sample size and more powerful statistical tools are needed to predict the regulatory targets of rare AD‐specific CNVs.
Our study also raises some interesting questions for future research. One important consideration is whether somatic CNV mutation rates differ across brain regions or in response to disease states. We cannot distinguish somatic CNV mutations from germline mutations based on brain tissues only. Thus, to address this question, pairing blood and brain samples in future studies is desirable. Another interesting question is the pathological effect of lncRNAs co‐regulated with other transcriptomic traits in the CNV‐gene‐trait correlation networks of LOAD. Many lncRNAs were correlated with clinical and pathological traits, but we know little about the regulatory pathways involving these lncRNAs. Furthermore, it would be very interesting to investigate how CNVs interact or regulate other types of omics. Our study shows that CNVs can affect clinical and pathological traits by regulating mRNA expression. However, CNVs may impact other omics levels such as splicing regulation, proteomic regulation, and epigenomic modification. The regulatory mechanisms of CNVs need further experimental investigation. Finally, it would be interesting to perform CNV‐based GWAS to pinpoint candidate risk factors for AD.
In summary, we carried out a comprehensive genomic CNV study of LOAD by integrating WGS data with clinical, pathologic, and transcriptomic data. We provided the first LOAD‐related CNV tracks through the UCSC genome browser. The findings not only support the known roles of immune response in AD pathogenesis but also offer novel insights into the genetics of the increased level of immune response in AD. The AD‐specific CNVs offer a new perspective on the mechanism of LOAD. The identified CNVs and their downstream gene networks provide a blueprint for studying the genetic mechanisms of LOAD toward personalized medicine.
4. METHODS
4.1. Data
The whole‐genome sequencing data in the MSBB cohort 22 are available at the AMP‐AD knowledge portal (synapse ID: syn10901600). The WGS data in MSBB were generated from 353 individuals, of which 341 had clinical and pathological data (i.e., age of death, CDR, Plaque Mean, CERAD score, and Braak stage score [bbscore]). We used the 284 North American White samples. We classified these subjects with CDR scores larger than 0.5 as AD, those with CDR equal to 0.5 as MCI, and those with CDR equal to zero as healthy controls (NL). Under this classification scheme, there are 224 AD cases, 27 MCI cases, and 33 NL cases. The mean sequencing depth of all samples is 36.58X. There is no significant difference in sequencing depth among the three groups. 22
There are 1200 individuals with WGS data in the ROSMAP 23 cohort (synapse ID: syn10901595). We excluded outliers that contained more than 6000 deletions or 1000 duplications in the individual scanning stage and other dementia cases. The filtering process identified 71 outliers. We further excluded non‐White samples and used 1127 White samples in the analysis. We classified the subjects into three diagnostic groups based on their final Clinical Consensus Diagnosis (AD: 4 or 5; MCI: 2 or 3; NL: 1). Under this definition, there are 477 AD, 285 MCI, and 365 NL subjects.
4.2. Transcriptomic data
The RNA‐seq–based transcriptomic data in MSBB are also available at the AMP‐AD portal (synapse ID: syn3157743). The samples were extracted from the BM‐10, BM‐22, BM‐36, and BM‐44 regions. Information about the MSBB samples and sequencing data can be found in a previous publication. 22 RNA‐seq data normalization and covariate correction were detailed in Wang et al. 64 RNA‐seq data in MSBB were adjusted for covariates, including post mortem interval (PMI), RNA integrity number (RIN), race, age of death (AOD), batch effect, and sex.
The RNA‐seq transcriptomic data in the DLPFC region of the ROSMAP cohort was downloaded from the AMP‐AD portal (synapse ID: syn3388564). We performed the read alignment, gene expression quantification, normalization, and covariate correction using the same pipeline as the MSBB data. 22 , 64 Briefly, the reads were mapped to human genome hg19 using the STAR aligner (v2.3.0e), and then gene‐level expression was quantified by featureCounts (v1.6.3) based on Ensembl gene model GRCh37.70. Next, gene‐level count data was normalized using R/limma's voom function and subsequently corrected for known covariates, including sequencing batch, PMI, AOD, sex, and RIN by a mixed model. 65
4.3. Clinical and pathological trait data
The clinical and pathological trait data in MSBB, which is available at the AMP‐AD portal (synapse ID: syn6101474) includes the information about PMI, race, age of death, sex, apolipoprotein E (APOE) genotype, CERAD score, mean neocortical plaque density, Braak score, and CDR for the 341 WGS samples.
The clinical trait data in ROSMAP, which are available at the AMP‐AD portal (Synapse ID:syn3157322) contain the information about sex, education, race, Spanish origin, APOE genotype, age at last visit, age at death, Mini‐Mental State Examination (MMSE) score at first diagnosis of AD, MMSE score at last visit, clinical diagnosis of cognitive status at last valid level (dcfdx_lv), PMI, Braak score, CERAD score, and final clinical consensus diagnosis at time of death (cogdx). More information regarding ROSMAP can be found at www.radc.rush.edu.
We only used the trait data of the North American white samples from MSBB and ROSMAP in this study. In the correlation analysis, the CERAD score of the two cohorts was re‐coded as 1 for No AD, 2 for Possible AD, 3 for Probable AD, and 4 for Definite AD. The cogdx value and the dcfdx_lv value of ROSMAP were re‐coded as 1 for NL, 2 for MCI (previous 2 and 3), 3 for AD (previous 4 and 5). The samples with cogdx value of 6 (i.e., other dementia) were excluded in cogdx‐related correlation analysis. Likewise, the samples with dcfdx_lv as 6 were also excluded in dcfdx_lv‐related correlation analysis.
4.4. Building a population‐level CNV set
To build a comprehensive population‐level CNV set with high accuracy and high sensitivity, as previous studies suggested, 26 , 31 , 66 , 67 we took advantage of results from multiple complementary CNV calling methods, including CNVnator, 24 Pindel, 25 Delly2, 27 and MetaSV 26 (Figure S1). CNVnator 24 is based on RD analysis 68 , 69 , 70 , 71 , 72 and uses the mean‐shift approach to detect abnormal read depth regions resulting from deletion or duplication events. 24 CNVnator has a very high sensitivity in calling CNVs larger than 1 kb. Pindel 25 uses a pattern‐growing approach to locate breakpoints by re‐aligning the unmapped end of split reads (SR). With an outstanding resolution of breakpoints in the single nucleotide level, Pindel has been used in several large human population sequencing projects (i.e., the 1000 Genomes Project, 31 the Genome of the Netherlands project, 73 and the Cancer Genome Atlas 74 ). MetaSV, 26 an integrated structure variation caller, merges calling results of the same individual from different strategic methods and then re‐assembled alignment around breakpoints, leading to highly efficient integration with a high precision of breakpoints. Delly2 is an updated version of Delly, 27 which combines pair‐end mapping (PEM) and SR approaches.
We first performed individual‐level CNV calling on each sample using CNVnator and Pindel (Method 3.4.1, Figure S1). Then MetaSV is used to integrate results from CNVnator and Pindel of each sample (Method 3.4.1, Figure S1). Delly2 is later used to generate the second individual‐level CNV set (Method 3.4.2). These two lists were further merged into an integrated individual‐level CNV set (Method 3.4.3, Figure S1). The CNV files of all samples were further integrated to build the population‐level CNV location list. CNVnator was further used to re‐genotype the copy number dosage of each locus in each sample. Merging details can be found in the following subsections.
4.4.1. Create the first individual‐level CNV set by integrating CNVnator, Pindel, and MetaSV
CNVnator
CNVnator analysis was performed according to the standard procedure and parameters suggested on its official GitHub page (https://github.com/abyzovlab/CNVnator). For each sample, read mapping information was extracted from the bam alignment file, which was used to generate a RD histogram for computing the statistics of RD distribution at an optimal bin size of 100‐bp suitable for 20–30x coverage. RD signal was corrected for GC content bias. A mean‐shift technique was used to partition the RD signaling. Subsequently, CNV was called by a one‐sample t‐test comparing the mean of the RD signal within each partitioned segment to the genomic average.
Pindel
We used Pindel 25 (version 0.2.5b9) with an insert size of 450 bp for both MSBB and ROSMAP. To speed up the computation process, Pindel was performed on each chromosome of each sample independently. The reference genome was downloaded from the 1000 Genome Project 75 FTP (human_g1k_v37.fasta). Genomic gap regions were excluded for further inference. The bed file of gap location was downloaded from the UCSC genome browser 75 (http://genome.ucsc.edu/). Six threads were assigned to each job (‐T 6). Sensitivity was set to 0.9 (‐E 0.9). Germline filtering was turned on (‐N true).
Scanning results in the default Pindel format were further converted into variant call format (VCF) files by using pindel2vcf. Chromosome output files of the same individual were further concatenated by vcf‐concat. 76
MetaSV
Integration. MetaSV 26 was used to integrate individual calling results from CNVnator and Pindel. Gap regions 75 were excluded from the integration procedure. Only standard contigs (autosomes, chromosome X, and chromosome Y) were considered here. CNVs smaller than 500 bp or larger than 500Mb were excluded. Deletions and duplications were integrated separately.
Filtering. The results that met one of the following two criteria were kept in the subsequent analyses: (1) Consensus calling results with “PASS” label, which were supported by both CNVnator and Pindel, or (2) CNVnator‐specific CNVs with length greater than 1 kb, e‐val2 ≤ 0.05, and q0 ≤ 0.05, where e‐val2 was calculated from a Gaussian distribution to evaluate read‐depth significance 24 and q0 is the fraction of reads with very poor mapping quality ( = 0). 24
This procedure led to the first set of individual‐level CNVs.
4.4.2. Generate the second set of individual‐level CNVs using Delly2
CNV calling. Individual‐level CNV calling was made first, with the minimum paired‐end mapping quality as 20 (‐q 20) and insert size cutoff as 15 (‐s 15, duplications only). Then the individual calling outputs were further merged to generate a population CNV location set. 27 The maximum breakpoint offset was set as 500 (‐b 500). The minimum RO was set as 0.5 (‐r 0.5). Other parameters were set as default. The population location set was used to further re‐genotype CNVs for each sample. The re‐genotyping results were merged using bcftools and filtered by the germline filter function in Delly2. Deletions and duplications were generated separately.
Filtering. To further guarantee the accuracy of CNV calling, the VCF file of deletion call set and the VCF file of duplication call set were further filtered by the consistency between estimated genotype and read depth. As the author of Delly2 suggested, 27 estimation based on read‐depth is more reliable than genotyping results based on PE/SR for large CNVs with length greater than 1 kb. Thus, the genotypes of large inconsistent loci were manually corrected based on read‐depth estimation. For smaller fragments, low‐quality genotypes, shown as “LowQual” in the “Per‐sample genotype filter” field generated by Delly2, were manually corrected by considering different read depths.
This procedure generated the second set of individual‐level CNVs.
4.4.3. Generation of a final set of individual‐level CNVs by integrating the first and second CNV sets
All the non‐overlapping CNVs were included the final CNV set. Two overlapping CNVs with RO less than 50% were treated as two independent regions, while a CNV pair with RO greater than 50% were merged into one CNV region. CNVs with conflicted types at the same genomic region for the same individual were excluded. The boundary of a merged CNV pair from above two individual‐level CNV sets for the same sample was decided based on the more precise record. If one of the merged CNVs had a break point estimation from Delly2, we used the estimated break point from Delly2. If neither of the merged CNVs had any estimation from Delly2, we used the break point from MetaSV. Genotype information from both the first and second CNV sets was kept for the same individual during merging.
4.4.4. Generation of the population‐level CNVs
Individual‐level CNVs of all the samples in each cohort were further merged into a set of population‐level CNVs. If two CNVs from different individuals had an RO in in their genomic locations larger than 50%, they were merged into one CNV region. The boundary of a merged CNV from two overlapping CNVs with different boundaries was determined as follows: (1) the boundary supported by more samples was used if the two overlapping CNVs were detected in different numbers of supporting samples; (2) the boundary supported by SR was used if the two overlapping CNVs were detected in the same number of samples by different approaches (the SR approach has higher breakpoint precision than the RD approach); (3) the union of the two overlapping CNVs’ boundaries was used if they were called in the same number of samples by the same number of methods. This procedure led to a set of population‐level CNVs. Each CNV record includes information about the boundary, the number of supporting methods, and the genotype of each sample.
4.4.5. Re‐genotyping copy number dosage for each individual based on the final population CNV set
During the aforementioned merging procedures, the predicted CNV boundaries may shift for some individuals. To maintain accuracy and robustness, we performed in silico genotyping of the copy number dosage of each CNV in each sample by applying the genotype function in CNVnator to the population‐level CNVs. Moreover, to ensure the high quality of CNV calling, we only kept the consensus CNVs detected by three or more CNV calling methods for the downstream analyses.
By leveraging information from different CNV calling methods, we generated a very comprehensive and consensus population CNVs containing both rare CNVs and high‐frequency regions.
4.5. The Quasi‐Poisson regression model
We used the QPRM to compare three separate metrics across the three clinical diagnostic groups: (1) the total number of CNVs (CNV count) per sample, (2) the total length of all CNVs (CNV length) per sample, (3) the number of group‐specific CNVs per sample. Considering the extreme skewness of the CNV count distribution, we used the following QPRM to compare the properties of the CNV sets in different diagnostic groups of interest:
The R77 function glm (family = ”quasipoisson”) was used to perform all regression analyses. The logistic regression coefficient, 95% confidence interval (CI), and significance level (P‐value) were calculated using the glm function. P‐values were further adjusted by the FDR correction procedure. 78 The odds ratio (OR) was calculated by taking the exponential of the logistic regression coefficient. The response variable is “the total CNV count” or “the total CNV length” or “the group‐specific CNV count” per individual. When comparing the total CNV count or the total length per individual, all genome‐wide CNVs were considered, and the NL group is treated as the base category. Comparing the group‐specific CNV count per individual, only group‐specific CNVs were considered. The AD‐specific CNVs were compared with the NL‐specific and the MCI‐specific CNVs separately. The diagnostic group is the main predictor variable. Sex and age of death are co‐variants. The categorical variable “Diagnostic Group” has three levels, including AD, MCI, and NL. In the QPRM, the diagnostic group and sex variables are treated as factor. The age of death is a numeric variable. The QPRM considers dispersion parameter in the estimation process.
4.6. Kendall's tau‐b correlation analysis, Spearman's correlation analysis, FDR correction, and GO enrichment analysis
Kendall's tau‐b correlation analysis 44 was used to calculate the correlation coefficient between copy number dosage and different omics data (i.e., transcriptional data and clinical traits). It has the advantage of adjustment for highly tied ranking pairs, which is suitable for CNVs. This was implemented by using the “Kendall” R package. 77 , 79 Spearman's correlation analysis was used to calculate the correlation coefficient of the continuous type of omics data using the “stats” R package. All genome‐wide P‐values were adjusted by the FDR correction procedure. 78 The pairs with adjusted P‐values less than 0.05 were used for further analysis.
GO term enrichment analysis was based on Fisher's exact test. 46 Given a background of X genes, a GO term of Y genes, a target list of M genes which includes N genes in the GO term, the P‐value of Fisher's exact test is calculated as:
The fold enrichment (FE) is calculated as:
MSigDB v7.4 47 , 48 is an annotated gene set reference. The background is set as the RNA‐seq gene list.
4.7. Differential expression analysis
Differential gene expression analysis was performed to identify genes up‐ or downregulated with respect to four LOAD‐related neuropathologic and cognitive traits in each brain region. We grouped the samples in each brain region into multiple disease severity stages for each neuropathologic/cognitive trait, and compared the gene expression between every two groups using limma's moderated t‐test analysis. 80 Specifically, for CDR, the samples were classified into cognitively normal (non‐demented; CDR = 0), MCI (CDR = 0.5), and demented (CDR ≥ 1). For Braak score, the samples were classified into NL when Braak score ≤ 2 and AD when Braak score > 2. For plaque mean density (PlaqueMean), the samples were classified into four categories, namely normal (PlaqueMean = 0), mild (0 < PlaqueMean ≤ 6), medium (6 < PlaqueMean ≤ 12), and severe (PlaqueMean > 12) groups. For the CERAD score, two types of sample classification schemes were used. First, the samples were classified into NL (CERAD = 1), definite AD (CERAD = 2), probable AD (CERAD = 3), and possible AD (CERAD = 4). Second, samples were classified into two groups: NL when CERAD = 1, and AD when CERAD > 1. To adjust for multiple tests, the FDR was estimated using the Benjamini‐Hochberg (BH) method. 78 Genes showing at least 1.2‐fold change (FC) and FDR less than 0.05 were considered differentially expressed.
4.8. Constructing CNV‐gene‐trait correlation network and functional enrichment analysis of CNV‐centered subnetworks
CNV‐gene‐trait correlation network was constructed by combining significant CNV‐gene, CNV‐trait, and gene‐trait correlation pairs from each cohort. Five brain regions were considered (i.e., the MSBB cohort: the BM‐10, BM‐22, BM‐36, and BM‐44 regions, the ROSMAP cohort: the DLPFC region). All CNVs discovered in the two cohorts were considered while constructing the networks, including AD‐specific CNVs and non‐AD‐specific CNVs. Significant correlation pairs were used as edges to link the respective nodes (Tables S26‐S27). Then Cytoscape (v3.8) 81 was used to visualize correlation networks. In the network plots, orange squares, light‐blue circles, and purple triangles represent CNVs, genes, and traits, respectively. The intensity of edge color is proportional to the correlation coefficient, while red and blue colors represent positive and negative correlations, respectively. The red and blue labels represent up‐ and downregulated genes. The size of a node is proportional to the number of edges directly connected to the node.
All the genes directly connected with a CNV were used for pathway enrichment analysis to annotate the functions of the CNV based on Fisher's exact test 46 and MSigDB v7.4. 47 , 48
CONFLICTS OF INTEREST
Chen Ming, Minghui Wang, Qian Wang, Ryan Neff, Erming Wang, Qi Shen, Joseph S. Reddy, and Xue Wang have nothing to disclose. Bin Zhang, Mariet Allen, David A. Bennett, Vahram Haroutunian, and Eric Schadt received support for the present manuscript. Specifically, this manuscript was supported by Bin Zhang‘s NIH/NIA grants (R01AG046170, RF1AG054014, RF1AG057440, R01AG057907, U01AG052411, R01AG062355, U01AG058635, R01AG068030) and Mariet Allen's grant (U01‐AG046139) as well as NIH grants for David A. Bennett, Vahram Haroutunian, and Eric Schadt. In the past 36 months, Bin Zhang, Minghui Wang, Mariet Allen, Nilüfer Ertekin‐Taner, Philip L. De Jager, David A. Bennett, Vahram Haroutunian, and Eric Schadt received grants from NIH or foundations. Specifically, Bin Zhang received 21 grants (R01AG046170, RF1AG054014, RF1AG057440, R01AG057907, U01AG052411, R01AG062355, U01AG058635, R01AG068030, R01AG062661, R01AG062355, HHS‐NIH‐NIAID‐BAA2018, R01 MH111679, R01DA043247, R01DK118243, R01DA048279, R56AG058655, R01AG063819, R01D029322, R01DA047880, R01AG062661, R01AG060341, R21AI149013). Mariet Allen received 3 grants (U01‐AG046139, R01‐AG061796, U01‐AG046139, RF1‐AG51504). Nilüfer Ertekin‐Taner received 7 grants (U01AG046139, RF1AG051504, R01AG061796, P30AG062677, U01AG061359, NHLBI75N92019D00031/75N92019F00125, R01AG050603). Minghui Wang received one grant (1RF1AG066526‐01A1). Philip L. De Jager, David A. Bennett, Vahram Haroutunian, and Eric Schadt received NIH grants. David A. Bennett received a grant from NIH Neurovision. Eric Schadt also received grants from the Helmsley Foundation. None of the co‐authors received royalties or licenses in the past 36 months. In the past 36 months, Philip L. De Jager received consultant fees from Partech, Roche, and Biogen; David A. Bennett received consultant fees from AbbVie, DSMB, Takeda, Origent, and SBIR; Vahram Haroutunian received a consultant fee of $350 from Synaptec; and Eric Schadt is paid by Berg Pharmaceuticals for participation on their scientific advisory board. In the past 36 months, Bin Zhang received an honorarium for presentation from Lehigh University; Nilüfer Ertekin‐Taner received payments for her presentations at the 15th International Symposium on Geriatrics and Gerontology Inflammation and Dementia: Genomics, System and Therapeutics, Nagoya, Japan; Philip L. De Jager received payments from Novartis, Astra Zeneca, and Biogen for lectures/presentations; David A. Bennett received payments or honoraria from academia in US and government (NGO) for lectures/presentations. In the past 36 months, Bin Zhang received support from FNIH to attend the AMP‐AD program meeting at NIH (the payment was made to him); Minghui Wang received support from FNIH for his travel and hotel lodging for attending NIH project meetings (the payments were made to him); Mariet Allen received a travel fellowship from Alzheimer's Association International Conference for conference registration but without payments, travel reimbursement from Alzheimer's Association, and travel reimbursement from NIH (the payments were made to her); Nilüfer Ertekin‐Taner received supports for attending the following conferences: 11th ISABS Conference (Split, Croatia), the 15th International Symposium on Geriatrics and Gerontology Inflammation and Dementia: Genomics, System and Therapeutics (Nagoya, Japan), multiple NIH meetings, Department of Neurology, Indiana University School of Medicine (Bloomington, Indiana); David A. Bennett received support for attending meetings from academia in US and government (NGO). In the past 36 months, the following authors have pending patents: Bin Zhang (US2020/056080 titled “STATHMIN 2 (STMN2) as a therapeutic target for Parkinson's disease,” MS‐0029‐01‐US‐P titled “A Novel therapeutic strategy for targeting the molecular subtypes of AD,” and MS‐00‐30‐01‐US‐P titled “Novel Compounds for Treating Alzheimer's Disease”), Minghui Wang (US2020/056080 titled “STATHMIN 2 (STMN2) as a therapeutic target for Parkinson's disease”), Ryan Neff (MS‐0029‐01‐US‐P titled “A Novel therapeutic strategy for targeting the molecular subtypes of AD”). Eric Schadt has patents under consideration relating to novel drug targets and targeting mechanisms for AD, patent applications filed and under review for biomarkers relating to various forms of cancer, predicting drug response and matching to therapies. In the past 36 months, Eric Schadt was on the board of directors for Sema4, a for‐profit company, and for Sage Bionetworks and 4YouAndMe, both non‐profit research institutions; Nilüfer Ertekin‐Taner was on the external advisory board for the NIH TREAT‐AD consortium; David A. Bennett was on the external advisory board of AbbVie.
David A. Bennett received equipment, materials, drugs, medical writing, gifts, or other services from Rush philanthropy in the past 36 months. The authors declare that they have no other competing interests.
AUTHOR CONTRIBUTIONS
Bin Zhang and Eric Schadt designed the project. Chen Ming did the CNV calling and downstream bioinformatics analysis. Minghui Wang processed the raw WGS, transcriptomic, and proteomic sequencing data, and did the DEG analysis. Qian Wang participated in the correlation network analysis. Erming Wang participated in the analysis of the WGS data. Ryan Neff and Qi Shen provided complementary analyses. Joseph S. Reddy, Xue Wang, Mariet Allen, Nilüfer Ertekin‐Taner, Philip L. De Jager, David A. Bennett, and Vahram Haroutunian contributed to the data collection and quality control. Chen Ming, Bin Zhang, and Eric Schadt wrote and edited the manuscript. All authors reviewed and edited the paper. All authors read and approved the paper.
Supporting information
Supporting Information
Supporting Information
ACKNOWLEDGMENTS
This study makes use of data generated by the DECIPHER community. A full list of centers that contributed to the generation of the data is available from http://decipher.sanger.ac.uk and via e‐mail from decipher@sanger.ac.uk. Funding for the DECIPHER project was provided by the Wellcome Trust. Dr. Chen Ming would like to thank Dr. Ningyi Shao for all the inspiring discussions. More importantly, Dr. Chen Ming would like to thank her parents for their full support. This paper is to memorialize her dad, who passed away in the pandemic.
Ming C, Wang M, Wang Q, et al. Whole genome sequencing–based copy number variations reveal novel pathways and targets in Alzheimer's disease. Alzheimer's Dement. 2022;18:1846‐1867. 10.1002/alz.12507
Eric Schadt and Bin Zhang contributed equally to this article.
DATA AVAILABILITY STATEMENT
The human post mortem sequencing data are available via the AD Knowledge Portal (https://adknowledgeportal.synapse.org). The AD Knowledge Portal is a platform for accessing data, analyses, and tools generated by the Accelerating Medicines Partnership (AMP‐AD) Target Discovery Program and other National Institute on Aging (NIA)‐supported programs to enable open‐science practices and accelerate translational learning. The data, analyses, and tools are shared early in the research cycle without a publication embargo on a secondary use. Data are available for general research use according to the following requirements for data access and data attribution (https://adknowledgeportal.synapse.org/DataAccess/Instructions). The whole‐genome sequencing and matched transcriptomic data used in this study can be found at https://adknowledgeportal.synapse.org/Explore/Studies/DetailsPage?Study=syn3159438, and https://adknowledgeportal.synapse.org/Explore/Studies/DetailsPage?Study=syn3219045. The results and the tools described in this paper can be found at http://doi.org/10.7303/syn26254632.
REFERENCES
- 1. Patterson C. World Alzheimer Report 2018: The State of The Art of Dementia Research: New Frontiers. London, UK: Alzheimer's Disease International (ADI); 2018. [Google Scholar]
- 2. Cuccaro D, De Marco EV, Cittadella R, Cavallaro S. Copy number variants in Alzheimer's disease. J Alzheimer's Dis. 2017;55(1):37‐52. [DOI] [PMC free article] [PubMed] [Google Scholar]
- 3. Gatz M, Reynolds CA, Fratiglioni L, et al. Role of genes and environments for explaining Alzheimer's disease. Arch Gen Psychiat. 2006;63(2):168‐174. [DOI] [PubMed] [Google Scholar]
- 4. Bekris LM, Yu CE, Bird TD, Tsuang DW. Genetics of Alzheimer's disease. J Geriatr Psychiatry Neurol. 2010;23(4):213‐227. [DOI] [PMC free article] [PubMed] [Google Scholar]
- 5. Bertram L, Tanzi RE. The genetic epidemiology of neurodegenerative disease. J Clin Invest. 2005;115(6):1449‐1457. [DOI] [PMC free article] [PubMed] [Google Scholar]
- 6. Lambert JC, Ibrahim‐Verbaas CA, Harold D, et al. Meta‐analysis of 74,046 individuals identifies 11 new susceptibility loci for Alzheimer's disease. Nat Genet. 2013;45(12):1452‐1458. [DOI] [PMC free article] [PubMed] [Google Scholar]
- 7. Kunkle BW, Grenier‐Boley B, Sims R, et al. Genetic meta‐analysis of diagnosed Alzheimer's disease identifies new risk loci and implicates Abeta, tau, immunity and lipid processing. Nat Genet. 2019;51(3):414‐430. [DOI] [PMC free article] [PubMed] [Google Scholar]
- 8. Jansen IE, Savage JE, Watanabe K, et al. Genome‐wide meta‐analysis identifies new loci and functional pathways influencing Alzheimer's disease risk. Nat Genet. 2019;51(3):404‐413. [DOI] [PMC free article] [PubMed] [Google Scholar]
- 9. Genomes Project C, Abecasis GR, Auton A, et al. An integrated map of genetic variation from 1,092 human genomes. Nature. 2012;491(7422):56‐65. [DOI] [PMC free article] [PubMed] [Google Scholar]
- 10. Zarrei M, MacDonald JR, Merico D, Scherer SW. A copy number variation map of the human genome. Nat Rev Genet. 2015;16(3):172‐183. [DOI] [PubMed] [Google Scholar]
- 11. Pang AW, MacDonald JR, Pinto D, et al. Towards a comprehensive structural variation map of an individual human genome. Genome Biol. 2010;11(5):R52. [DOI] [PMC free article] [PubMed] [Google Scholar]
- 12. Girirajan S, Campbell CD, Eichler EE. Human copy number variation and complex genetic disease. Annu Rev Genet. 2011;45:203‐226. [DOI] [PMC free article] [PubMed] [Google Scholar]
- 13. Li W, Olivier M. Current analysis platforms and methods for detecting copy number variation. Physiol Genomics. 2013;45(1):1‐16. [DOI] [PMC free article] [PubMed] [Google Scholar]
- 14. Toft M, Ross OA. Copy number variation in Parkinson's disease. Genome Med. 2010;2(9):62. [DOI] [PMC free article] [PubMed] [Google Scholar]
- 15. Singleton AB, Farrer M, Johnson J, et al. alpha‐Synuclein locus triplication causes Parkinson's disease. Science. 2003;302(5646):841. [DOI] [PubMed] [Google Scholar]
- 16. Marshall CR, Howrigan DP, Merico D, et al. Contribution of copy number variants to schizophrenia from a genome‐wide study of 41,321 subjects. Nat Genet. 2017;49(1):27‐35. [DOI] [PMC free article] [PubMed] [Google Scholar]
- 17. Sleegers K, Brouwers N, Gijselinck I, et al. APP duplication is sufficient to cause early onset Alzheimer's dementia with cerebral amyloid angiopathy. Brain. 2006;129(Pt 11):2977‐2983. [DOI] [PubMed] [Google Scholar]
- 18. Rovelet‐Lecrux A, Hannequin D, Raux G, et al. APP locus duplication causes autosomal dominant early‐onset Alzheimer's disease with cerebral amyloid angiopathy. Nat Genet. 2006;38(1):24‐26. [DOI] [PubMed] [Google Scholar]
- 19. Cataldo AM, Petanceska S, Peterhoff CM, et al. App gene dosage modulates endosomal abnormalities of Alzheimer's disease in a segmental trisomy 16 mouse model of down syndrome. J Neurosci. 2003;23(17):6788‐6792. [DOI] [PMC free article] [PubMed] [Google Scholar]
- 20. Decourt B, Mobley W, Reiman E, Shah RJ, Sabbagh MN. Recent perspectives on APP, secretases, endosomal pathways and how they influence Alzheimer's related pathological changes in down syndrome. J Alzheimer's Dis Parkinsonism. 2013;002(7). [DOI] [PMC free article] [PubMed] [Google Scholar]
- 21. AMP‐AD Target Discovery and Preclinical Validation Data Portal. Synapse. https://adknowledgeportal.synapse.org/Explore/Programs/DetailsPage?Program=AMP‐AD
- 22. Wang M, Beckmann ND, Roussos P, et al. The Mount Sinai cohort of large‐scale genomic, transcriptomic and proteomic data in Alzheimer's disease. Sci Data. 2018;5: 180185. [DOI] [PMC free article] [PubMed] [Google Scholar]
- 23. De Jager PL, Ma Y, McCabe C, et al. A multi‐omic atlas of the human frontal cortex for aging and Alzheimer's disease research. Sci Data. 2018;5: 180142. [DOI] [PMC free article] [PubMed] [Google Scholar]
- 24. Abyzov A, Urban AE, Snyder M, Gerstein M. CNVnator: an approach to discover, genotype, and characterize typical and atypical CNVs from family and population genome sequencing. Genome Res. 2011;21(6):974‐984. [DOI] [PMC free article] [PubMed] [Google Scholar]
- 25. Ye K, Schulz MH, Long Q, Apweiler R, Ning Z. Pindel: a pattern growth approach to detect break points of large deletions and medium sized insertions from paired‐end short reads. Bioinformatics. 2009;25(21):2865‐2871. [DOI] [PMC free article] [PubMed] [Google Scholar]
- 26. Mohiyuddin M, Mu JC, Li J, et al. MetaSV: an accurate and integrative structural‐variant caller for next generation sequencing. Bioinformatics. 2015;31(16):2741‐2744. [DOI] [PMC free article] [PubMed] [Google Scholar]
- 27. Rausch T, Zichner T, Schlattl A, Stutz AM, Benes V, Korbel JO. DELLY: structural variant discovery by integrated paired‐end and split‐read analysis. Bioinformatics. 2012;28(18): i333‐i339. [DOI] [PMC free article] [PubMed] [Google Scholar]
- 28. McGeer PL, Akiyama H, Itagaki S, McGeer EG. Immune system response in Alzheimer's disease. Can J Neurol Sci. 1989;16(4):516‐527. [DOI] [PubMed] [Google Scholar]
- 29. Firth HV, Richards SM, Bevan AP, et al. DECIPHER: database of chromosomal imbalance and phenotype in humans using ensembl resources. Am J Hum Genet. 2009;84(4):524‐533. [DOI] [PMC free article] [PubMed] [Google Scholar]
- 30. MacDonald JR, Ziman R, Yuen RK, Feuk L, Scherer SW. The database of genomic variants: a curated collection of structural variation in the human genome. Nucleic Acids Res. 2014;42(Database issue):D986‐92. [DOI] [PMC free article] [PubMed] [Google Scholar]
- 31. Sudmant PH, Rausch T, Gardner EJ, et al. An integrated map of structural variation in 2,504 human genomes. Nature. 2015;526(7571):75‐81. [DOI] [PMC free article] [PubMed] [Google Scholar]
- 32. Karczewski KJ, Francioli LC, Tiao G, et al. The mutational constraint spectrum quantified from variation in 141,456 humans. Nature. 2020;581(7809):434‐443. [DOI] [PMC free article] [PubMed] [Google Scholar]
- 33. Hooli BV, Kovacs‐Vajna ZM, Mullin K, et al. Rare autosomal copy number variations in early‐onset familial Alzheimer's disease. Mol Psychiatr. 2014;19(6):676‐681. [DOI] [PubMed] [Google Scholar]
- 34. Llado A, Grau‐Rivera O, Sanchez‐Valle R, et al. Large APP locus duplication in a sporadic case of cerebral haemorrhage. Neurogenetics. 2014;15(2):145‐149. [DOI] [PubMed] [Google Scholar]
- 35. Swaminathan S, Kim S, Shen L, et al. Genomic copy number analysis in Alzheimer's disease and mild cognitive impairment: an ADNI study. Int J Alzheimer's Dis. 2011;2011. [DOI] [PMC free article] [PubMed] [Google Scholar]
- 36. Swaminathan S, Huentelman MJ, Corneveaux JJ, et al. Analysis of copy number variation in Alzheimer's disease in a cohort of clinically characterized and neuropathologically verified individuals. Plos One. 2012;7(12). [DOI] [PMC free article] [PubMed] [Google Scholar]
- 37. Ghani M, Pinto D, Lee JH, et al. Genome‐wide survey of large rare copy number variants in Alzheimer's disease among caribbean hispanics. G3‐Genes Genom Genet. 2012;2(1):71‐78. [DOI] [PMC free article] [PubMed] [Google Scholar]
- 38. Swaminathan S, Shen L, Kim S, et al. Analysis of copy number variation in Alzheimer's disease: the NIALOAD/NCRAD family study. Currt Alzheimer's Res. 2012;9(7):801‐814. [DOI] [PMC free article] [PubMed] [Google Scholar]
- 39. Rovelet‐Lecrux A, Legallic S, Wallon D, et al. A genome‐wide study reveals rare CNVs exclusive to extreme phenotypes of Alzheimer's disease. Eur J Hum Genet. 2012;20(6):613‐617. [DOI] [PMC free article] [PubMed] [Google Scholar]
- 40. Szigeti K, Lal D, Li YC, et al. Genome‐wide scan for copy number variation association with age at onset of Alzheimer's Disease. J Alzheimer's Dis. 2013;33(2):517‐523. [DOI] [PMC free article] [PubMed] [Google Scholar]
- 41. Chapman J, Rees E, Harold D, et al. A genome‐wide study shows a limited contribution of rare copy number variants to Alzheimer's disease risk. Hum Mol Genet. 2013;22(4):816‐824. [DOI] [PMC free article] [PubMed] [Google Scholar]
- 42. Li Y, Shaw CA, Sheffer I, et al. Integrated copy number and gene expression analysis detects a CREB1 association with Alzheimer's disease. Transl Psychiat. 2012;2. [DOI] [PMC free article] [PubMed] [Google Scholar]
- 43. Bird TD. Early‐Onset familial Alzheimer's disease. In: Adam MP, Ardinger HH, Pagon RA, eds. GeneReviews((R)). 1993. FOR HISTORICAL REFERENCE ONLY. [Google Scholar]
- 44. Kendall MG. A new measure of rank correlation. Biometrika. 1938;30(1/2):81‐93. [Google Scholar]
- 45. Wang M, Zhao Y, Zhang B. Efficient test and visualization of multi‐set intersections. Sci Rep. 2015;5: 16923. [DOI] [PMC free article] [PubMed] [Google Scholar]
- 46. Fisher RA. Statistical methods for research workers. Breakthroughs in Statistics. Springer; 1992:66‐70. [Google Scholar]
- 47. Liberzon A, Birger C, Thorvaldsdottir H, Ghandi M, Mesirov JP, Tamayo P. The molecular signatures database (MSigDB) hallmark gene set collection. Cell Syst. 2015;1(6):417‐425. [DOI] [PMC free article] [PubMed] [Google Scholar]
- 48. Subramanian A, Tamayo P, Mootha VK, et al. Gene set enrichment analysis: a knowledge‐based approach for interpreting genome‐wide expression profiles. Proc Natl Acad Sci U S A. 2005;102(43):15545‐15550. [DOI] [PMC free article] [PubMed] [Google Scholar]
- 49. Zhang B, Gaiteri C, Bodea LG, et al. Integrated systems approach identifies genetic nodes and networks in late‐onset Alzheimer's disease. Cell. 2013;153(3):707‐720. [DOI] [PMC free article] [PubMed] [Google Scholar]
- 50. Felsky D, Roostaei T, Nho K, et al. Neuropathological correlates and genetic architecture of microglial activation in elderly human brain. Nat Commun. 2019;10(1):409. [DOI] [PMC free article] [PubMed] [Google Scholar]
- 51. Deczkowska A, Keren‐Shaul H, Weiner A, Colonna M, Schwartz M, Amit I. Disease‐Associated microglia: a universal immune sensor of neurodegeneration. Cell. 2018;173(5):1073‐1081. [DOI] [PubMed] [Google Scholar]
- 52. Wang M, Li A, Sekiya M, et al. Transformative network modeling of multi‐omics data reveals detailed circuits, key regulators, and potential therapeutics for Alzheimer's disease. Neuron. 2021;109(2):257‐272. e14. [DOI] [PMC free article] [PubMed] [Google Scholar]
- 53. Haure‐Mirande JV, Wang M, Audrain M, et al. Integrative approach to sporadic Alzheimer's disease: deficiency of TYROBP in cerebral Abeta amyloidosis mouse normalizes clinical phenotype and complement subnetwork molecular pathology without reducing Abeta burden. Mol Psychiatry. 2019;24(3):431‐446. [DOI] [PMC free article] [PubMed] [Google Scholar]
- 54. Zou F, Chai HS, Younkin CS, et al. Brain expression genome‐wide association study (eGWAS) identifies human disease‐associated variants. PLoS Genet. 2012;8(6): e1002707. [DOI] [PMC free article] [PubMed] [Google Scholar]
- 55. Allen M, Kachadoorian M, Carrasquillo MM, et al. Late‐onset Alzheimer's disease risk variants mark brain regulatory loci. Neurol Genet. 2015;1(2): e15. [DOI] [PMC free article] [PubMed] [Google Scholar]
- 56. Lambert JC, Grenier‐Boley B, Chouraki V, et al. Implication of the immune system in Alzheimer's disease: evidence from genome‐wide pathway analysis. J Alzheimers Dis. 2010;20(4):1107‐1118. [DOI] [PubMed] [Google Scholar]
- 57. Volders PJ, Anckaert J, Verheggen K, et al. LNCipedia 5: towards a reference set of human long non‐coding RNAs. Nucleic Acids Res. 2019;47(D1): D135‐D139. [DOI] [PMC free article] [PubMed] [Google Scholar]
- 58. Jun G, Ibrahim‐Verbaas CA, Vronskaya M, et al. A novel Alzheimer's disease locus located near the gene encoding tau protein. Mol Psychiatry. 2016;21(1):108‐117. [DOI] [PMC free article] [PubMed] [Google Scholar]
- 59. Gaikwad S, Larionov S, Wang Y, et al. Signal regulatory protein‐beta1: a microglial modulator of phagocytosis in Alzheimer's disease. Am J Pathol. 2009;175(6):2528‐2539. [DOI] [PMC free article] [PubMed] [Google Scholar]
- 60. O'Leary NA, Wright MW, Brister JR, et al. Reference sequence (RefSeq) database at NCBI: current status, taxonomic expansion, and functional annotation. Nucleic Acids Res. 2016;44(D1):D733‐45. [DOI] [PMC free article] [PubMed] [Google Scholar]
- 61. Wilson RS, Arnold SE, Schneider JA, Li Y, Bennett DA. Chronic distress, age‐related neuropathology, and late‐life dementia. Psychosom Med. 2007;69(1):47‐53. [DOI] [PubMed] [Google Scholar]
- 62. Lachmann A, Torre D, Keenan AB, et al. Massive mining of publicly available RNA‐seq data from human and mouse. Nat Commun. 2018;9(1):1366. [DOI] [PMC free article] [PubMed] [Google Scholar]
- 63. Sherva R, Tripodis Y, Bennett DA, et al. Genome‐wide association study of the rate of cognitive decline in Alzheimer's disease. Alzheimers Dement. 2014;10(1):45‐52. [DOI] [PMC free article] [PubMed] [Google Scholar]
- 64. Wang M, Li A, Sekiya M, et al. Transformative network modeling of multi‐omics data reveals detailed circuits, key regulators, and potential therapeutics for Alzheimer's disease. Neuron. 2020;109(2):257‐272. [DOI] [PMC free article] [PubMed] [Google Scholar]
- 65. Hoffman GE, Schadt EE. variancePartition: interpreting drivers of variation in complex gene expression studies. journal article. BMC Bioinformatics. 2016;17(1):483. [DOI] [PMC free article] [PubMed] [Google Scholar]
- 66. Lam HY, Pan C, Clark MJ, et al. Detecting and annotating genetic variations using the HugeSeq pipeline. Nat Biotechnol. 2012;30(3):226‐229. [DOI] [PMC free article] [PubMed] [Google Scholar]
- 67. Handsaker RE, Korn JM, Nemesh J, McCarroll SA. Discovery and genotyping of genome structural polymorphism by sequencing on a population scale. Nat Genet. 2011;43(3):269‐276. [DOI] [PMC free article] [PubMed] [Google Scholar]
- 68. Yoon S, Xuan Z, Makarov V, Ye K, Sebat J. Sensitive and accurate detection of copy number variants using read depth of coverage. Genome Res. 2009;19(9):1586‐1592. [DOI] [PMC free article] [PubMed] [Google Scholar]
- 69. Campbell PJ, Stephens PJ, Pleasance ED, et al. Identification of somatically acquired rearrangements in cancer using genome‐wide massively parallel paired‐end sequencing. Nat Genetics. 2008;40(6):722. [DOI] [PMC free article] [PubMed] [Google Scholar]
- 70. Bentley DR, Balasubramanian S, Swerdlow HP, et al. Accurate whole human genome sequencing using reversible terminator chemistry. Nature. 2008;456(7218):53‐59. [DOI] [PMC free article] [PubMed] [Google Scholar]
- 71. Chiang DY, Getz G, Jaffe DB, et al. High‐resolution mapping of copy‐number alterations with massively parallel sequencing. Nat Methods. 2009;6(1):99‐103. [DOI] [PMC free article] [PubMed] [Google Scholar]
- 72. Alkan C, Kidd JM, Marques‐Bonet T, et al. Personalized copy number and segmental duplication maps using next‐generation sequencing. Nat Genet. 2009;41(10):1061‐1067. [DOI] [PMC free article] [PubMed] [Google Scholar]
- 73. Boomsma DI, Wijmenga C, Slagboom EP, et al. The Genome of the Netherlands: design, and project goals. Eur J Hum Genet. 2014;22(2):221‐227. [DOI] [PMC free article] [PubMed] [Google Scholar]
- 74. Ye K, Wang J, Jayasinghe R, et al. Systematic discovery of complex insertions and deletions in human cancers. Nat Med. 2016;22(1):97‐104. [DOI] [PMC free article] [PubMed] [Google Scholar]
- 75. Genomes Project C, Auton A, Brooks LD, et al. A global reference for human genetic variation. Nature. 2015;526(7571):68‐74. [DOI] [PMC free article] [PubMed] [Google Scholar]
- 76. Danecek P, Auton A, Abecasis G, et al. The variant call format and VCFtools. Bioinformatics. 2011;27(15):2156‐2158. [DOI] [PMC free article] [PubMed] [Google Scholar]
- 77. Team RC, R: A language and environment for statistical computing. 2021. https://www.R‐project.org/
- 78. Benjamini Y, Hochberg Y. Controlling the false discovery rate: a practical and powerful approach to multiple testing. J Royal Statis Soc: Series B (Methodological). 1995;57(1):289‐300. [Google Scholar]
- 79. McLeod A, McLeod MA, Package ‘Kendall’. 2015.
- 80. Law C, Chen Y, Shi W, Smyth G. voom: precision weights unlock linear model analysis tools for RNA‐seq read counts. Genome Biol. 2014;15(2):R29. [DOI] [PMC free article] [PubMed] [Google Scholar]
- 81. Shannon P, Markiel A, Ozier O, et al. Cytoscape: a software environment for integrated models of biomolecular interaction networks. Genome Res. 2003;13(11):2498‐2504. [DOI] [PMC free article] [PubMed] [Google Scholar]
Associated Data
This section collects any data citations, data availability statements, or supplementary materials included in this article.
Supplementary Materials
Supporting Information
Supporting Information
Data Availability Statement
The human post mortem sequencing data are available via the AD Knowledge Portal (https://adknowledgeportal.synapse.org). The AD Knowledge Portal is a platform for accessing data, analyses, and tools generated by the Accelerating Medicines Partnership (AMP‐AD) Target Discovery Program and other National Institute on Aging (NIA)‐supported programs to enable open‐science practices and accelerate translational learning. The data, analyses, and tools are shared early in the research cycle without a publication embargo on a secondary use. Data are available for general research use according to the following requirements for data access and data attribution (https://adknowledgeportal.synapse.org/DataAccess/Instructions). The whole‐genome sequencing and matched transcriptomic data used in this study can be found at https://adknowledgeportal.synapse.org/Explore/Studies/DetailsPage?Study=syn3159438, and https://adknowledgeportal.synapse.org/Explore/Studies/DetailsPage?Study=syn3219045. The results and the tools described in this paper can be found at http://doi.org/10.7303/syn26254632.