Abstract
The growth of Streptococcus bovis JB1 was initially inhibited by nisin (1 μM), and nisin caused a more than 3-log decrease in viability. However, some of the cells survived, and these nisin-resistant cells grew as rapidly as untreated ones. To see if the nisin resistance was merely a selection, nisin-sensitive cells were obtained from agar plates lacking nisin. Results indicated that virtually any nisin-sensitive cell could become nisin-resistant if the ratio of nisin to cells was not too high and the incubation period was long enough. Isolates obtained from the rumen were initially nisin sensitive, but they also developed nisin resistance. Nisin-resistant cultures remained nisin resistant even if nisin was not present, but competition studies indicated that nisin-sensitive cells could eventually displace the resistant ones if nisin was not present. Nisin-sensitive, glucose-energized cells lost virtually all of their intracellular potassium if 1 μM nisin was added, but resistant cells retained potassium even after addition of 10 μM nisin. Nisin-resistant cells were less hydrophobic and more lysozyme-resistant than nisin-sensitive cells. Because the nisin-resistant cells bound less cytochrome c, it appeared that nisin was being excluded by a net positive (i.e., less negative) charge. Nisin-resistant cells had more lipoteichoic acid than nisin-sensitive cells, and deesterified lipoteichoic acids from nisin-resistant cells migrated more slowly through a polyacrylamide gel than those from nisin-sensitive cells. These results indicated that lipoteichoic acids could be modified to increase the resistance of S. bovis to nisin. S. bovis JB1 cultures were still sensitive to monensin, tetracycline, vancomycin, and bacitracin, but ampicillin resistance was 1,000-fold greater.
Streptococcus bovis is a rapidly growing and opportunistic bacterium that is usually found at low numbers in the rumen, but its numbers can increase dramatically if cattle are switched abruptly from hay to grain diets. S. bovis produces lactate when carbohydrates are in excess, and lactate accumulation in the rumen can cause acidosis (31). Ruminal acidosis causes decreases in food intake and ruminal ulceration and founder, and it can even kill the animal (23, 31). S. bovis has also been implicated in the colon cancer of humans (9).
Since the 1970s, the feed additive monensin has been used to modify ruminal fermentations, and this antibiotic is most effective against gram-positive bacteria (28). In vitro studies have indicated that monensin can inhibit S. bovis (21), but only higher than normal doses of monensin (approximately 350 mg/animal/day) could prevent S. bovis proliferation and acute ruminal acidosis (22). Recent work has indicated that nisin and monensin have similar effects on in vitro ruminal fermentations, but the effect of nisin on S. bovis has not been described (4).
Nisin is a small peptide (34 amino acids) that forms pores in cell membranes, has “generally recognized as safe” (GRAS) status, and is approved for use as a food preservative (13, 20). Nisin is primarily active against gram-positive bacteria, but some gram-positive bacteria can become nisin resistant (2, 7, 8). The genetics of nisin resistance have been studied in some detail, but the physiology is less well understood (13). Preliminary experiments indicated that S. bovis cultures were initially nisin-sensitive, but these cultures eventually grew rapidly in the presence of nisin. The following experiments sought to monitor the resistance of S. bovis to nisin and determine the mechanism(s) of nisin resistance.
MATERIALS AND METHODS
Cell growth.
Streptococcus bovis JB1 was routinely grown under O2-free CO2 at 39°C in basal medium containing (per liter) 4 g of glucose, 292 mg of K2HPO4, 292 mg of KH2PO4, 480 mg of (NH4)2SO4, 480 mg of NaCl, 100 mg of MgSO4 · 7H2O, 64 mg of CaCl2 · 2H2O, 500 mg of cysteine hydrochloride, 1 g of Trypticase (BBL Microbiology Systems, Cockeysville, Md.), 4 g of Na2CO3, and 0.5 g of yeast extract. The medium was adjusted to pH 6.7, and the final pH was never less than 6.5. Cultures were grown in 18- by 150-mm tubes that were sealed with butyl rubber stoppers. Growth was monitored via changes in optical density (1-cm cuvette, 600 nm; Gilford 260 spectrophotometer), and the ratio of cell protein to optical density was 160 μg of protein per ml per optical density unit. Protein was determined by the method of Lowry et al. (16) using serum albumin as a standard. The growth rate was estimated from differences in the natural logarithms of optical density and time. Lag time was defined as the time before a detectable increase in optical density was observed.
Nisin and antibiotics.
Highly purified nisin was obtained from Aplin and Barrett Ltd. (Trowbridge, United Kingdom), and all other antibiotics were obtained from Sigma Chemical Co. (St. Louis, Mo.). Nisin was dissolved in 20 mM HCl. Monensin was dissolved in 95% ethanol, but the ethanol addition was always less than 2%, an amount that does not affect the growth or fermentation of S. bovis. All of the other antibiotics were dissolved in sterile water.
Potassium depletion.
S. bovis cultures were harvested anaerobically by centrifugation (4,000 × g, 10 min, 5°C in sealed tubes). The cell pellets were resuspended in basal medium that lacked ammonia, yeast extract, and Trypticase. The washed cell suspensions were incubated at 39°C, energized with glucose (20 mM) for 15 min, and treated with nisin for 10 min. The cell suspensions (1.0 ml) were centrifuged through silicone oil (0.3 ml of Dow Corning 550 and 556 fluid; Dow Corning, Midland, Mich.), and the tubes were frozen. Once the liquid above the silicone was solid, cell pellets were removed with dog nail clippers. Cell pellets were digested at room temperature for 24 h in 3 N HNO3, and insoluble cell debris was removed by centrifugation (13,000 × g, 5 min). The intracellular potassium concentration was determined by flame photometry (Cole-Parmer 2655-00 digital flame analyzer; Cole-Parmer Instrument Co., Chicago, Ill.).
Cell surface hydrophobicity.
Microbial adherence to hydrocarbons was estimated with n-hexadecane (27). Stationary-phase cultures (1.0 optical density) were washed twice in potassium phosphate buffer (pH 7.2) and resuspended in the same volume of buffer. Hexadecane (0.3 ml) was placed on top of the cell suspension (1.2 ml), and the tubes were incubated at 39°C for 10 min. The suspension was vigorously mixed for 120 s and incubated for 15 min at room temperature. Once the phases had separated, the optical density of the aqueous phase was measured.
Cytochrome c binding.
Cytochrome c binding was performed as described by Peschel et al. (24). Stationary-phase cultures were washed twice in morpholinepropanesulfonic acid (MOPS) buffer (20 mM, pH 7.0) and concentrated to approximately 7.0 optical density units (600 nm). Cell suspensions (1 ml) were incubated with cytochrome c (0.5 mg/ml, 15 min, room temperature) and harvested by centrifugation (13,000 × g, 5 min). Cytochrome c remaining in the supernatant was estimated spectrophotometrically (530 nm).
LTA extraction.
Lipoteichoic acid (LTA) was extracted from cells by using hot aqueous phenol (11, 30). Cultures (1 liter) were centrifuged (10,000 × g, 15 min, 25°C), washed in phosphate buffer (10 mM Na2HPO4 and 1 mM MgCl2 [pH 7.5]), and concentrated to approximately 0.15 g of cells/ml. The cell suspension was stirred with an equal amount of prewarmed 85% phenol (65°C, 90 min), and centrifuged (10,000 × g, 20 min, 25°C) to obtain phase separation. The water layer was removed and extracted with an equal volume of chloroform:isoamyl alcohol (24:1). The extract was centrifuged again, and the water layer was retained. The extract was further purified by treatment with RNase and DNase (50 μg/ml each, 30°C, 12 h), extracted twice with cold phenol:chloroform:ethanol (25:24:1), and dialyzed for 24 h (3,000-kDa cutoff) against 10,000 volumes of Tris buffer (10 mM Tris-HCl and 1 mM MgCl2 [pH 7.5], 4°C) to remove solvents and nucleic acid fragments. The carbohydrate content of the LTA was assayed by the anthrone method (1).
PAGE of LTAs.
Polyacrylamide gel electrophoresis (PAGE) was adapted from the method of Maurer and Mattingly (17). Slab gels (70 by 95 by 0.75 mm) were prepared with 15% acrylamide:bisacrylamide (Protogel; National Diagnostics, Atlanta, Ga.), ammonium persulfate (44 mg), and N,N,N′,N′-tetramethylethylenediamine (34 μl) in 100 ml of Tris-borate (0.2 M Tris base, 0.2 M boric acid, and 2 mM EDTA [pH 8.2]) buffer. LTA extracts (10 μl; approximately 1 μg of glucose-equivalent reactive material) mixed with a 1/5 volume of 2 M sucrose was loaded into each well, and bromophenol blue (1 mg/ml) was used as the tracking dye. Electrophoresis was performed at 80 V/cm until the tracking dye reached approximately 2 cm from the bottom of the gel. The bands were visualized by the alcian blue-silver staining of Min and Cowman (19), as described by Wolters et al. (33). LTA extracts were also treated with sodium hydroxide (0.1 M final concentration, 60°C, 1 h) to remove lipids, and these deesterified samples were subjected to PAGE as described above.
RESULTS
Growth.
S. bovis JB1 grew rapidly in a basal medium that lacked nisin, with a maximum specific growth rate of 1.68 h−1 (Fig. 1a), and stationary-phase cultures had a viable cell number of 108 cells per ml. Stationary-phase cultures that were diluted into medium containing 1 μM nisin had a viable cell number of only 104 cells per ml, but growth experiments indicated that nisin-sensitive cultures could eventually grow rapidly and without lag in the presence of nisin (Fig. 1a). When cultures that had been treated with nisin were diluted in medium containing 1 μM nisin, the viable cell number was 108 cells per ml. Nisin (1 μM) caused an initial decrease in the viability of nisin-sensitive cultures, but the viable cell number eventually increased (Fig. 1b). The optical density did not increase until the viable cell number was greater than 1%. The ability of nisin-sensitive cultures to grow and become resistant was inoculum size dependent. If the inoculum was greater than 1%, the lag time decreased. If the inoculum was 0.001% or less, growth was never observed.
FIG. 1.
The effect of nisin (1 μM) on the optical density (a) and viability (b) of S. bovis JB1 (●). The growth of untreated cultures (○) and those that had been previously treated with 1 μM nisin (▴) is also shown. The bars (b) show standard deviations (n = 3).
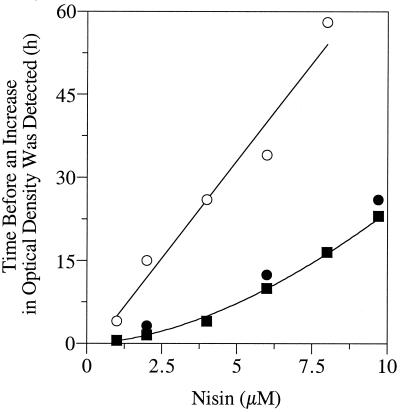
The effect of nisin on the nisin-sensitive culture was also concentration dependent. If nisin-sensitive cultures were diluted into medium containing 10 μM nisin, the viable cell number was only 101 cells per ml, and the lag time of a 1% inoculum was much longer. The lag time of nisin-sensitive cultures increased linearly as the nisin concentration was increased (Fig. 2). Nisin-resistant cultures that had been treated with 1 μM nisin also lagged if the nisin concentration was greater than 1 μM, but the lag time of the nisin-resistant cultures was less than that of nisin-sensitive ones. Nisin-resistant cultures that had been treated with 10 μM nisin had the same lag times as those treated with only 1 μM.
FIG. 2.
The effect of nisin concentration on the lag time of S. bovis JB1. Inocula had been transferred repeatedly with 0 (○), 1 (●), or 10 (■) μM nisin prior to measurements of optical density.
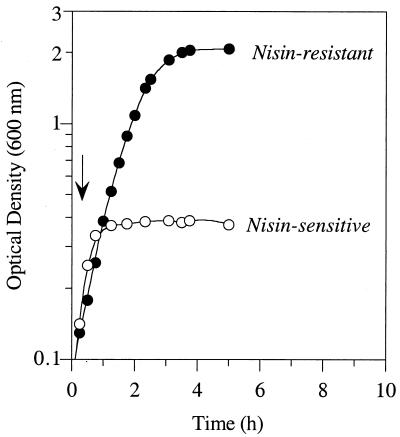
Dilution series and growth experiments indicated that the nisin-resistant cultures remained nisin resistant even if they were transferred 30 times (approximately 120 doublings) without nisin (data not shown). Sensitive cultures (never treated with nisin) obtained from isolated colonies on agar plates (no nisin) that were diluted in medium containing 1 μM nisin had a viable cell number of only 104 cells per ml, and these cultures (1% inoculum) also lagged if they were inoculated into nisin-containing broth. However, the cells eventually grew rapidly, subsequent lags in growth were not observed, and the viable cell number was always high (108 cells per ml). Nisin-sensitive cultures were sensitive to lysozyme, and growth was completely inhibited (Fig. 3). Nisin-resistant cultures were unaffected by lysozyme.
FIG. 3.
The effect of lysozyme (4 mg/ml added at the arrow) on the growth (optical density) of nisin-sensitive S. bovis JB1 cultures (○) and nisin-resistant cultures (●). The nisin-resistant cultures had been transferred repeatedly with 1 μM nisin.
Potassium depletion from washed-cell suspensions.
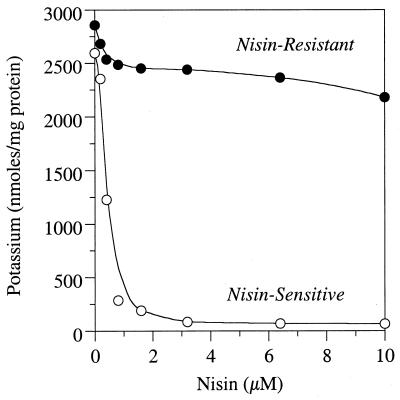
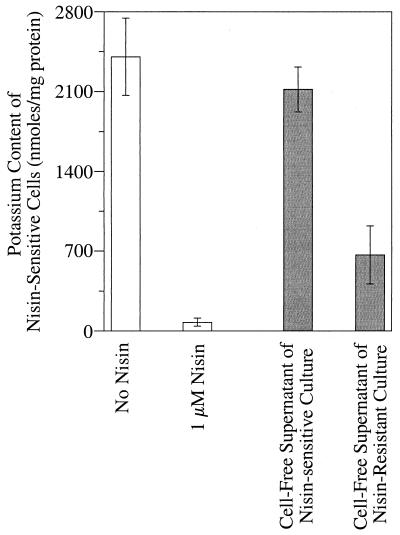
Nisin-sensitive cell suspensions that were energized with glucose had an intracellular potassium concentration of >2,500 nmol/mg of protein, but low concentrations of nisin caused almost complete potassium loss (Fig. 4). Nisin-resistant cells (previously treated with 1 μM nisin) retained intracellular potassium even if large amounts of nisin were added and even if they had been transferred repeatedly (30 times) without nisin (data not shown). When nisin-sensitive cells were added to a medium containing nisin and the cells were harvested by centrifugation, the cell-free supernatant was no longer able to cause potassium depletion from nisin-sensitive cells (Fig. 5). If nisin-resistant cells were added, the cell-free supernatant was still able to cause a large depletion of potassium from nisin-sensitive cells.
FIG. 4.
The effect of nisin on the intracellular potassium of nisin-sensitive S. bovis JB1 cells (○) and cells that had been treated with 1 μM nisin (●). The cells were washed and incubated in a buffer containing 20 mM glucose but lacking nitrogen. The experiments were repeated three times, and the coefficients of variation were always less than 10%.
FIG. 5.
The potassium content of nisin-sensitive glucose-energized cells (1 optical density unit) that had been suspended in a medium with or without 1 μM nisin (light bars). The dark bars show the potassium content of nisin-sensitive cells that were suspended in the cell-free supernatants of nisin-sensitive and nisin-resistant cells. The nisin-sensitive and -resistant cells (2.0 optical density or 320 μg of protein/ml) were added to nisin-containing medium and were harvested by centrifugation prior to the addition of nisin-sensitive cells. The resistant cells had been transferred with 1 μM nisin. The bars show standard deviations (n = 3).
Competition studies and fresh isolates.
Because nisin-resistant cells retained at least 10-fold more potassium than nisin-sensitive cells after nisin was added (Fig. 4), we were able to use potassium depletion to assess the relative abundance of nisin-resistant and -sensitive cells in a coculture that lacked nisin. If nisin-resistant and -sensitive cultures were mixed in equal parts and transferred 3 times (1% inoculum) in batch culture without nisin, the washed cells retained <250 nmol of potassium per mg of protein after 1 μM nisin was added (data not shown). Because this latter value was similar to that for nisin-sensitive cells, it appeared that this coculture contained at least 95% nisin-sensitive cells. If the coculture had nisin, the intracellular potassium concentration was greater than 2,000 nmol of potassium per mg of protein after 1 μM nisin was added.
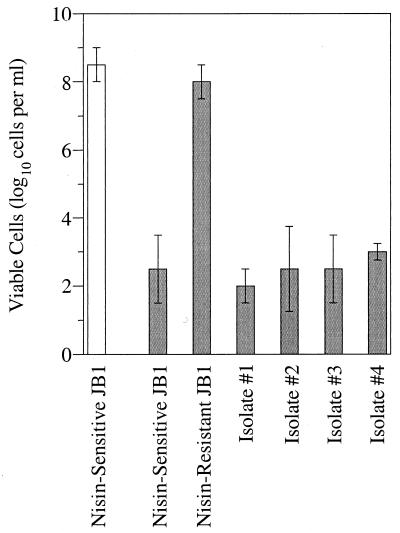
If ruminal fluid was enriched with glucose for 4 h at 39°C, streaked on agar plates, and incubated anaerobically (39°C), white and orange colonies were observed after only 18 h. Isolates arising from the orange colonies had ovoid cells, grew rapidly in basal medium that lacked nisin, and produced lactic acid as the dominant end product. The fresh isolates did not initially grow in medium that contained nisin, and the number of naturally nisin-resistant cells was <103 per ml (Fig. 6). However, fresh isolates that had been treated with sublethal doses of nisin had as many nisin-resistant cells as did nisin-resistant S. bovis JB1 cultures.
FIG. 6.
The number of S. bovis cells that were naturally resistant to nisin (shaded bars). Cultures were serially diluted (10-fold increments) into medium containing 5 μM nisin (39°C, 48 h), and the dilution tubes were scored for growth. Isolates 1 to 4 were obtained from a cow fed hay. The resistant JB1 cells had been transferred several times with 1 μM nisin. The open bar shows a control without nisin. The error bars show standard deviations (n = 2).
Antibiotic resistance.
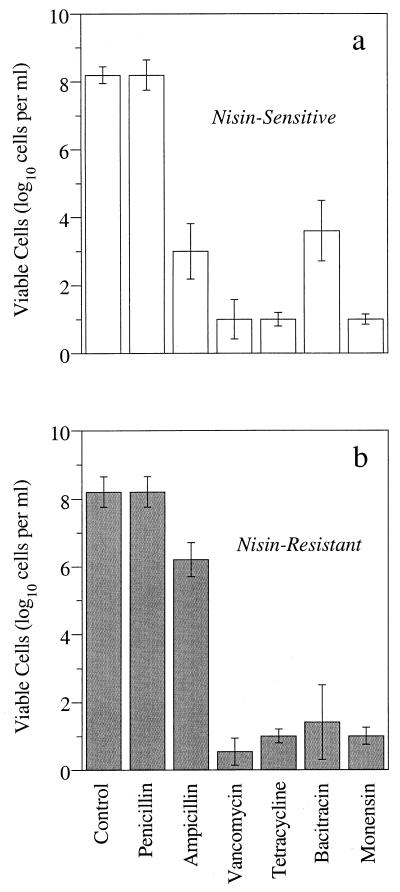
Nisin-sensitive S. bovis JB1 cultures had a large number of cells that were naturally resistant to penicillin, but the viable cell number was only 103 if a similar amount of ampicillin was present (Fig. 7). Nisin-resistant cultures had more naturally ampicillin-resistant cells than nisin-sensitive cultures, and the viability was 106 cells per ml. The nisin-resistant and -sensitive cultures had similar numbers of monensin-, vancomycin-, and tetracycline-resistant cells, but nisin-sensitive cultures had more bacitracin-resistant cells than nisin-resistant cultures.
FIG. 7.
The number of S. bovis cells that were naturally resistant to antibiotics. Nisin-sensitive (a) or nisin-resistant (b) cultures were serially diluted (10-fold increments) into medium containing penicillin (50 μg/ml), ampicillin (50 μg/ml), vancomycin (10 μg/ml), tetracycline (10 μg/ml), bacitracin (10 μg/ml), or monensin (1 μM). The dilution tubes were scored for growth after a 48-h incubation at 39°C. The resistant JB1 cells had been transferred several times with 1 μM nisin. The error bars show standard deviations (n = 3).
Hydrophobicity and charge.
When nisin-sensitive cultures were mixed with n-hexadecane, 64.1 ± 12.5% of the cells migrated into the hexadecane layer, but only 28.3 ± 8.1% of the nisin-resistant cells were hexadecane miscible (P < 0.05; n = 3). Nisin-sensitive cells bound more cytochrome c (a positively charged cation) than nisin-resistant cells (59 ± 3.1 versus 21 ± 1.1 μg of cytochrome c per mg of cell protein, respectively; P < 0.01; n = 3).
LTA.
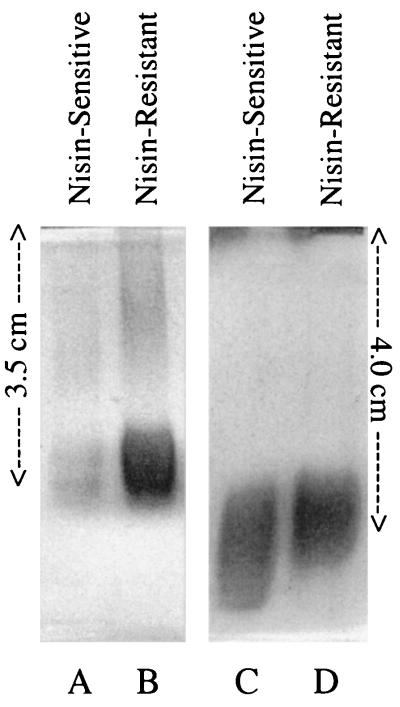
When S. bovis cells were harvested by centrifugation, washed, and treated with hot phenol, the aqueous layer of nisin-resistant cells had nearly twice as much anthrone-reactive material as nisin-sensitive cells (1.03 ± 0.12 versus 0.58 ± 0.045 mg of hexose equivalent per mg of cell protein, respectively), and this difference was apparent on polyacrylamide gels (Fig. 8A and B). When the extracts were treated with sodium hydroxide to remove lipid, the nisin-resistant deesterified LTAs migrated more slowly than those from nisin-sensitive cells (Fig. 8C and D).
FIG. 8.
Polyacrylamide gels of dialyzed lipoteichoic acids from S. bovis. Lanes A and B show extracts that were derived from nisin-sensitive and nisin-resistant cells. Lanes C and D show the same extracts, but in this case the amount of anthrone-reactive material was normalized, and the extracts were treated with sodium hydroxide to remove lipid. The gels were stained with alcian blue and silver nitrate. The gels were run for approximately 2 h, and the migration distances are shown.
DISCUSSION
Nisin is an antimicrobial agent that inhibits a variety of gram-positive bacteria (13), and it can increase the respiration rate of Escherichia coli (6). Nisin is inserted into cell membranes and forms ion-translocating pores (3, 20). The insertion of nisin is thought to be facilitated by the cell wall precursor lipid II (3). Micrococcus flavus cell membranes have a large amount of lipid II, and it is very sensitive to nisin. When artificial membranes were prepared and fused with M. flavus and E. coli vesicles, nisin sensitivity and lipid II content could be correlated (3).
Breukink et al. (3) stated that “no resistance to nisin has been reported,” but it has long been recognized that nisin-producing bacteria are not inhibited by nisin (13). Nisin-producing strains have immunity proteins that protect the cells from nisin (29), but the immunity protein expression and nisin resistance of Lactococcus lactis strains were poorly correlated (25). This latter observation indicated that immunity protein expression was not the only factor determining nisin resistance.
Non-nisin-producing bacteria that lack immunity proteins can also become nisin resistant, and, in Listeria monocytogenes, nisin resistance has been correlated with a change in membrane lipids (18). Some workers (12, 14) concluded that nisin-resistant bacilli had nisin-inactivating enzymes, but nisinases have not been thoroughly purified, cloned, or sequenced. Recent work indicated that sensitivity of Staphylococcus aureus could be increased by a change in teichoic acids, but the reverse (increased resistance) was not demonstrated (24).
Untreated S. bovis JB1 cultures were initially nisin sensitive, and even low concentrations caused a pronounced decrease in viability. However, resistant cells arose, and these nisin-resistant cells were unaffected by nisin concentrations that had previously prevented growth. Nisin-resistant cultures still lagged if the nisin concentration was very high, but cultures that had been treated with 1 μM were as resistant as those treated with 10 μM. This latter observation indicated that even low concentrations of nisin (1 μM) could select for resistant cells.
Recent work with Prevotella bryantii indicated that monensin resistance was mediated by a highly resistant subpopulation (5), and it initially appeared that the nisin resistance of S. bovis might also be a simple selection. The selection hypothesis was supported by two observations: (i) even 10 μM nisin did not kill all of the cells, and (ii) net growth (optical density) was not observed until the viability had recovered. However, nisin-sensitive colonies (taken from agar plates lacking nisin) eventually grew rapidly in the presence of 1 μM nisin. Because nisin-sensitive cells became nisin resistant, it appeared that the increase in nisin-resistant cells was not merely a selection.
When wild-type S. bovis cultures were treated with 1 μM nisin, the viability initially decreased more than 3 logs. However, the viability eventually increased, and these nisin-resistant cells retained their resistance for more than 30 transfers, even if nisin was not present. Recent work with Listeria monocytogenes indicated that nisin-resistant cells could also retain their resistance phenotype even when the bacteriocin was not present, and this resistance seemed to be mediated by a high-frequency mutation (as high as 10−4) (26). Further work is needed to determine if the nisin resistance of S. bovis is also mediated by a high-frequency mutation, but preliminary observations indicate that virtually any nisin-sensitive cell can become nisin resistant as long as the ratio of nisin to cells is not too high and the incubation period is long enough.
Optical density measurements indicated that nisin-resistant and -sensitive cells had similar growth rates, but competition experiments and potassium depletion measurements indicated that nisin-sensitive cells could outgrow nisin-resistant cells if nisin was not present. This latter result indicated that growth rate alone did not provide a relative index of fitness. It should be noted that fresh isolates from the rumen were also nisin sensitive until they were exposed to nisin in the laboratory.
When nisin-sensitive cells were added to a nisin medium and harvested by centrifugation, the cell-free supernatant did not have enough residual nisin to catalyze potassium loss from a second set of nisin-sensitive cells. However, if nisin-resistant cells were treated in a similar fashion, the cell-free supernatant still catalyzed a significant potassium loss from nisin-sensitive cells. These results indicated that the nisin-resistant cells could exclude at least some of the nisin, and the nisin resistance was not simply a degradation.
A Staphylococcus aureus mutant that was defective in d-alanine incorporation to LTA was more sensitive to nisin than wild-type cells, and it appeared that the positively charged d-alanine residue was excluding the positively charged nisin molecule (24). Experiments with S. bovis indicated that the nisin-resistant cells had an increased positive (i.e., less negative) charge than nisin-sensitive cells. Nisin-resistant cells (i) bound less cytochrome c than nisin-sensitive cells, (ii) were more lysozyme resistant, and (iii) were less hydrophobic.
Many gram-positive bacteria have LTAs that extend outward from the cell membrane through the peptidoglycan to the outside surface of the cell, and these amphiphilic molecules can have a variety of charged residues (10, 15). Nisin-resistant S. bovis cells had more LTA than nisin-sensitive cells. When the LTAs were treated with base to remove the lipids, the deesterified residues of nisin-resistant cells migrated more slowly into polyacrylamide gels. Polyacrylamide gels separate molecules according to size, but it should be noted that the anode was attached to the bottom of the gel.
Crandall and Montville (7) noted that nisin-resistant L. monocytogenes cultures were more sensitive to penicillin and ampicillin. S. bovis JB1 was already highly resistant to penicillin, but it was ampicillin sensitive. Nisin-resistant S. bovis JB1 cells were more ampicillin resistant than nisin-sensitive cells, but some decrease in viability was still observed. Nisin-resistant and nisin-sensitive JB1 cells had similar numbers of cells that were naturally resistant to tetracycline and vancomycin, but the nisin-resistant cultures had fewer cells that were naturally resistant to bacitracin. Monensin is an ion-translocating ionophore that has been routinely used to alter ruminal fermentation (28), but nisin-resistant S. bovis JB1 cultures did not have more monensin-resistant cells than did nisin-sensitive cultures.
Teather and Forster (32) hypothesized that naturally occurring ruminal bacteriocins might provide a “tool for controlled colonization as well as for population modification.” This hypothesis was based on the supposition that gram-positive, bacteriocin-sensitive ruminal bacteria were detrimental to animal nutrition, but bacteriocin resistance was not addressed. Because all of the fresh isolates became as nisin resistant as JB1, it appears that nisin resistance is a common characteristic of S. bovis. Further work is clearly needed to monitor the bacteriocin resistance of ruminal bacteria as well as their initial sensitivity.
ACKNOWLEDGMENTS
J.B.R. is a member of the U.S. Dairy Forage Research Center, Madison Wis. H.C.M. was supported by the Conselho Nacional de Desenvolvimento Científico e Tecnológico (CNPq), Brasília, Brazil.
REFERENCES
- 1.Bailey R W. The reaction of pentoses with anthrone. Biochem J. 1958;68:669–672. doi: 10.1042/bj0680669. [DOI] [PMC free article] [PubMed] [Google Scholar]
- 2.Breuer B, Radler F. Inducible resistance against nisin in Lactobacillus casei. Arch Microbiol. 1996;165:114–118. [Google Scholar]
- 3.Breukink E, Wiedemann I, van Kraaij C, Kuipers O P, Sahl H-G, de Kruijff B. Use of the cell wall precursor lipid II by a pore-forming peptide antibiotic. Science. 1999;286:2361–2364. doi: 10.1126/science.286.5448.2361. [DOI] [PubMed] [Google Scholar]
- 4.Callaway T R, Carneiro De Melo A M S, Russell J B. The effect of nisin and monensin on ruminal fermentations in vitro. Curr Microbiol. 1997;35:90–96. doi: 10.1007/s002849900218. [DOI] [PubMed] [Google Scholar]
- 5.Callaway T R, Russell J B. Selection of a highly monensin-resistant Prevotella bryantii subpopulation with altered outer membrane characteristics. Appl Environ Microbiol. 1999;65:4753–4759. doi: 10.1128/aem.65.11.4753-4759.1999. [DOI] [PMC free article] [PubMed] [Google Scholar]
- 6.Carneiro de Melo A M S, Cook G M, Miles R J, Poole R K. Nisin stimulates oxygen consumption by Staphylococcus aureus and Escherichia coli. Appl Environ Microbiol. 1996;62:1831–1834. doi: 10.1128/aem.62.5.1831-1834.1996. [DOI] [PMC free article] [PubMed] [Google Scholar]
- 7.Crandall A D, Montville T J. Nisin resistance in Listeria monocytogenes ATCC 700302 is a complex phenotype. Appl Environ Microbiol. 1998;64:231–237. doi: 10.1128/aem.64.1.231-237.1998. [DOI] [PMC free article] [PubMed] [Google Scholar]
- 8.Davies E A, Adams M R. Resistance of Listeria monocytogenes to the bacteriocin nisin. Int J Food Microbiol. 1994;21:341–347. doi: 10.1016/0168-1605(94)90064-7. [DOI] [PubMed] [Google Scholar]
- 9.Dubrow R, Edberg S, Wikfors E, Callan D, Troncale F, Vender R, Brand M, Yapp R. Fecal carriage of Streptococcus bovis and colorectal adenomas. Gastroenterology. 1991;101:721–725. doi: 10.1016/0016-5085(91)90531-o. [DOI] [PubMed] [Google Scholar]
- 10.Fischer W. Physiology of lipoteichoic acids in bacteria. Adv Microbial Physiol. 1988;29:233–302. doi: 10.1016/s0065-2911(08)60349-5. [DOI] [PubMed] [Google Scholar]
- 11.Hogg S D, Whiley R A, De Soet J J. Occurrence of lipoteichoic acid in oral streptococci. Int J Syst Bacteriol. 1997;47:62–66. doi: 10.1099/00207713-47-1-62. [DOI] [PubMed] [Google Scholar]
- 12.Hurst A. Nisin. Adv Appl Microbiol. 1981;27:85–123. [Google Scholar]
- 13.Jack R W, Tagg J R, Ray B. Bacteriocins of gram-positive bacteria. Microbiol Rev. 1995;59:171–200. doi: 10.1128/mr.59.2.171-200.1995. [DOI] [PMC free article] [PubMed] [Google Scholar]
- 14.Jarvis B. Resistance to nisin and production of nisin-inactivating enzymes by several Bacillus species. J Gen Microbiol. 1967;47:33–48. doi: 10.1099/00221287-47-1-33. [DOI] [PubMed] [Google Scholar]
- 15.Kessler R E, Wicken A J, Shockman G D. Increased carbohydrate substitution of lipoteichoic acid during inhibition of protein synthesis. J Bacteriol. 1983;155:138–144. doi: 10.1128/jb.155.1.138-144.1983. [DOI] [PMC free article] [PubMed] [Google Scholar]
- 16.Lowry O H, Rosebrough N J, Farr A L, Randall R J. Protein measurement with the Folin phenol reagent. J Biol Chem. 1951;193:265–275. [PubMed] [Google Scholar]
- 17.Maurer J J, Mattingly S J. Molecular analysis of lipoteichoic acid from Streptococcus agalactiae. J Bacteriol. 1991;173:487–494. doi: 10.1128/jb.173.2.487-494.1991. [DOI] [PMC free article] [PubMed] [Google Scholar]
- 18.Mazzotta A S, Montville T J. Nisin induces changes in membrane fatty acid composition of Listeria monocytogenes nisin-resistant strains at 10°C and 30°C. J Appl Microbiol. 1997;82:32–38. doi: 10.1111/j.1365-2672.1997.tb03294.x. [DOI] [PubMed] [Google Scholar]
- 19.Min H, Cowman M K. Combined alcian blue and silver staining of glycosaminoglycans in polyacrylamide gels: application to electrophoretic analysis of molecular weight distribution. Anal Biochem. 1986;155:275–285. doi: 10.1016/0003-2697(86)90437-9. [DOI] [PubMed] [Google Scholar]
- 20.Montville T J, Chen Y. Mechanistic action of pediocin and nisin: recent progress and unresolved questions. Appl Microbiol Biotechnol. 1998;50:511–519. doi: 10.1007/s002530051328. [DOI] [PubMed] [Google Scholar]
- 21.Muir L A, Barreto A., Jr Sensitivity of Streptococcus bovis to various antibiotics. J Anim Sci. 1979;48:468–473. doi: 10.2527/jas1979.483468x. [DOI] [PubMed] [Google Scholar]
- 22.Nagaraja T G, Avery T B, Bartley E E, Roof S K, Dayton A D. Effect of lasalocid, monensin, or thiopeptin on lactic acidosis in cattle. J Anim Sci. 1982;54:649–658. doi: 10.2527/jas1982.543649x. [DOI] [PubMed] [Google Scholar]
- 23.Owens F N, Secrist D S, Hill W J, Gill D R. The effect of grain source and grain processing on performance of feedlot cattle: a review. J Anim Sci. 1997;75:868–879. doi: 10.2527/1997.753868x. [DOI] [PubMed] [Google Scholar]
- 24.Peschel A, Otto M, Jack R W, Kalbacher H, Jung G, Gotz F. Inactivation of the dlt operon in Staphylococcus aureus confers sensitivity to defensins, protegrins and other antimicrobial peptides. J Biol Chem. 1999;274:8405–8410. doi: 10.1074/jbc.274.13.8405. [DOI] [PubMed] [Google Scholar]
- 25.Qiao M, Omaetxebarria M J, Ra R, Oruetxebarria I, Saris P E J. Isolation of a Lactococcus lactis strain with high resistance to nisin and increased nisin production. Biotechnol Lett. 1997;19:199–202. [Google Scholar]
- 26.Rekhif N, Atrih A, Lefebvre G. Selection and properties of spontaneous mutants of Listeria monocytogenes ATCC 15313 resistant to different bacteriocins produced by lactic acid bacteria strains. Curr Microbiol. 1994;28:237–241. [Google Scholar]
- 27.Rosenberg M, Gudnick D, Rosenberg E. Adherence of bacteria to hydrocarbons: a simple method for measuring cell surface hydrophobicity. FEMS Microbiol Lett. 1980;9:29–33. [Google Scholar]
- 28.Russell J B, Strobel H J. The effect of ionophores on ruminal fermentation. Appl Environ Microbiol. 1989;55:1–6. doi: 10.1128/aem.55.1.1-6.1989. [DOI] [PMC free article] [PubMed] [Google Scholar]
- 29.Saris P E J, Immonen T, Reis M, Sahl H-G. Immunity to lantibiotics. Antonie Leeuwenhoek. 1996;69:151–159. doi: 10.1007/BF00399420. [DOI] [PubMed] [Google Scholar]
- 30.Sijtsma L, Wouters J T M, Hellingwerf K J. Isolation and characterization of lipoteichoic acid, a cell envelope component involved in preventing phage adsorption, from Lactococcus lactis subsp. cremoris SK110. J Bacteriol. 1990;172:7126–7130. doi: 10.1128/jb.172.12.7126-7130.1990. [DOI] [PMC free article] [PubMed] [Google Scholar]
- 31.Slyter L L. Influence of acidosis on rumen function. J Anim Sci. 1976;43:910–929. doi: 10.2527/jas1976.434910x. [DOI] [PubMed] [Google Scholar]
- 32.Teather R M, Forster R J. Manipulating the rumen microflora with bacteriocins to improve ruminant production. Can J Anim Sci. 1998;78(Suppl.):57–69. [Google Scholar]
- 33.Wolters P J, Hildebrandt K M, Dickie J P, Anderson J S. Polymer length of teichuronic acid released from cell walls of Micrococcus luteus. J Bacteriol. 1990;172:5154–5159. doi: 10.1128/jb.172.9.5154-5159.1990. [DOI] [PMC free article] [PubMed] [Google Scholar]


