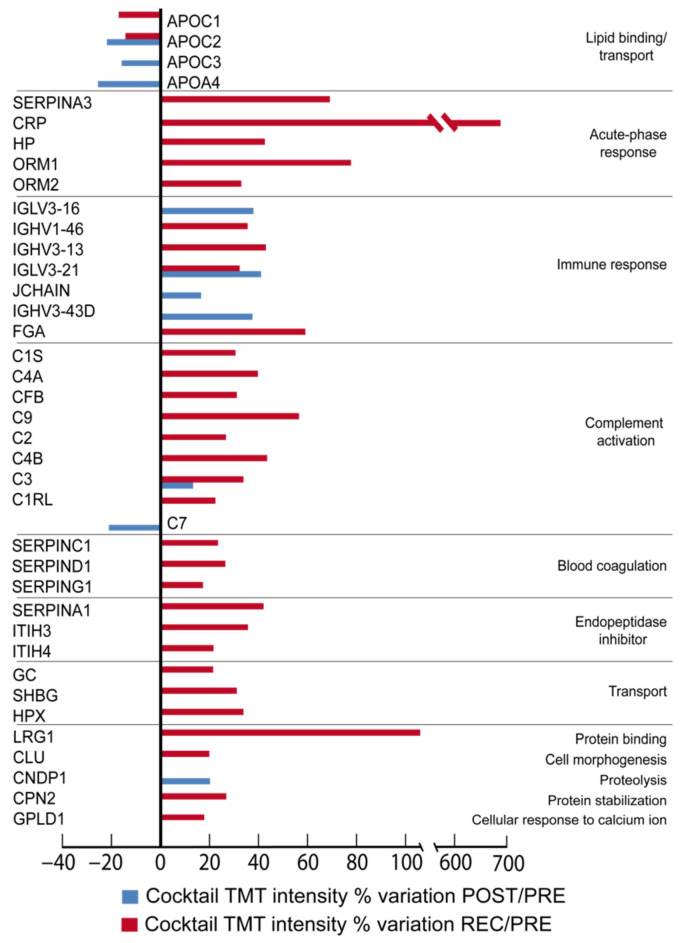
Figure 1.
TMT LC-MS/MS proteomic analysis results from sera samples of cocktail-treated BR group. Differential abundant proteins are expressed as histograms representing their intensity as a percentage of variation from PRE. Blue bars represent variation identified in the POST/PRE, while red bars are alterations identified in the REC/PRE comparison. One-way repeated measures ANOVA and Tukey’s test, n = 5, p-value < 0.05.

